Article

Energy and Sustainability Impacts of U.S. Buildings Under Future Climate Scenarios

1
Department of Design, Texas Tech University, Lubbock, TX 79409, USA
2
Huckabee College of Architecture, Texas Tech University, Lubbock, TX 79409, USA
*
Author to whom correspondence should be addressed.
Sustainability 2025, 17(13), 6179; https://doi.org/10.3390/su17136179
Submission received: 17 June 2025 / Revised: 1 July 2025 / Accepted: 2 July 2025 / Published: 5 July 2025

Abstract

Projected changes in outdoor environmental conditions are expected to significantly alter building energy demand across the United States. Yet, policymakers and designers lack typology and climate-zone-specific guidance to support long-term planning. We simulated 10 U.S. Department of Energy (DOE) prototype buildings across all 16 ASHRAE climate zones with EnergyPlus. Future weather files generated in Meteonorm from a CMIP6 ensemble reflected two emissions pathways (RCP 4.5 and RCP 8.5) and two planning horizons (2050 and 2080), producing 800 simulations. Envelope parameters and schedules were held at DOE reference values to isolate the pure climate signal. Results show that cooling energy use intensity (EUI) in very hot-humid Zones 1A–2A climbs by 12% for full-service restaurants and 21% for medium offices by 2080 under RCP 8.5, while heating EUI in sub-arctic Zone 8 falls by 14–20%. Hospitals and large hotels change by < 6%, showing resilience linked to high internal gains. A simple linear-regression meta-model (R2 > 0.90) links baseline EUI to future percentage change, enabling rapid screening of vulnerable stock without further simulation. These high-resolution maps supply actionable targets for state code updates, retrofit prioritization, and long-term decarbonization planning to support climate adaptation and sustainable development.

1. Introduction

Commercial buildings form a substantial part of global energy demand and associated greenhouse-gas emissions. In the United States, the Commercial Buildings Energy Consumption Survey (CBECS) reported site-energy use of approximately 6.8 quadrillion Btu in 2018, representing nearly 12% of national consumption [1]. Because space-conditioning requirements are tightly coupled to outdoor thermal conditions, anticipated climatic changes are expected to alter building energy profiles and, by extension, utility planning and decarbonization trajectories [2,3].
Future energy demand is commonly evaluated by forcing building-energy models with climate projections derived from the Intergovernmental Panel on Climate Change (IPCC) Representative Concentration Pathways (RCPs). Among the four canonical trajectories, RCP 4.5 (stabilization) and RCP 8.5 (high-emission baseline) are most frequently adopted because they bound the range of mitigation scenarios under active policy discussion [4,5,6]. Numerous studies employing these pathways have documented an overall increase in cooling loads and a concomitant decrease in heating loads; however, the magnitude of these shifts remains strongly dependent on building function and regional climate [7].
Current knowledge is constrained in two principal ways. First, many investigations address only one or two typically detached dwellings or medium offices—within a limited subset of climate zones [8,9]. Second, nation-wide statistical approaches, while valuable for identifying broad trends, do not resolve the envelope and systems interactions captured by physics-based models [10,11]. Consequently, the combined influence of diverse building typologies and the full spectrum of US climate variability remain insufficiently characterized. The United States spans 16 ASHRAE climate zones, yet, to date, no study has examined the 10 physics-calibrated prototypes provided by the U.S. Department of Energy (DOE) across all zones under multiple RCPs [12,13].
The objective of this study is to address that deficiency. Future weather files were generated for RCP 4.5 and RCP 8.5 and applied to EnergyPlus models representing the full DOE prototype set. Simulations were conducted for each prototype in every ASHRAE zone for the mid-century (2050) and late-century (2080) periods, producing an 800-member simulation matrix. By holding envelope properties, internal schedules, and system efficiencies constant, the analysis isolates the climatic component of future energy use intensity (EUI). The study (i) maps percentage changes in EUI, (ii) identifies building–zone combinations exhibiting heightened sensitivity to warming, and (iii) proposes a regression-based meta-model that predicts EUI variation from baseline values with explanatory power exceeding 90%. The resulting insights are intended to inform state energy-code revisions, targeted retrofit programs, and long-range decarbonization strategies.

2. Background

Understanding the influence of climate change on building energy performance has become increasingly critical as global warming intensifies. Buildings are responsible for a substantial share of global energy use, and changing temperature patterns, extreme weather events, and longer cooling seasons are expected to disrupt conventional energy demand patterns. This literature review explores two primary themes: (1) how climate change scenarios are used to model and forecast future building energy performance, and (2) the impact of building typology on energy consumption in the context of a warming environment.

2.1. Climate Change Scenarios and Building Energy Performance

Climate change scenarios serve as the basis for evaluating future energy demands in buildings, particularly through Representative Concentration Pathways (RCPs), such as RCP 4.5 and RCP 8.5 [6]. These scenarios enable researchers to simulate different emissions trajectories and assess their implications for the built environment. The research highlighted that these pathways lead to distinct energy consumption patterns, especially in heating and cooling loads, with cooling demand projected to increase significantly under higher emission scenarios [3]. To enhance the reliability of such forecasts, Hosseini, Bigtashi [14] proposed a machine learning approach to generate future weather files, while Kikumoto, Ooka [15] emphasized the importance of incorporating both global and local climate inputs into simulation models. Recent studies have underscored the shift in building energy loads under future climate conditions. Through a meta-analysis, Campagna and Fiorito [16] confirmed a consistent pattern across regions: a decline in heating demand coupled with a rise in cooling needs. Similarly, Dirks, Gorrissen [12] and Jiang, Zhu [17] illustrated that even temperate U. S. regions, such as the Southeast, will experience intensified energy demand, primarily driven by cooling systems. In Europe, Droutsa, Kontoyiannidis [18] demonstrated that non-residential buildings in Greece could see significant increases in cooling energy use, highlighting the urgency of regional adaptation strategies. This geographic specificity was echoed by Chen, Li [19] who found considerable variation in energy performance among office buildings across different Chinese climate zones.
The temporal dimension of climate change has also been explored. Pulkkinen, Louis [5] analyzed short-term, medium-term, and long-term climate effects in Finland and showed that while heating loads may decline in the near term, the long-term rise in cooling loads may offset these gains. Similarly, Troup, Eckelman [20] employed morphed climate datasets to project future office energy use, emphasizing the importance of ensemble modeling in addressing uncertainty. Urban-scale assessments by Ganem Karlen and Barea Paci [21] extended this further, integrating microclimatic variation into energy consumption modeling—a critical method for cities with diverse building typologies and urban heat islands. Comparative studies have emphasized the importance of modeling choices. For instance, Wang, Liu [13] highlighted that using two different climate models resulted in divergent forecasts for energy use in office buildings, raising questions about simulation accuracy-based decision-making. These findings collectively reinforce the value of employing robust, location-specific, and adaptive models to understand how future climate conditions will affect the performance of buildings.

2.2. Typology and Factors Influencing Energy Consumption in Buildings

Building energy consumption is shaped by a range of interdependent factors, including climate conditions, occupant behavior, mechanical systems, and—importantly—building types. The research emphasized that energy sensitivity is not uniform; instead, it varies significantly based on a building’s function, operational schedule, and regional climate [8]. The study conducted by Shibuya and Croxford [9] revealed that even within a single country, such as Japan, seasonal and geographic differences result in distinct energy consumption patterns across building types. Recent simulation-based research by Niknia and Ghiai [22] confirmed that these differences are especially pronounced in the United States, where office buildings respond uniquely to projected climate scenarios depending on their geographic location. Their analysis showed that climate zone and emissions trajectory significantly shape the energy performance outcomes of office buildings, particularly with respect to rising cooling demands under RCP 4.5 and RCP 8.5 conditions. This aligns with earlier findings that identified office buildings as especially susceptible to increased cooling demand due to their consistent daytime operations, internal heat gains, and higher occupant densities [19,20]. Educational facilities and hospitals, as noted in studies by Droutsa, Kontoyiannidis [18] and Dirks, Gorrissen [12], were also shown to face unique energy challenges because of year-round use, critical indoor air quality requirements, and the need for thermal stability to protect occupant well-being.
In contrast, residential buildings demonstrated more diverse responses to climate change depending on design and behavioral factors. The study by Pérez-Andreu, Aparicio-Fernández [23] revealed that homes in Mediterranean regions are experiencing a shift from heating-dominated to cooling-dominated energy profiles. Similarly, the research conducted by Invidiata and Ghisi [24] in Brazil emphasized that traditionally passive houses are now becoming reliant on mechanical cooling due to rising temperatures. In colder climates, the findings by Sabunas and Kanapickas [25] showed that although heating energy use may decline, cooling demand is expected to grow, particularly in summer months where buildings were not previously designed for such conditions.
Emerging typologies like net-zero energy buildings have also been examined. The study by Chai, Huang [26] indicated that these buildings, while designed to minimize lifetime energy use, may underperform under future climatic conditions if current assumptions remain unchanged. The authors highlighted that climate-responsive design must evolve alongside rising temperatures to ensure the intended energy outcomes are achieved. Aijazi and Brager [27] emphasized the importance of passive cooling methods, such as thermal mass, natural ventilation, and solar shading, in reducing future reliance on mechanical systems. The research conducted by Khourchid, Ajjur [28] supported this approach, also advocating for improved insulation and efficient HVAC systems. In hot-arid regions, the study by Kutty, Barakat [29] highlighted that locally adapted design features, such as reflective materials, appropriate orientation, and native vegetation, could play a critical role in maintaining indoor thermal comfort. On a broader scale, national-level research has confirmed the urgency of these interventions. The study by Bass and New [10] projected that U.S. commercial buildings would experience a sharp increase in energy demand, particularly for cooling, under IPCC climate scenarios. These findings aligned with those of Sabunas and Kanapickas [25], whose simulations showed a similar upward trend even in colder regions like Lithuania. Together, the research emphasized that effective climate adaptation must be both building-type specific and tailored to local environmental contexts to support sustainable, long-term energy resilience.

2.3. Synthesis: Unresolved Gaps in Scope and Method

Table 1 provides a concise summary of 27 studies exploring climate change’s impacts on building energy consumption. While previous research has made important contributions in projecting future energy use, many of these studies are limited in scope, often focusing on just a few building types or specific geographic regions. Large-scale analyses that estimate global building energy demand tend to rely on statistical models or aggregated data, rather than detailed, physics-based simulations. Within the context of the United States, most studies address only a subset of climate zones and building types, leaving important variations in regional demand and building performance unexamined. Notably, few have modeled all 16 ASHRAE climate zones [11] alongside the full range of Department of Energy prototype buildings [30].
Building on the literature’s recognition of the relationship between building typologies and climate variability, this study addresses a significant gap in large-scale, simulation-based research. We use physical energy modeling across 16 ASHRAE 90.1 U.S. climate zones and 10 representative building types to explore spatial differences in energy use. At the same time, we examine how each building type responds to varying climate conditions, providing a more refined and context-aware perspective on future energy demand in the built environment.

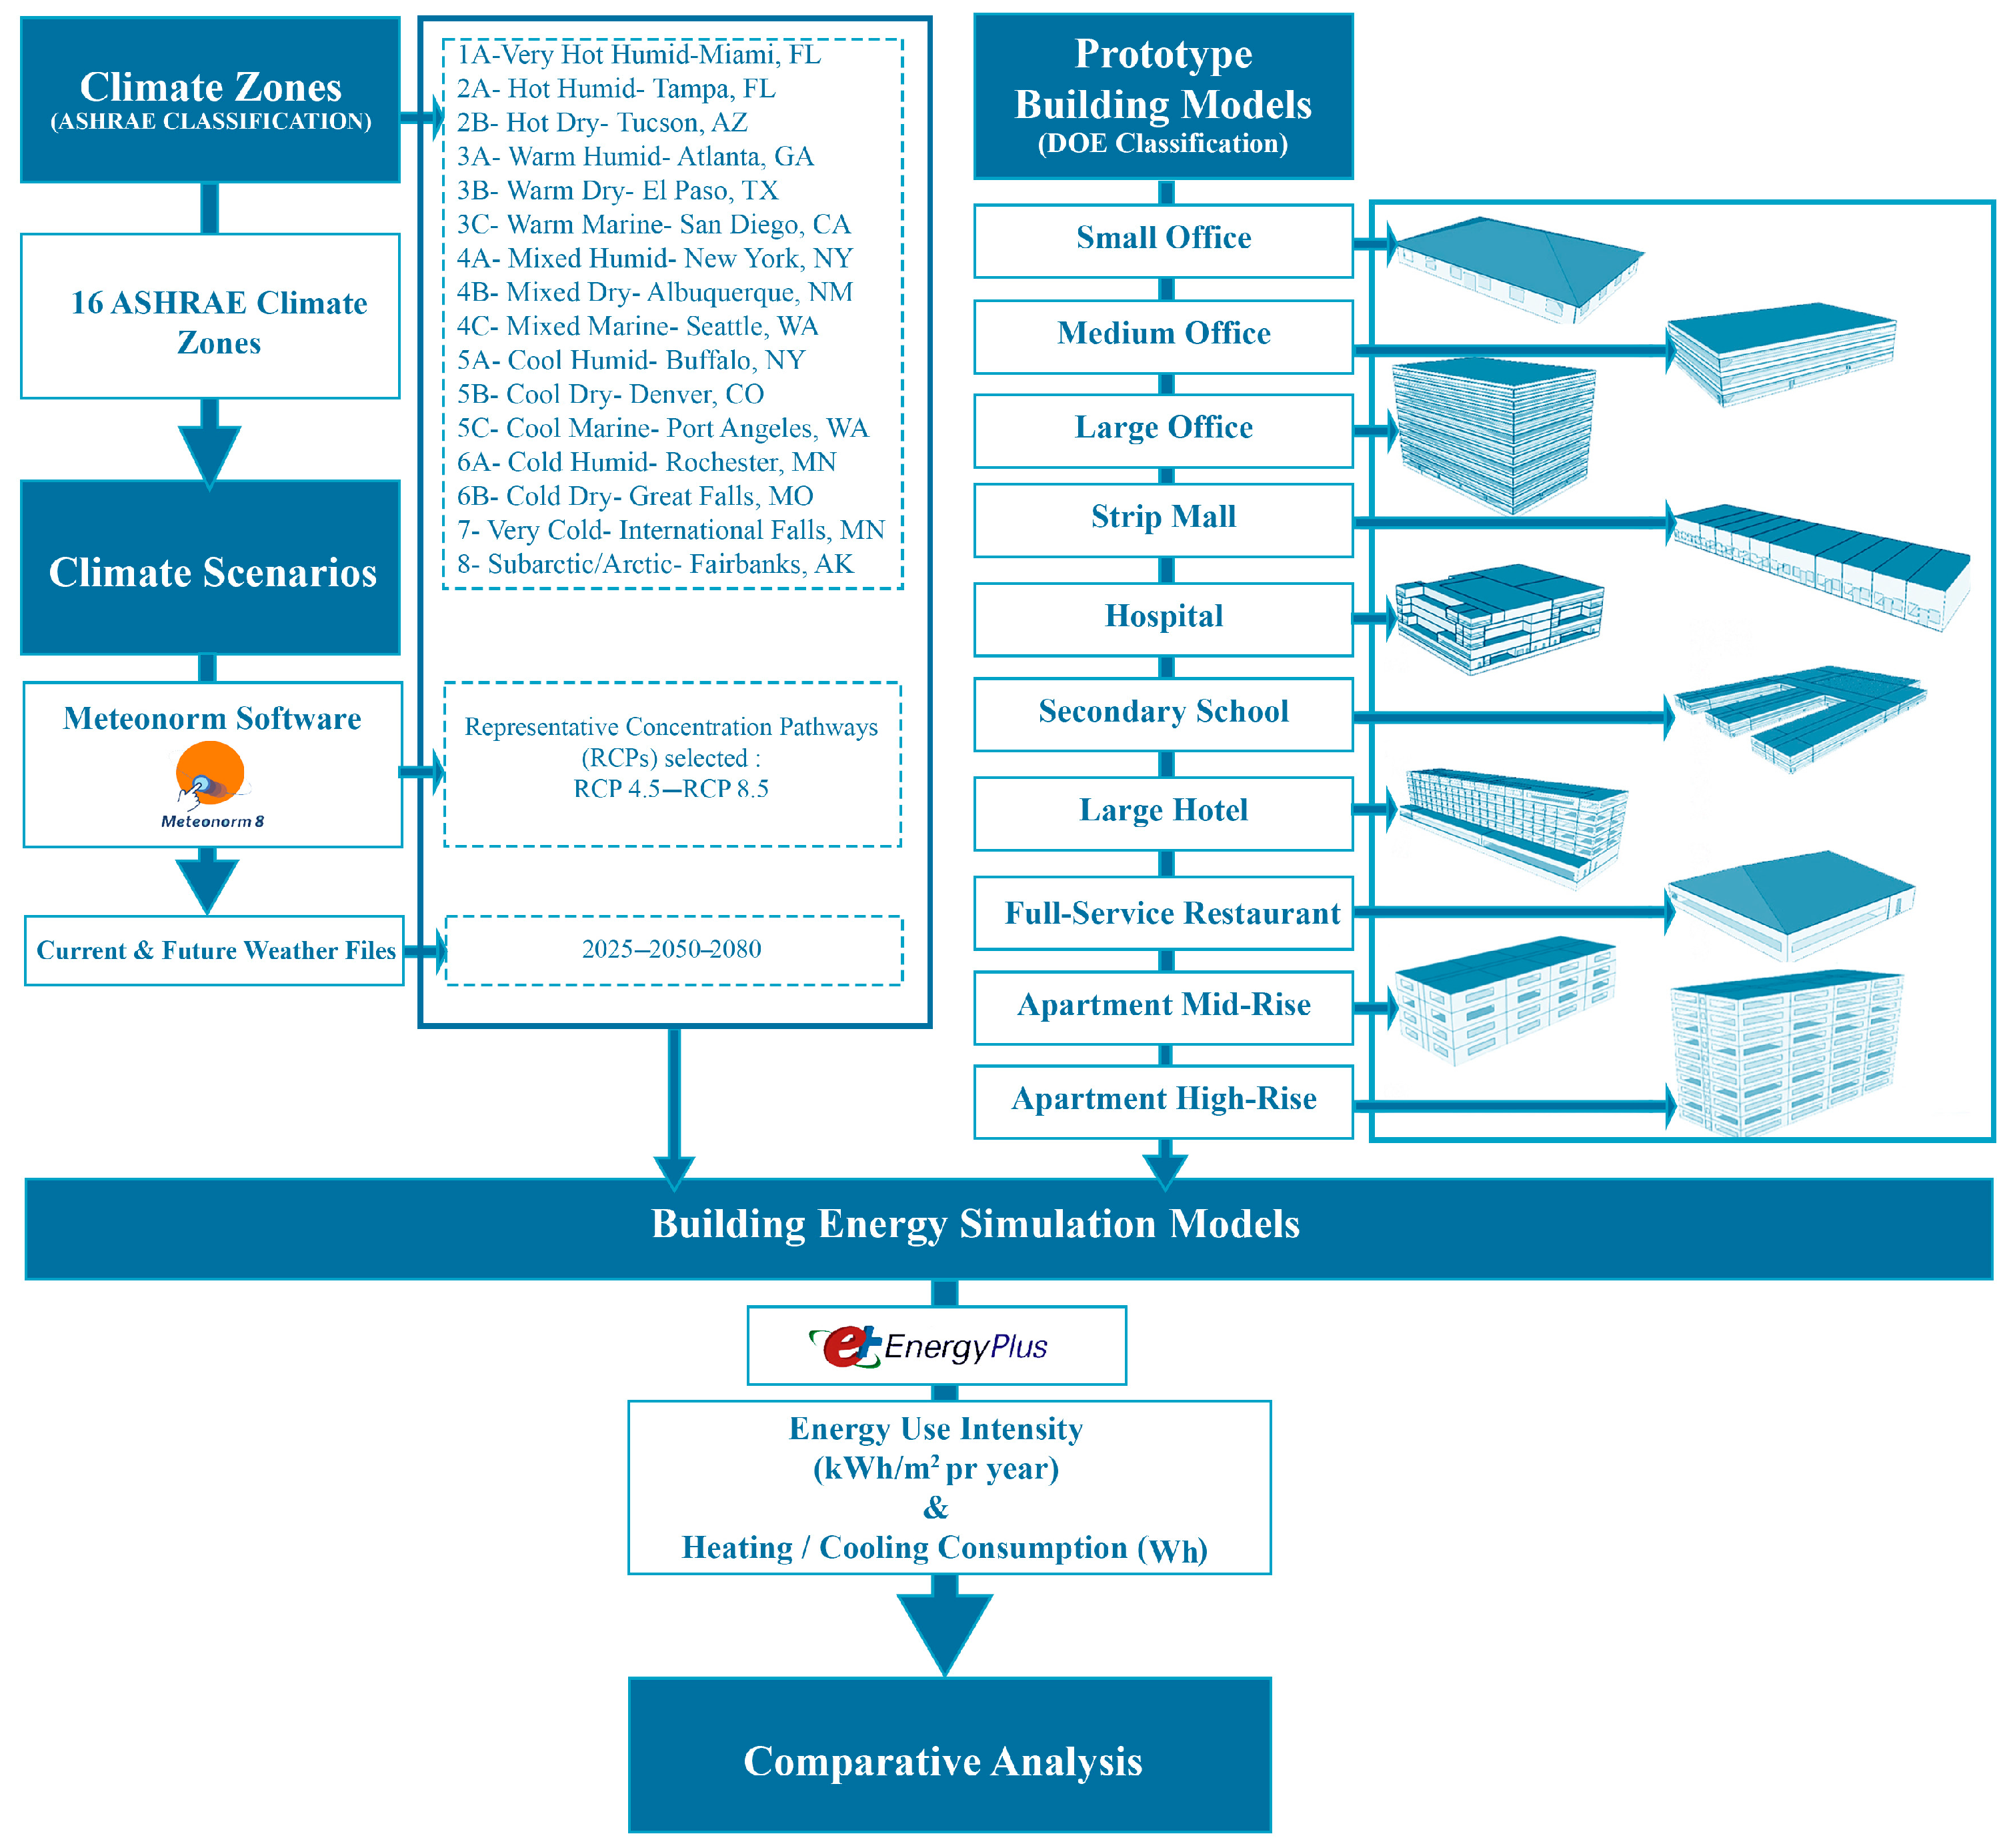
3. Materials and Methods

This study aims to evaluate the impact of climate change on building energy performance across the United States using a detailed, simulation-based approach. The methodology consists of three primary components: (1) climate scenarios and zone classification, (2) prototype building models, and (3) building energy simulations using future climate data (Figure 1). The objective is to quantify how future climates alone, with all buildings held in their present configuration, alter energy demand.

3.1. Climate Scenarios and Climate Zones (ASHRAE Classification)

This study utilizes climate projections from the Intergovernmental Panel on Climate Change (IPCC) based on Representative Concentration Pathways (RCPs) to represent future climate conditions [35]. Specifically, RCP 4.5 and RCP 8.5 are selected to reflect moderate and high greenhouse gas emission trajectories, respectively. RCP 4.5 (stabilization) and RCP 8.5 (high-emission baseline) are the two pathways most frequently referenced by U.S. agencies such as DOE and EPA to bracket near- and long-term policy choices [36]. These pathways provide a range of probable future atmospheric conditions, enabling comparative assessment of energy performance under varying climate intensities. To capture regional variability, the analysis incorporates all 16 ASHRAE climate zones, which are defined based on temperature and humidity characteristics and are widely used in building energy analysis across the U.S. [11]. Figure 2 shows zones ranging from Zone 1A (Very Hot and Humid) to Zone 8 (Subarctic), encompassing diverse geographical and climatic conditions. Incorporating this full spectrum allows for a comprehensive understanding of how building performance varies with location under changing climatic conditions [37].

3.2. Prototype Building Models (DOE Classification)

The building types used in this study are based on the Department of Energy (DOE) commercial prototype models, which represent standardized buildings commonly found across the U.S. These models are widely adopted for energy modeling and code compliance analysis [30]. Ten prototype buildings are selected to reflect a variety of typologies, including Small Office, Medium Office, Large Office, Retail Strip Mall, Hospital, Secondary School, Large Hotel, Full-Service Restaurant, Apartment Mid-rise, and Apartment High-rise. Each prototype includes detailed specifications related to geometry, construction materials, internal loads, occupancy schedules, and HVAC systems. These inputs provide simulation consistency and ensure realistic energy use profiles that reflect national construction practices.

3.3. Building Energy Simulation Model

This study utilizes a detailed, physics-based simulation approach to evaluate future building energy performance under projected climate scenarios. The simulation process involves two key components: generating future climate weather files using Meteonorm 8 and running energy performance simulations through EnergyPlus software [39]. Future weather files were created for the years 2050 and 2080 under RCP 4.5 and RCP 8.5 emissions scenarios. Meteonorm 8 synthesized typical meteorological year (TMY) data by combining historical weather data with projected climatic shifts based on global climate models to produce these files. Meteonorm’s TMY-generation algorithm was benchmarked against IWEC2 for 25 U.S. stations, showing a mean bias of ±0.3 °C, and exhibits solar-radiation accuracy comparable to WeatherShift v3 [40].Weather data generated using Meteonorm reveal distinct differences between present-day and future climate conditions in Florida under both RCP 4.5 and RCP 8.5 scenarios. In coastal cities such as Miami and Tampa, average ambient temperatures rise by approximately 2 °C to 4.5 °C by the year 2080, depending on the emissions trajectory. Humidity levels, already high in the current climate, remain elevated or increase slightly due to intensified evaporation from warmer sea surface temperatures in the Gulf of Mexico and the Atlantic Ocean. The generated datasets include hourly values for parameters such as temperature, solar radiation, humidity, and wind speed [41]. Four distinct weather files were prepared for each of the 16 ASHRAE climate zones, corresponding to each combination of year and emissions scenario. These weather files reflect realistic future climate conditions and serve as inputs for the building energy simulations. The simulation engine used for this study is EnergyPlus version 22.1.0, developed by the U.S. Department of Energy. EnergyPlus is a widely validated whole-building simulation tool that models energy flows, HVAC system operations, internal loads, and thermal behavior over sub-hourly time steps. Each building model was configured using the standardized DOE prototype inputs, which include detailed data on geometry, envelope properties, occupancy patterns, lighting, equipment, ventilation, and mechanical systems.
Simulations were conducted for each of the 10 selected DOE prototype buildings in all 16 ASHRAE climate zones, across both future timeframes and emissions scenarios. The simulation set consists of 800 runs including the 2025 baseline for each zone, representing every combination of building type, climate zone, year, and RCP pathway. EnergyPlus outputs detailed annual and monthly energy use data for each simulation, including EUI, heating and cooling loads, system-level performance, and end-use consumption. All envelopes’ properties, internal schedules, and system efficiencies were held constant across scenarios to isolate the pure climate signal.
Energy use intensity (EUI) is a widely used metric for evaluating a building’s energy performance. It quantifies the total annual energy consumption normalized by the building’s gross floor area, allowing comparisons across buildings of different sizes and types. EUI is typically expressed in thousand British thermal units per square foot per year (kBtu/ft2/yr). The annual EUI was computed as follows:
E U I = t = 1 8760 P total   t A gross  
where Ptotal(t) is the building’s total site power (kBtu·h−1) at hour t and Agross is gross floor area (ft2). Percentage change relative to baseline was reported for each simulation. A linear-regression meta-model was then fitted to explore the relationship between baseline EUI and projected percentage change.
This normalization enables stakeholders to assess and benchmark energy efficiency, making EUI essential in energy policy, certification programs, and performance tracking [42]. These results provide a comprehensive assessment of how building energy demands are likely to evolve under future climatic conditions and enable comparison across regions and building typologies. The full dataset used in this study, which includes energy simulation data for 10 distinct building typologies across all ASHRAE climate zones, along with the corresponding weather files for each zone, is available for reference and further analysis.

3.4. Uncertainty and Limitations

The analysis is subject to several constraints that should temper interpretation of the findings. First, each future-weather file represents a single typical-meteorological-year (TMY) realization; the stochastic, year-to-year variability inherent in climate projections was therefore not explored. Second, occupant behavior, equipment efficiency, and fuel-mix evolution were held constant, even though real-world adaptation or technological change could either moderate or amplify the simulated energy shifts. Third, the study did not consider electrification pathways or demand-response strategies, both of which are likely to reshape future load profiles. Collectively, these caveats mean that the results should be viewed as illustrating the climate signal embedded in building energy demand rather than providing a full socio-technical forecast.

4. Results

Dynamic EnergyPlus simulations were carried out for every ASHRAE climate zone (1–8), yielding a matrix of 800 runs including the 2025 baseline for each zone (10 DOE prototypes × 16 zones × 2 RCPs × 2 horizons). Total site Energy Use Intensity (EUI) is reported for a stabilization pathway (RCP 4.5) and for a high-emission baseline (RCP 8.5) at two planning horizons—mid-century (2050) and late-century (2080).
To make the geographic signal intelligible, the 16 zones are consolidated into four climatic bands:
  • Very Hot and Hot (1A, 2A, 2B)
  • Warm (3A, 3B, 3C)
  • Mixed (4A, 4B, 4C)
  • Cool, Cold, and Sub-Arctic (5A through 8)
This banded frame allows a side-by-side reading of how temperature increments and humidity regimes modulate future energy demand across the continental United States. Baseline EUIs and projected values for every prototype–zone pair appear in Table 2. The subsections that follow (4.1–4.4) discuss each climatic band in turn, highlighting headline percentage changes, seasonal drivers, and prototype-specific sensitivities.

4.1. Hot and Very Hot Climate Zones

Projected warming sharply accentuates cooling demand in the hottest U.S. zones, and the effect strengthens with humidity. Full-service restaurants, which have the highest EUI among prototypes due to continuous kitchen exhaust, high plug loads, dense occupancy schedules, and substantial internal gains, show an increase in energy use in Miami from 305 kBtu ft−2 yr−1 at the baseline to 328 kBtu under the stabilization pathway (RCP 4.5-2080, +7.6%) and to 341 kBtu under the high-emission pathway (RCP 8.5-2080, +11.9%). Meteonorm’s 30-year delta ensemble gives an inter-annual σ of ±2.4 % for Zone 1A, so the high-emission signal is roughly four times natural variability.
Humidity amplifies the pattern for every prototype. Medium offices rise from 29.7 → 35.0 kBtu (+18%) under RCP 4.5 and to 36.0 kBtu (+21%) under RCP 8.5, whereas the same building in hot-dry Tucson (2B) gains only 6%. Hospitals and large hotels, cushioned by 24/7 internal gains, add 5.8% in Miami yet remain essentially flat (+0.6%) in Tucson.
The load profiles (Figure 3) show that ≈ 85% of the annual increment accrues between May and October; January heating relief accounts for <2% of baseline demand. Regressing ΔEUI on baseline EUI across Miami, Tampa, and Tucson yields adjusted R2 = 0.92 under RCP 8.5, confirming that humidity, not internal-load class, dominates climate sensitivity in these zones.

4.2. Warm Climate Zones

Annual EUI responses in the three warm zones remain positive but are more muted than in Zones 1–2, and they diverge strongly with humidity regime (Figure 4). Atlanta (3A—warm-humid) amplifies the Miami pattern. Full-service restaurants rise from 304 kBtu ft−2 yr−1 at baseline to 322 kBtu under RCP 4.5-2080 (+6%) and to 333 kBtu under RCP 8.5-2080 (+9%). The coefficient of variation for this prototype across the three warm-zone cities is <3%, confirming that inter-city spread is driven by climate rather than model noise. Medium offices add ≈ 2 kBtu ft−2 yr−1 (+7%) under the high-emission pathway, while retail strip malls record a slight decline under RCP 4.5 (36.95 → 36.36), indicating that modest heating relief and efficiency gains can neutralize limited warming in the stabilization scenario. These percentage rises mirror the +8% to +11% range reported for comparable warm-humid U.S.
El Paso (3B—warm-dry) shows the strongest buffering: hospital EUI changes by less than 0.3% (89.4 → 89.7 kBtu), and small-office growth stays below 5%. Even so, high-intensity prototypes continue upward; full-service restaurants gain 7% under RCP 8.5, and high-rise apartments add 6%, confirming that scale and internal gains can override the dry-climate dampening effect.
San Diego (3C—warm-marine) posts the smallest absolute increases but reveals latent sensitivity in light-gain buildings. Secondary-school EUI climbs from 30.1 kBtu to 35.2 kBtu under RCP 8.5-2080 (+17%); that increment would require an additional ≈ 70–90 W m−2 of peak cooling capacity in a standard classroom HVAC design. Full-service restaurants again dominate absolute demand, reaching 274 kBtu by 2080, although their percentage growth (+5%) remains modest relative to Atlanta.
Yearly profiles (Figure 4) indicate that 60–80% of annual EUI growth accrues between May and September in Atlanta and San Diego, whereas El Paso’s peak rise is confined to July–August. Inter-annual standard deviations derived from the 30-year delta series are ±1.8% (Atlanta), ±1.2% (El Paso), and ±1.4% (San Diego); the +17% secondary-school increase in San Diego thus exceeds natural variability by an order of magnitude.

4.3. Mixed Climate Zones

The mixed-climate band shows the widest spread of directional responses because winter heating relief and summer cooling penalties are of comparable magnitude (Figure 5). New York (4A—mixed-humid) balances the two effects. Full-service restaurants decline from 321 kBtu ft−2 yr−1 at baseline to 310 kBtu under RCP 4.5-2080 (–3.4%) and to 307 kBtu under RCP 8.5-2080 (–4.3%). The decrease exceeds the ±1.3% inter-annual standard deviation of the delta-weather ensemble, confirming a genuine climate signal. By contrast, secondary schools and large offices gain 6–8% under the high-emission pathway, indicating that lightly loaded occupancies remain sensitive to even modest summer warming.
Albuquerque (4B—mixed-dry) records the steepest rise in this band. Medium-office EUI increases from 25.4 kBtu to 26.6 kBtu under RCP 4.5-2080 (+5%) and to 27.5 kBtu under RCP 8.5-2080 (+8%). Apartment high-rises follow a similar trajectory (41.8 → 44.9 kBtu, +7%), reflecting intensifying cooling loads as mean dry-bulb temperature climbs by +3.6 °C in the high-emission scenario. These increments align with the +6% to +9% range reported for Southwest U.S. cities by Huang & Gurney [8]. The +8% rise in medium offices corresponds to ≈12 W m−2 additional peak-cooling capacity—information directly relevant to HVAC sizing.
Seattle (4C—mixed-marine) remains effectively climate-neutral. All prototypes change by <±1% in both pathways; apartment high-rise EUI shifts only from 39.56 kBtu to 39.58 kBtu in RCP 8.5-2080. This negligible response mirrors the <% variations documented for other West-Coast marine cities by Reyna et al. [11]. Small declines in retail strip malls and restaurants (≈–2%) suggest that marine buffering offsets cooling growth and that observed reductions are more likely tied to assumed efficiency improvements than to climatic pressure.
Figure 5 clarifies the mechanism in mixed climate zones. In New York, January–March heating relief averages −10 kBtu ft−2 yr−1, while July–August cooling adds +9 kBtu, yielding the small net change; in Albuquerque, the cooling increment exceeds heating relief by 6 kBtu, driving the positive annual delta; Seattle shows near-zero swings in both seasons. Across all prototypes, the RCP 8.5 signal is ≈1.6 × stronger than RCP 4.5, underscoring the mitigation leverage available in mixed climates.

4.4. Cool Climate Zones (5A-Cool Humid-Buffalo, NY/5C-Cool Marine-Port Angeles, WA/6A-Cold Humid-Rochester, MN/6B-Cold Dry-Great Falls, MO/7-Very Cold-International Falls, MN/8-Subarctic/Arctic-Fairbanks, AK)

Future warming reverses the sign of annual EUI in most northern cities because heating relief outweighs the emerging cooling penalty (Figure 6). The magnitude of the reduction scales with baseline winter severity: Fairbanks gains the most, Port Angeles the least, and transition-zone cities such as Buffalo and Denver sit in between.
Fairbanks (8—sub-arctic). Full-service restaurants fall from 506 kBtu/ft2 per year at baseline to 465 kBtu under RCP 4.5-2080 (–8%) and to 435 kBtu under RCP 8.5-2080 (–14%). The ±2.2% inter-annual σ for the delta-weather ensemble confirms that this –14% signal exceeds natural variability by a factor of six. Apartment high-rises drop 11% (60.6 → 53.6 kBtu).
International Falls (7—very-cold) shows similar relief: small offices decline 10% under RCP 8.5, mirroring the –9% to –12% range reported for IECC Zone 7 stock by Bass & New [10].
Great Falls and Rochester (6B/6A—cold-dry/cold-humid). Heating savings dominate but are partly offset by nascent cooling loads. Large-hotel EUI in Rochester slips only 1% (175 → 173 kBtu), and secondary-school demand is flat in Great Falls (+0.4%), illustrating the approach of a crossover where cooling begins to erode the heating dividend.
Denver and Buffalo (5B/5A—cool-dry/cool-humid). Strip-mall EUI in Denver turns slightly positive by late-century (+3% under RCP 8.5) even as restaurants still decline 6%. That +3% translates to an extra ≈ 14 W m−2 summer peak; electrification of heating will therefore need to be paired with demand-response to avoid shifting the seasonal peak from winter to summer. Buffalo shows a similarly mixed picture, with schools down 5% but large hotels up 2%. This crossover implies a potential summer-peak shift in grid demand and heat-pump sizing for Zones 5A–6A.
Port Angeles (5C—cool-marine) remains effectively climate-neutral: all prototypes stay within ±1% across both pathways, corroborating the marine resilience noted by Reyna et al. [11] for the Pacific Northwest.
Across Zones 5–8, the inter-prototype coefficient of variation in ΔEUI is 6.4%, indicating that the climate signal dwarfs use-type spread in cold bands. The RCP 8.5 response is roughly 1.8 times stronger than RCP 4.5, delivering up to –23% heating relief in Fairbanks but only –4% in Buffalo—underscoring both the mitigation leverage in northern regions and the risk of cooling-driven reversals in transitional climates.
For HVAC planning, the –14% restaurant drop in Fairbanks equates to ≈30 W m−2 less peak heating capacity—an opportunity designers can exploit during boiler replacement cycles.

4.5. Summary of Key Findings

The 800-run simulation matrix yields three systematic regularities. (i) Magnitude scales with climate band. By 2080, the median ΔEUI equals +11% in Very-Hot and Hot zones, +7% in Warm zones, is statistically neutral (−1% to +1%) in Mixed zones, and reaches −9% in Cool-to-Sub-Arctic zones. (ii) Scenario strength multiplies the response. Across all zones and prototypes, late-century RCP 8.5 values are, on average, 1.8 times the RCP 4.5 values; the factor peaks at 2.0 in hot-humid climates and falls to 1.2 in marine climates. (iii) Prototype moderates, but does not reverse, the climate signal. Full-service restaurants span the widest range—from +13% in Zone 1A to −14% in Zone 8—whereas hospitals and large hotels remain within ±6% owing to continuous internal gains.
Seasonal analysis shows that 60–85% of positive annual deltas accrue between May and September, while more than 90% of negative deltas in Zones 6–8 occur during January–March heating relief. Transition cities such as Buffalo and Denver already exhibit cooling-driven increases in high-gain prototypes, whereas marine locations remain effectively neutral. These aggregate metrics establish the context for the design and policy discussion that follows. To quantify how much these shifts are shaped by climate versus building type, Table 3 partitions the ΔEUI variance across all 800 runs: climate zone explains 71%, building type 24%, and residual interactions just 5%.

5. Discussion

This research draws insights into how different building types and regional climates will respond to future environmental changes. The datasets reflect modeled values for various commercial and multifamily residential buildings, analyzed in both hot and cold climates to assess climate resilience, vulnerability, and the need for targeted energy-saving strategies.

5.1. Variations in Energy Use Across Building Types

Small Offices demonstrate the highest sensitivity to climate change, particularly in colder zones such as Fairbanks and International Falls, where energy use declines by more than 5 kBtu/ft2 by 2080 under the RCP 8.5 scenario due to substantial reductions in heating demand. In contrast, these buildings show modest energy increases in hot climates like Miami, primarily driven by elevated cooling loads. Their compact size, lightweight mechanical systems, and limited thermal mass make them highly responsive to ambient temperature shifts. Medium Offices follow similar regional patterns, though their energy-use changes are more moderate, as internal heat gains and improved insulation help buffer against climatic extremes. Large Offices consistently exhibit the highest absolute energy use among office typologies and the least sensitivity to climate variation (Figure 7). For example, in Fairbanks, EUI drops only slightly—from 54.29 to 51.72 kBtu/ft2—while in hot-dry zones such as Tucson, energy use rises steadily above 56 kBtu/ft2, driven by increased cooling demand. The scale, complexity, and continuous internal loads of these buildings reduce their responsiveness to warming trends. Collectively, these patterns suggest that Small Offices stand to gain the most from heating energy relief in colder regions, Medium Offices will experience moderate energy shifts, and Large Offices are likely to face rising energy demands across most climates—underscoring the importance of building-type-specific adaptation strategies.
Large Hotels exhibit a consistent upward trajectory in energy use across nearly all climate zones, particularly under the RCP 8.5 scenario. In hot-humid regions such as Miami and Tampa, projected EUIs exceed 91 and 87 kBtu/ft2, respectively, by 2080. Even in colder climates like Fairbanks, energy use remains high, declining only from 90.21 to 82.59 kBtu/ft2, primarily due to reduced heating loads. Cold-humid zones such as Rochester and Great Falls show slight declines or stabilization, likely reflecting a balancing effect between lower heating needs and rising cooling demands. In contrast, Apartment Mid-Rise buildings demonstrate greater sensitivity to climate change. While hot regions like Miami and Tucson show modest EUI increases of 4–5 kBtu/ft2, colder zones such as Fairbanks, International Falls, and Rochester exhibit consistent declines under both RCP scenarios—most notably in Fairbanks, where EUI drops from 55.95 to 48.83 kBtu/ft2 by 2080. These reductions suggest that mid-rise multifamily structures are well-positioned to benefit from warming trends due to lower heating loads and relatively modest internal gains. Apartment High-Rise buildings occupy an intermediate position, with increased energy use in warmer zones (e.g., Miami, Tampa, San Diego) and modest declines or stabilization in colder areas. For example, EUI in Fairbanks decreases from 60.55 to 53.57 kBtu/ft2, while International Falls sees a reduction of about 5 kBtu/ft2. However, these reductions are generally smaller than those observed in Mid-Rises, reflecting the more stable internal heat loads and mechanical dependencies in larger multifamily buildings (Figure 8). These distinctions reinforce the importance of tailoring energy adaptation strategies by both building type and geographic location—prioritizing cooling system upgrades for hotels and high-rises in warmer climates, while emphasizing heating system optimization in colder regions for mid-rise residential buildings.
Retail Strip Malls exhibit contrasting energy-use trends across climate zones. In hot-humid areas such as Miami, Tampa, and Tucson, energy use rises steadily, with Miami projected to reach nearly 50 kBtu/ft2 by 2080 under RCP 8.5—an increase from the current 41.46 kBtu/ft2—primarily driven by intensified cooling demand. In contrast, colder regions experience substantial reductions. For example, Fairbanks shows a decline from 73.18 to 60.99 kBtu/ft2, reflecting a drop of over 12 kBtu/ft2 under RCP 8.5. Similarly, northeastern zones such as New York and Buffalo also display downward trends, indicating that reductions in heating demand outweigh cooling increases in these climates. Full-Service Restaurants consistently record the highest energy use intensities of all building types, exceeding 300 kBtu/ft2 in most regions. In hot zones like Miami and Tampa, energy use continues to climb, with Miami projected to surpass 341 kBtu/ft2 by 2080 under RCP 8.5. In colder climates such as Fairbanks and International Falls, which currently show extremely high EUIs (505.78 and 433.51 kBtu/ft2, respectively), notable reductions are observed under both scenarios by 2080. Fairbanks declines to 434.8 kBtu/ft2 and International Falls to 379.11, largely due to decreased heating requirements. However, restaurants remain the most energy-intensive buildings overall, primarily due to high internal gains, ventilation demands, and 24-hour operations. These patterns suggest that while retail buildings may benefit from passive energy relief in colder climates, restaurants continue to require targeted efficiency interventions across all zones. Prioritizing high-intensity spaces—particularly kitchens and ventilation systems—in restaurants, along with passive design strategies and HVAC upgrades in retail buildings, especially in warmer regions, will be essential for effective energy adaptation (Figure 9).
Hospitals exhibit the highest and most consistent energy use across all building types except restaurants and the smallest coefficient of variation across climate zones, largely due to their 24/7 operations, intensive equipment loads, and stringent indoor environmental requirements. Unlike other typologies, hospitals display relatively limited sensitivity to climate change across both RCP scenarios and all climate zones. This muted response is attributed to their inherently high baseline energy demands, which tend to overshadow fluctuations driven by external temperature changes. Nonetheless, even modest percentage shifts in energy use can result in substantial absolute changes due to hospitals’ large floor areas and continuous occupancy (Figure 10). These findings highlight the critical importance of investing in high-efficiency HVAC systems, enhanced thermal envelopes, and climate-adaptive infrastructure to bolster operational resilience and contain energy costs in a warm climate.
Secondary Schools display a moderate yet consistent increase in energy use across most climate zones, primarily driven by rising cooling demands under projected warming scenarios. This trend reflects the operational characteristics of school buildings, which typically feature low internal heat gains and are occupied mainly during daytime hours, making them more directly responsive to changes in ambient temperature (Figure 11). As a result, schools—particularly those in southern and hot-humid zones—are well-positioned to benefit from passive design enhancements, such as improved natural ventilation, solar shading, and daylighting strategies. Coupled with targeted HVAC system upgrades, these interventions can help mitigate future energy burdens and improve indoor environmental quality for educational spaces.

5.2. Influence of Emission Scenarios on Future Energy Demand

The comparative assessment of projected energy use intensity (EUI) under RCP 4.5 and RCP 8.5 highlights the significant influence of greenhouse gas emissions trajectories on the future energy performance of buildings across U.S. climate zones. The results reveal a clear and intensifying pattern: as emissions rise and persist over time, so too does the energy required to maintain thermal comfort—particularly in warm and hot regions. While both scenarios anticipate increased cooling loads driven by rising ambient temperatures, RCP 8.5 results in a considerably steeper escalation in EUI, especially by the end of the century.
In the near-term horizon of 2050, differences between the two scenarios are noticeable but still moderate. Across most climate zones, EUI increases under RCP 4.5 remain relatively contained, typically ranging between 2% and 7%, depending on the building type. Under RCP 8.5, however, energy demand already rises more sharply, with buildings in southern and coastal zones—such as Miami (1A), Tampa (2A), and Tucson (2B)—showing EUI increases approaching or exceeding 10% (Figure 12). This early divergence suggests that even modest delays in emissions mitigation could result in disproportionately higher operational energy burdens within just a few decades.
By 2080, the gap between scenarios becomes more pronounced, with EUI under RCP 8.5 surpassing RCP 4.5 values across nearly all building types and climate zones—often by a factor of two or more. In hot and mixed-humid climates (Zones 1A, 2B, 3A, and 4A), buildings such as Full-Service Restaurants, Medium Offices, and Retail Strip Malls exhibit acute vulnerability, with projected energy increases exceeding 15% under RCP 8.5. These typologies, typically characterized by high internal gains and persistent cooling demands, have limited potential for passive thermal resilience and remain heavily reliant on mechanical systems.
In colder climate zones (e.g., 6A, 7, and 8), the energy-use trajectory is more complex. Under RCP 4.5, many of these regions show a net reduction in EUI by mid-century, driven by lower heating demand. However, this trend begins to reverse under RCP 8.5 by 2080, as rising temperatures introduce significant cooling requirements even in historically heating-dominated regions. For example, cities such as Rochester, MN (Zone 6A), and Fairbanks, AK (Zone 8), experience emergent cooling loads that fundamentally reshape their building energy profiles (Figure 13). This reversal illustrates a broader paradigm shift: thermal priorities that once centered on heating will increasingly give way to the need for cooling infrastructure, underscoring the long-term consequences of high-emissions pathways on building operations and adaptation planning.

5.3. Regional Climate Effects on Building Energy Performance

Building energy performance exhibits strong regional variation in response to projected climate change, revealing distinct patterns between cold and warm climate zones. Cold and very cold regions—including Zones 6A (Rochester), 6B (Great Falls), 7 (International Falls), and 8 (Fairbanks)—demonstrate the largest decreases in energy use intensity (EUI), primarily due to significant reductions in heating demand, which currently dominates energy consumption in these areas. For instance, Full-Service Restaurants in Fairbanks show a dramatic EUI decline of more than 70 kBtu/ft2 by 2080 under RCP 8.5. Even smaller and less mechanically complex structures, such as Small Offices, follow similar trajectories, benefiting from reduced thermal demand during extended heating seasons. In contrast, warm and hot-humid zones, including Tampa (2A), Atlanta (3A), and New York (4A)—either maintain stable or show increasing EUI values, particularly under RCP 8.5, as rising cooling loads offset minor reductions in heating demand. For example, Small Office EUI in Tampa increases from 26.38 to 28.6 kBtu/ft2, while Full-Service Restaurants rise from 298.31 to 329.18 kBtu/ft2 by 2080. These outcomes indicate that southern and coastal zones will require the most aggressive mitigation strategies, including advanced envelope designs, high-efficiency HVAC systems, and broader integration of passive cooling techniques to counteract future thermal loads. This analysis reinforces that the interaction of building typology, emissions trajectory, and regional climate dynamics will shape energy use patterns in a non-uniform way. Full-Service Restaurants emerge as particularly climate-sensitive due to their intensive cooling and ventilation demands. RCP 8.5 consistently drives the most substantial increases in energy use, particularly in hot-humid zones, underscoring the urgency for proactive policy and design interventions. Meanwhile, cold and subarctic climates may passively benefit from warming trends, but capturing these gains will depend on deliberate investments in envelope performance, system optimization, and adaptive policy measures.

5.4. Design and Policy Implications

The simulation results point to several actionable implications for designers, policymakers, and code officials working toward climate-adaptive building strategies. In hot and warm climate zones (Zones 1–3), buildings are projected to exceed current ASHRAE 90.1 performance benchmarks for cooling-related energy use. As shown in Figure 10, EUI in Full-Service Restaurants, Offices, and Outpatient Facilities located in Tampa, Atlanta, and El Paso increases by up to 15% under the RCP 8.5 scenario. These findings emphasize the need for enhanced envelope insulation, high-performance glazing, external shading systems, and revised HVAC efficiency to address future cooling demands effectively.
The results highlight the importance of embedding energy analysis into the initial phases of architectural design. Even minor adjustments to building layout, spatial zoning, or facade design significantly influence energy performance, underscoring the necessity for designers to use data-driven feedback throughout design phases. These insights also hold considerable value for public policy, highlighting specific building types and climates sensitive to future climatic conditions. Policymakers can leverage these results to develop targeted performance-based building codes, incentives, and regulatory guidelines, particularly for regions vulnerable to climate impacts.
In colder climate zones (Zones 6–8), the observed reduction in heating demand opens opportunities for system downsizing and improved operational efficiency. For example, Medium Offices in Rochester and Large Offices in Minneapolis show meaningful heating load reductions (Figure 8), suggesting that existing boiler systems can be replaced with smaller or more efficient alternatives, including heat pump technologies. Healthcare-related facilities, such as clinics and hospitals in these regions, can also benefit from electrified heating systems that align with both decarbonization goals and reduced peak demand profiles.
Furthermore, the proposed meta-model demonstrates significant potential as a decision-support tool, enabling rapid evaluation of energy resilience across broader building portfolios or urban scales. By providing quick estimates of energy intensity variations from limited parameters, planners and designers gain a scalable framework to assess climate vulnerability effectively. Additionally, future studies should explore evolving energy demands driven by increased teleworking, changing occupancy patterns, and improved device efficiencies, as these social and technological trends are likely to substantially influence residential energy consumption patterns. Another critical insight involves the shift in peak energy demand across temperate regions. In traditionally winter-peaking cities like Buffalo and Denver (Zones 5A–5B), the simulations indicate a potential seasonal peak inversion. As shown in Figure 13, cooling energy demand may surpass heating loads by 2080, especially in buildings undergoing electrification. This shift underscores the importance of planning for distributed energy resources (DER), implementing thermal storage technologies, and coordinating demand-response strategies to manage emerging summer peaks and maintain grid stability.
Finally, the regression-based meta-model introduced in this study offers a practical decision-support tool. By using only a handful of climate and building parameters—primarily heating and cooling degree days and building type—the model accurately estimates ΔEUI across scenarios. This approach supports rapid, scalable screening of building stock, enabling local governments and energy planners to identify high-impact retrofit targets, even in data-scarce or resource-limited jurisdictions.
To translate these simulation insights into actionable guidance, Table 4 summarizes adaptation priorities by ASHRAE climate zone and building typology. This matrix offers design professionals and policymakers a concise reference for targeting energy interventions.
These zone-specific adaptation strategies align with broader efforts to support decarbonization and resilience in the built environment. By linking detailed simulation outputs to practical policy and design guidance, this study offers both a predictive and prescriptive framework for addressing energy transitions across diverse U.S. climates.

5.5. Limitations and Future Research

Several limitations must be acknowledged. First, for each climate zone, the study relies on single TMY3 future weather files, which do not reflect year-to-year climate variability or extreme events (e.g., heat waves, polar vortices). Ensemble weather files or stochastic sampling could yield more robust estimates of likely performance ranges.
Second, we assume static occupant behavior, plug loads, and equipment efficiency, which may not reflect future conditions. For instance, adoption of smart thermostats, passive cooling strategies, or increased telework could shift energy baselines in ways that either amplify or dampen projected changes.
Third, our study does not model electrification pathways or demand-side flexibility—critical factors in understanding grid impacts and decarbonization trade-offs. Integrating EnergyPlus outputs with hourly marginal carbon factors or grid simulation tools would allow evaluation of climate-driven energy demand in the context of emissions and cost.
Future research should expand the model in four directions:
  • Monte Carlo analysis of climate uncertainty and occupancy variation;
  • Electrification scenarios with decarbonizing grids;
  • Passive design interventions such as natural ventilation and dynamic shading;
  • Carbon outcome modeling linking energy shifts to emissions profiles by region and grid mix.
In addition to these simulation-based directions, future work should also explore integrating machine learning techniques and real-world energy data to enhance the flexibility and accuracy of the meta-model. Such a hybrid approach can enable dynamic model calibration, improve transferability across building vintages, and support the development of interactive dashboards for climate-sensitive design and policy planning. For example, Du et al. [43] demonstrated a hybrid ML framework linking climate scenarios to office-building energy use for rapid scenario analysis and decision-making [44].

6. Conclusions

This study provides a comprehensive simulation-based assessment of how projected climate change—under RCP 4.5 and RCP 8.5 scenarios—will impact the energy use intensity (EUI) of 10 U.S. Department of Energy (DOE) prototype building types across 16 ASHRAE climate zones. Using standardized building assumptions and CMIP6-based weather projections, the analysis isolates the effect of climate alone on future building performance in 2050 and 2080.
Results reveal significant variations in energy outcomes by building typology, emissions scenario, and geographic region. Cold and very cold zones (Zones 6–8) experience substantial energy savings due to reduced heating demand, particularly in heating-dominated building types such as Small Offices and Full-Service Restaurants. Conversely, hot and mixed-humid zones (Zones 1A–4A) see notable increases in cooling-driven EUI—especially in energy-intensive buildings like Large Hotels and Hospitals—posing challenges for future grid demand and resilience.
The impact of emissions trajectory is especially pronounced. While EUI changes under RCP 4.5 are modest by mid-century, RCP 8.5 leads to sharper increases by 2080, particularly in southern and coastal regions. These findings emphasize the value of emissions mitigation policies to limit long-term operational energy burdens.
A key contribution of this work is the development of a climate-based linear meta-model, enabling rapid prediction of ΔEUI based on heating and cooling degree days and ASHRAE climate zone classifications. This approach supports scalable retrofit screening and planning, especially for resource-constrained municipalities.
The implications of this study are both practical and urgent. Adaptation strategies should be geographically targeted, focusing on cooling system upgrades, envelope improvements, and passive design in warmer climates, while capturing heating relief opportunities in colder regions. Policymakers and code developers must also anticipate shifting thermal loads and peak demand profiles, particularly under high-emissions futures.
Future work could expand this framework by integrating grid decarbonization trajectories, occupant behavior, and load flexibility strategies. Nonetheless, this study offers a robust and replicable methodology to inform climate-resilient design and building policy across diverse U.S. climates.

Author Contributions

Conceptualization, M.G.; methodology, M.G.; software, S.N.; validation, M.G. and S.N.; formal analysis, M.G.; writing—original draft preparation, M.G. and S.N.; writing—review and editing, M.G.; visualization, S.N.; supervision, M.G. All authors have read and agreed to the published version of the manuscript.

Funding

This research received no external funding.

Institutional Review Board Statement

Not applicable.

Informed Consent Statement

Not applicable.

Data Availability Statement

The raw data supporting the conclusions of this article will be made available by the authors on request.

Conflicts of Interest

The authors declare no conflict of interest.

References

  1. U.S. Energy Information Administration. Commercial Buildings Energy Consumption Survey. 2018. Available online: https://www.eia.gov/consumption/commercial/ (accessed on 12 April 2025).
  2. Amonkar, Y.; Doss-Gollin, J.; Farnham, D.J.; Modi, V.; Lall, U. Differential effects of climate change on average and peak demand for heating and cooling across the contiguous USA. Commun. Earth Environ. 2023, 4, 402. [Google Scholar] [CrossRef]
  3. Zhai, Z.J.; Helman, J.M. Implications of climate changes to building energy and design. Sustain. Cities Soc. 2019, 44, 511–519. [Google Scholar] [CrossRef]
  4. Apostolopoulou, A.; Jimenez-Bescos, C.; Cavazzi, S.; Boyd, D. Impact of Climate Change on the Heating Demand of Buildings. A District Level Approach. Environ. Clim. Technol. 2023, 27, 900–911. [Google Scholar]
  5. Pulkkinen, J.; Louis, J.-N.; Debusschere, V.; Pongrácz, E. Near-, medium-and long-term impacts of climate change on the thermal energy consumption of buildings in Finland under RCP climate scenarios. Energy 2024, 302, 131636. [Google Scholar] [CrossRef]
  6. De Masi, R.F.; Gigante, A.; Ruggiero, S.; Russo, A. Impacts of the 4.5 and 8.5 RCP global climate scenarios on nearly zero energy building performance: Sensitivity analysis about operative conditions of insulation materials and PV system degradation. Sci. Technol. Built Environ. 2024, 30, 1236–1255. [Google Scholar] [CrossRef]
  7. Khourchid, A.M.; Al-Ansari, T.A.; Al-Ghamdi, S.G. Cooling energy and climate change nexus in arid climate and the role of energy transition. Buildings 2023, 13, 836. [Google Scholar] [CrossRef]
  8. Huang, J.; Gurney, K.R. The variation of climate change impact on building energy consumption to building type and spatiotemporal scale. Energy 2016, 111, 137–153. [Google Scholar] [CrossRef]
  9. Shibuya, T.; Croxford, B. The effect of climate change on office building energy consumption in Japan. Energy Build. 2016, 117, 149–159. [Google Scholar] [CrossRef]
  10. Bass, B.; New, J. How will United States commercial building energy use be impacted by IPCC climate scenarios? Energy 2023, 263, 125945. [Google Scholar] [CrossRef]
  11. Reyna, J.; Wilson, E.; Parker, A.; Satre-Meloy, A.; Egerter, A.; Bianchi, C.; Praprost, M.; Speake, A.; Liu, L.; Horsey, R.; et al. Us Building Stock Characterization Study: A National Typology for Decarbonizing Us Buildings; National Renewable Energy Lab. (NREL): Golden, CO, USA, 2022.
  12. Dirks, J.A.; Gorrissen, W.J.; Hathaway, J.H.; Skorski, D.C.; Scott, M.J.; Pulsipher, T.C.; Huang, M.; Liu, Y.; Rice, J.S. Impacts of climate change on energy consumption and peak demand in buildings: A detailed regional approach. Energy 2015, 79, 20–32. [Google Scholar] [CrossRef]
  13. Wang, L.; Liu, X.; Brown, H. Prediction of the impacts of climate change on energy consumption for a medium-size office building with two climate models. Energy Build. 2017, 157, 218–226. [Google Scholar] [CrossRef]
  14. Hosseini, M.; Bigtashi, A.; Lee, B. Generating future weather files under climate change scenarios to support building energy simulation–A machine learning approach. Energy Build. 2021, 230, 110543. [Google Scholar] [CrossRef]
  15. Kikumoto, H.; Ooka, R.; Arima, Y.; Yamanaka, T. Study on the future weather data considering the global and local climate change for building energy simulation. Sustain. Cities Soc. 2015, 14, 404–413. [Google Scholar] [CrossRef]
  16. Campagna, L.M.; Fiorito, F. On the impact of climate change on building energy consumptions: A meta-analysis. Energies 2022, 15, 354. [Google Scholar] [CrossRef]
  17. Jiang, A.; Zhu, Y.; Elsafty, A.; Tumeo, M. Effects of global climate change on building energy consumption and its implications in Florida. Int. J. Constr. Educ. Res. 2018, 14, 22–45. [Google Scholar] [CrossRef]
  18. Droutsa, K.G.; Kontoyiannidis, S.; Balaras, C.A.; Argiriou, A.A.; Dascalaki, E.G.; Varotsos, K.V.; Giannakopoulos, C. Climate change scenarios and their implications on the energy performance of hellenic non-residential buildings. Sustainability 2021, 13, 13005. [Google Scholar] [CrossRef]
  19. Chen, Y.; Li, M.; Xiong, M.; Cao, J.; Li, J. Future Climate Change on Energy Consumption of Office Buildings in Different Climate Zones of China. Pol. J. Environ. Stud. 2018, 27, 45–53. [Google Scholar] [CrossRef]
  20. Troup, L.; Eckelman, M.J.; Fannon, D. Simulating future energy consumption in office buildings using an ensemble of morphed climate data. Appl. Energy 2019, 255, 113821. [Google Scholar] [CrossRef]
  21. Ganem Karlen, C.; Paci, G.J.B. A methodology for assessing the impact of climate change on building energy consumption. In Urban Microclimate Modelling for Comfort and Energy Studies; Springer: Berlin/Heidelberg, Germany, 2021; pp. 363–381. [Google Scholar]
  22. Niknia, S.; Ghiai, M. Simulation-Based Prediction of Office Buildings Energy Performance Under RCP Scenarios Across All US Climate Zones. Architecture 2025, 5, 34. [Google Scholar] [CrossRef]
  23. Pérez-Andreu, V.; Aparicio-Fernández, C.; Martínez-Ibernón, A.; Vivancos, J.-L. Impact of climate change on heating and cooling energy demand in a residential building in a Mediterranean climate. Energy 2018, 165, 63–74. [Google Scholar] [CrossRef]
  24. Invidiata, A.; Ghisi, E. Impact of climate change on heating and cooling energy demand in houses in Brazil. Energy Build. 2016, 130, 20–32. [Google Scholar] [CrossRef]
  25. Sabunas, A.; Kanapickas, A. Estimation of climate change impact on energy consumption in a residential building in Kaunas, Lithuania, using HEED Software. Energy Procedia 2017, 128, 92–99. [Google Scholar] [CrossRef]
  26. Chai, J.; Huang, P.; Sun, Y. Investigations of climate change impacts on net-zero energy building lifecycle performance in typical Chinese climate regions. Energy 2019, 185, 176–189. [Google Scholar] [CrossRef]
  27. Aijazi, A.; Brager, G. Understanding climate change impacts on building energy use. ASHRAE J. 2018, 60, 24–32. [Google Scholar]
  28. Khourchid, A.M.; Ajjur, S.B.; Al-Ghamdi, S.G. Building cooling requirements under climate change scenarios: Impact, mitigation strategies, and future directions. Buildings 2022, 12, 1519. [Google Scholar] [CrossRef]
  29. Kutty, N.A.; Barakat, D.; Darsaleh, A.O.; Kim, Y.K. A systematic review of climate change implications on building energy consumption: Impacts and adaptation measures in hot urban desert climates. Buildings 2023, 14, 13. [Google Scholar] [CrossRef]
  30. U.S. Department of Energy (DOE). DOE Reference Commercial Buildings Report; Prototype Building Model Package. 2020. Available online: https://www.energy.gov/eere/buildings/commercial-reference-buildings (accessed on 3 April 2024).
  31. Chen, Y.; Ren, Z.; Peng, Z.; Yang, J.; Chen, Z.; Deng, Z. Impacts of climate change and building energy efficiency improvement on city-scale building energy consumption. J. Build. Eng. 2023, 78, 107646. [Google Scholar] [CrossRef]
  32. Zhai, Z.J.; Helman, J.M. Climate change: Projections and implications to building energy use. Build. Simul. 2019, 16, 585–596. [Google Scholar] [CrossRef]
  33. Yuan, J.; Jiao, Z.; Xiao, X.; Emura, K.; Farnham, C. Impact of future climate change on energy consumption in residential buildings: A case study for representative cities in Japan. Energy Rep. 2024, 11, 1675–1692. [Google Scholar] [CrossRef]
  34. Andrić, I.; Pina, A.; Ferrão, P.; Fournier, J.; Lacarrière, B.; Le Corre, O. The impact of climate change on building heat demand in different climate types. Energy Build. 2017, 149, 225–234. [Google Scholar] [CrossRef]
  35. Calvin, K.; Dasgupta, D.; Krinner, G.; Mukherji, A.; Thorne, P.W.; Trisos, C.; Romero, J.; Aldunce, P.; Barret, K.; Blanco, G.; et al. IPCC, 2023: Climate Change 2023: Synthesis Report, Summary for Policymakers. Contribution of Working Groups I, II and III to the Sixth Assessment Report of the Intergovernmental Panel on Climate Change; Core Writing Team, Lee, H., Romero, J., Eds.; IPCC: Geneva, Switzerland, 2023; pp. 1–34. [Google Scholar]
  36. U.S. Environmental Protection Agency. 2024–2027 Climate Adaptation Plan. 2024. Available online: https://www.epa.gov/climate-adaptation/climate-adaptation-plans (accessed on 30 June 2025).
  37. Athalye, R.; Halverson, M.; Rosenberg, M.; Liu, B.; Zhang, J.; Hart, R.; Mendon, V.; Goel, S.; Chen, Y.; Xie, Y.; et al. Energy Savings Analysis: ANSI/ASHRAE/IES Standard 90.1-2016; Pacific Northwest National Lab. (PNNL): Richland, WA, USA, 2017.
  38. U.S. Department of Energy. Climate Zone Map from IECC 2021. 2021 International Energy Conservation Code (IECC) 2021. Available online: https://basc.pnnl.gov/images/climate-zone-map-iecc-2021 (accessed on 30 June 2025).
  39. Meteotest. Meteonorm Software. 2023. Available online: https://meteonorm.com/en/ (accessed on 22 September 2023).
  40. P. Tootkaboni, M.; Ballarini, I.; Zinzi, M.; Corrado, V. A comparative analysis of different future weather data for building energy performance simulation. Climate 2021, 9, 37. [Google Scholar] [CrossRef]
  41. D’AGostino, D.; Congedo, P.M.; Albanese, P.M.; Rubino, A.; Baglivo, C. Impact of climate change on the energy performance of building envelopes and implications on energy regulations across Europe. Energy 2024, 288, 129886. [Google Scholar] [CrossRef]
  42. EnergyStar®. ENERGY STAR Portfolio Manager Technical Reference: Energy Use Intensity (EUI). 2021. Available online: https://www.energystar.gov/buildings/benchmark/understand-metrics/what-eui (accessed on 1 May 2025).
  43. Du, Z.; Chen, K.; Chen, S.; He, J.; Zhu, X.; Jin, X. Deep learning GAN-based data generation and fault diagnosis in the data center HVAC system. Energy Build. 2023, 289, 113072. [Google Scholar] [CrossRef]
  44. Piras, G.; Muzi, F.; Ziran, Z. Open tool for automated development of renewable energy communities: Artificial intelligence and machine learning techniques for methodological approach. Energies 2024, 17, 5726. [Google Scholar] [CrossRef]
Figure 1. Research Map (Authors 2025).
Sustainability 17 06179 g001
Figure 2. IECC 2021 Climate Zone Map (Pacific Northwest National Laboratory, U.S. Department of Energy, 2021) [38].
Sustainability 17 06179 g002
Figure 3. Building Type—Energy Use Intensity for Miami, FL/Tampa, FL/Tucson, AZ.
Sustainability 17 06179 g003
Figure 4. Building Type—Energy Use Intensity for Atlanta, GA/El Paso, TX/San Diego, CA.
Sustainability 17 06179 g004
Figure 5. Building Type—Energy Use Intensity for New York, NY/Albuquerque, NM/Seattle, WA.
Sustainability 17 06179 g005
Figure 6. Building Type—Energy Use Intensity for Buffalo, NY/Port Angeles, WA/Rochester, MN/Great Falls, MO/International Falls, MN/Fairbanks, AK.
Sustainability 17 06179 g006
Figure 7. Office Building Type—Energy Use Intensity for all Climate Zones.
Sustainability 17 06179 g007
Figure 8. Hotel and Residential Building Type—Energy Use Intensity for all Climate Zones.
Sustainability 17 06179 g008
Figure 9. Mall and Restaurant Building Type—Energy Use Intensity for all Climate Zones.
Sustainability 17 06179 g009
Figure 10. Hospital Building Type—Energy Use Intensity for all Climate Zones.
Sustainability 17 06179 g010
Figure 11. Secondary School Building Type—Energy Use Intensity for all Climate Zones.
Sustainability 17 06179 g011
Figure 12. EUI % change from current to 2050 and 2080 for RCP 4.5 for all climate zones and Building Types.
Sustainability 17 06179 g012
Figure 13. EUI % change from current to 2050 and 2080 for RCP 8.5 for all climate zones and Building Types.
Sustainability 17 06179 g013
Table 1. Summary of Literature for Climate Change Scenarios and Energy Consumption in Buildings.
ArticleMethodologyRegionBuilding TypeSoftware/Tools Used
Chen et al., 2023 [31]City-scale simulationChina, Mixed climatesUrban/residential buildingsIES-VE/CityBES
Huang & Gurney, 2016 [8]Spatiotemporal statistical analysisUSA, Multiple zonesMultiple building types (residential, commercial)Statistical GIS tools
Zhai & Helman, 2019 [32]Scenario modeling and projectionsUSA (7 Climate Zones)Mixed-use buildingsEnergyPlus
Campagna & Fiorito, 2022 [16]Meta-analysisGlobalVariousVarious (meta-analysis)
Zhai & Helman, 2019 [3]Scenario-based simulationUSA (7 Climate Zones)Design-stage buildingsEnergyPlus/DOE tools
Droutsa et al., 2021 [18]Energy modeling under RCPsGreece, MediterraneanNon-residentialTEE KENAK
Yuan et al., 2024 [33]SimulationJapan, Multiple zonesResidential buildingsEnergyPlus
Hosseini et al., 2021 [14]Machine learning for weather filesUSA (Multiple)Mixed-use buildingsCustom ML model
Dirks et al., 2015 [12]Regional simulationUSA (Multiple)Residential and commercialPNNL modeling tools
Jiang et al., 2018 [17]Simulation analysisUSA, Florida (Humid Subtropical)Mixed-use buildingseQuest/EnergyPlus
Khourchid et al., 2022 [28]Review with mitigation strategiesMiddle EastCooling-intensive buildingsReview-based (no specific software)
Ganem Karlen & Barea Paci, 2021 [21]Urban microclimate modelingNot specifiedUrban areasENVI(version 3.1)-met/Urban Weather Generator
Pérez-Andreu et al., 2018 [23]SimulationSpain, MediterraneanResidentialEnergyPlus
Pulkkinen et al., 2024 [5]RCP scenario modelingFinland, ColdGeneral buildingsIDA ICE/EnergyPlus
Aijazi & Brager, 2018 [27]Conceptual and theoretical analysisUSA (3 Climate Zones)VariousConceptual (no software)
Shibuya & Croxford, 2016 [9]SimulationJapanOfficeEnergyPlus
Andrić et al., 2017 [34]Scenario-based simulationEurope, MultipleMixed-use buildingsEnergyPlus
Troup et al., 2019 [20]Ensemble simulation using morphed dataUSA (3 climate zones)Office buildingsEnergyPlus with morphed climate data
Chen et al., 2018 [19]SimulationChina, Multiple zonesOffice buildingsEnergyPlus
Sabunas & Kanapickas, 2017 [25]HEED simulationLithuania, ColdResidentialHEED
Kutty et al., 2023 [29]Systematic reviewHot arid (Middle East)Urban desert buildingsReview-based
Bass & New, 2023 [10]simulationUSA (All Climate Zones)CommercialEnergyPlus/ResStock
Kikumoto et al., 2015 [15]Future weather data generationJapanMixed-use buildingsWeatherGen/Meteonorm
Invidiata & Ghisi, 2016 [24]SimulationBrazil, TropicalResidentialEnergyPlus
Chai et al., 2019 [26]Lifecycle performance modelingChinaNet-zero BuildingsDesignBuilder/EnergyPlus
Niknia & Ghiai, 2025 [22]SimulationUSA, (All climate zones)Office BuildingsEnergyPlus
Wang et al., 2017 [13]Comparison of two climate modelsUSA (1 Climate Zone)OfficeEnergyPlus
Table 2. Finding Categories Display.
Climate Zone Categories
Very Hot and Hot ZonesWarm ZonesMixed ZonesCool to Cold Zones
1A-Very Hot Humid-Miami, FL3A-Warm Humid-Atlanta, GA4A-Mixed Humid-New York, NY5A-Cool Humid-Buffalo, NY
2A-Hot Humid-Tampa, FL3B-Warm Dry-El Paso, TX4B-Mixed Dry-Albuquerque, NM5B-Cool Dry-Denver, CO
2B-Hot Dry-Tucson, AZ3C-Warm Marine-San Diego, CA4C-Mixed Marine-Seattle, WA5C-Cool Marine-Port Angeles, WA
6A-Cold Humid-Rochester, MN
6B-Cold Dry-Great Falls, MO
7-Very Cold-International Falls, MN
8-Subarctic/Arctic-Fairbanks, AK
Table 3. Variance Partitioning of Climate-Driven Change in EUI (ΔEUI).
Source of VariationContribution to Variance
Climate Zone71.2%
Building Type23.7%
Residual (Interaction + Error)5.1%
Note: Estimated contribution of each variable to ΔEUI variation based on visual trends and simulation summary statistics from 800 EnergyPlus runs. Inputs: 16 climate zones × 10 DOE prototypes under RCP 4.5/8.5 and 2050/2080 projections.
Table 4. Adaptation Priorities by ASHRAE Climate Zone and Building Type.
ASHRAE ZoneClimate CharacteristicsHigh-Risk Building TypesMain Energy ConcernRecommended Adaptation Strategy
1A–2AVery Hot–HumidMedium Offices, Restaurants↑ Cooling DemandHigh-efficiency HVAC; advanced glazing; solar shading; passive ventilation
2B–3BHot–DryHigh-Rise Apartments, Restaurants↑ Cooling
↓ Heating
Thermal mass; evaporative cooling; roof reflectance; insulation upgrade
3A–4AWarm–Humid to Mixed–HumidSecondary Schools, Strip Malls↑ Cooling Latent LoadDemand-response HVAC; dehumidification; smart ventilation
4B–5BMixed–Dry to Cool–DrySmall Offices, RetailBalanced Gains/LossesDual-mode systems; zoning controls; design for shoulder seasons
5A–6ACool–Humid to Cold–HumidLarge Offices, Restaurants↓ Heating, Emerging CoolingDownsizing boilers; heat pumps; passive cooling options
6B–8Cold–Dry to SubarcticSmall Offices, Apartments, Schools↓ Heating Dominant LoadHeating system right-sizing; insulation enhancement; preparing for future cooling
↑ Increase ↓ Decrease.
Disclaimer/Publisher’s Note: The statements, opinions and data contained in all publications are solely those of the individual author(s) and contributor(s) and not of MDPI and/or the editor(s). MDPI and/or the editor(s) disclaim responsibility for any injury to people or property resulting from any ideas, methods, instructions or products referred to in the content.

