
Estimating Macroplastic Mass Transport from Urban Runoff in a Data-Scarce Watershed: A Case Study from Cordoba, Argentina

 , , , , and
Abstract
1. Introduction
2. Materials and Methods
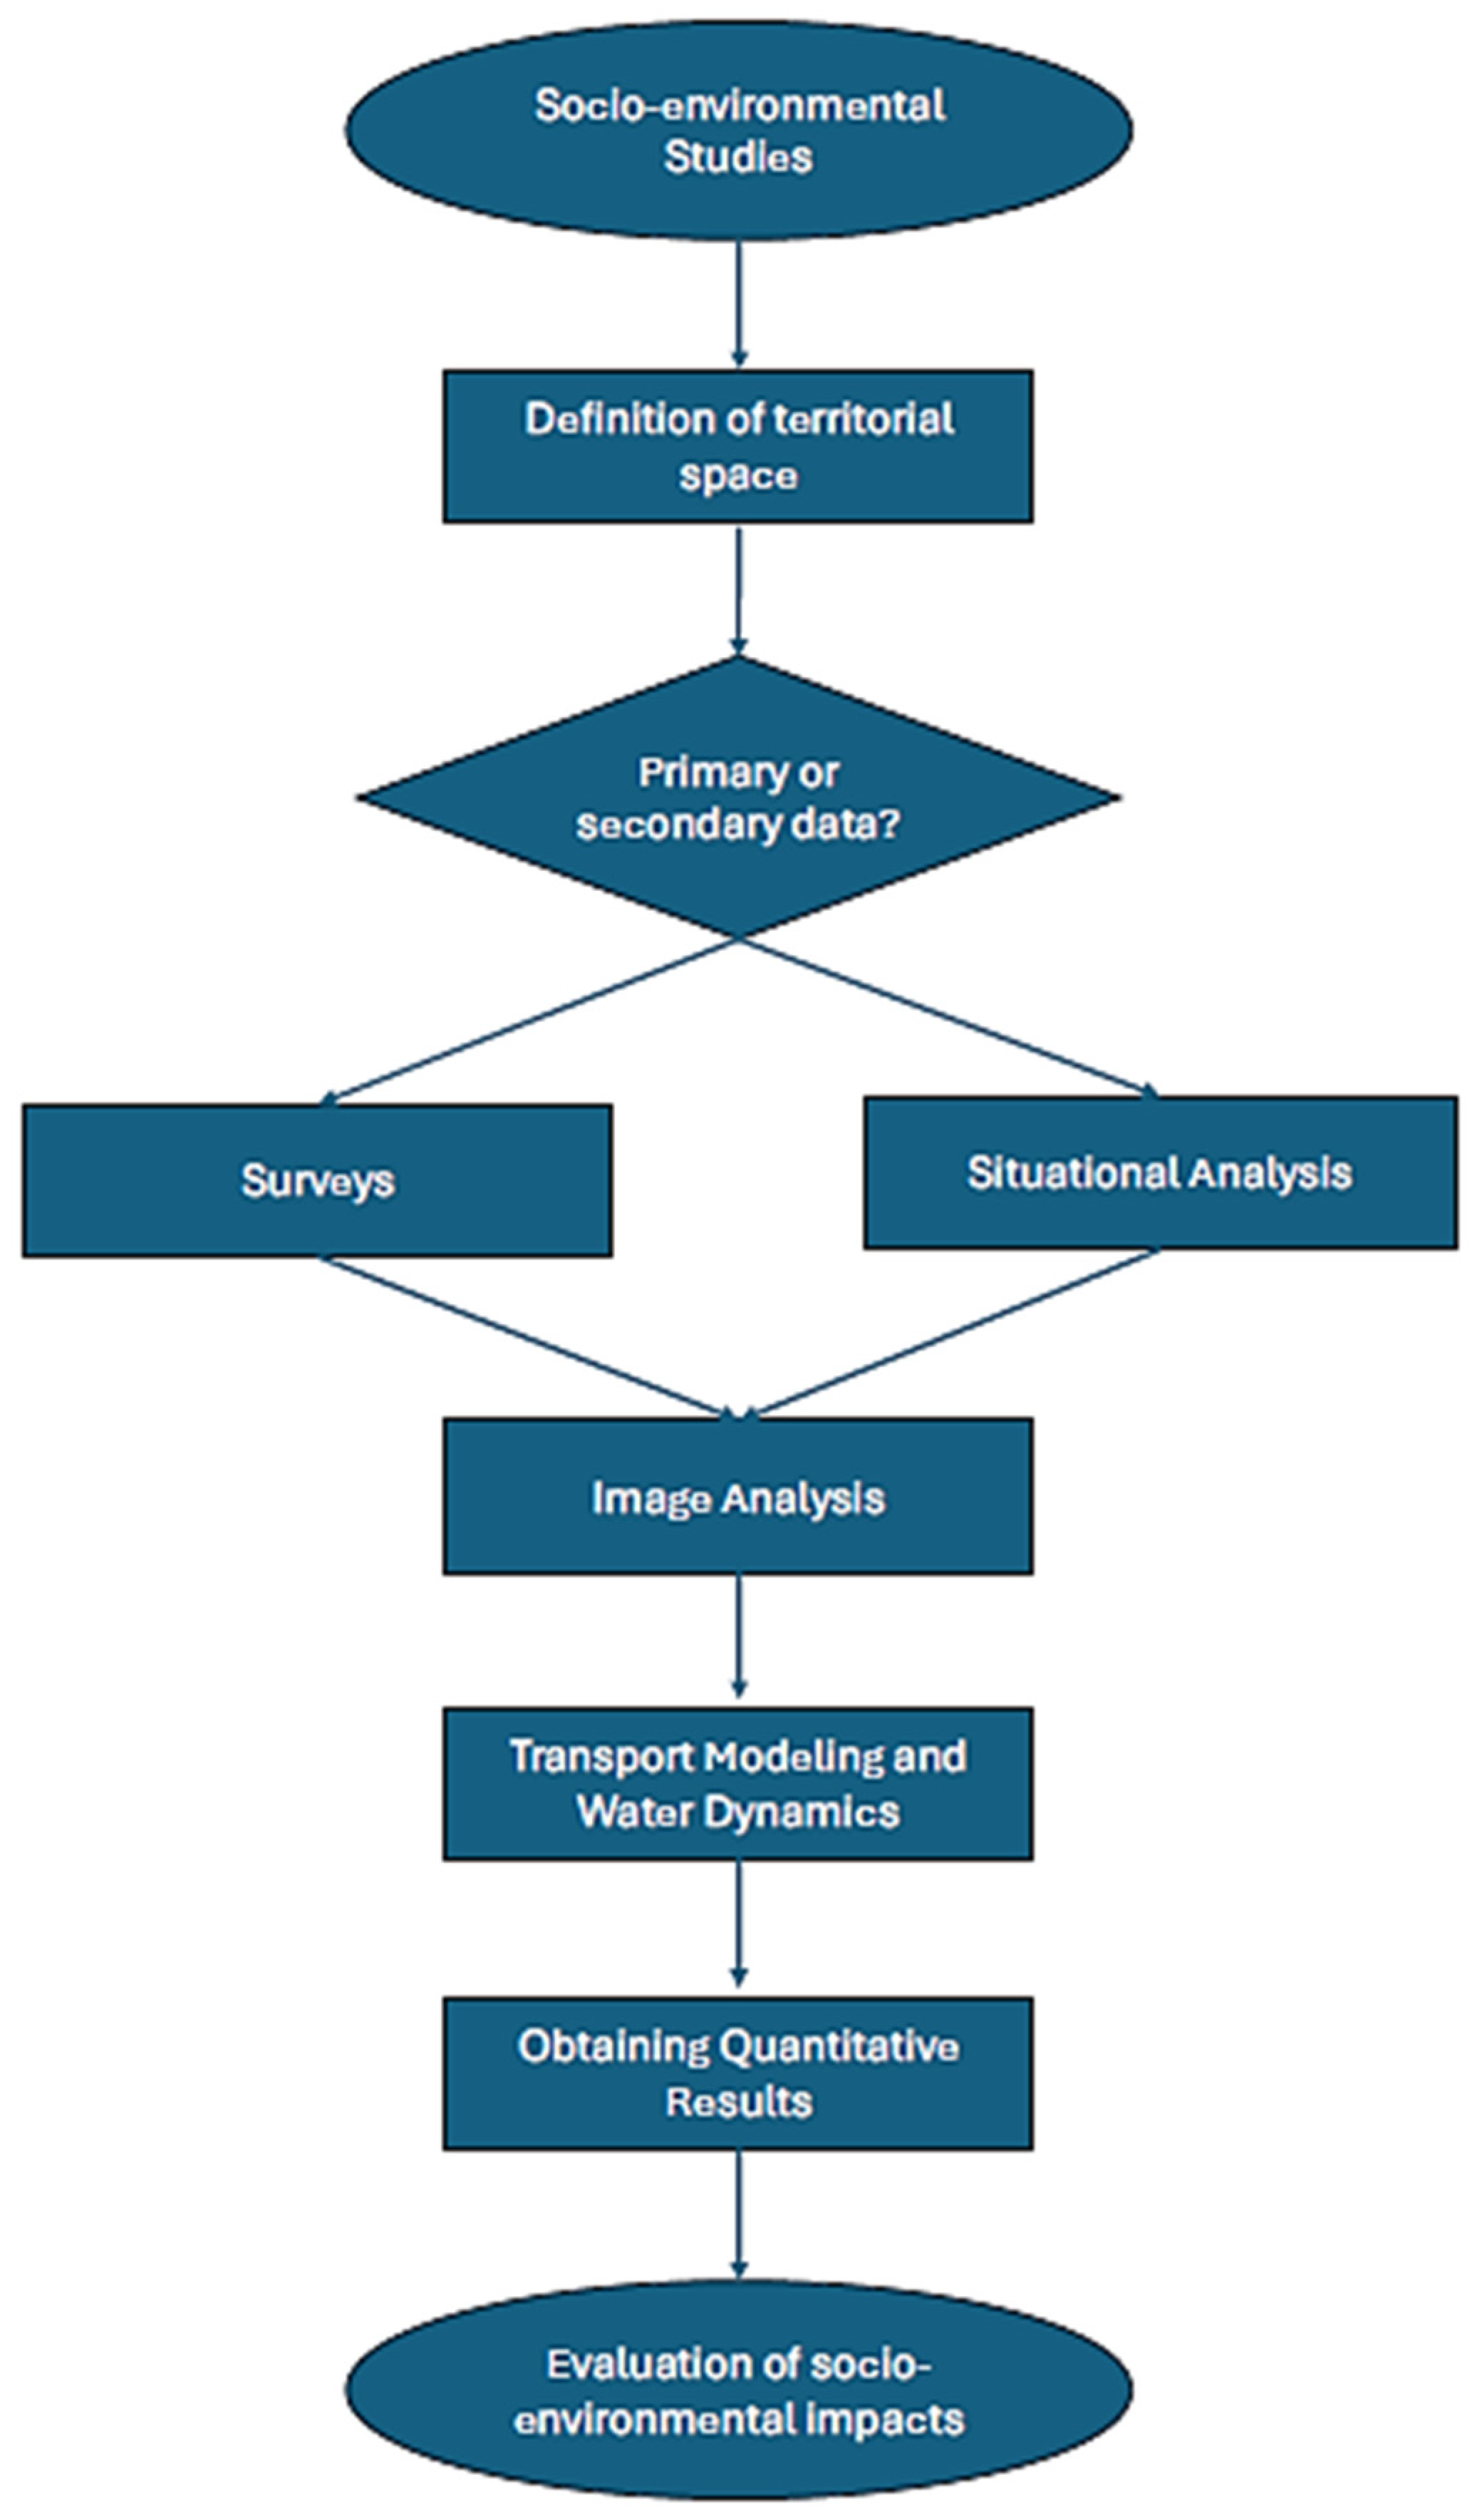
2.1. Approach
2.2. Socio-Environmental Studies
2.3. Study Area
- Identification data and comorbidities
- Household exposure to climate-related events and proximity to the Suquia River
- Health and meteorological events
- Waterborne diseases and related health concerns
2.4. Image Analysis
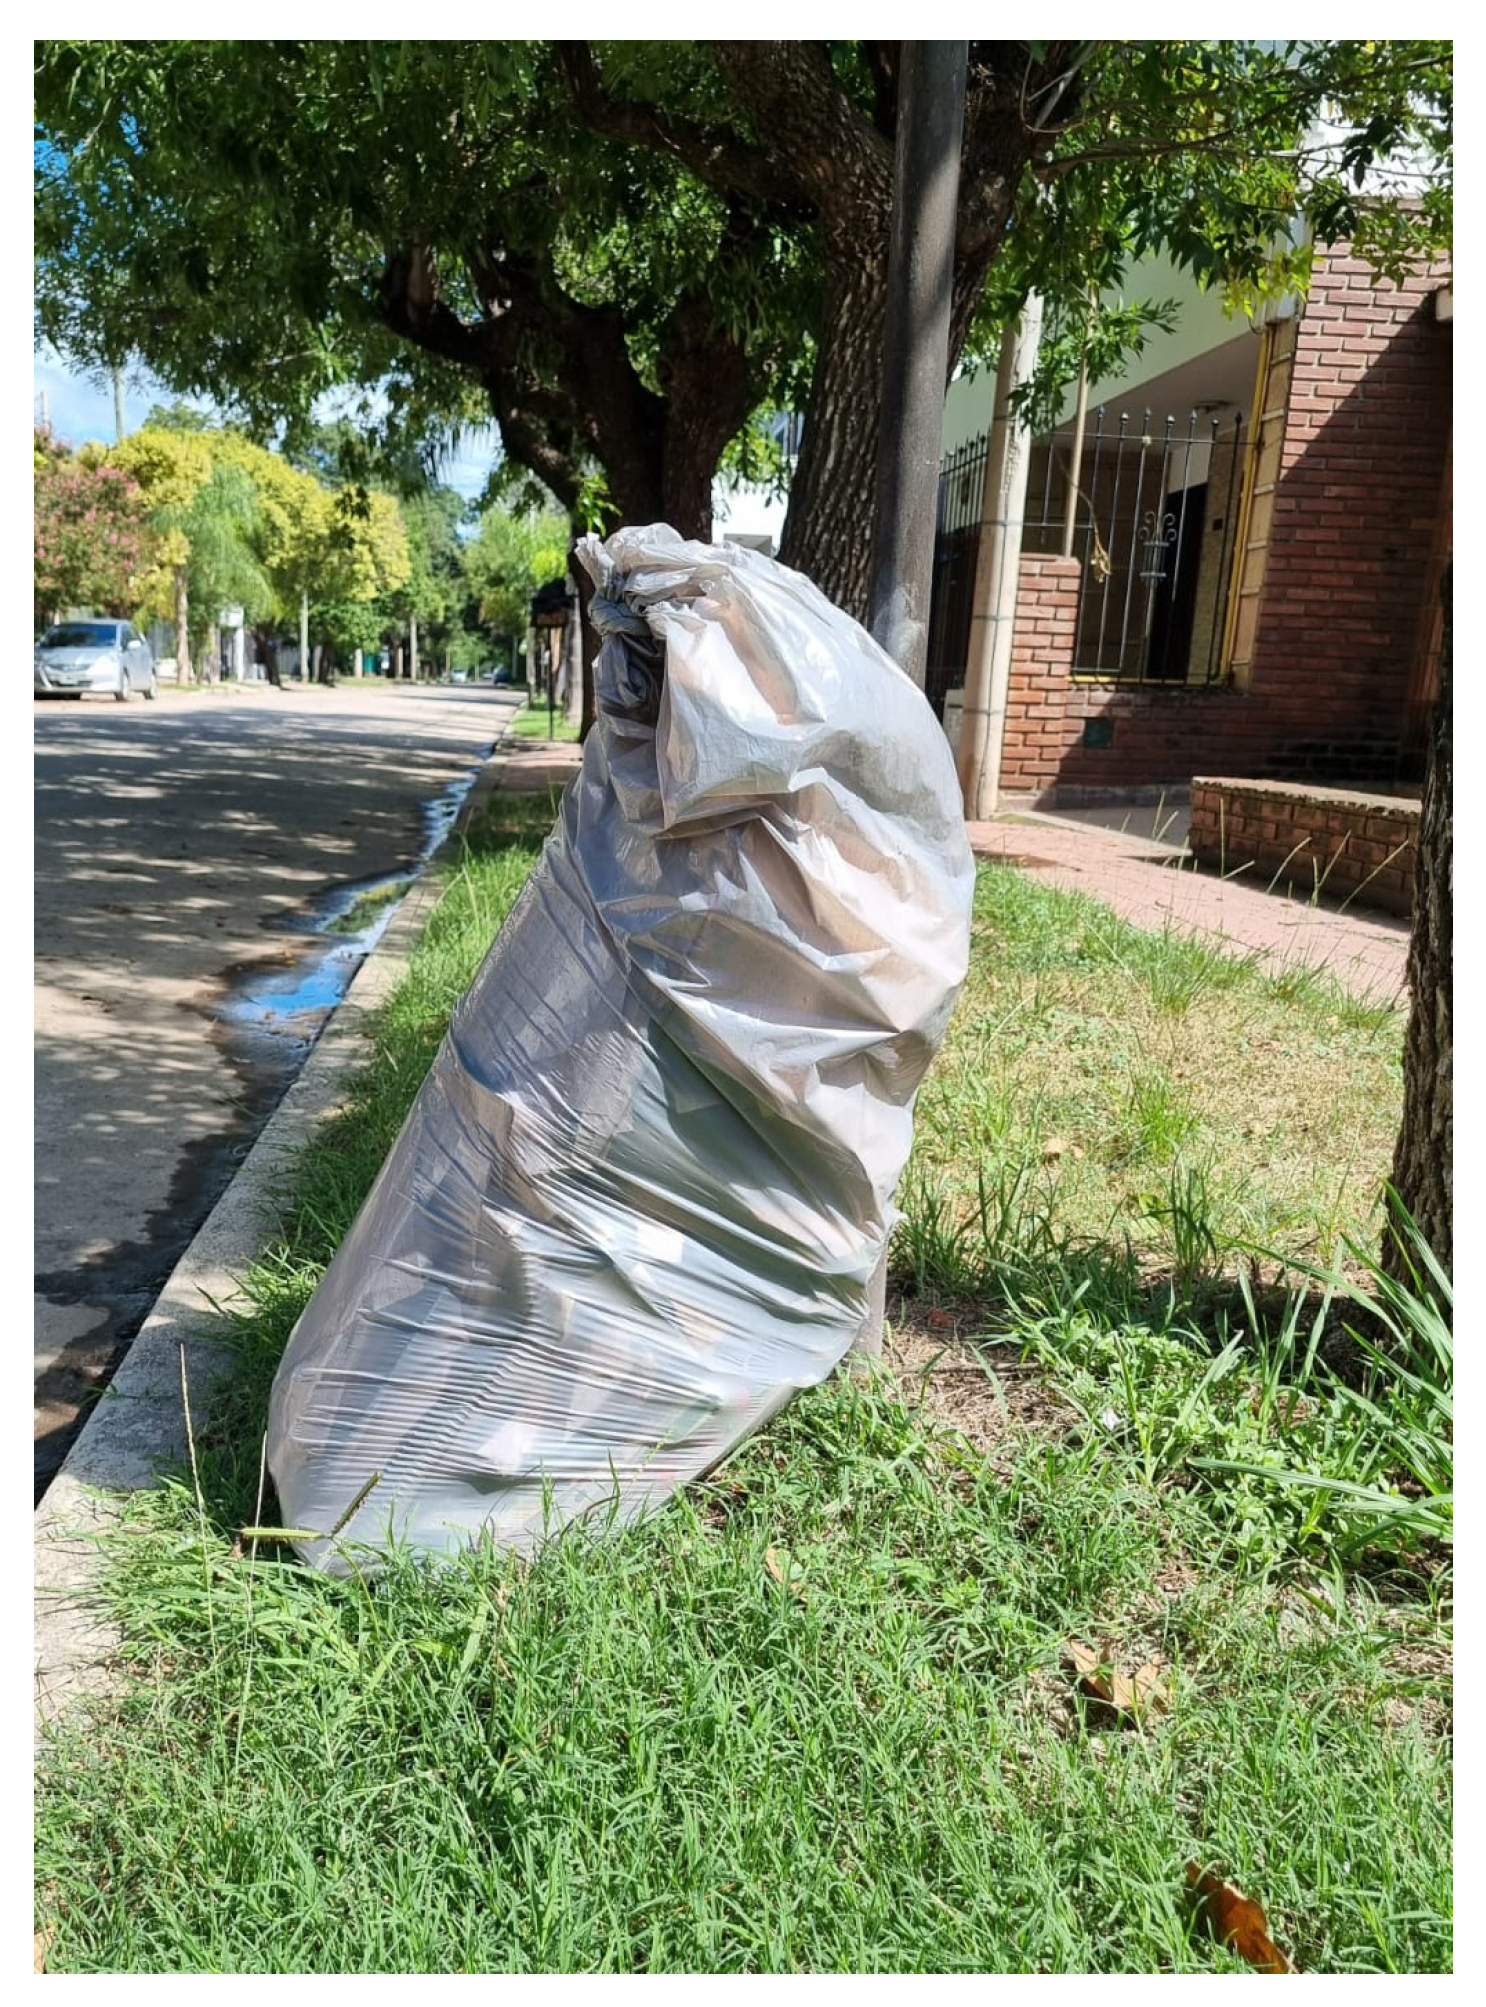
2.4.1. Garbage in the Street
2.4.2. Landfills and Dumping Points
2.5. Hydrological Model and Macroplastic Transport
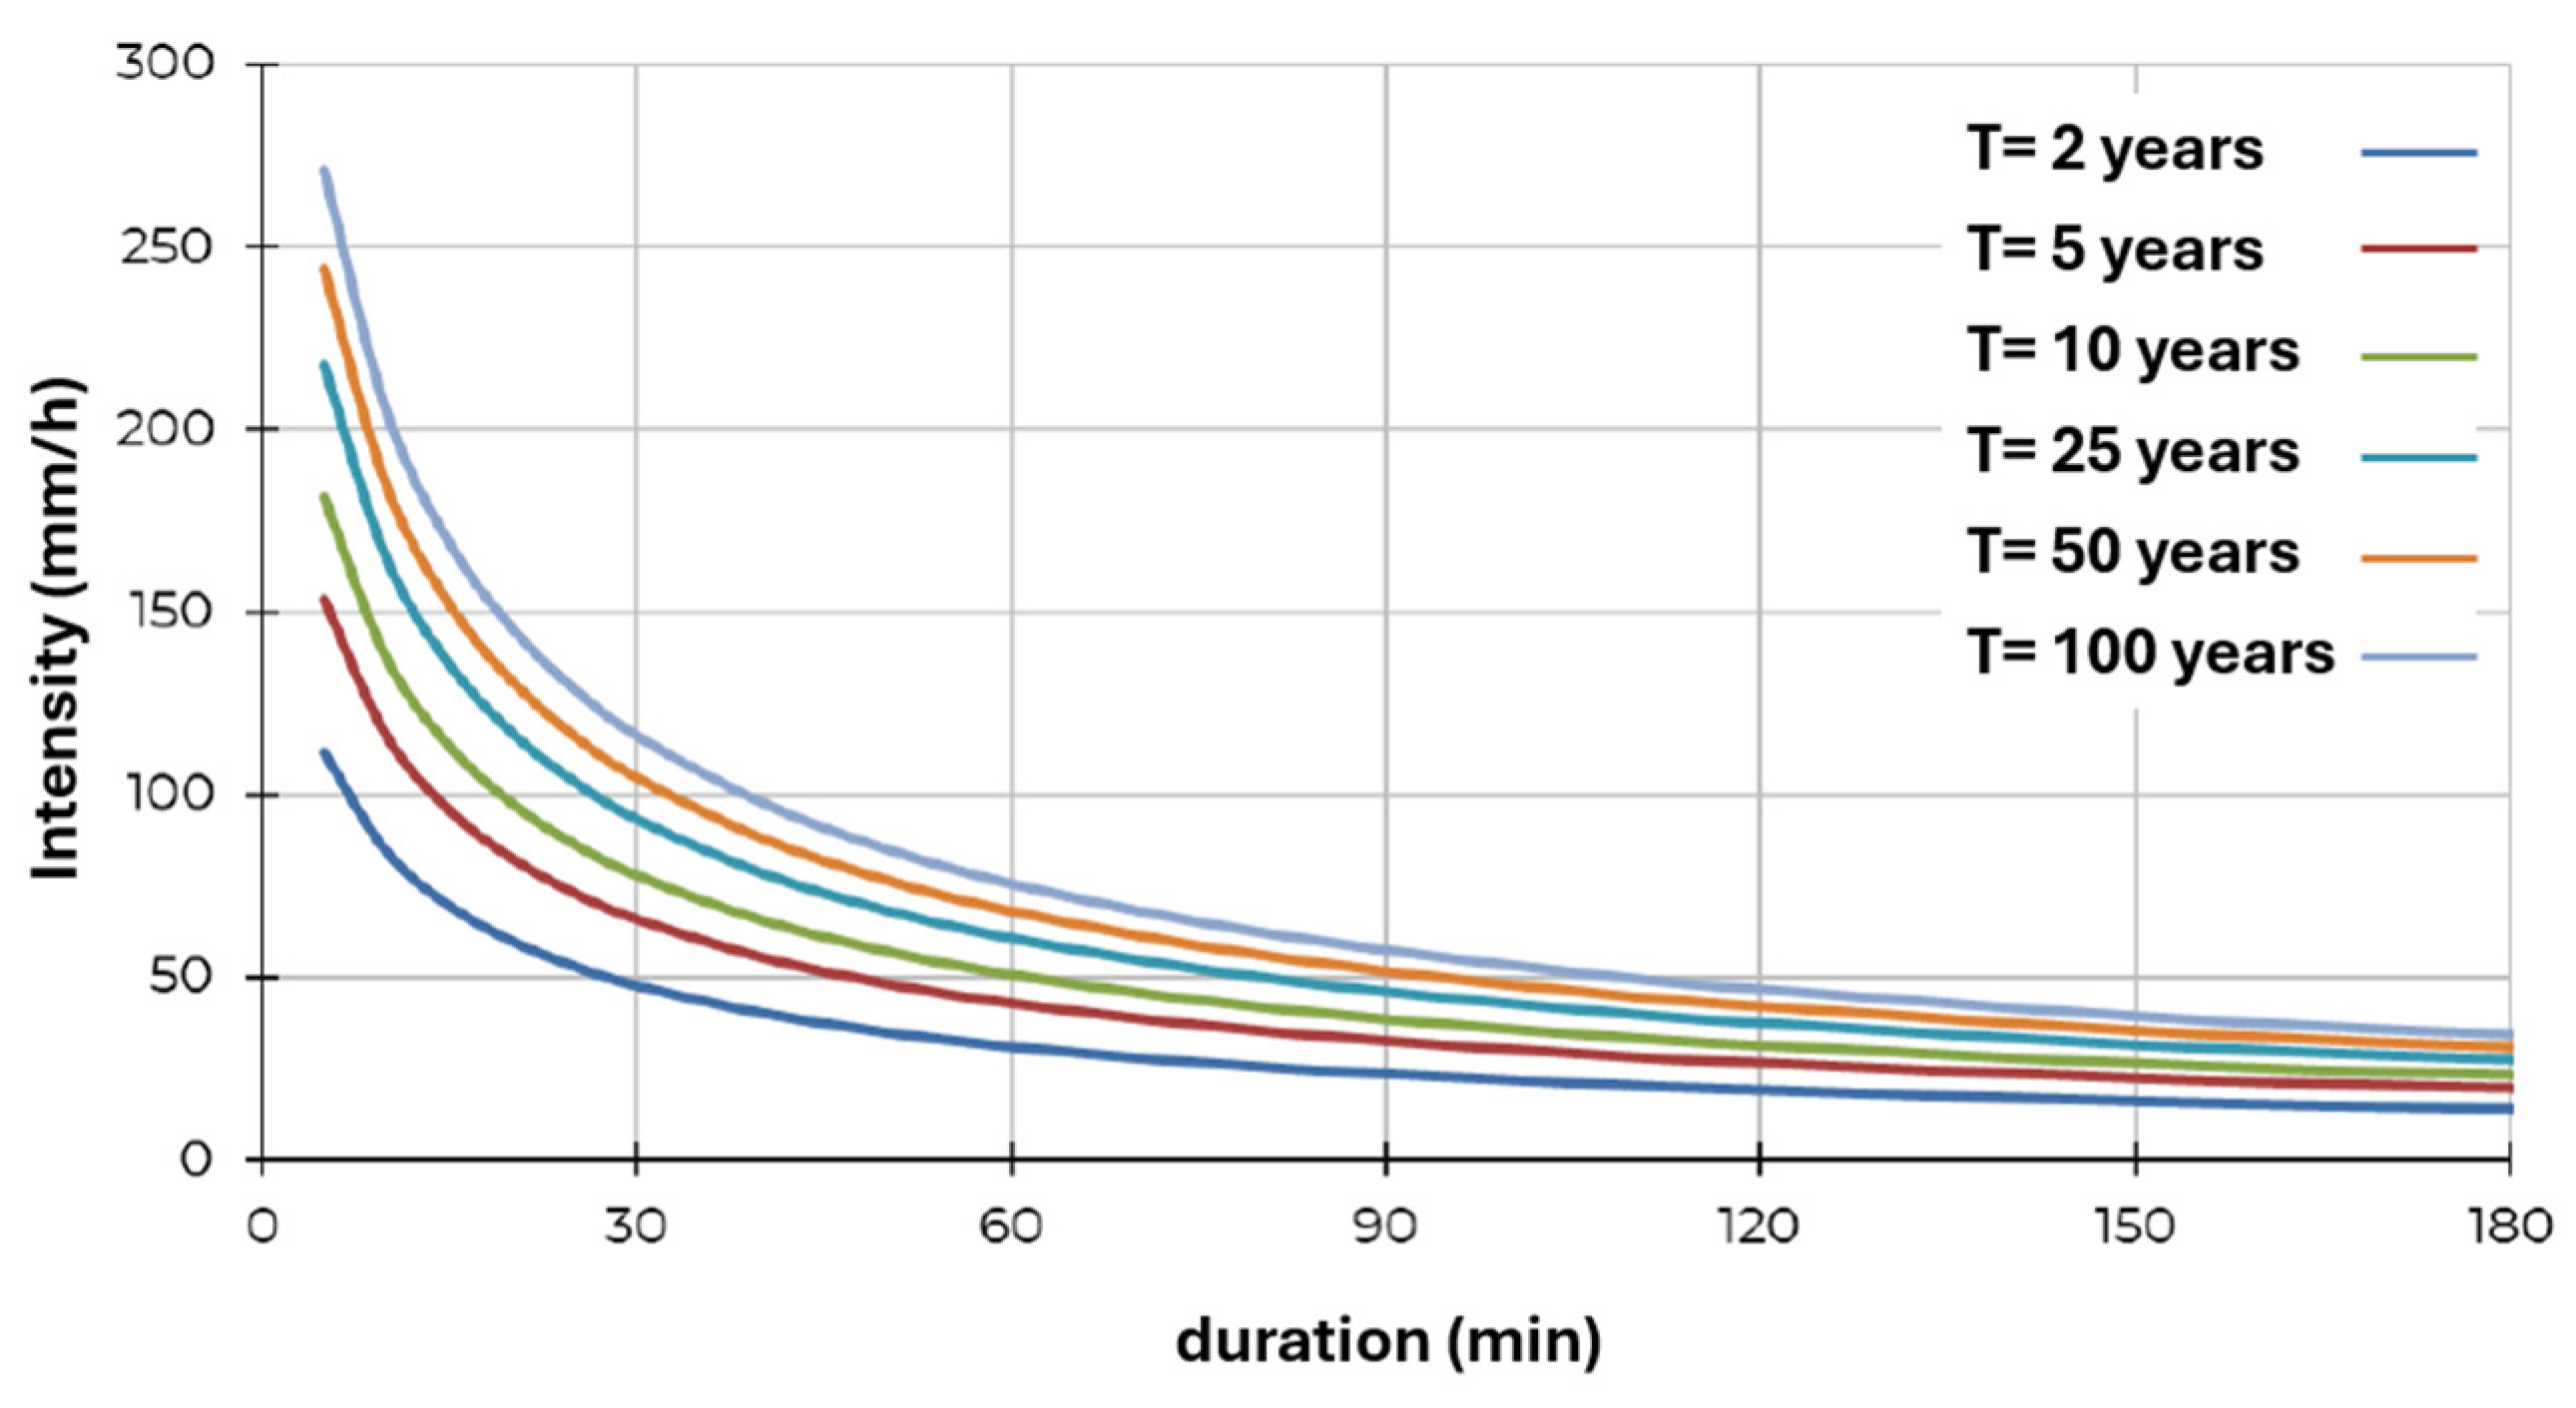
2.5.1. Design Storms
- i = Precipitation intensity in mm/h
- T = recurrence period in years
- d = duration of the storm in minutes
- A = 0.381
- B = 0.154
- C = 5.054
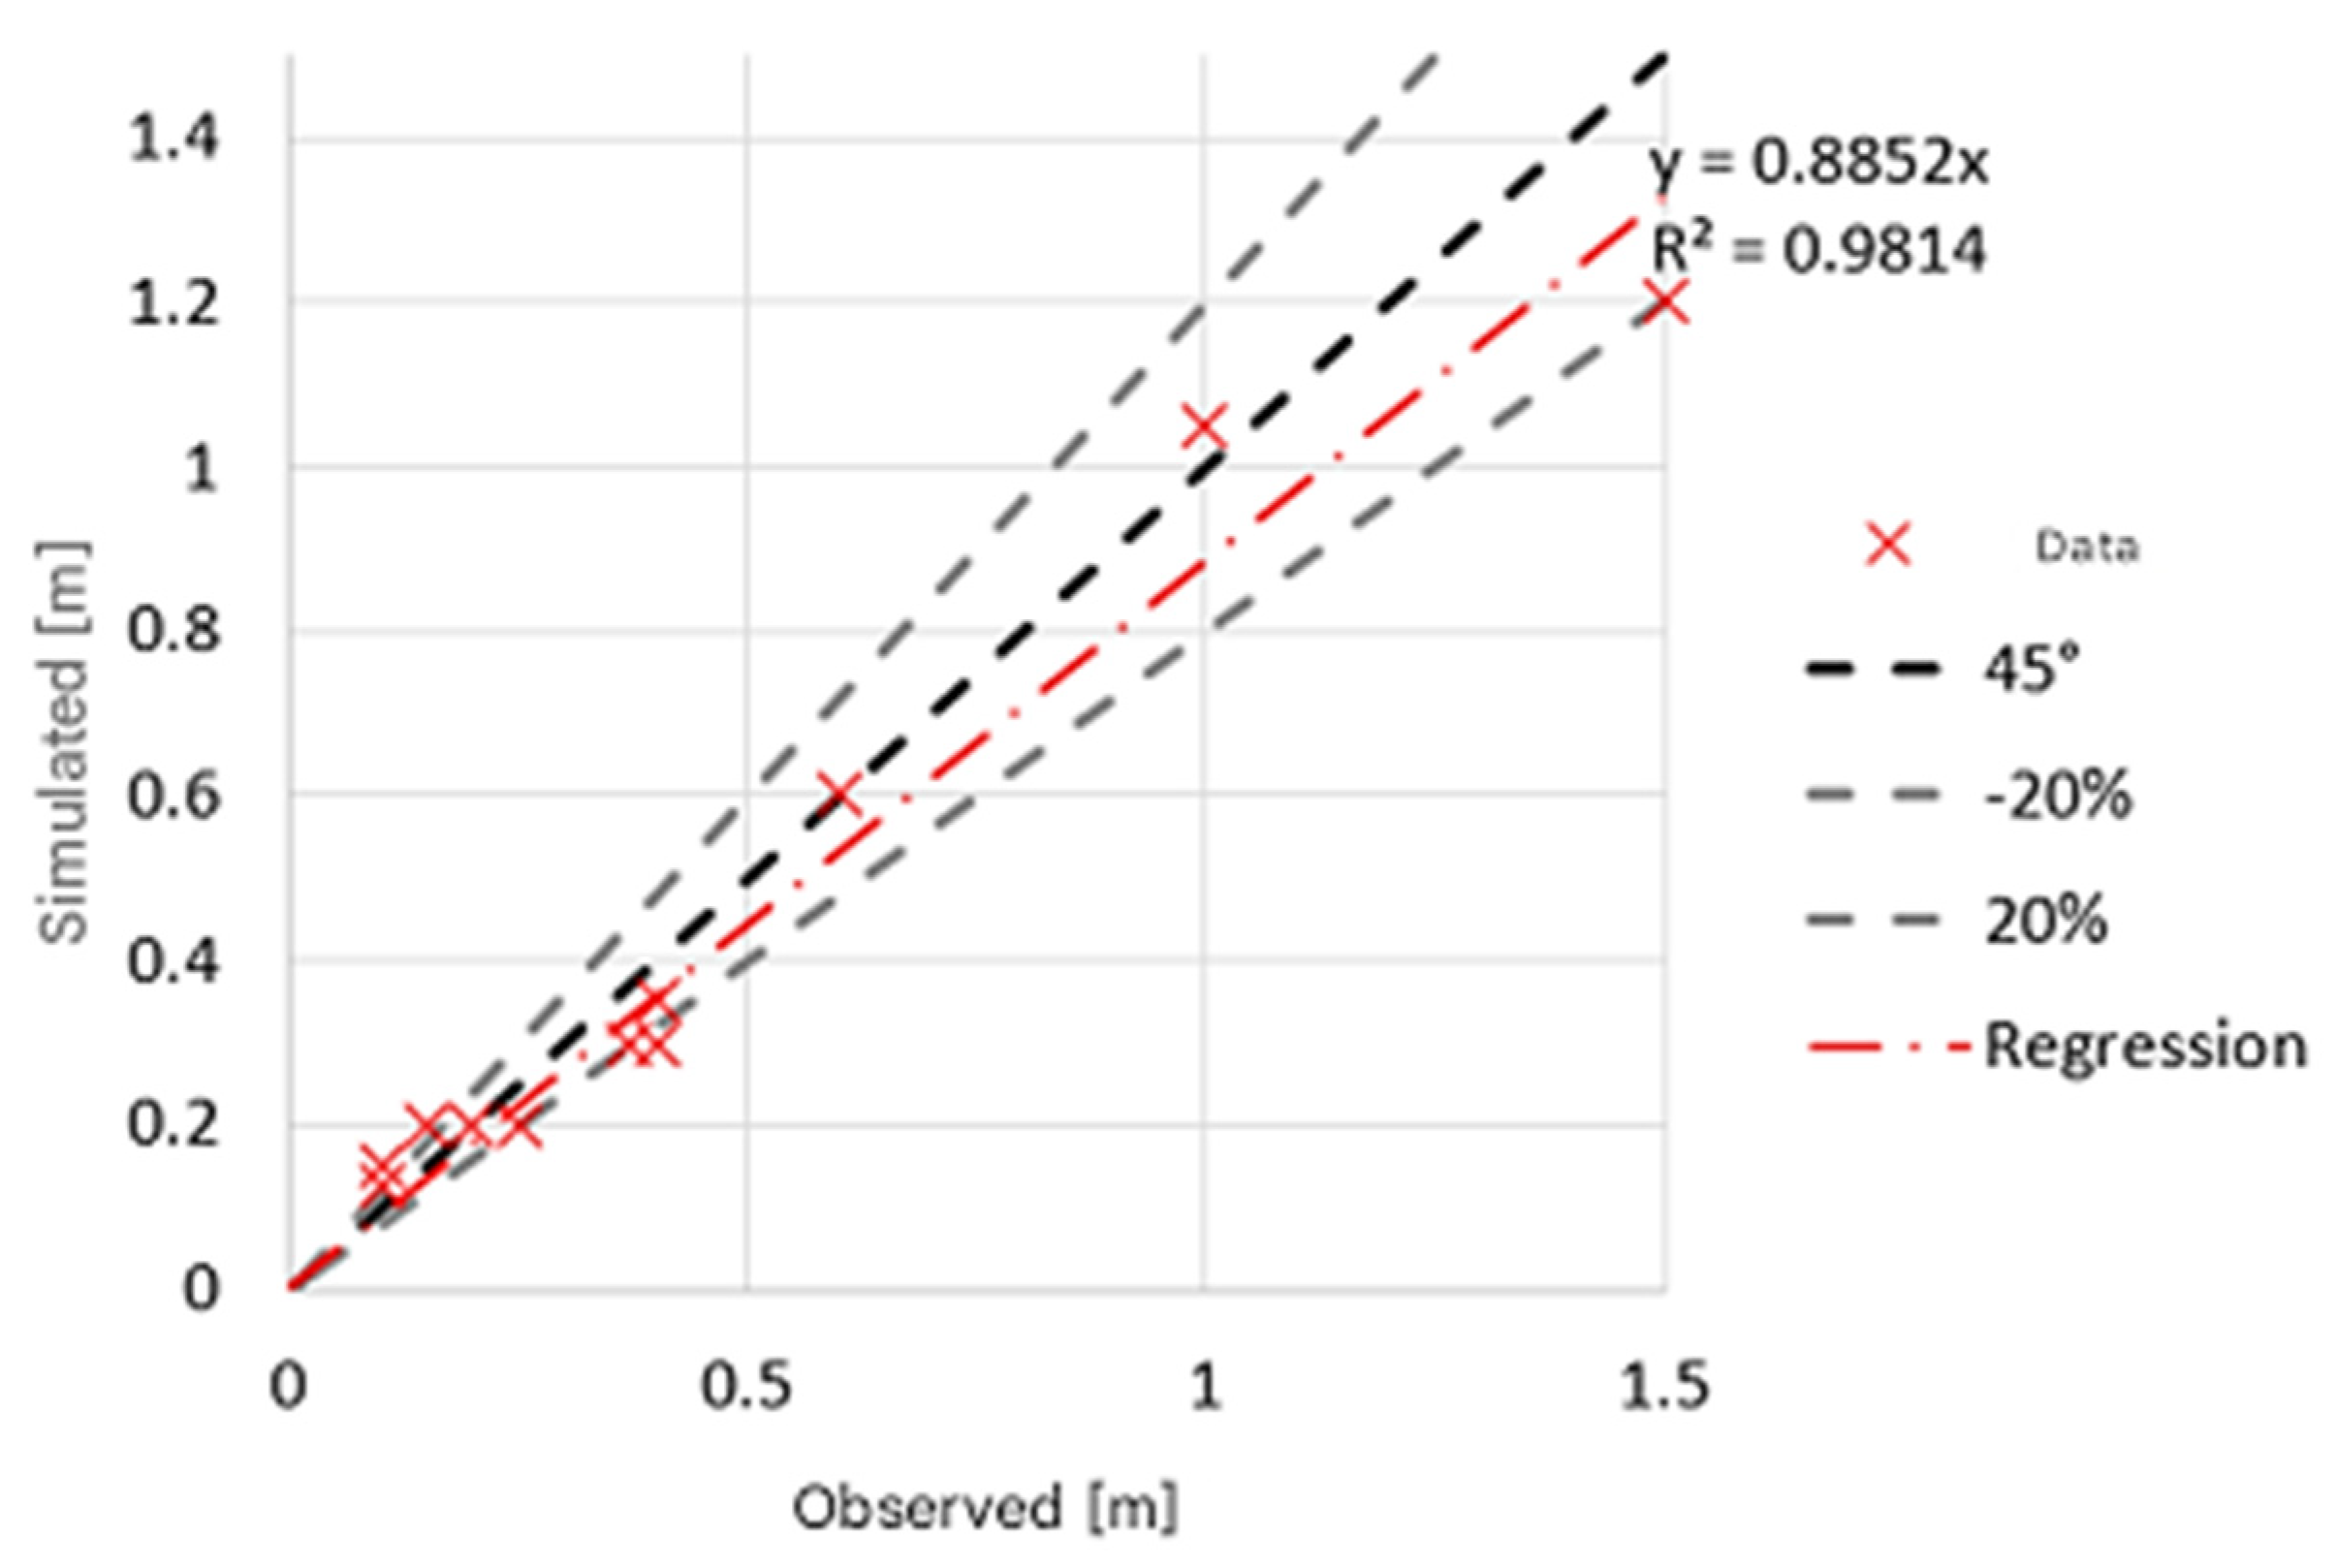
2.5.2. EPA SWMM—Transport of Contaminants
3. Results
3.1. Survey Results
3.2. Modeling Results for Scenario 1
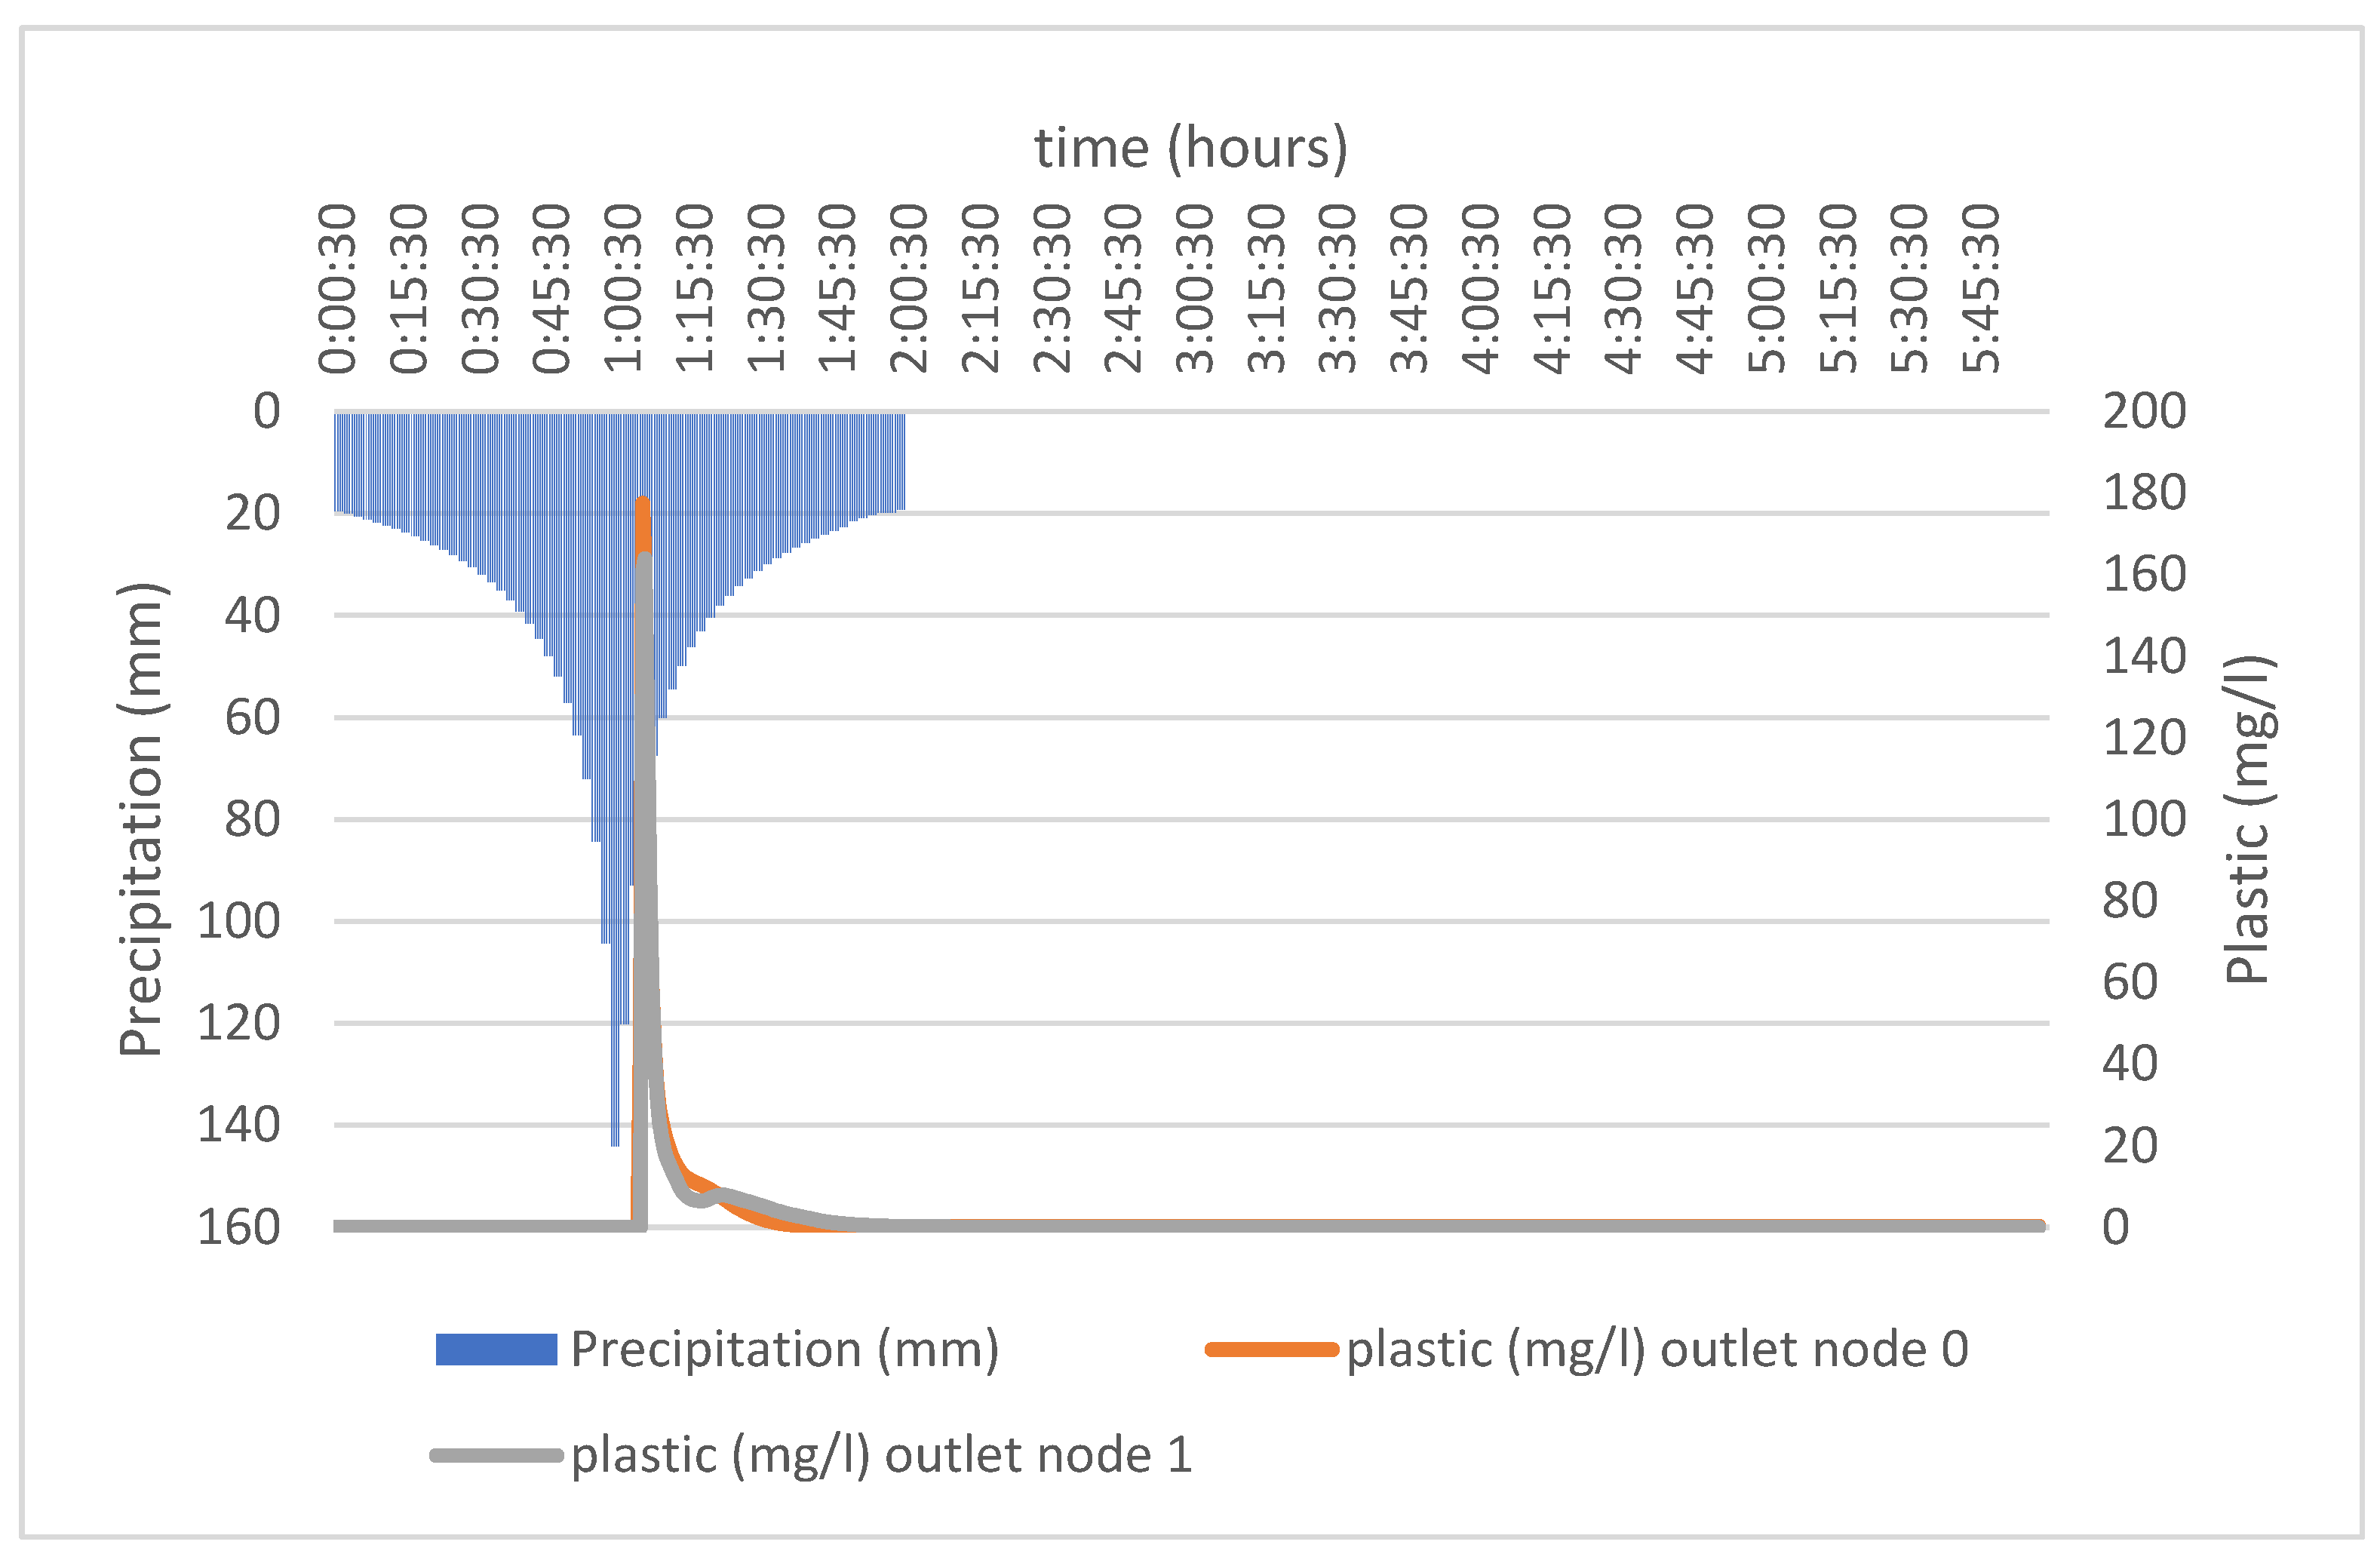
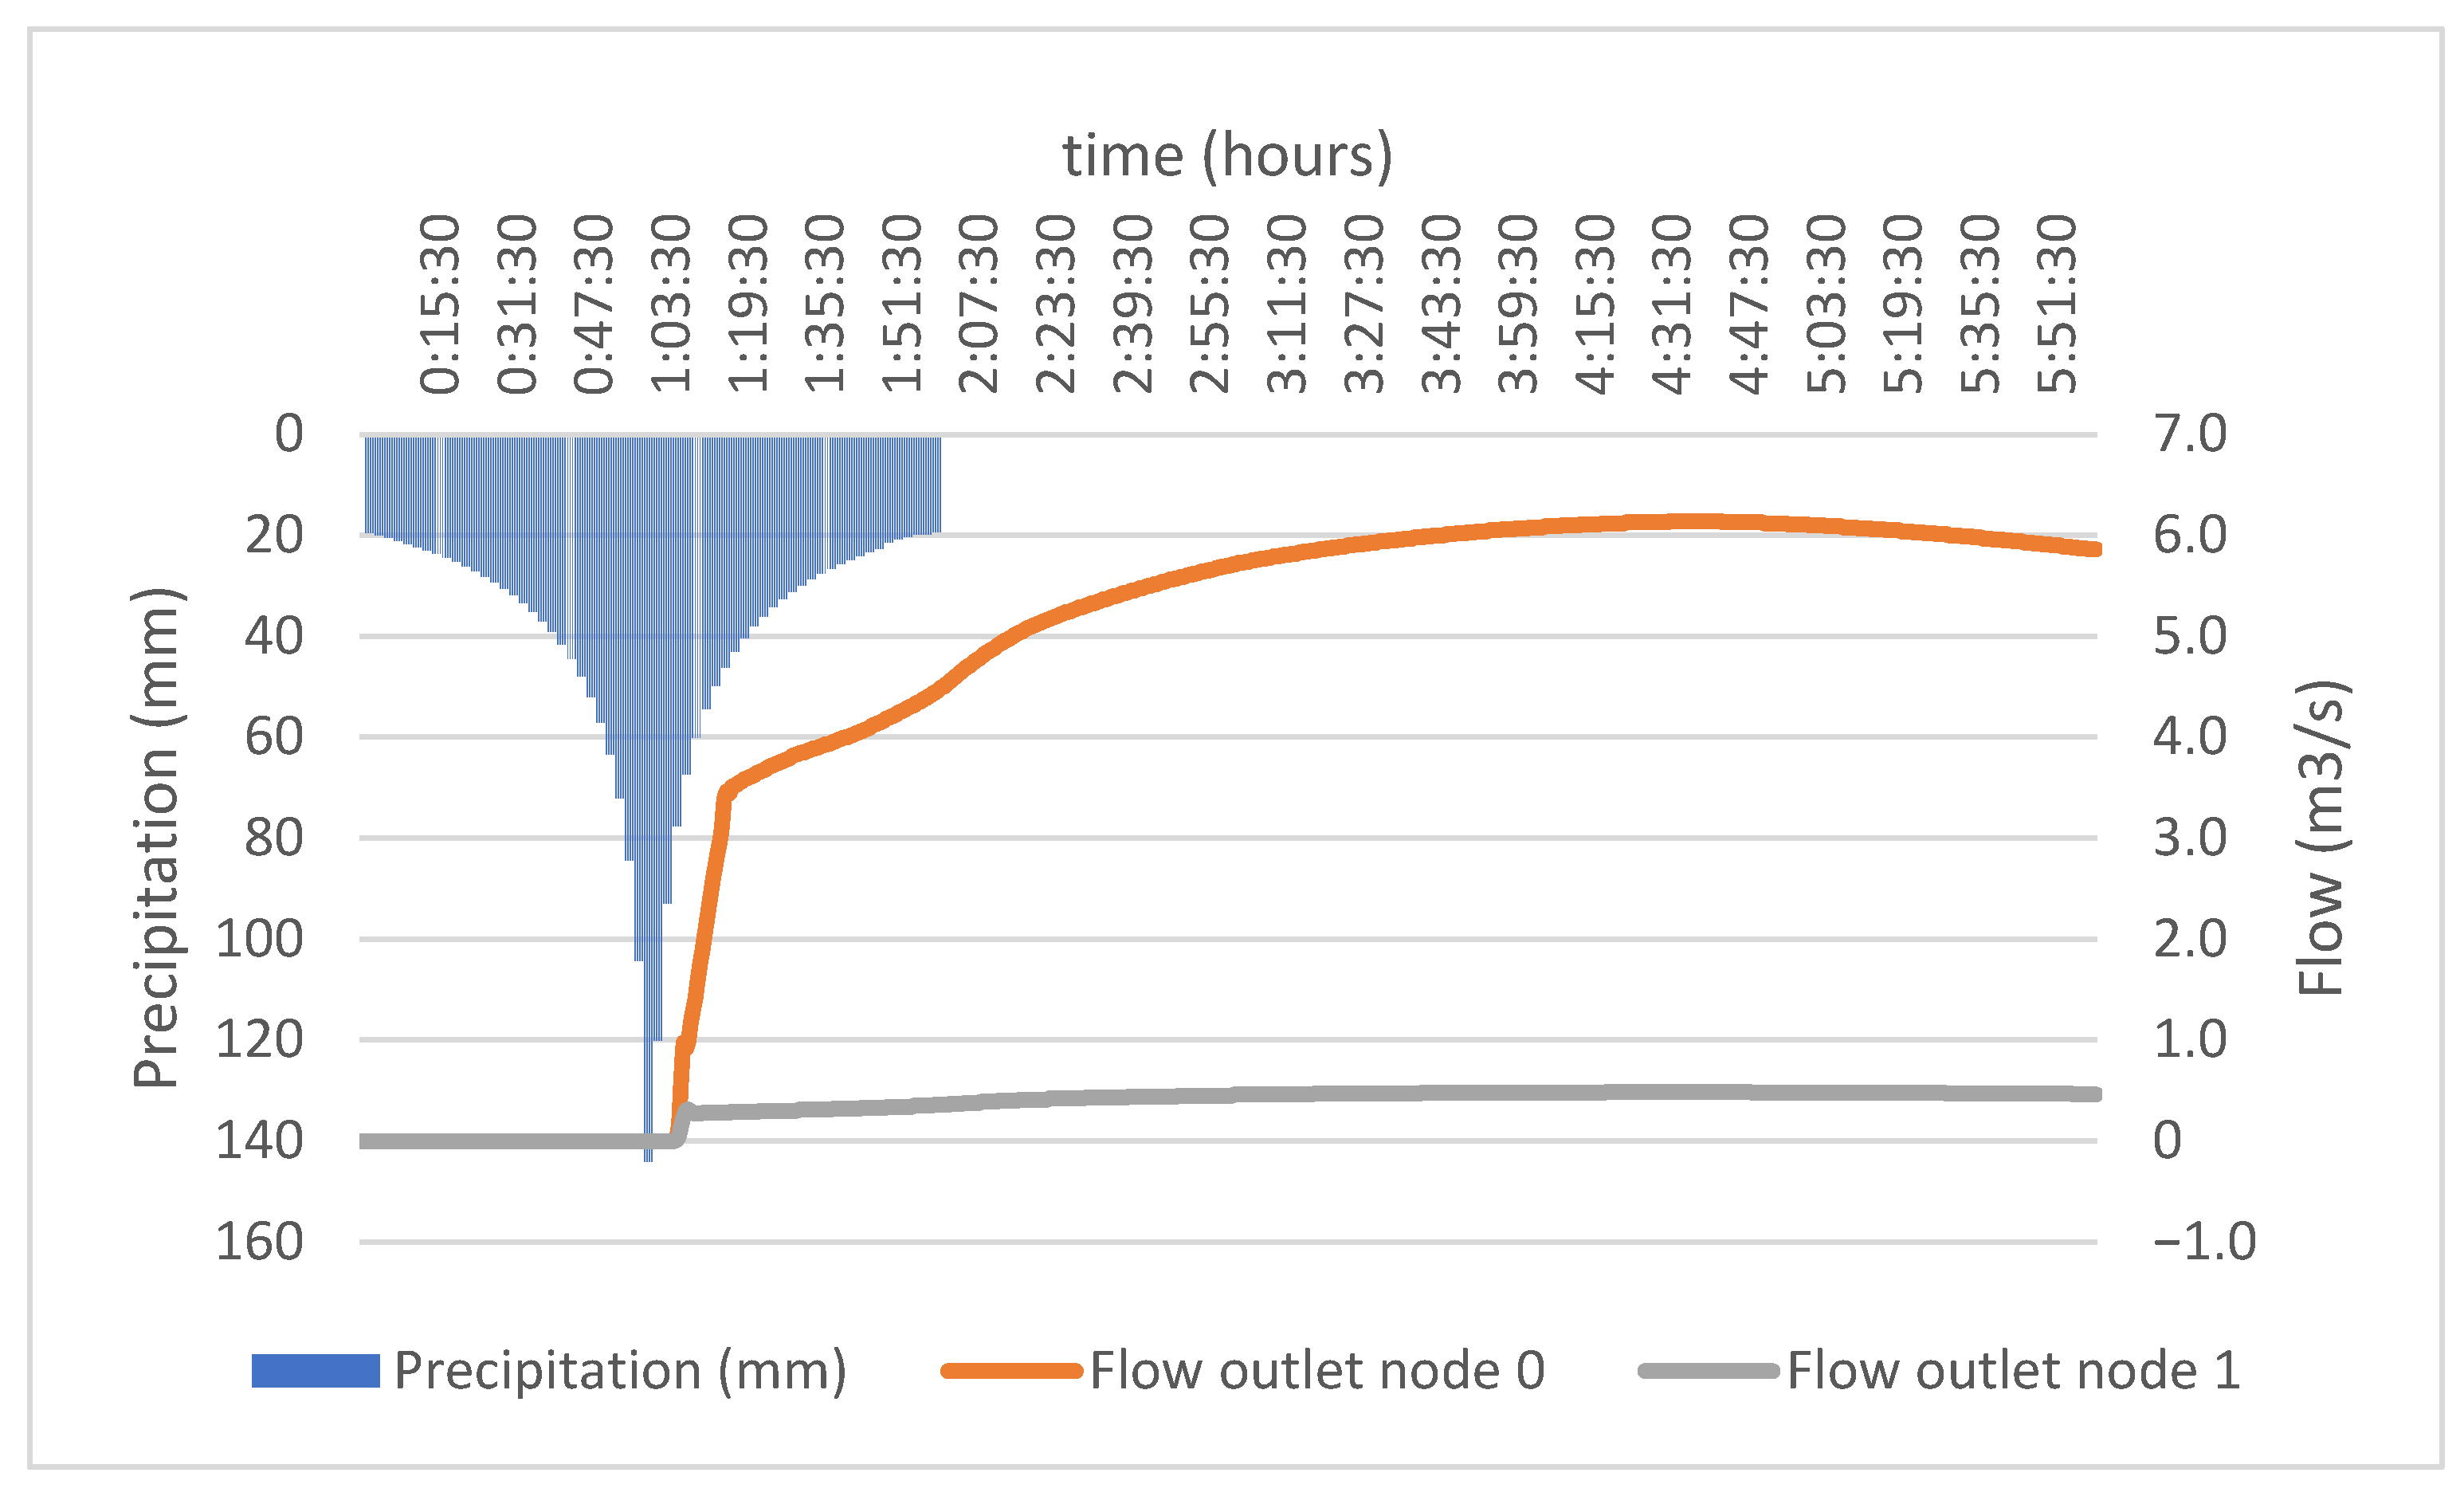
3.3. Modeling Results for Scenario 2
3.4. Interpretation of Outputs
4. Discussion
5. Conclusions
Author Contributions
Funding
Institutional Review Board Statement
Informed Consent Statement
Data Availability Statement
Acknowledgments
Conflicts of Interest
References
- MacLeod, M.; Arp, H.P.H.; Tekman, M.B.; Jahnke, A. The Global Threat from Plastic Pollution. Science 2021, 373, 61–65. [Google Scholar] [CrossRef] [PubMed]
- Borrelle, S.B.; Ringma, J.; Law, K.L.; Monnahan, C.C.; Lebreton, L.; McGivern, A.; Murphy, E.; Jambeck, J.; Leonard, G.H.; Hilleary, M.A.; et al. Predicted Growth in Plastic Waste Exceeds Efforts to Mitigate Plastic Pollution. Science 2020, 369, 1515–1518. [Google Scholar] [CrossRef]
- Wagner, M.; Scherer, C.; Alvarez-Muñoz, D.; Brennholt, N.; Bourrain, X.; Buchinger, S.; Fries, E.; Grosbois, C.; Klasmeier, J.; Marti, T.; et al. Microplastics in Freshwater Ecosystems: What We Know and What We Need to Know. Environ. Sci. Eur. 2014, 26, 12. [Google Scholar] [CrossRef] [PubMed]
- Lebreton, L.; Andrady, A. Future Scenarios of Global Plastic Waste Generation and Disposal. Palgrave Commun. 2019, 5, 6. [Google Scholar] [CrossRef]
- Persson, L.; Carney Almroth, B.M.; Collins, C.D.; Cornell, S.; De Wit, C.A.; Diamond, M.L.; Fantke, P.; Hassellöv, M.; MacLeod, M.; Ryberg, M.W.; et al. Outside the Safe Operating Space of the Planetary Boundary for Novel Entities. Environ. Sci. Technol. 2022, 56, 1510–1521. [Google Scholar] [CrossRef]
- Gómez, P.V.; Almroth, B.C.; Ryberg, M.; Cornell, S.E.; Eriksen, M. Plastics pollution exacerbates the impacts of all planetary boundaries. One Earth 2024, 7, 2119–2138. [Google Scholar] [CrossRef]
- Geyer, R.; Jambeck, J.R.; Law, K.L. Production, Use, and Fate of All Plastics Ever Made. Sci. Adv. 2017, 3, e1700782. [Google Scholar] [CrossRef]
- Strokal, M.; Vriend, P.; Bak, M.P.; Kroeze, C.; Van Wijnen, J.; Van Emmerik, T. River Export of Macro- and Microplastics to Seas by Sources Worldwide. Nat. Commun. 2023, 14, 4842. [Google Scholar] [CrossRef]
- Blettler, M.C.M.; Abrial, E.; Khan, F.R.; Sivri, N.; Espinola, L.A. Freshwater Plastic Pollution: Recognizing Research Biases and Identifying Knowledge Gaps. Water Res. 2018, 143, 416–424. [Google Scholar] [CrossRef]
- Vriend, P.; Hidayat, H.; Van Leeuwen, J.; Cordova, M.R.; Purba, N.P.; Löhr, A.J.; Faizal, I.; Ningsih, N.S.; Agustina, K.; Husrin, S.; et al. Plastic Pollution Research in Indonesia: State of Science and Future Research Directions to Reduce Impacts. Front. Environ. Sci. 2021, 9, 692907. [Google Scholar] [CrossRef]
- Meijer, L.J.J.; Van Emmerik, T.; Van Der Ent, R.; Schmidt, C.; Lebreton, L. More than 1000 Rivers Account for 80% of Global Riverine Plastic Emissions into the Ocean. Sci. Adv. 2021, 7, eaaz5803. [Google Scholar] [CrossRef] [PubMed]
- Tramoy, R.; Blin, E.; Poitou, I.; Noûs, C.; Tassin, B.; Gasperi, J. Riverine Litter in a Small Urban River in Marseille, France: Plastic Load and Management Challenges. Waste Manag. 2022, 140, 154–163. [Google Scholar] [CrossRef]
- Tasseron, P.; Begemann, F.; Joosse, N.; Van Der Ploeg, M.; Van Driel, J.; Van Emmerik, T. Amsterdam Urban Water System as Entry Point of River Plastic Pollution. Environ. Sci. Pollut. Res. 2023, 30, 73590–73599. [Google Scholar] [CrossRef] [PubMed]
- Cordova, M.R.; Nurhati, I.S. Major Sources and Monthly Variations in the Release of Land-Derived Marine Debris from the Greater Jakarta Area, Indonesia. Sci. Rep. 2019, 9, 18730. [Google Scholar] [CrossRef] [PubMed]
- Axelsson, C.; Van Sebille, E. Prevention through Policy: Urban Macroplastic Leakages to the Marine Environment during Extreme Rainfall Events. Mar. Pollut. Bull. 2017, 124, 211–227. [Google Scholar] [CrossRef]
- Roebroek, C.T.J.; Hut, R.; Vriend, P.; de Winter, W.; Boonstra, M.; van Emmerik, T.H.M. Disentangling Variability in Riverbank Macrolitter Observations. Environ. Sci. Technol. 2021, 55, 4932–4942. [Google Scholar] [CrossRef]
- Strokal, M.; Bai, Z.; Franssen, W.; Hofstra, N.; Koelmans, A.A.; Ludwig, F.; Ma, L.; Van Puijenbroek, P.; Spanier, J.E.; Vermeulen, L.C.; et al. Urbanization: An Increasing Source of Multiple Pollutants to Rivers in the 21st Century. Npj Urban Sustain. 2021, 1, 24. [Google Scholar] [CrossRef]
- Windsor, F.M.; Durance, I.; Horton, A.A.; Thompson, R.C.; Tyler, C.R.; Ormerod, S.J. A Catchment-scale Perspective of Plastic Pollution. Glob. Chang. Biol. 2019, 25, 1207–1221. [Google Scholar] [CrossRef]
- Horton, A.A.; Svendsen, C.; Williams, R.J.; Spurgeon, D.J.; Lahive, E. Large Microplastic Particles in Sediments of Tributaries of the River Thames, UK–Abundance, Sources and Methods for Effective Quantification. Mar. Pollut. Bull. 2017, 114, 218–226. [Google Scholar] [CrossRef]
- Van Emmerik, T.; De Lange, S.; Frings, R.; Schreyers, L.; Aalderink, H.; Leusink, J.; Begemann, F.; Hamers, E.; Hauk, R.; Janssens, N.; et al. Hydrology as a Driver of Floating River Plastic Transport. Earth’s Future 2022, 10, e2022EF002811. [Google Scholar] [CrossRef]
- Lebreton, L.C.M.; Van Der Zwet, J.; Damsteeg, J.-W.; Slat, B.; Andrady, A.; Reisser, J. River Plastic Emissions to the World’s Oceans. Nat. Commun. 2017, 8, 15611. [Google Scholar] [CrossRef] [PubMed]
- Roebroek, C.T.J.; Harrigan, S.; Van Emmerik, T.H.M.; Baugh, C.; Eilander, D.; Prudhomme, C.; Pappenberger, F. Plastic in Global Rivers: Are Floods Making It Worse? Environ. Res. Lett. 2021, 16, 025003. [Google Scholar] [CrossRef]
- Penza, T. Determinación de la Capacidad de Transporte de Residuos Plásticos en la Cuenca Dupuy. Integrative Final Work. Hydraulic Specialty; National University of Cordoba: Cordoba, Argentina, 2023. [Google Scholar]
- Roebroek, C.; Laufkötter, C.; González Fernández, D.; van Emmerik, T. The Quest for the Missing Plastics: Large Uncertainties in River Plastic Export into the Sea. Environ. Pollut. 2022, 312, 119948. [Google Scholar] [CrossRef]
- Gasperi, J.; Dris, R.; Bonin, T.; Rocher, V.; Tassin, B. Assessment of Floating Plastic Debris in Surface Water along the Seine River. Environ. Pollut. 2014, 195, 163–166. [Google Scholar] [CrossRef] [PubMed]
- WMA—The World Medical Association. Declaración de Helsinki de la AMM—Principios Éticos para las Investigaciones Médicas con Participantes Humanos. Available online: https://www.wma.net/es/policies-post/declaracion-de-helsinki-de-la-amm-principios-eticos-para-las-investigaciones-medicas-en-seres-humanos/ (accessed on 2 July 2025).
- Legislación Provincial de Córdoba: Ley Número 9694. Available online: https://e-legis-ar.msal.gov.ar/htdocs/legisalud/migration/html/14496.html (accessed on 4 July 2025).
- Strusberg, I.; Vanoni, S.; Correa, F.; Méjico, S.; Diaz Lozada, J.M.; García, C.M.; Elorza, A.L.; Gaitán, P.; Muñoz, S.; Aballay, L. Situación Sanitaria y su Entorno en un Barrio Aledaño al Río Suquía de Córdoba, Argentina, en el Contexto Actual de Cambio Climático y Contaminación Hídrica. Universidad Nacional de Córdoba: Cordoba, Argentina, 2023. [Google Scholar]
- Censos–Ejes Temáticos–Dirección General de Estadística y Censos. Available online: https://datosestadistica.cba.gov.ar/dataset/censo-2022-resultados-definitivos (accessed on 4 July 2025).
- López, S. Diseño e Imp$lementación de un Proyecto Participativo para Evaluar el Riesgo de Inundaciones y Anegamientos Urbanos: Caso de Aplicación: Barrio Villa Páez, Córdoba, Argentina. Master’s Thesis, National University of Cordoba, Cordoba, Argentina, 2022. [Google Scholar]
- Weber, J. Parámetros del Modelo de Pérdidas CN-SCS para Áreas Permeables de la Ciudad de Córdoba. In Proceedings of the V International Congress on Integral Water Management and Treatment, Cordoba, Argentina, 12–14 November 2014; p. 12. [Google Scholar]
- López, S.; Massó, L.; Portigliatti, A.; Patalano, A.; Kazimierski, L.; Diaz Lozada, J.M.; Re, M.; García, C.M. Implementación de Proyectos de Ciencia Ciudadana en el Diseño y Evaluación de Medidas para Mitigar el Riesgo Hídrico de Inundaciones Urbanas. In Proceedings of the XXIX Congreso Latinoamericano de Hidraúlica, Acapulco, Mexico, 15–19 November 2021. [Google Scholar]
- Rossman, L.A. Storm Water Management Model User’s Manual Version 5.1; EPA Office of Research and Development: Washington, DC, USA, 2015.
- López, S.; Diaz Lozada, J.M.; Massó, L.; Portigliatti, A.; Gaitán, P.; Strusberg, I.; Elorza, A.L.; Kazimierski, L.; Re, M.; Vanoni, S.; et al. Ciencia Participativa Para El Mapeo de Amenazas Hídricas en Comunidad Vulnerable de la Ciudad de Córdoba; XXVII Congreso Nacional del Agua: Buenos Aires, Argentina, August 2023; pp. 196–197. [Google Scholar]
- Rico, A.; Elcano, G.; Guillén, N.; Eder, M.; Terré, M.F. Actualización Curvas IDF Cordoba; Instituto Nacional del Agua (INA): Ezeiza, Argentina; Facultad de Ciencias Exactas, Físicas y Naturales (FCEFyN): Cordoba, Argentina; Servicio Meteorológico Nacional (SMN): Buenos Aires, Argentina, 2024; p. 1.
- Rossman, L.A. Storm Water Management Model Reference Manual Volume III–Water Quality; EPA Office of Research and Development: Washington, DC, USA, 2016.
- Bagheri, K.; Davani, H.; Biggs, T.; McMillan, H. Hydrodynamic Simulations for Trash Loading in Southern California’s Dense Urbanized Watersheds. J. Environ. Eng. 2024, 150, 04024031. [Google Scholar] [CrossRef]
- Van Emmerik, T.; Schwarz, A. Plastic Debris in Rivers. WIREs Water 2020, 7, e1398. [Google Scholar] [CrossRef]
- Características Físicas de los Residuos Sólidos Urbanos—Ambientum. Ambientum Portal Lider Medioambiente. 2022. Available online: https://www.ambientum.com/enciclopedia_medioambiental/suelos/caracteristicas_fisicas.asp (accessed on 2 July 2025).
- Mellink, Y.; Van Emmerik, T.; Kooi, M.; Laufkötter, C.; Niemann, H. The Plastic Pathfinder: A Macroplastic Transport and Fate Model for Terrestrial Environments. Front. Environ. Sci. 2022, 10, 979685. [Google Scholar] [CrossRef]
- Clayer, F.; Norling, M.D.; Fürst, K.; Hurley, R.; Creencia, G.B.A.; Msojica, D.Z.P.; Dizon, J.C.R.; Lin, Y.; Nizzetto, L.; Sedigo, N.A.; et al. Modelling Plastic Fluxes with INCA-Macroplastics in the Imus Catchment: Impacts of Long-Term Accumulation and Extreme Events. Environ. Res. Lett. 2024, 19, 015001. [Google Scholar] [CrossRef]
- Huthoff, F.; Wegman, C.; Schreyers, L.J.; van Emmerik, T. A Transport and Accumulation Model for Macroplastics in Rivers; CRC Press: Boca Raton, FL, USA, 2025; pp. 683–689. [Google Scholar]
- Cadena 3 Argentina. El Basural en Plena Calle de Villa Páez Sigue Intacto—Notas—Viva la Radio. Available online: https://www.cadena3.com/noticia/viva-la-radio/el-basural-en-plena-calle-de-villa-paez-sigue-intacto_213572 (accessed on 2 March 2025).


| Scenario | Dry Period (days) | Plastic Bags per 100 m | Plastic Mass Per Bag (kg) | Plastic per 100 m (kg) | C1 (kg/ha) | C2 (kg/ha) | C3 |
|---|---|---|---|---|---|---|---|
| Scenario 1 | 7 | 1 | 1.05 | 1.05 | 4.11 | 0.587 | 1 |
| Scenario 2 | 30 | 4 | 1.05 | 4.20 | 16.44 | 0.548 | 1 |
| Question | Response | Percentage |
|---|---|---|
| Do you have municipal waste collection at your home? | Yes (203) respondents | 92% |
| No (18 respondents) | 8% | |
| Do you have differentiated (separated) waste collection? | No | 86% |
| Yes | 8% | |
| Frequency of municipal waste collection | 6 days a week | 80% |
| Less than 6 days a week | 15% | |
| Not specified/other | 5% | |
| Has waste collection ever been interrupted for more than a week due to extreme weather? | No | 63% |
| Yes | 24% | |
| Don’t know | 14 | |
| Are there garbage accumulation points near your home? | Yes | 51% |
| No | 45% | |
| Don’t know | 4% |
| Return Time (Years) | ||||||
|---|---|---|---|---|---|---|
| 2 | 5 | 10 | 25 | 50 | 100 | |
| Initial Accumulation (kg) | 148.79 | 148.79 | 148.79 | 148.79 | 148.79 | 148.79 |
| Residual Accumulation (kg) | 7.87 | 7.84 | 7.83 | 7.82 | 7.81 | 7.80 |
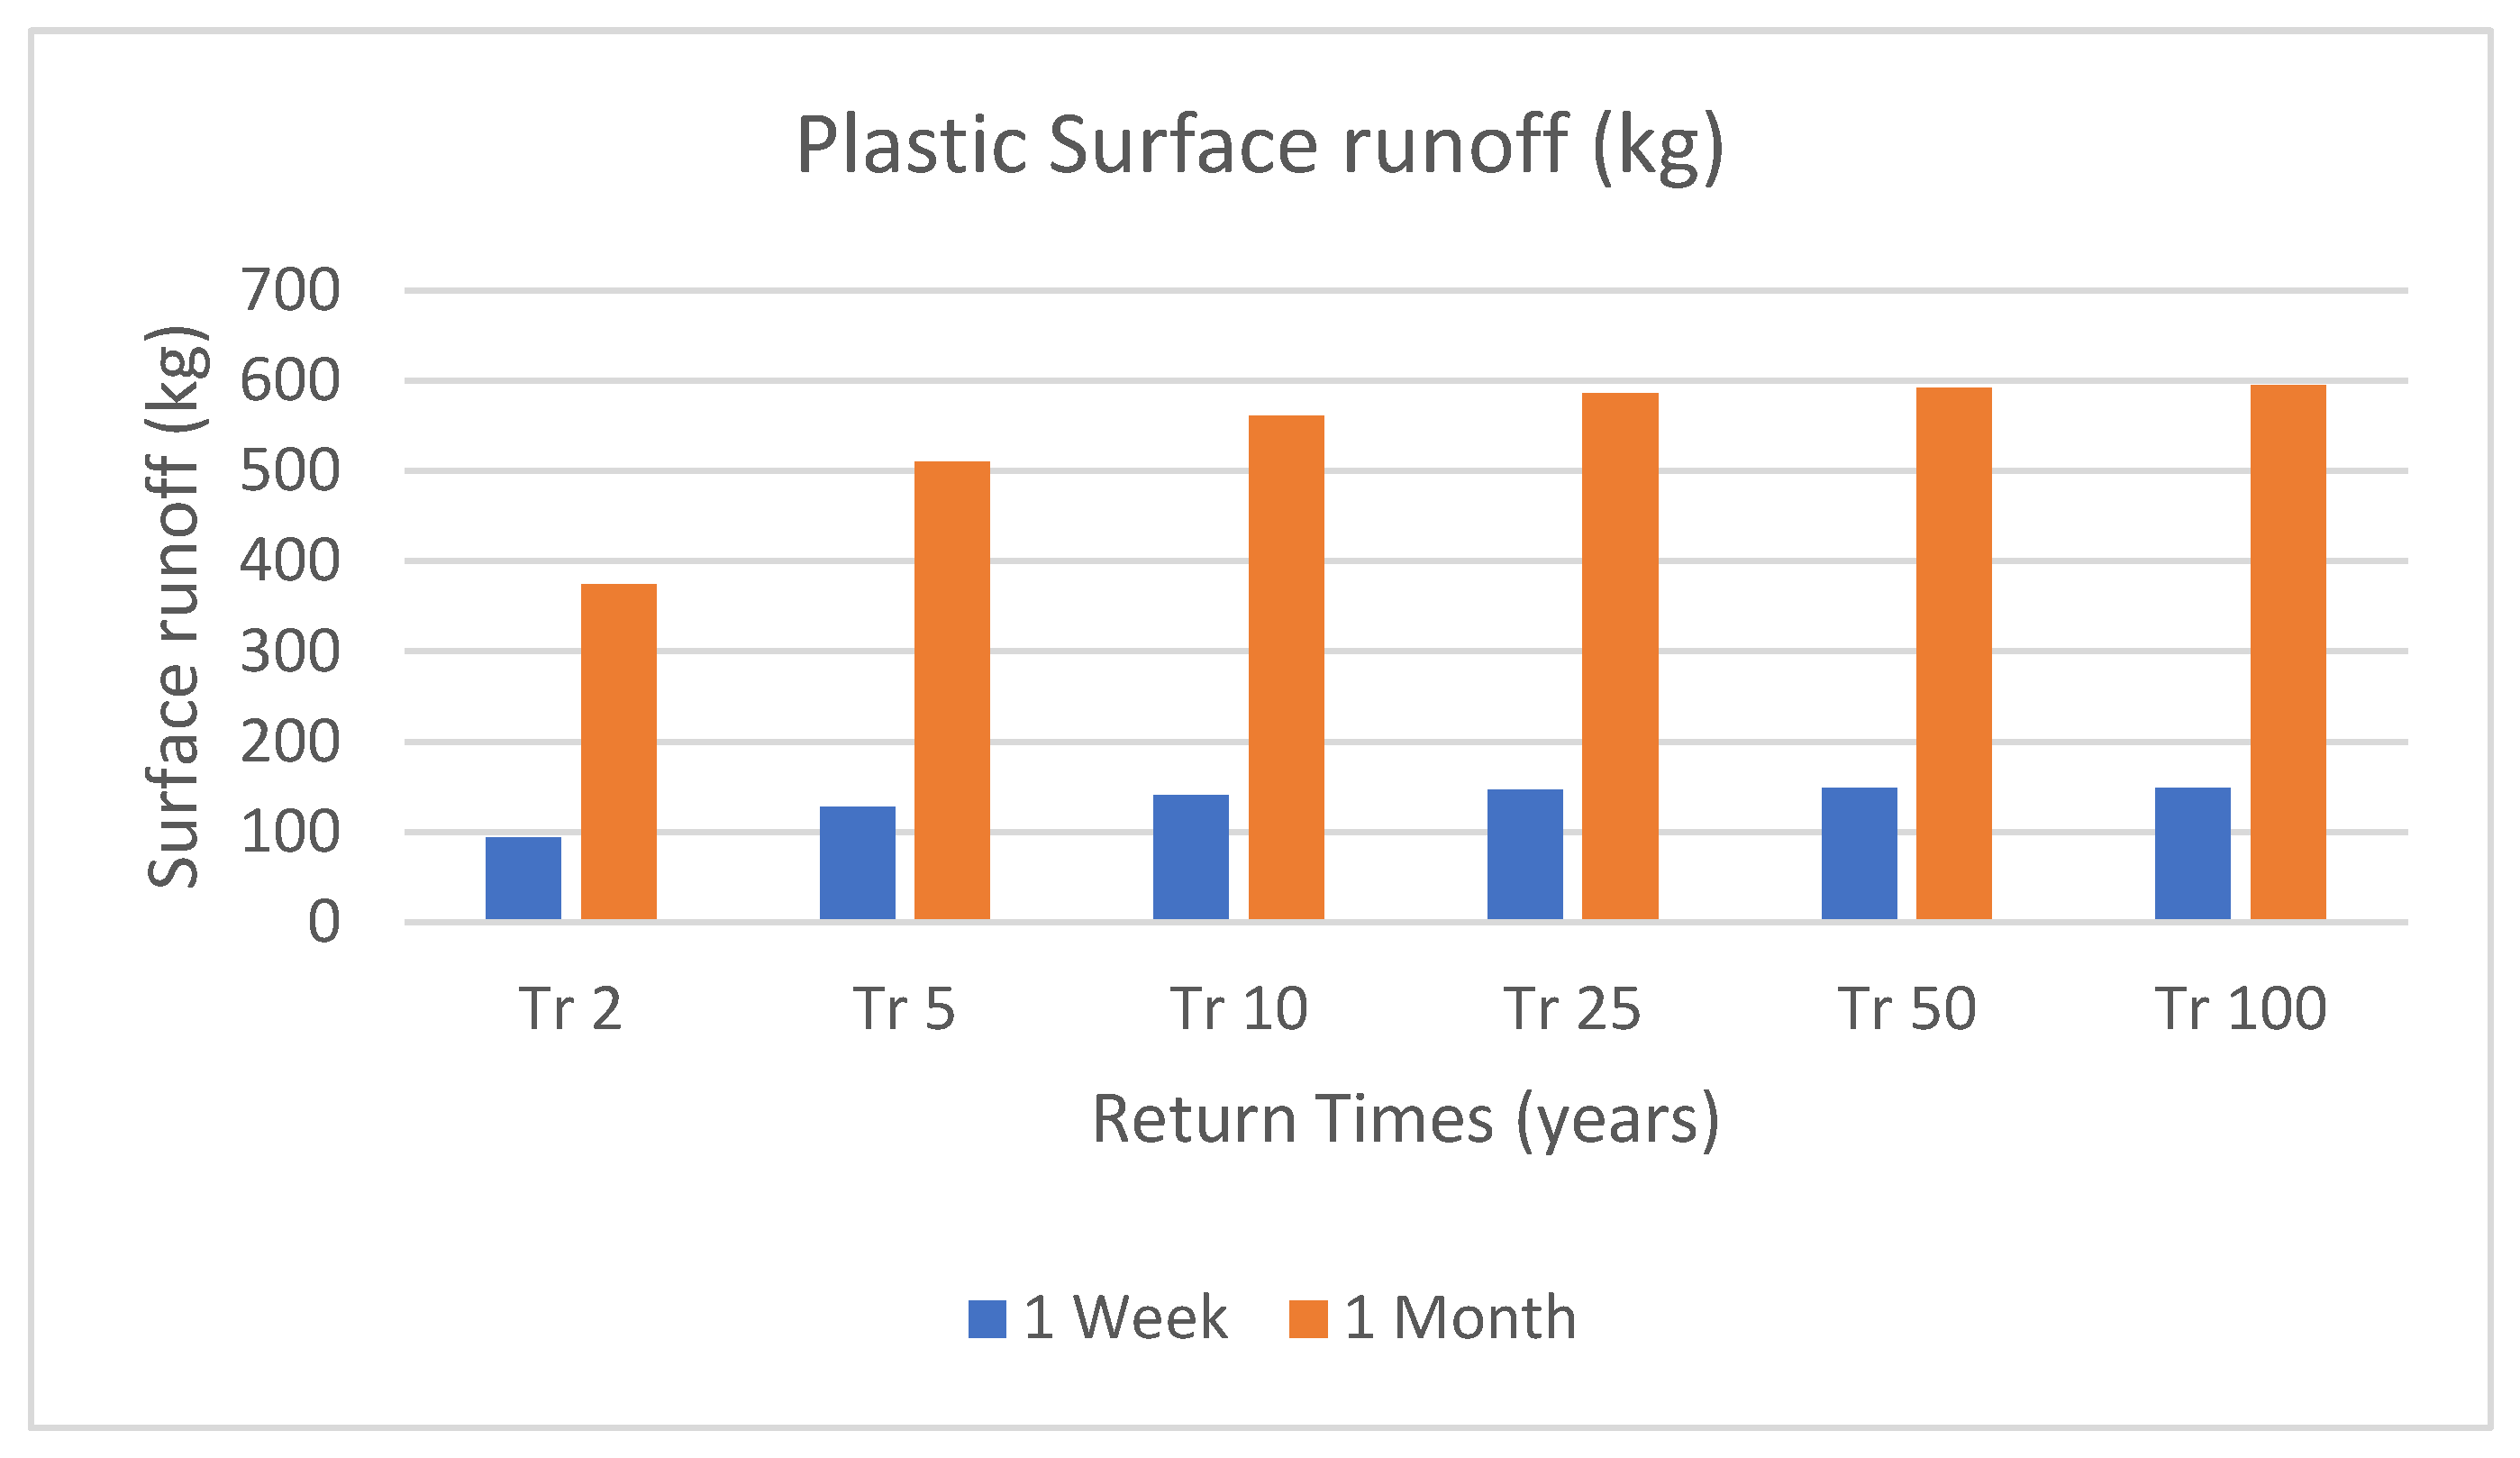
| Surface runoff (kg) | 93.67 | 127.55 | 140.18 | 146.57 | 148.15 | 148.72 |
| Remaining Accumulation (kg) | 62.99 | 29.09 | 16.44 | 10.05 | 8.46 | 7.87 |
| Remaining Accumulation % | 42.33 | 19.55 | 11.05 | 6.75 | 5.69 | 5.29 |
| Tr (Years) | ||||||
|---|---|---|---|---|---|---|
| 2 | 5 | 10 | 25 | 50 | 100 | |
| Initial Accumulation (kg) | 595.40 | 595.40 | 595.40 | 595.40 | 595.40 | 595.40 |
| Residual Accumulation (kg) | 7.74 | 7.71 | 7.70 | 7.69 | 7.68 | 7.67 |
| Surface runoff (kg) | 374.74 | 510.26 | 560.80 | 586.34 | 592.66 | 594.98 |
| Remaining Accumulation (kg) | 228.4 | 92.85 | 42.30 | 16.75 | 10.42 | 8.09 |
| Remaining Accumulation % | 38.36 | 15.59 | 7.10 | 2.81 | 1.75 | 1.36 |
Disclaimer/Publisher’s Note: The statements, opinions and data contained in all publications are solely those of the individual author(s) and contributor(s) and not of MDPI and/or the editor(s). MDPI and/or the editor(s) disclaim responsibility for any injury to people or property resulting from any ideas, methods, instructions or products referred to in the content. |
© 2025 by the authors. Licensee MDPI, Basel, Switzerland. This article is an open access article distributed under the terms and conditions of the Creative Commons Attribution (CC BY) license (https://creativecommons.org/licenses/by/4.0/).
Share and Cite
Funes, M.F.; Reyna, T.M.; García, C.M.; Lábaque, M.; López, S.; Strusberg, I.; Vanoni, S. Estimating Macroplastic Mass Transport from Urban Runoff in a Data-Scarce Watershed: A Case Study from Cordoba, Argentina. Sustainability 2025, 17, 6177. https://doi.org/10.3390/su17136177
Funes MF, Reyna TM, García CM, Lábaque M, López S, Strusberg I, Vanoni S. Estimating Macroplastic Mass Transport from Urban Runoff in a Data-Scarce Watershed: A Case Study from Cordoba, Argentina. Sustainability. 2025; 17(13):6177. https://doi.org/10.3390/su17136177
Chicago/Turabian StyleFunes, María Fernanda, Teresa María Reyna, Carlos Marcelo García, María Lábaque, Sebastián López, Ingrid Strusberg, and Susana Vanoni. 2025. "Estimating Macroplastic Mass Transport from Urban Runoff in a Data-Scarce Watershed: A Case Study from Cordoba, Argentina" Sustainability 17, no. 13: 6177. https://doi.org/10.3390/su17136177
APA StyleFunes, M. F., Reyna, T. M., García, C. M., Lábaque, M., López, S., Strusberg, I., & Vanoni, S. (2025). Estimating Macroplastic Mass Transport from Urban Runoff in a Data-Scarce Watershed: A Case Study from Cordoba, Argentina. Sustainability, 17(13), 6177. https://doi.org/10.3390/su17136177