Abstract
This study investigates the adsorption performance of biochar synthesized under varying pyrolysis and CO2 activation conditions for the simultaneous removal of nitrogen monoxide (NO) and sulfur dioxide (SO2), with an additional focus on its environmental impacts via life cycle assessment (LCA). Biochar was produced from Hinoki cypress using a two-stage process comprising initial pyrolysis followed by CO2 activation, and its physicochemical properties were evaluated through pore structure analysis. Adsorption experiments were conducted under both single- and combined-gas conditions to assess the synergistic or competitive behaviors of NO and SO2 adsorption. The results indicated that activation conditions significantly influenced the surface area and pore volume of biochar, leading to enhanced gas adsorption capacities. A trade-off between biochar yield and pollutant removal efficiency was observed, suggesting an optimal activation temperature balancing these two factors. Furthermore, the LCA approach, employing IPCC 2021 GWP 100 metrics, quantified the environmental impacts of biochar production under different thermal conditions. The findings revealed that although higher activation temperatures improved adsorption efficiency, they also resulted in increased energy consumption and associated greenhouse gas emissions. These outcomes demonstrate the necessity of optimizing activation parameters not only for functional performance but also for environmental sustainability. This work provides insight into designing efficient biochar-based gas treatment systems and supports their potential application as eco-friendly alternatives in industrial emission control strategies.
1. Introduction
The combustion of fossil fuels across major industrial sectors—including power generation, waste incineration, and cement manufacturing—emits substantial quantities of gaseous pollutants such as sulfur dioxide (SO2) and nitrogen oxides (NOx) [1]. To mitigate NOx emissions, industrial facilities commonly implement selective catalytic reduction (SCR) and selective non-catalytic reduction (SNCR) systems [2,3,4]. However, SCR requires high-temperature operations and costly catalyst materials, resulting in elevated installation and energy expenditures. Conversely, SNCR demands large quantities of ammonia or urea to attain effective reduction efficiencies, imposing additional economic burdens [5,6].
For the removal of acid gases such as SO2, HCl, HF, and water-soluble mercury, flue gas desulfurization (FGD) systems are widely employed [7,8]. Among these, wet FGD is the predominant method used for SO2 abatement, although it is associated with high operational costs and the generation of secondary byproducts [9]. Semi-dry desulfurization, while offering lower operating costs and simplified infrastructure—such as the absence of reheating and wastewater treatment—is typically less efficient than wet FGD and is often used for retrofitting existing plants.
In contrast, adsorption-based technologies present a promising, cost-effective alternative for flue gas purification. These systems offer advantages, including simple reactor design, ease of operation, effective pollutant removal, and minimal secondary pollution [10]. Adsorbents used for this purpose are generally classified into metal-based and carbon-based categories. Metal-based adsorbents, despite their high reactivity, are limited by narrow operational temperature ranges, high costs, and limited recyclability [11]. Carbon-based adsorbents, particularly activated carbon (AC), are more favorable due to their recyclability, chemical and thermal stability, and well-developed surface functional groups and porosity. AC has long been employed for the removal of pollutants such as SO2, NOx, volatile organic compounds (VOCs), and mercury and remains a widely used adsorbent across industrial applications [12,13]. However, its practical deployment is hindered by limitations in catalytic activity, stability during pollutant removal, and insufficient efficiency in simultaneous desulfurization and denitrification, often necessitating large quantities for effective flue gas treatment [14].
To enhance the adsorption capacity of AC, chemical activation is frequently applied. Yet this approach entails high chemical usage and considerable water consumption during post-treatment, significantly increasing operational costs and restricting large-scale adoption [15,16]. In recent years, biochar derived from waste biomass has emerged as a sustainable and cost-effective alternative to commercial AC [17]. Various biomass feedstocks, including wood, agricultural residues, and food waste, offer abundant, low-cost, and renewable sources for biochar production [18,19,20]. Biochar serves as a viable adsorbent for flue gas purification, particularly by reducing the pollutant load on existing SCR and FGD systems, thus lowering operating costs and enhancing overall system efficiency. Additionally, biochar saturated with adsorbed pollutants can be applied to soil as a stabilization medium, promoting pollutant immobilization and resource recycling with minimal environmental impact [21,22].
As biochar gains attention from industries in pollutant adsorption and carbon sequestration, its quantification for environmental impact becomes essential. Life cycle assessment (LCA) provides a systematic approach to quantify biochar production and use, from raw material to manufacturing. Particularly for industrial applications involving energy-intensive pyrolysis or activation processes, LCA helps assess trade-offs between enhanced performance and increased emissions [23]. For example, while high-temperature pyrolysis improves surface area and adsorption efficiency, it may lead to higher greenhouse gas emissions and lower yield [24]. Moreover, biochar’s environmental footprint varies widely depending on feedstock type, reactor design, and energy source [25]. Therefore, integrating LCA into biochar research is crucial for identifying environmental impacts and guiding sustainable process optimization.
The objective of this study was to identify the optimal activation conditions that enhance the adsorption efficiencies of NO and SO2 while maintaining a viable biochar yield. Biochar was produced from Hinoki cypress through a two-step process involving pyrolysis followed by CO2 activation. The pore structure and physicochemical properties of both pyrolyzed and CO2-activated biochar were characterized, and their adsorption performance was evaluated under both single and simultaneous NO and SO2 exposure conditions. To establish a balance between pollutant removal efficiency and material yield, the relationship between activation temperature, surface characteristics, and adsorption capacity was systematically analyzed. Furthermore, a life cycle assessment (LCA) was conducted to quantify the environmental impacts associated with different biochar production and activation conditions, using a unified functional unit based on pollutant removal. This integrative approach offers insights into both the technical performance and environmental sustainability of biochar as a cost-effective adsorbent for industrial air pollution control.
2. Materials and Methods
2.1. Synthesis of Biochar Through Pyrolysis and Analysis of It
The raw biomass used in this study was commercially purchased cypress (Chamaecyparis obtusa), a representative lignocellulosic. The physicochemical properties of the untreated biomass are summarized in Table 1. Proximate analysis revealed a moisture content of 11.4%, volatile matter content of 76.6%, fixed carbon content of 11.8%, and ash content of 0.2%. Elemental analysis showed the composition to be 46.32 wt.% carbon, 5.84 wt.% hydrogen, and 47.6 wt.% oxygen (calculated by difference). The Brunauer–Emmett–Teller (BET) specific surface area was measured as 0.758 m2/g, indicating limited pore development in the untreated structure.

Table 1.
Physicochemical properties of biomass (Chamaecyparis obtusa).
Figure 1 presents a schematic of the laboratory-scale fixed-bed pyrolysis system used for biochar production under various pyrolysis and activation conditions. The reactor, containing 100 g of cube-shaped biomass, had an inner diameter of 50 mm and height of 250 mm and was designed to maintain uniform temperature distribution. Pyrolysis was conducted by heating the reactor at a rate of 10 °C/min using external electric heaters until the target temperatures (500 °C, 600 °C, and 700 °C) were reached. These temperatures were maintained for 4 h to ensure complete pyrolysis. The selection of these temperatures was based on previous studies indicating that biochar produced within this range shows optimal pore structure and adsorption properties [26]. Electricity consumption during the heating process was measured using a power meter (Wattman HPM-100A, Noise Tech Co., Ltd. Seong-nam, Republic of Korea) for further use in the life cycle assessment. Nitrogen gas was supplied at a flow rate of 5 L/min (LPM) using a mass flow controller (VIC-D200; MFC KOREA, Incheon, Republic of Korea) to maintain an oxygen-free environment inside the reactor. For activation, pure CO2 gas was introduced at the same flow rate (5 LPM) after completion of the nitrogen-purged pyrolysis step. The activation process lasted for 3 h.
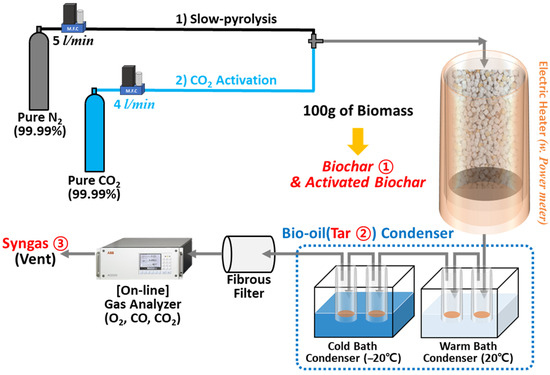
Figure 1.
Schematic illustration of the synthesis process of biochar (B.C) and activated biochar (A.B.C).
The vapors generated during pyrolysis passed through a condensation system consisting of two baths at 20 °C (warm) and −20 °C (cold) to collect tar fractions. Non-condensable gases were passed through a particulate filter and analyzed with an online non-dispersive infrared (NDIR) gas analyzer to ensure the absence of oxygen and monitor CO concentration, which served as an indicator for the completion of pyrolysis. The product yields from pyrolysis were determined by calculating the mass ratios of biochar, tar, and gas relative to the raw biomass. The masses of biochar and tar were directly measured, while gas mass was estimated by subtracting the measured masses from the initial biomass weight. The resulting solid residues were designated as B.C. (biochar) and A.B.C. (activated biochar) depending on whether activation was performed.
The physicochemical properties of the synthesized biochar were characterized as follows: elemental composition was analyzed using a elemental analyzer (CE Instruments EA 1108, Carlo Erba, MA, USA) with oxygen content calculated by difference. BET surface area and pore volume were determined using N2 adsorption (Tristar 3020, Micromeritics, GA, USA) and mercury porosimetry (AutoPore 4 9250, Micromeritics, GA, USA), respectively. Morphological analysis was performed using field emission scanning electron microscopy (FE-SEM, S-4800, Hitachi, Tokyo, Japan), and images were post-processed using ImageJ software (https://imagej.net/ij/, developed by National Institute of Health, MD, USA).
2.2. Evaluation of Adsorption Performance of Biochar
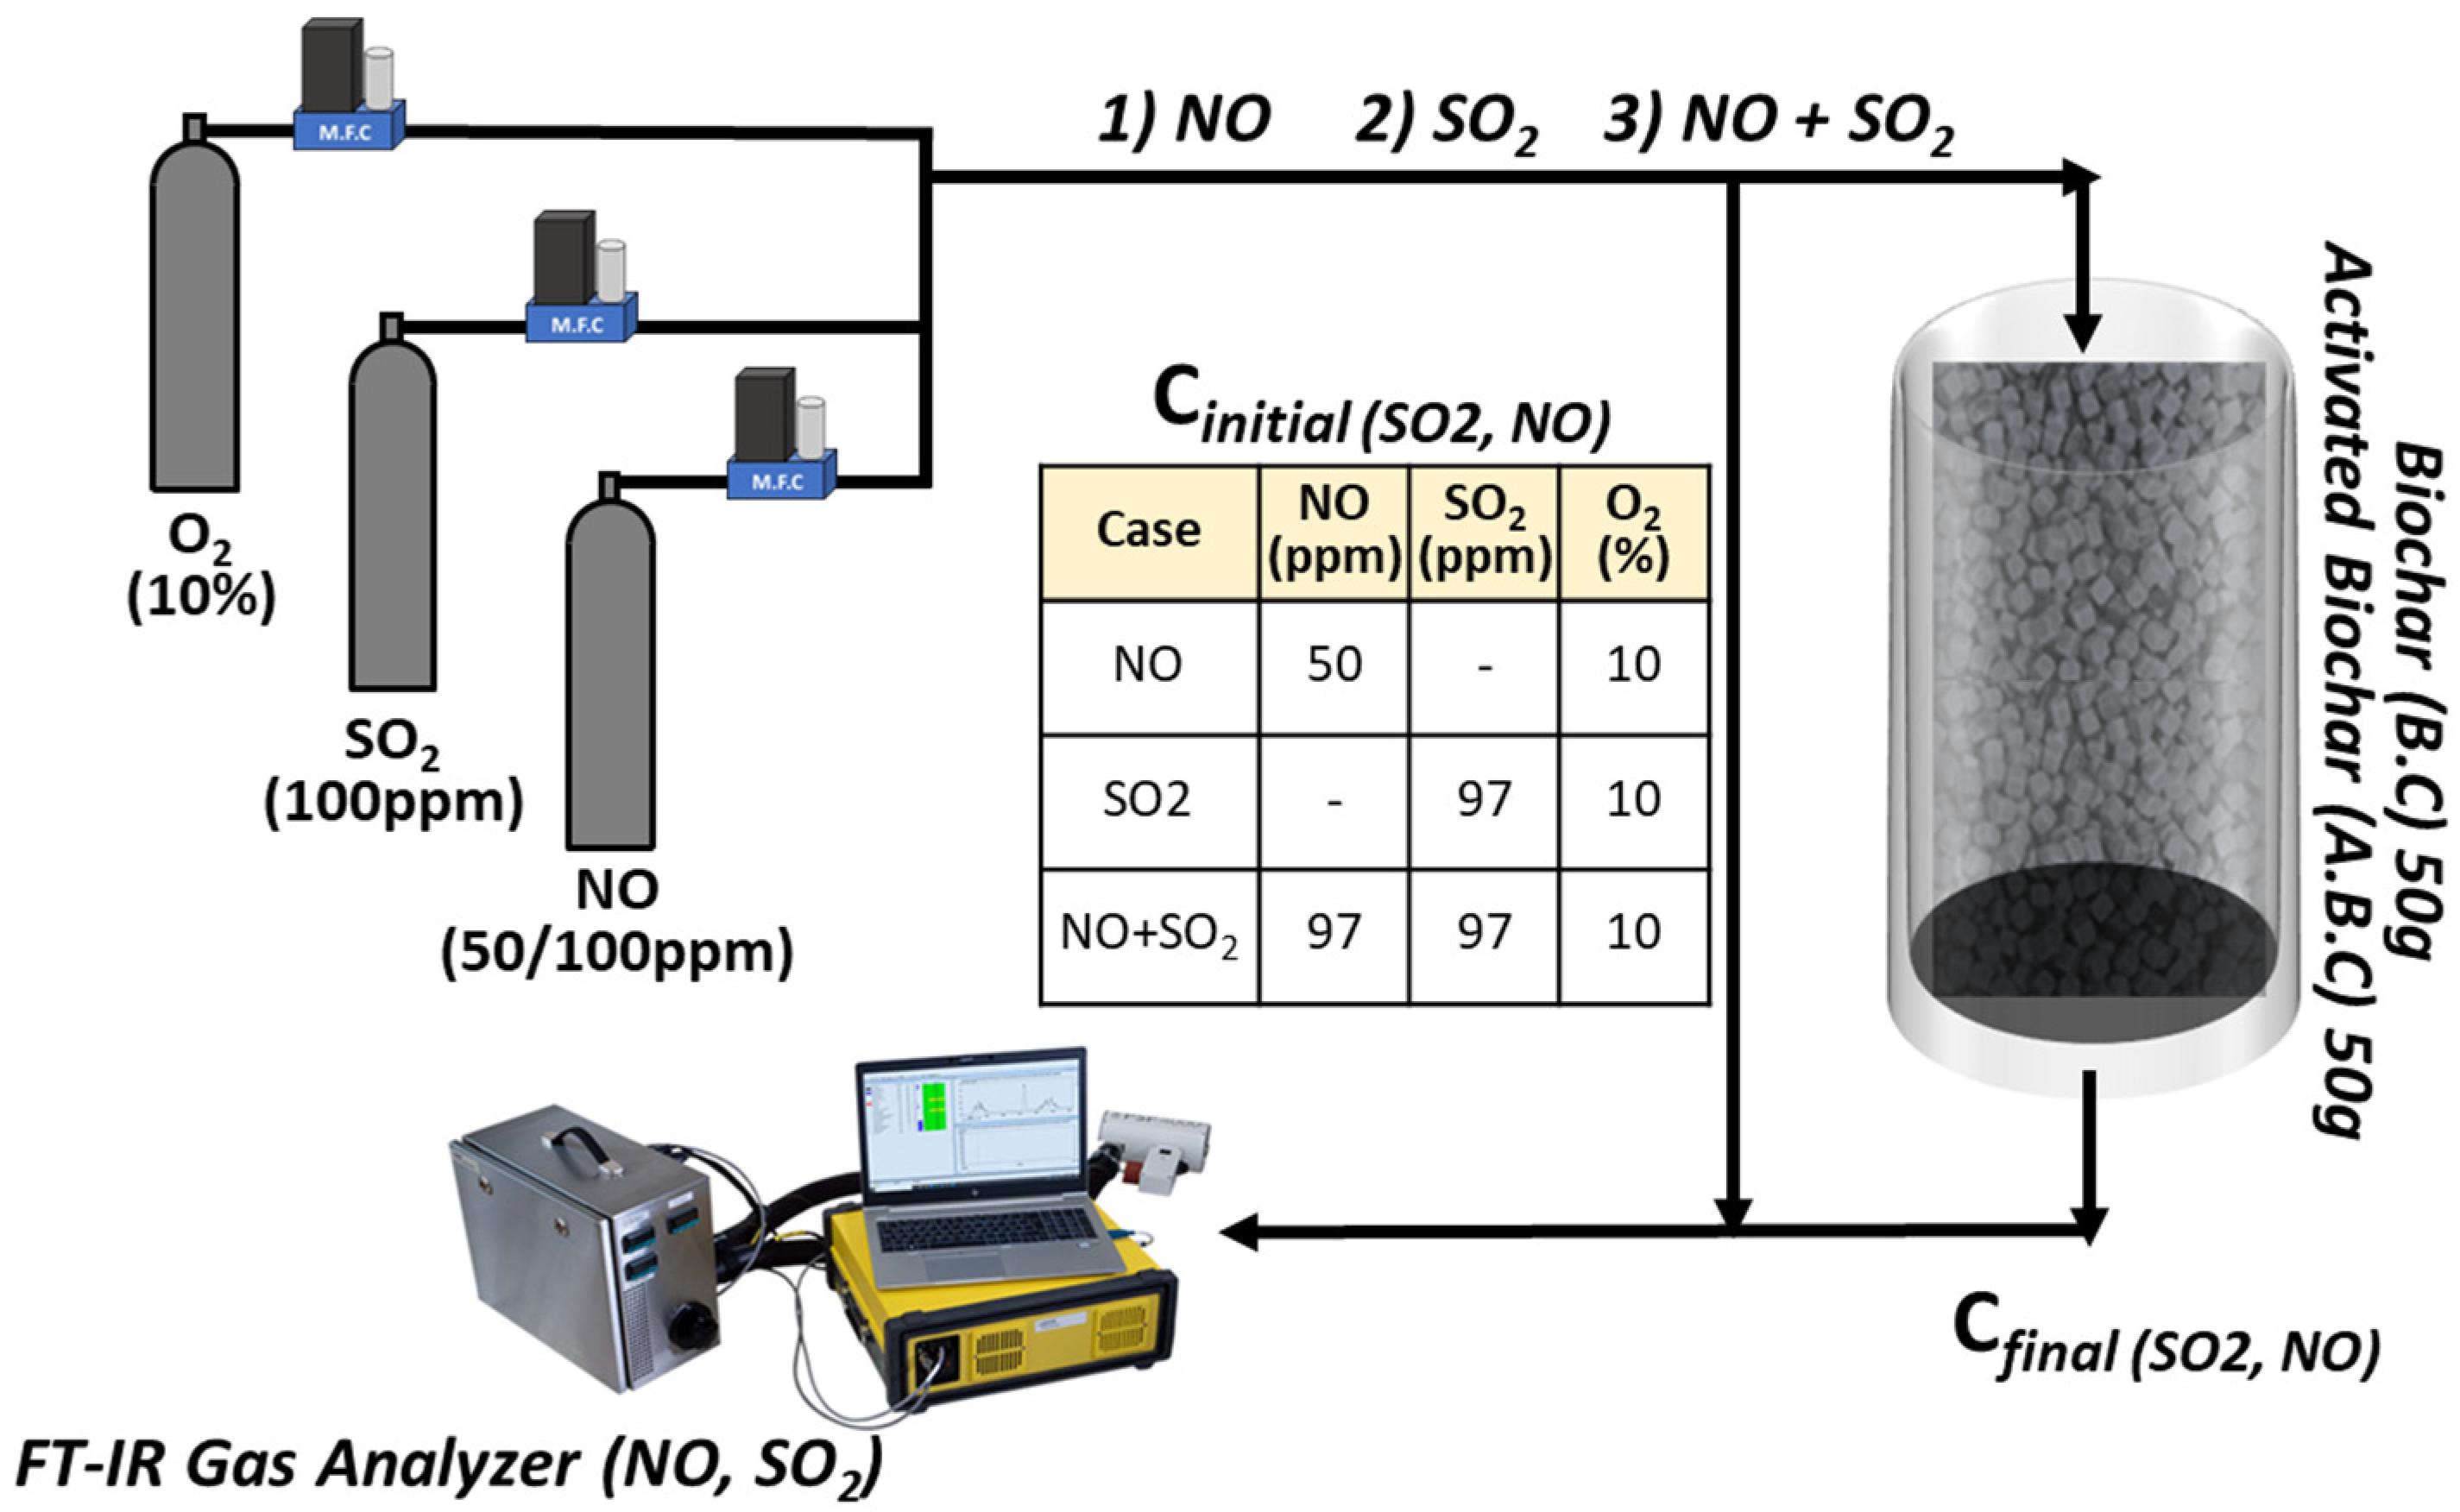
Figure 2 illustrates the experimental setup used to evaluate the adsorption performance of synthesized biochar. A total of 50 g of biochar was packed into an adsorption chamber, and a gas mixture containing either NO, SO2, or both (each diluted with 10% oxygen) was introduced. The initial concentrations of the gases are presented in Table of Figure 2. When the gas stream stabilized and passed the bypass line, the gas was directed through the biochar-filled chamber. Outlet concentrations of NO and SO2 were continuously monitored for 6 h using a Fourier-transform infrared (FT-IR) spectrometer (DX4000, Gasmet Technologies, Vantaa, Finland).

Figure 2.
Schematic illustration of the experimental setup for gas adsorption using B.C and A.B.C.
Blank experiments with an empty chamber were conducted before each test for calibration. Adsorption experiments were performed both individually (NO or SO2 only) and simultaneously (NO and SO2 together). Individual experiments assessed the removal efficiency of each gas, while simultaneous experiments evaluated potential co-adsorption effects. Identical conditions were applied to compare the adsorption performance of biochar and activated biochar based on pore structure and surface properties. The adsorption efficiencies for NO and SO2 were calculated using the following formulae, where Cin and Cout represent the inlet and outlet gas concentrations, respectively.
2.3. Life Cycle Assessment-Based Carbon Dioxide Emission of Gas Adsorption by Biochar
To assess the environmental impact of using biochar and activated biochar for air pollutant adsorption, a life cycle assessment (LCA) was conducted. This LCA focused on greenhouse gas emissions associated with different pyrolysis and activation conditions, under the assumption of identical pollutant adsorption performance. Figure A1 presents the system boundary for the LCA, which includes the input of wood biomass, nitrogen, and CO2 (for activation only) and electricity consumption. Gas volumes were calculated based on flow rates (5 LPM) and operational durations (4 h for pyrolysis and 3 h for activation). Figure A2 describes the measured electricity consumption of electric heater with time. Electricity consumption for heating was recorded at 0.488 kWh, 0.617 kWh, and 0.839 kWh to reach 500 °C, 600 °C, and 700 °C, respectively. Activation required approximately double the energy input for each corresponding temperature.
The functional unit (FU) was defined as the total mass of NO and SO2 adsorbed during 6 h of simultaneous adsorption, calculated based on the adsorption efficiencies. The LCA was conducted using SimaPro software (version 10.4, PRé Sustainability B.V.), with the Ecoinvent 3.10 database used for life cycle inventories of materials and electricity. The IPCC 2021 methodology (GWP 100) was applied for greenhouse gas impact assessment.
3. Results and Discussion
3.1. Characteristics of Biochar and Activated Biochar
Table 2 presents the yields of pyrolysis products obtained under slow pyrolysis and CO2 activation conditions. As the pyrolysis temperature increased from 500 °C to 700 °C, the yield of biochar decreased from 21.1 wt.% to 19.4 wt.%, whereas the yields of bio-oil and pyrolysis gases showed a slight increase (oil: 48.8–49.7 wt.%; gas: 30.1–30.9 wt.%). Following CO2 activation, the biochar yield further decreased compared to the non-activated samples. Notably, at 700 °C, the activated biochar yield was reduced to 15.1 wt.%, in contrast to the value of 19.4 wt.% obtained from pyrolysis alone.
Table 2.
Mass yield of Char, Tar and Gas from slow pyrolysis of biomass (Chamaecyparis obtusa).
Table 3 summarizes the elemental composition and BET surface area of the raw biomass and the biochar produced via pyrolysis and subsequent CO2 activation. The carbon content of the raw biomass was 46.32 wt.%, which increased with rising pyrolysis temperatures and further increased through activation. Specifically, the carbon content of the biochar increased from 81.2 wt.% to 85.6 wt.% as the pyrolysis temperature rose from 500 °C to 700 °C. Following CO2 activation, the carbon content was further elevated, ranging from 88.3 wt.% to 91.8 wt.%, confirming the enhanced carbonization effect of the activation process.
Table 3.
Elemental composition (C, H, O, N) and Brunauer–Emmett–Teller (BET) specific surface area of pristine biomass and biochar under various pyrolysis and activation conditions.
The thermal decomposition behavior of typical lignocellulosic biomass predominantly occurs at temperatures below 500 °C. The hemicellulose and cellulose fractions, composed primarily of sugar monomers, degrade into low-molecular-weight pyrolysis vapors at relatively low temperatures ranging from 250 °C to 400 °C [27]. In contrast, lignin, which is characterized by its aromatic carbon structure, begins to decompose gradually within the same range but exhibits more substantial thermal degradation above 400 °C.
Given the high volatile matter (VM) content of the biomass used in this study, significant devolatilization reactions occurred primarily below 500 °C. As the pyrolysis temperature increased to 600 °C and 700 °C, further decomposition of lignin occurred, but the biochar yield showed only marginal reductions, indicating that most of the mass loss had already occurred at lower temperatures. Compared to the raw biomass, the VM content decreased significantly at 500 °C due to devolatilization, while the fixed carbon (FC) content increased to approximately 75%. At 700 °C, a small amount of residual VM remained, likely originating from slowly decomposing lignin, which continues to degrade over a broad temperature range.
A significant increase in BET surface area was observed after pyrolysis. The surface area of the pristine biomass (0.758 m2/g) increased substantially to values between 380 and 552 m2/g. Interestingly, the biochar produced at 700 °C showed a relatively lower surface area compared to that produced at 600 °C. Upon activation, additional increases in surface area were observed at 500 °C and 700 °C—from 538 to 680 m2/g, respectively—while the sample pyrolyzed at 600 °C showed minimal change. Compared to commercial activated carbon, which typically exhibits surface areas of approximately 1000 m2/g, the surface areas of the biochar produced in this study were relatively lower [28].
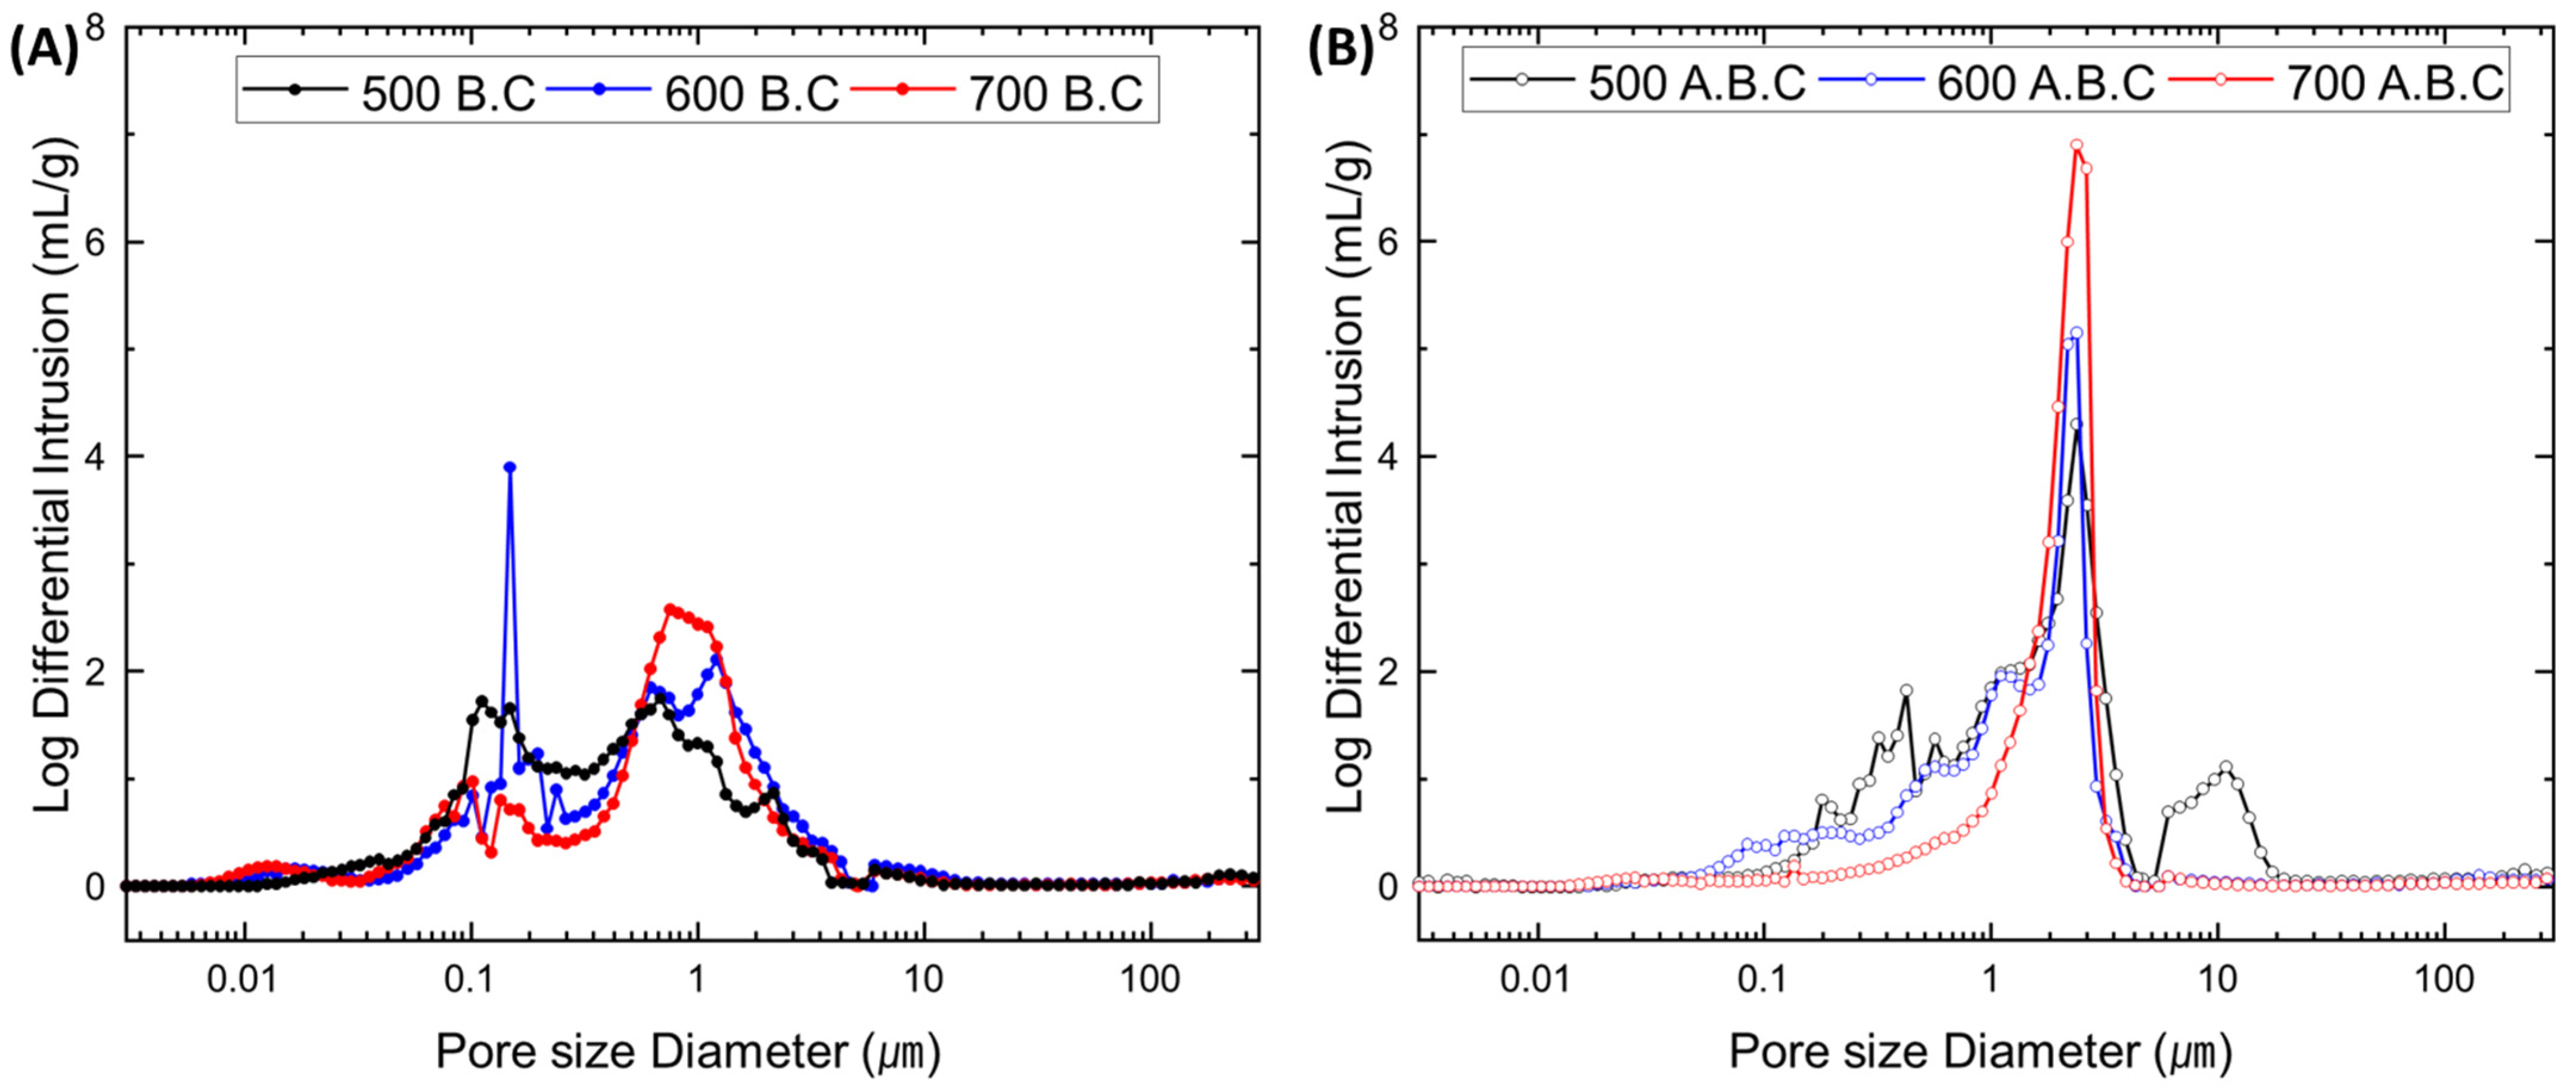
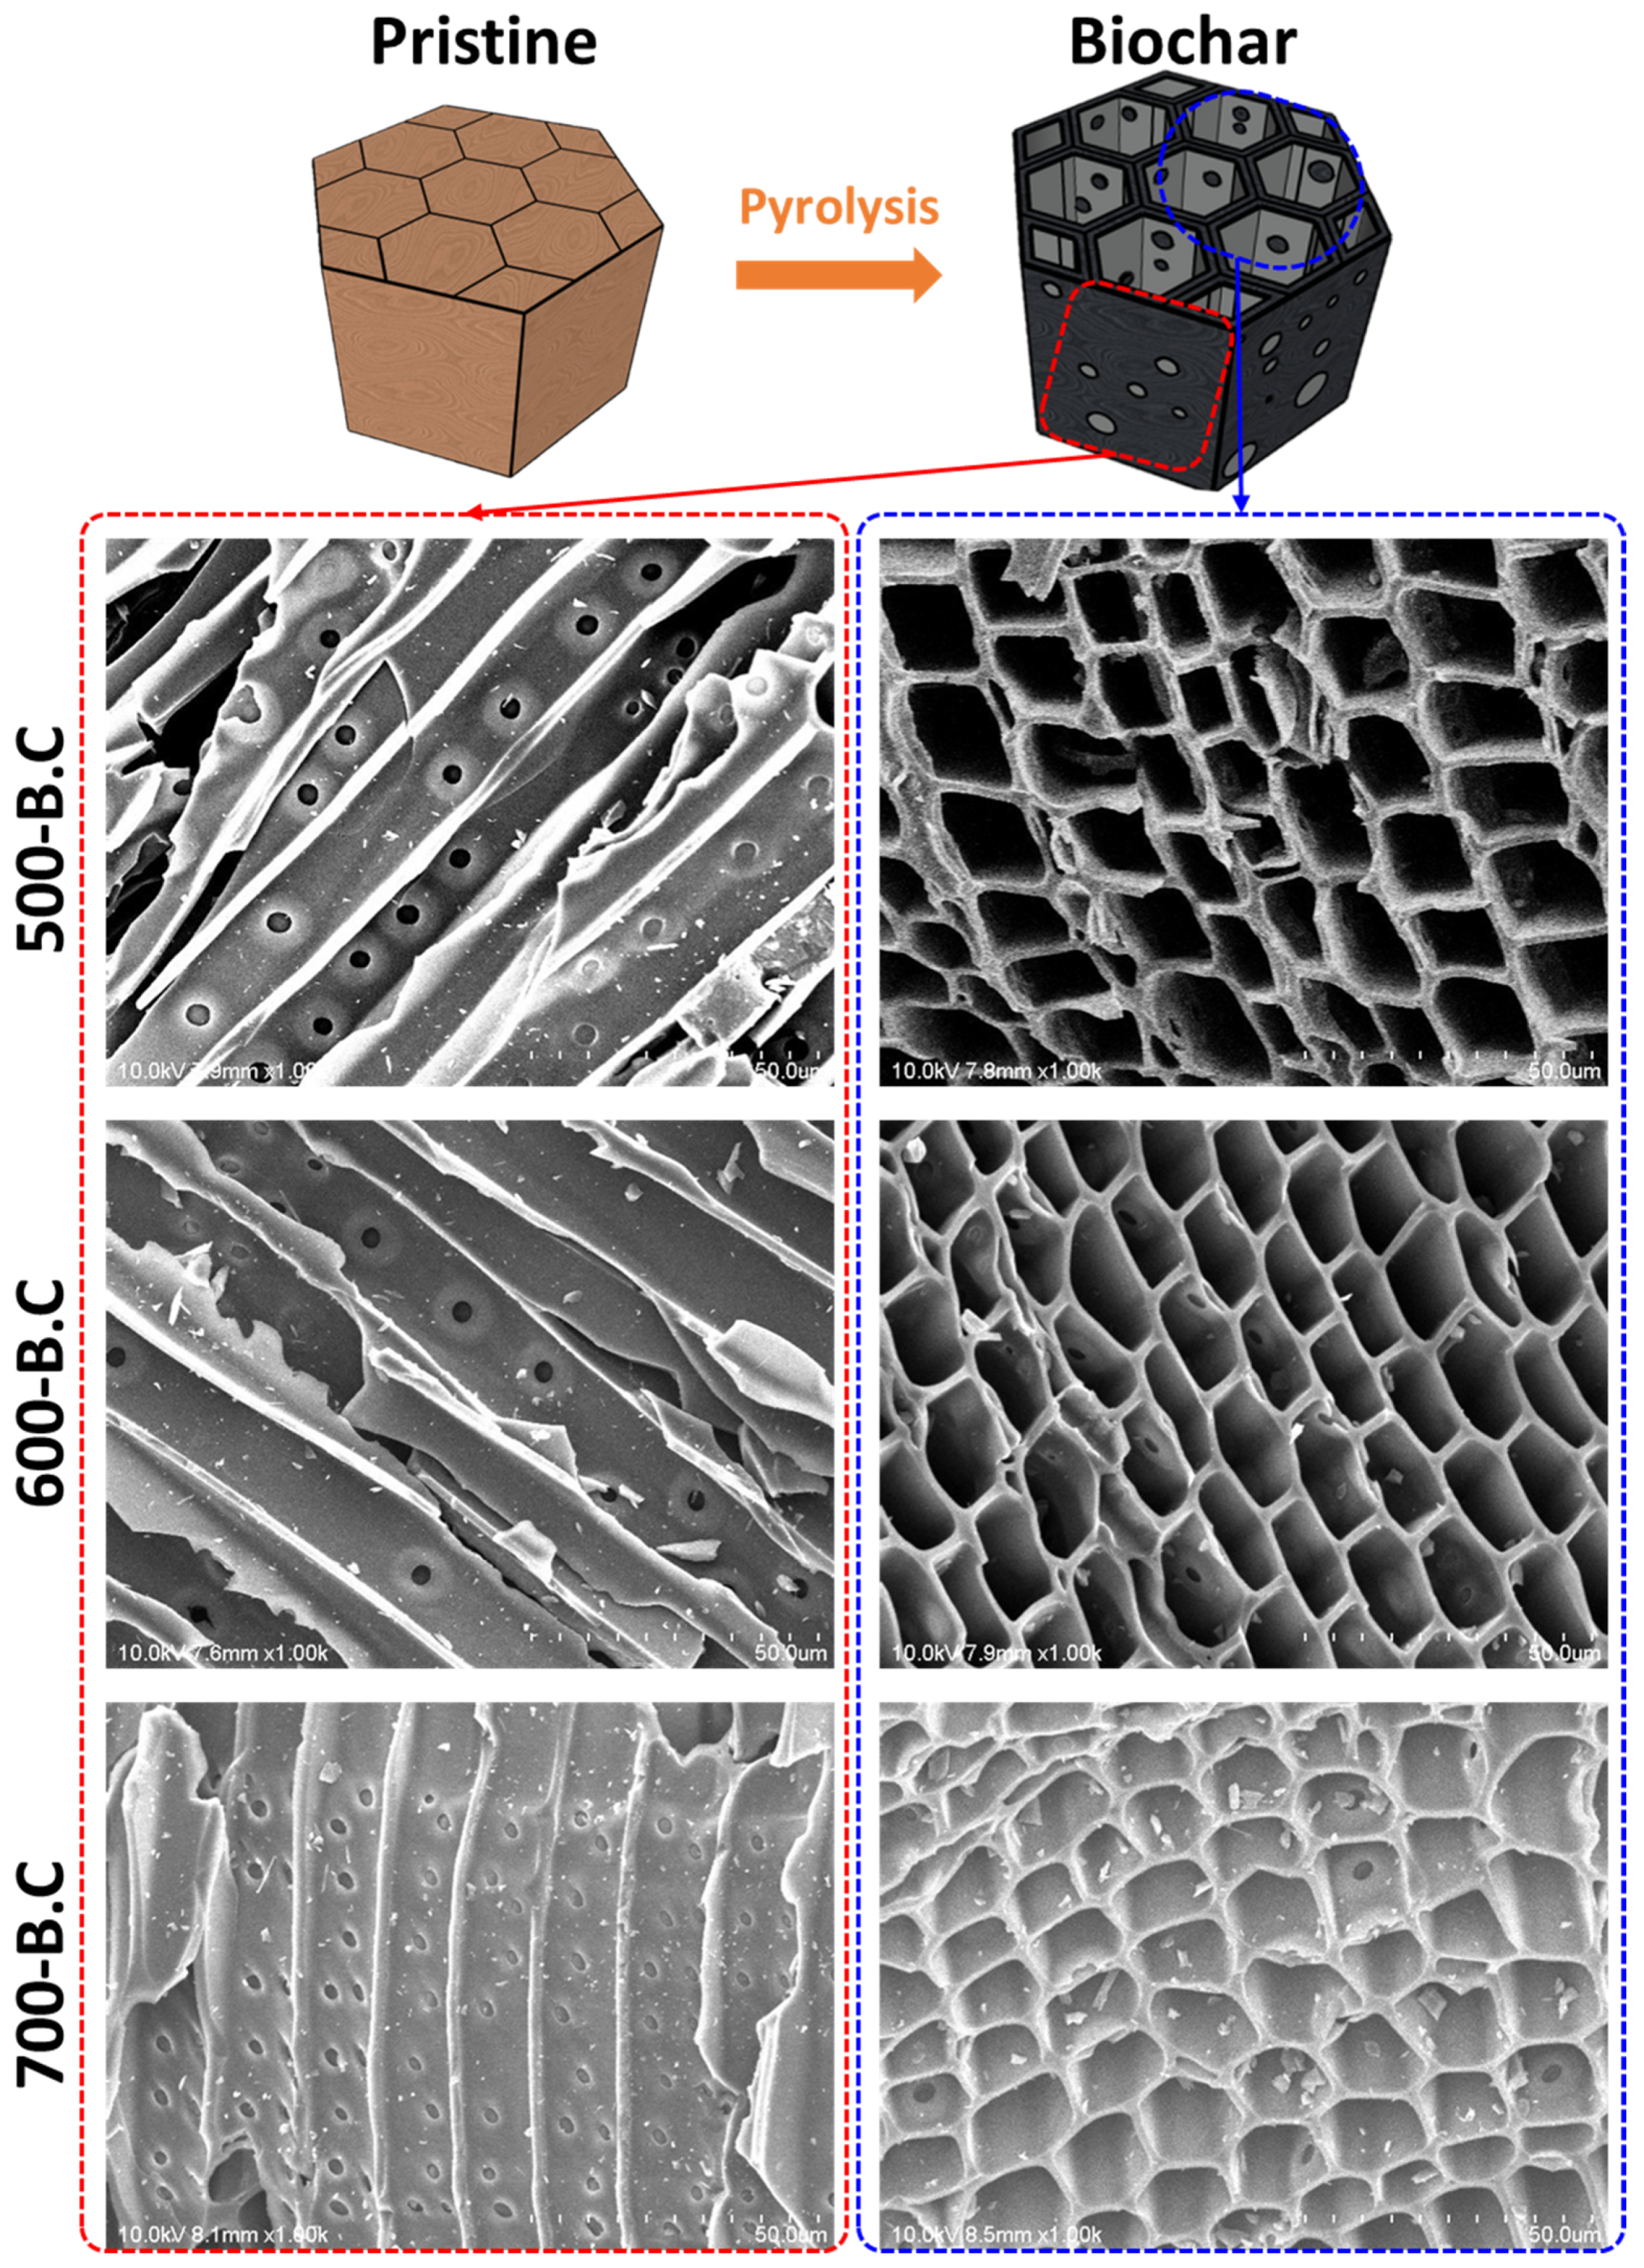
This trend is further supported by the pore size distributions shown in Figure 3. Biochar (B.C) produced at 500 °C and 600 °C exhibited similar pore size distributions, predominantly within the range of 10–1000 nm. In contrast, biochar produced at 700 °C displayed a notable shift, with a peak increase near a pore size of approximately 1 μm. This change is attributed to the destruction of micropores and collapse of the cell wall structure caused by high-temperature thermal decomposition, leading to the formation of larger pores and consequently a reduction in surface area compared to the sample produced at 600 °C.
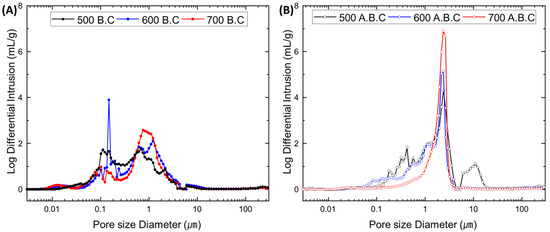
Figure 3.
Pore volume distribution of biochar (B.C) (A) and activated biochar (A.B.C) (B) with different pyrolysis temperatures.
These structural transformations were also evident in Figure 4, Figure A3 and Figure A4. Figure A3 presents boxplots of the apparent density for 100 sampled particles of raw biomass and biochar produced at different temperatures. The mean apparent density exhibited slight fluctuations with increasing pyrolysis temperature, reflecting progressive changes in internal structure. Figure 3 shows horizontal and vertical FE-SEM images of biochar synthesized at various pyrolysis temperatures, while Figure A4 illustrates the distribution of cell wall thickness measured from 100 individual cell walls in FE-SEM images. The average cell wall thickness decreased progressively from 1.43 μm at 500 °C to 1.30 μm at 600 °C and 1.09 μm at 700 °C. These findings confirm that pyrolysis at 700 °C accelerates cell wall degradation and promotes the formation of larger internal pores, which, while increasing total pore volume, contributes to a reduction in overall surface area.
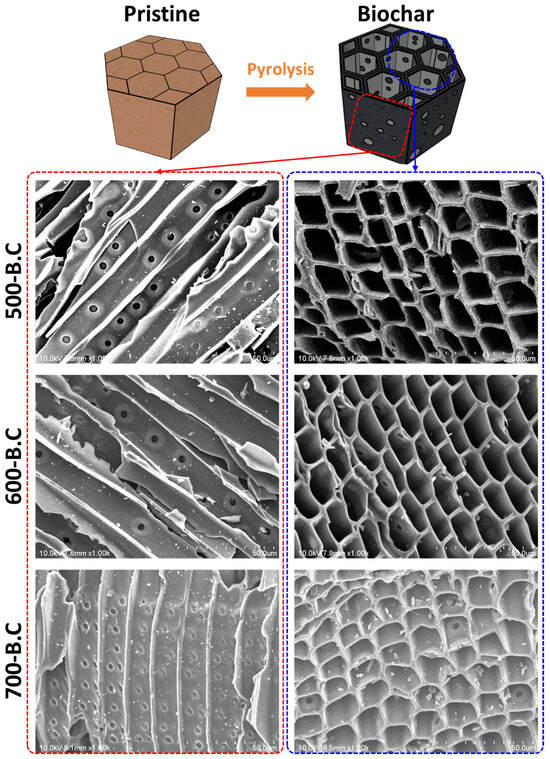
Figure 4.
Graphical image of pristine biomass and pyrolyzed biochar with horizontal/vertical microstructures observed via field emission scanning electron microscopy (FE-SEM).
3.2. Adsorption Characteristics of Individual Gaseous Air Pollutants by Biochar
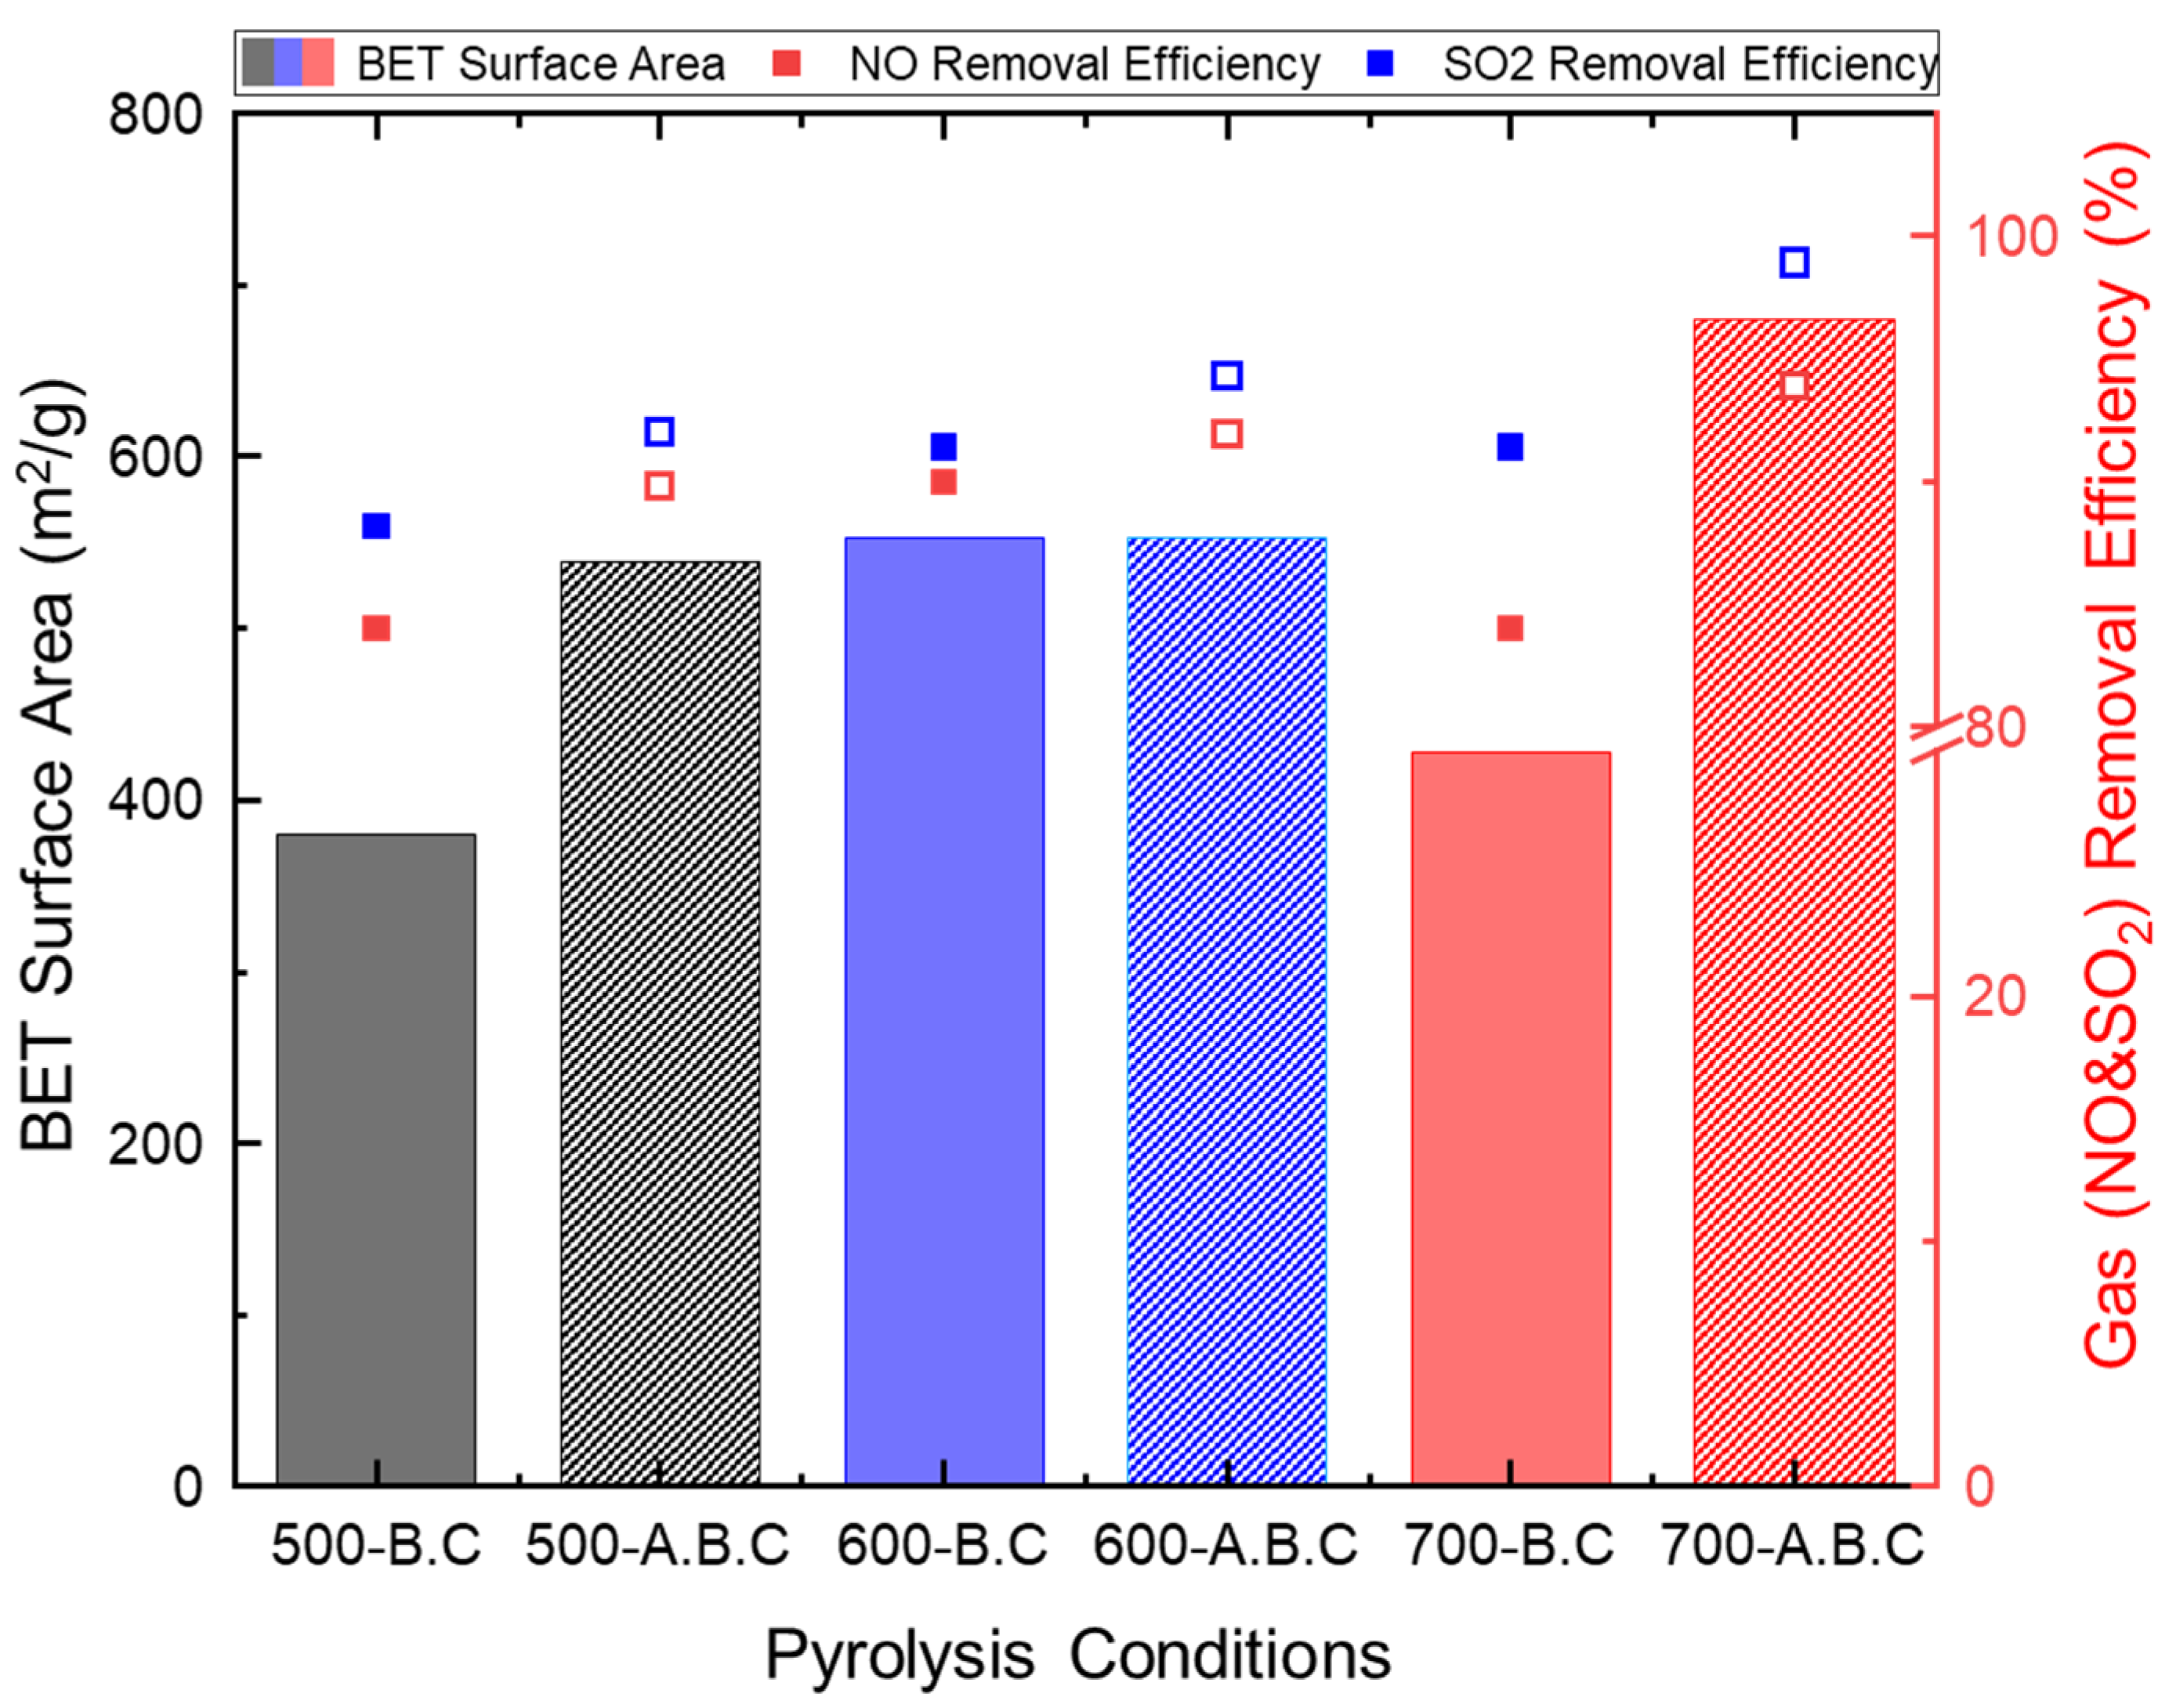
Figure 5 compares the adsorption efficiencies of NO and SO2 by biochar after 6 h under single-gas conditions. The detailed removal efficiencies of individual samples are provided in Figure A5. The biochar produced at 500 °C and 700 °C exhibited NO removal efficiencies close to 85%, while the biochar synthesized at 600 °C achieved approximately 90% efficiency. The NO adsorption performance was closely related to the presence of mesopores in the 2–50 nm range. Given that the kinetic diameter of NO is approximately 0.3 nm, biochar with a high proportion of mesopores in this size range offers more accessible active sites for gas adsorption [29]. Also, micropores (<2 nm) correlated with BET enhance both physical adsorption and surface-level chemical interactions, leading to improved overall NO capture.

Figure 5.
(Bar chart) Brunauer–Emmett–Teller (BET) specific surface area of biochar and (square plot) adsorption performance for individual gaseous air pollutants (NO and SO2) under different pyrolysis and activation conditions.
In the case of SO2 adsorption, the lowest efficiency (88.2%) was observed for biochar produced at 500 °C, while biochar produced at 600 °C and 700 °C exhibited higher efficiencies of 91.4%. Since SO2 adsorption primarily occurs through physisorption, biochar with larger BET surface areas and broader distributions of macropores (<1 μm) demonstrated superior adsorption capacity [30].
Upon CO2 activation, the BET surface area of biochar increased significantly due to partial gasification, which enhanced NO adsorption by approximately 1–2% compared to its non-activated counterpart. As shown in Figure 2, this increase was most prominent at 500 °C and 600 °C, particularly due to the formation of macropores in the 100–1000 nm range. These structural enhancements contributed directly to improved NO adsorption performance.
The SO2 adsorption efficiency of activated biochar further improved with increasing temperature. Specifically, the activated biochar produced at 500 °C, 600 °C, and 700 °C achieved efficiencies of 92.0%, 94.3%, and 98.9%, respectively. Notably, the biochar activated at 700 °C exhibited a significant 37.2% increase in BET surface area, which resulted in a ~7% improvement in SO2 removal compared to biochar pyrolyzed at the same temperature. Additionally, for the activated biochar at 700 °C, no SO2 was detected in the outlet stream during the first 90 min of the adsorption test.
The kinetic diameters of NO (0.3 nm) and SO2 (0.364 nm) confirm that these gases are small enough to readily diffuse into micropores. CO2 activation promoted the development of micropores, particularly within the increases in the BET surface area, which closely matches the molecular dimensions of NO and SO2 [31]. As a result, the increased BET surface area in activated biochar provides more accessible adsorption sites, thereby enhancing the adsorption performance—especially at higher activation temperatures, such as 700 °C.
The mechanism of NO adsorption on carbon-based materials, including biochar and activated carbon, occurs in the presence of oxygen, as illustrated in Figure A6 [32,33]. Initially, oxygen molecules are adsorbed onto active surface sites, often near hydroxyl functional groups. These oxygen molecules facilitate the oxidation of NO to NO2, which is subsequently adsorbed onto the surface. The presence of surface oxygen-containing functional groups, such as hydroxyl and carboxyl groups, further enhances this process by offering additional active sites for NO and NO2 adsorption.
In contrast, SO2 adsorption is primarily governed by physisorption. In this mechanism, SO2 molecules are adsorbed onto the biochar surface via weak intermolecular forces such as van der Waals interactions, driven by concentration gradients [34]. The efficiency of this process is largely dependent on the surface area and pore structure of the biochar.
3.3. Simultaneous Adsorption of Gaseous Air Pollutants by Biochar
Figure 6 and Table 4 present the results of simultaneous NO and SO2 adsorption using biochar. During the initial 30 min of the experiment, both NO and SO2 were undetectable in the outlet gas stream for all samples except the biochar produced at 700 °C, which exhibited an earlier breakthrough. After 6 h, the NO adsorption efficiencies ranged between 91.7% and 93.8%, based on the inlet concentration. Among the samples, the biochar produced at 500 °C showed the lowest adsorption performance, attributed to its relatively lower BET surface area, which resulted in a shorter breakthrough time.
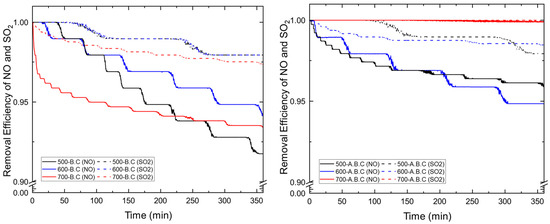
Figure 6.
Simultaneous SO2 and NO removal performances for 50 g packed biochar (B.C) and activated biochar (A.B.C) for 6 h.
Table 4.
Simultaneous SO2 and NO adsorption performance of 50 g of biochar under different pyrolysis and activation conditions.
For SO2, the outlet concentrations stabilized at 2–3 ppm, corresponding to an adsorption efficiency of approximately 96.5% to 97.9%. This represents an improvement of 4.6–6% compared to the results from the single-gas SO2 adsorption experiments. This enhancement is attributed to the synergistic interaction between SO2 and NO at nitrogen-containing active sites on the biochar surface, which facilitates the formation of intermediate complexes such as (NO2)(SO3), thereby promoting SO2 removal [35]. Under co-adsorption conditions, the NO adsorption behavior was similar to that observed under single-gas experiments, while the SO2 removal was notably improved.
Following CO2 activation, a further enhancement in adsorption performance was observed. Biochar activated at 500 °C and 600 °C exhibited final NO outlet concentrations of 4–5 ppm, indicating reduction rates of approximately 95 and 94%. For SO2, the final outlet concentrations remained at around 2 ppm, corresponding to an adsorption efficiency of about 98%, with negligible variation over the 6 h duration. These results reaffirm the synergistic effect observed during simultaneous adsorption, where the presence of NO promotes more effective SO2 removal compared to single-gas adsorption.
Based on the relationship between BET surface area and adsorption efficiency, a surface area of at least 530 m2/g is required to achieve NO and SO2 reduction rates above 95% at room temperature. When the BET surface area increases to 680 m2/g, removal efficiencies can reach up to 99%. However, increasing the activation temperature leads to higher energy consumption and lower biochar yields, reducing overall cost-effectiveness. Therefore, considering both energy input and biochar yield, CO2 activation at 500 °C is identified as the optimal condition for balancing adsorption performance and production efficiency.
3.4. Environmental Impacts of the Application of Biochar for Gas Adsorption
As summarized in Table 4, the overall removal efficiencies of biochar under various pyrolysis and activation conditions were used to calculate the total mass of NO and SO2 removed over a 6 h period. The total removed mass was estimated by multiplying the gas flow rate, molar mass, injection time, and overall removal efficiency.
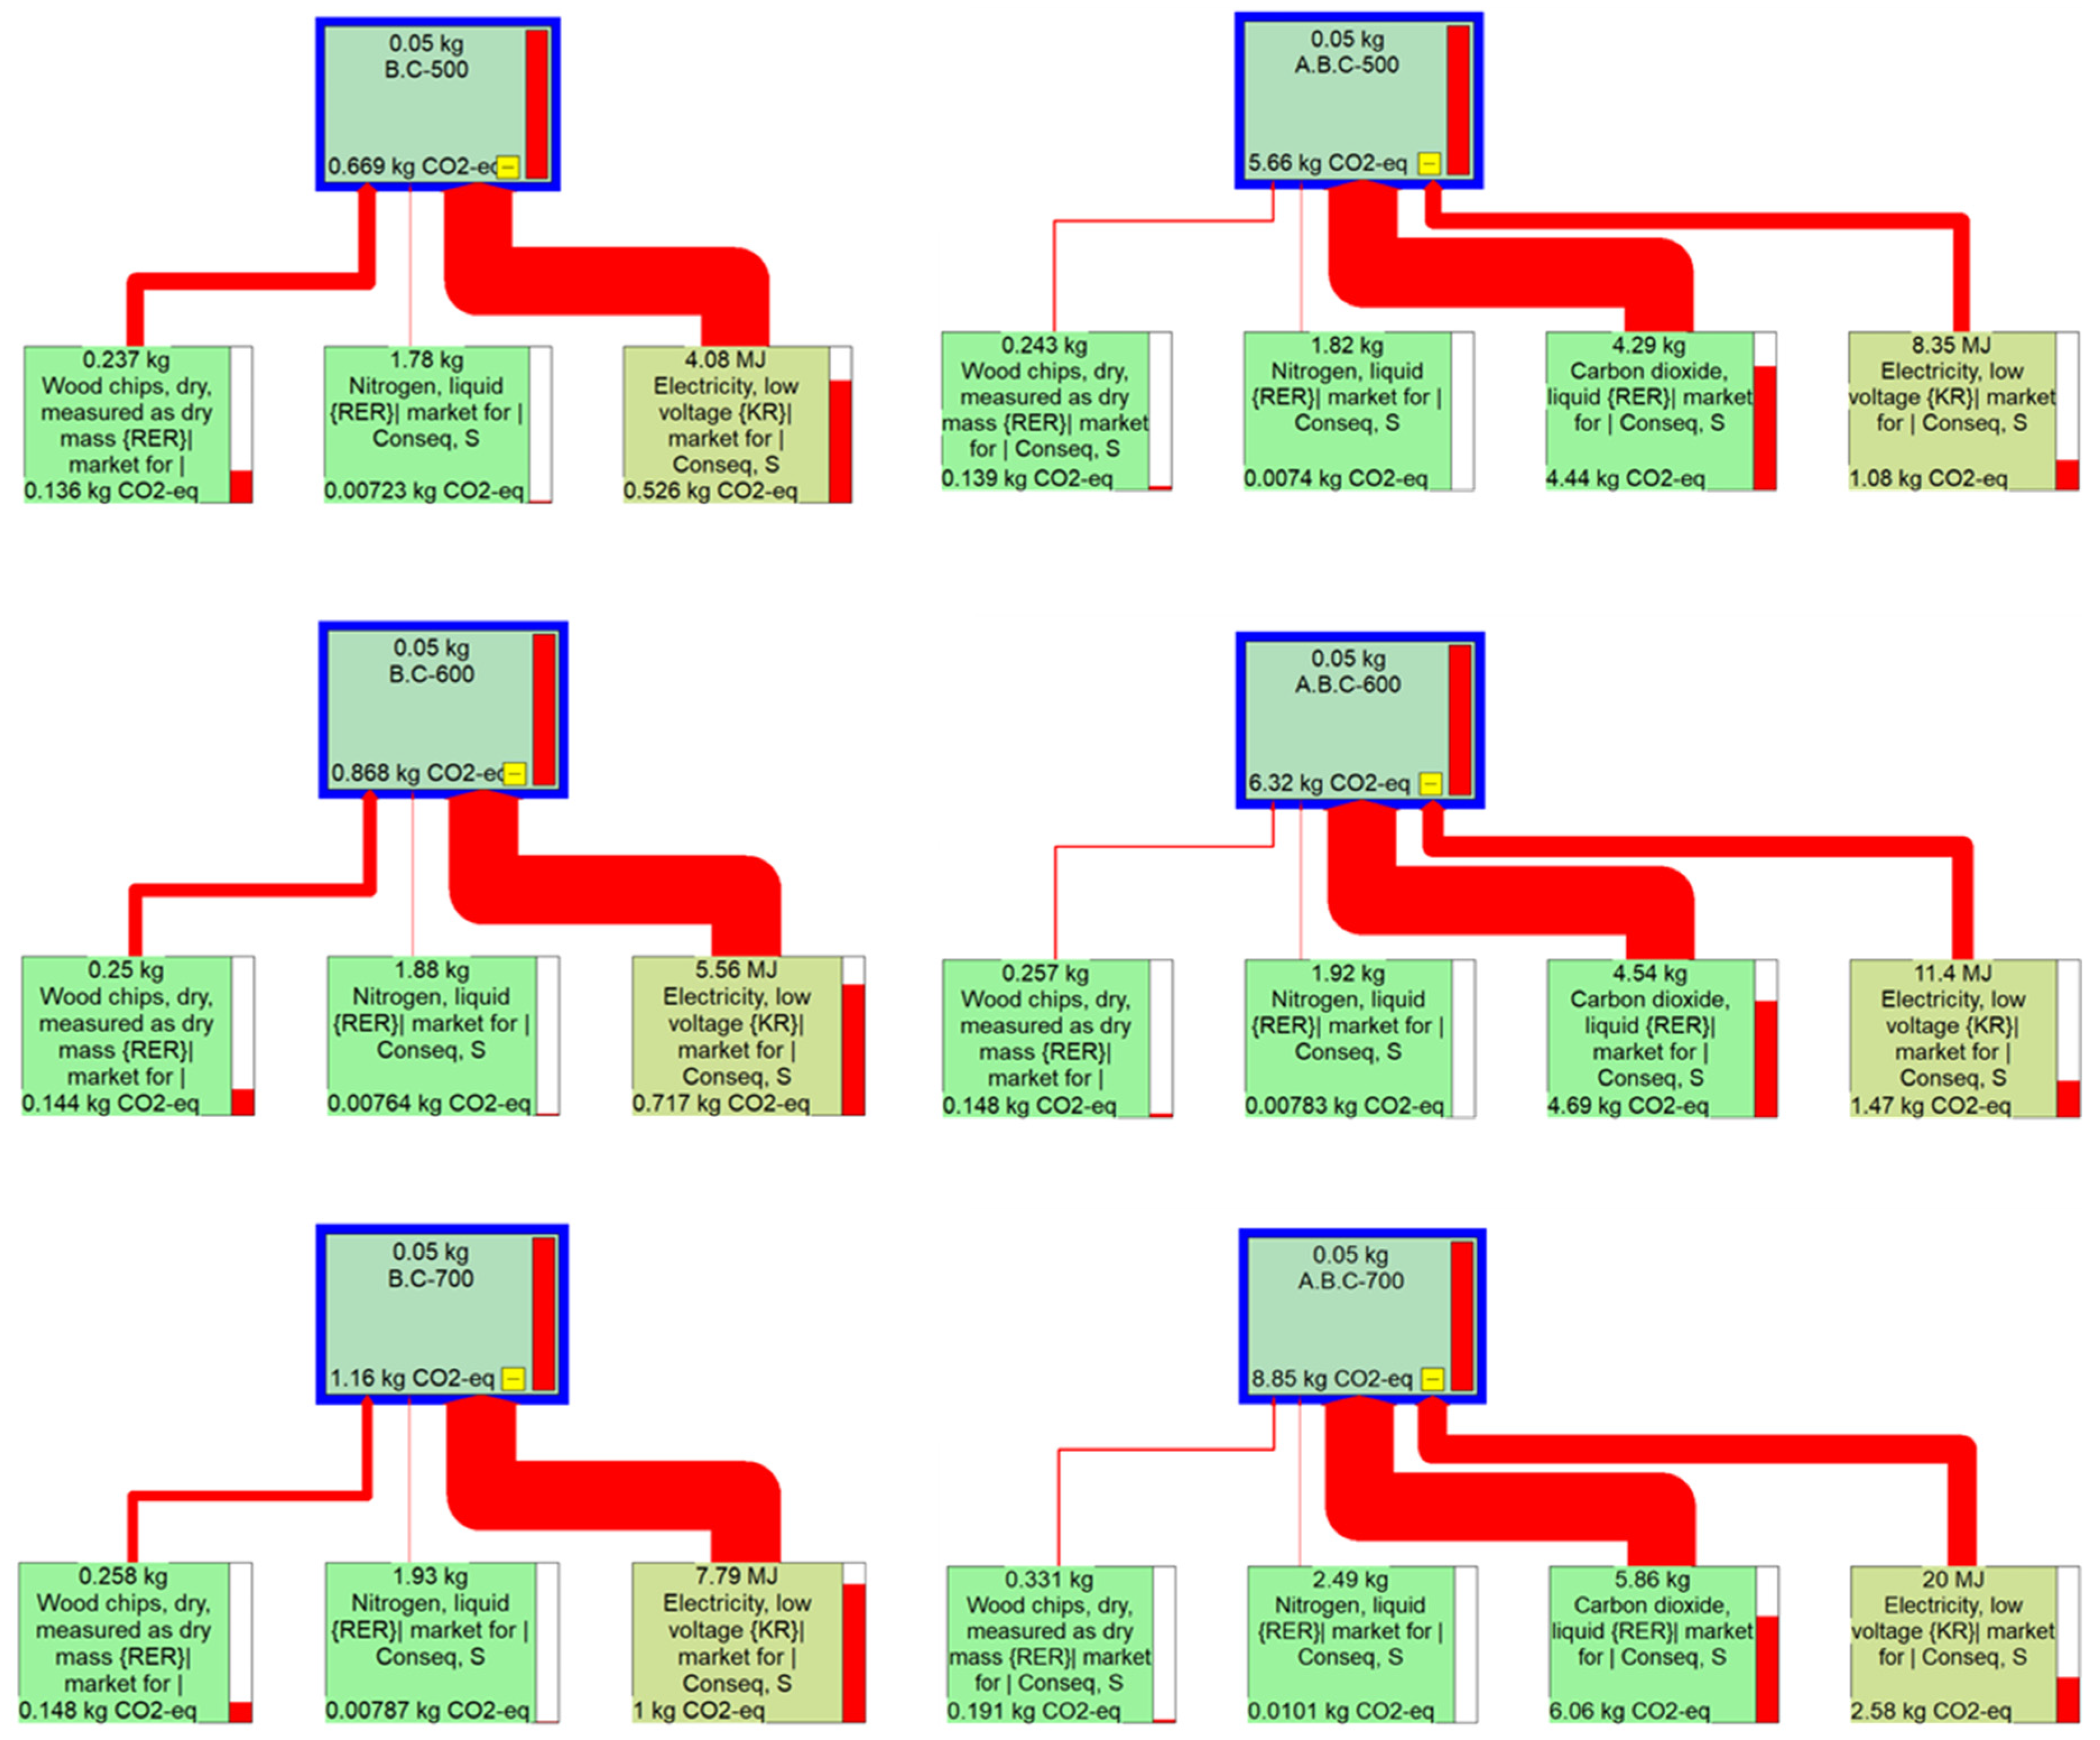
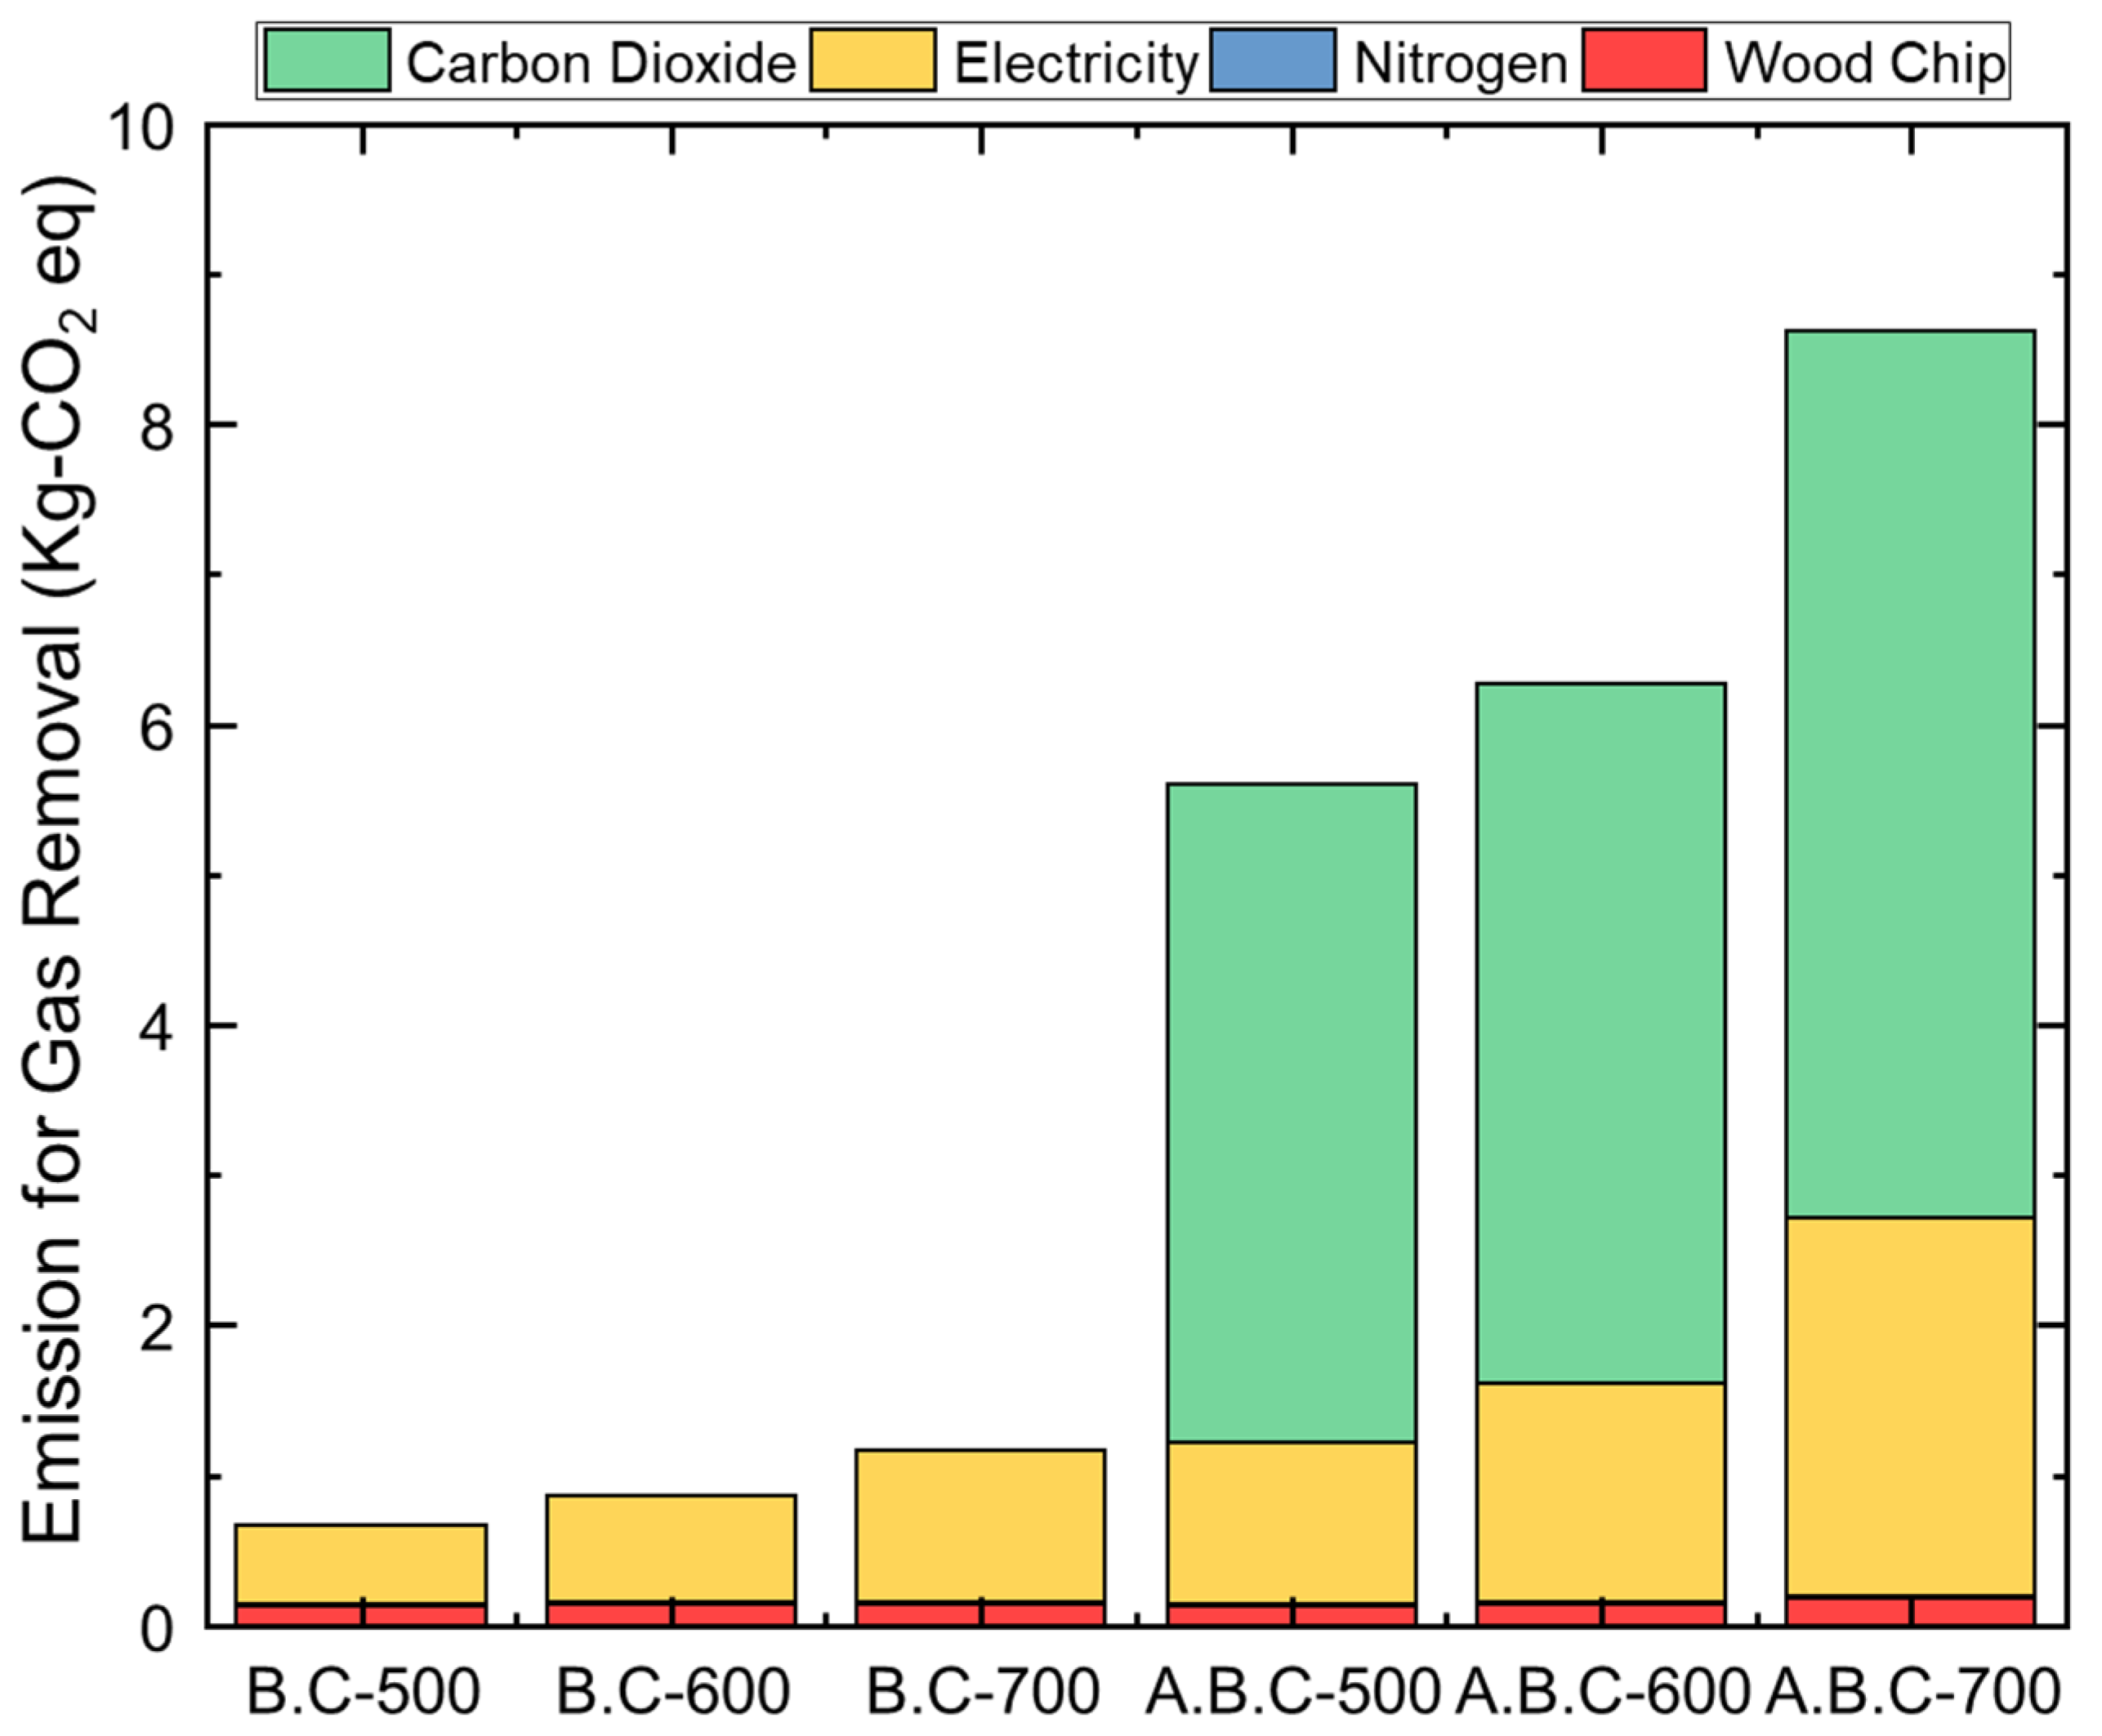
Based on these calculations, a minimum of 1800 μg of combined NO and SO2 was removed by all biochar samples tested. Therefore, 1800 μg was defined as the functional unit (FU) for the life cycle assessment (LCA). The corresponding environmental impacts are presented in Figure 7, and raw results from SimaPro are described in Figure A7.

Figure 7.
Life cycle impact assessment results (IPCC 2021, GWP 100) of different pyrolysis products for same functional unit (1800 μg of SO2 and NO removal).
Greenhouse gas (GHG) emissions were calculated according to the quantity of materials and energy—specifically wood chips, nitrogen, electricity, and carbon dioxide—required to remove 1800 μg of pollutants. Interestingly, the biochar produced at 500 °C exhibited the lowest GHG emissions despite having slightly lower adsorption performance compared to the other samples. In contrast, biochar produced at 700 °C required approximately twice the amount of electricity as that produced at 500 °C, resulting in emissions of 1.01 kg CO2-equivalent compared to 0.523 kg CO2-equivalent.
The CO2 emissions associated with the activation step increased further, with electricity-related emissions ranging from 1.07 to 2.52 kg CO2-equivalent depending on the activation temperature. Notably, the CO2 used for activation contributed more than half of the total GHG emissions in all activated biochar cases, reaching 4.39, 4.66, and 5.91 kg CO2-equivalent for activation at 500 °C, 600 °C, and 700 °C, respectively.
Additionally, as the yield of activated biochar (A.B.C) decreased at higher temperatures—particularly at 700 °C—a greater input of raw materials was required to meet the same pollutant removal target. These findings highlight the importance of considering both biochar yield and energy/material inputs when optimizing the production process. A lower-temperature pyrolysis and activation strategy, such as 500 °C, may offer a more environmentally sustainable approach by balancing adsorption efficiency and GHG emissions.
4. Conclusions
In this study, the adsorption and reduction behaviors of NO and SO2 were systematically evaluated using biochar produced through pyrolysis and further enhanced by CO2 partial gasification. Biochar was synthesized from lignocellulosic biomass at pyrolysis temperatures ranging from 500 °C to 700 °C. CO2-activated biochar exhibited significantly higher BET surface areas and enhanced pore structures compared to its non-activated counterpart, resulting in improved adsorption efficiencies for both NO and SO2. Notably, biochar activated at 700 °C demonstrated superior performance, achieving simultaneous removal efficiencies of approximately 99% for both gases.
The adsorption performance was strongly influenced by the microporous structure and surface area of the biochar. High adsorption efficiency was maintained even at room temperature, highlighting the potential of biochar application as an effective industrial adsorbent. When integrated into existing flue gas treatment systems, such as stacks in industrial facilities, biochar could provide additional NOx and SOx reduction, thereby supporting more sustainable and environmentally friendly emission control. Furthermore, spent biochar containing adsorbed NO and SO2 may be repurposed as a soil amendment, offering opportunities for material reuse and minimizing environmental impact.
To assess the environmental sustainability of biochar utilization, a life cycle assessment (LCA) was conducted using a functional unit (FU) defined as the removal of 1800 μg of combined NO and SO2, based on the minimum removal observed across all biochar samples. Greenhouse gas (GHG) emissions were quantified based on the consumption of raw materials and energy inputs, including wood chips, nitrogen, electricity, and carbon dioxide. The results revealed that biochar produced at 500 °C resulted in the lowest total GHG emissions (0.658 kg CO2-eq), despite slightly lower adsorption performance. In contrast, the biochar produced at 700 °C required approximately double the electricity input.
For activated biochar, GHG emissions increased significantly due to both electricity consumption and CO2 use during activation. CO2 usage accounted for over half of the total emissions in each case. Additionally, the yield of activated biochar decreased at higher temperatures, especially at 700 °C, necessitating greater raw material input to achieve equivalent pollutant removal.
These findings highlight the importance of balancing adsorption efficiency with environmental impacts. A lower-temperature pyrolysis and activation strategy, particularly at 500 °C, may offer a more sustainable solution by minimizing energy consumption and material use while maintaining effective pollutant removal performance.
Moreover, the findings of this study have strong potential for industrial applications, particularly in full-scale environmental facilities aimed at mitigating air pollution with reduced environmental impact. While the use of low-temperature biochar may result in shorter adsorption lifespans, its environmental advantages could offset higher maintenance costs associated with more frequent replacement. To support practical implementation, future research should focus on a comprehensive techno-economic assessment (TEA) of air pollution control systems utilizing repeated applications of biochar and activated biochar. The long-term performance, operational feasibility, and cost-effectiveness of biomass-derived adsorbents should be evaluated under real operating conditions.
Author Contributions
Conceptualization, Y.L. and K.C.; methodology, H.C. and K.C.; software, K.C.; validation, Y.L. and K.C.; formal analysis, H.C.; investigation, H.C. and K.C.; resources, Y.L. and K.C.; data curation, H.C. and Y.L.; writing—original draft preparation, H.C. and K.C.; writing—review and editing, Y.L. and K.C.; visualization, K.C.; supervision, Y.L.; project administration, Y.L.; funding acquisition, Y.L. All authors have read and agreed to the published version of the manuscript.
Funding
This work was supported by the Korea Environment Industry and Technology Institute (KEITI) through the R&D Project for Intelligent Optimum Reduction and Management of Industrial Fine Dust Program, funded by the Korea Ministry of Environment (MOE)(RS-2023-00219327).
Institutional Review Board Statement
Not applicable.
Informed Consent Statement
Not applicable.
Data Availability Statement
Data is contained within the article.
Conflicts of Interest
The authors declare no conflicts of interest.
Appendix A
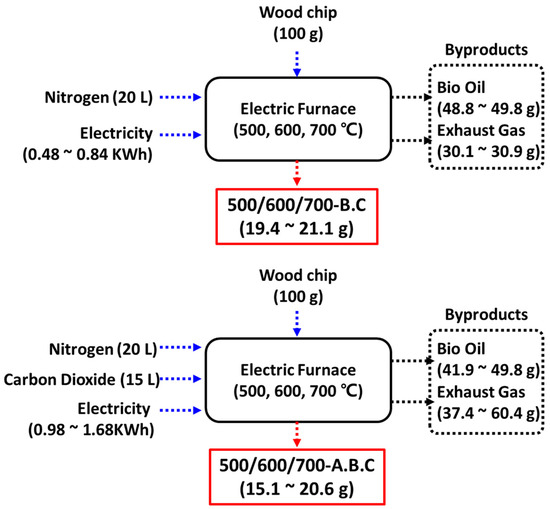
Figure A1.
Schematic diagram of system boundaries for the synthesis of biochar (B.C) and activated biochar (A.B.C), including mass and volume flows under varying process conditions.
Figure A1.
Schematic diagram of system boundaries for the synthesis of biochar (B.C) and activated biochar (A.B.C), including mass and volume flows under varying process conditions.

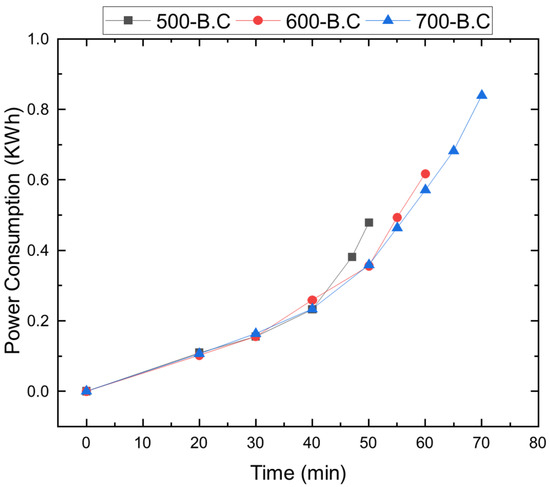
Figure A2.
Electrical power consumption during heating to 500, 600, and 700 °C at constant heating rate of 10 °C/min.
Figure A2.
Electrical power consumption during heating to 500, 600, and 700 °C at constant heating rate of 10 °C/min.
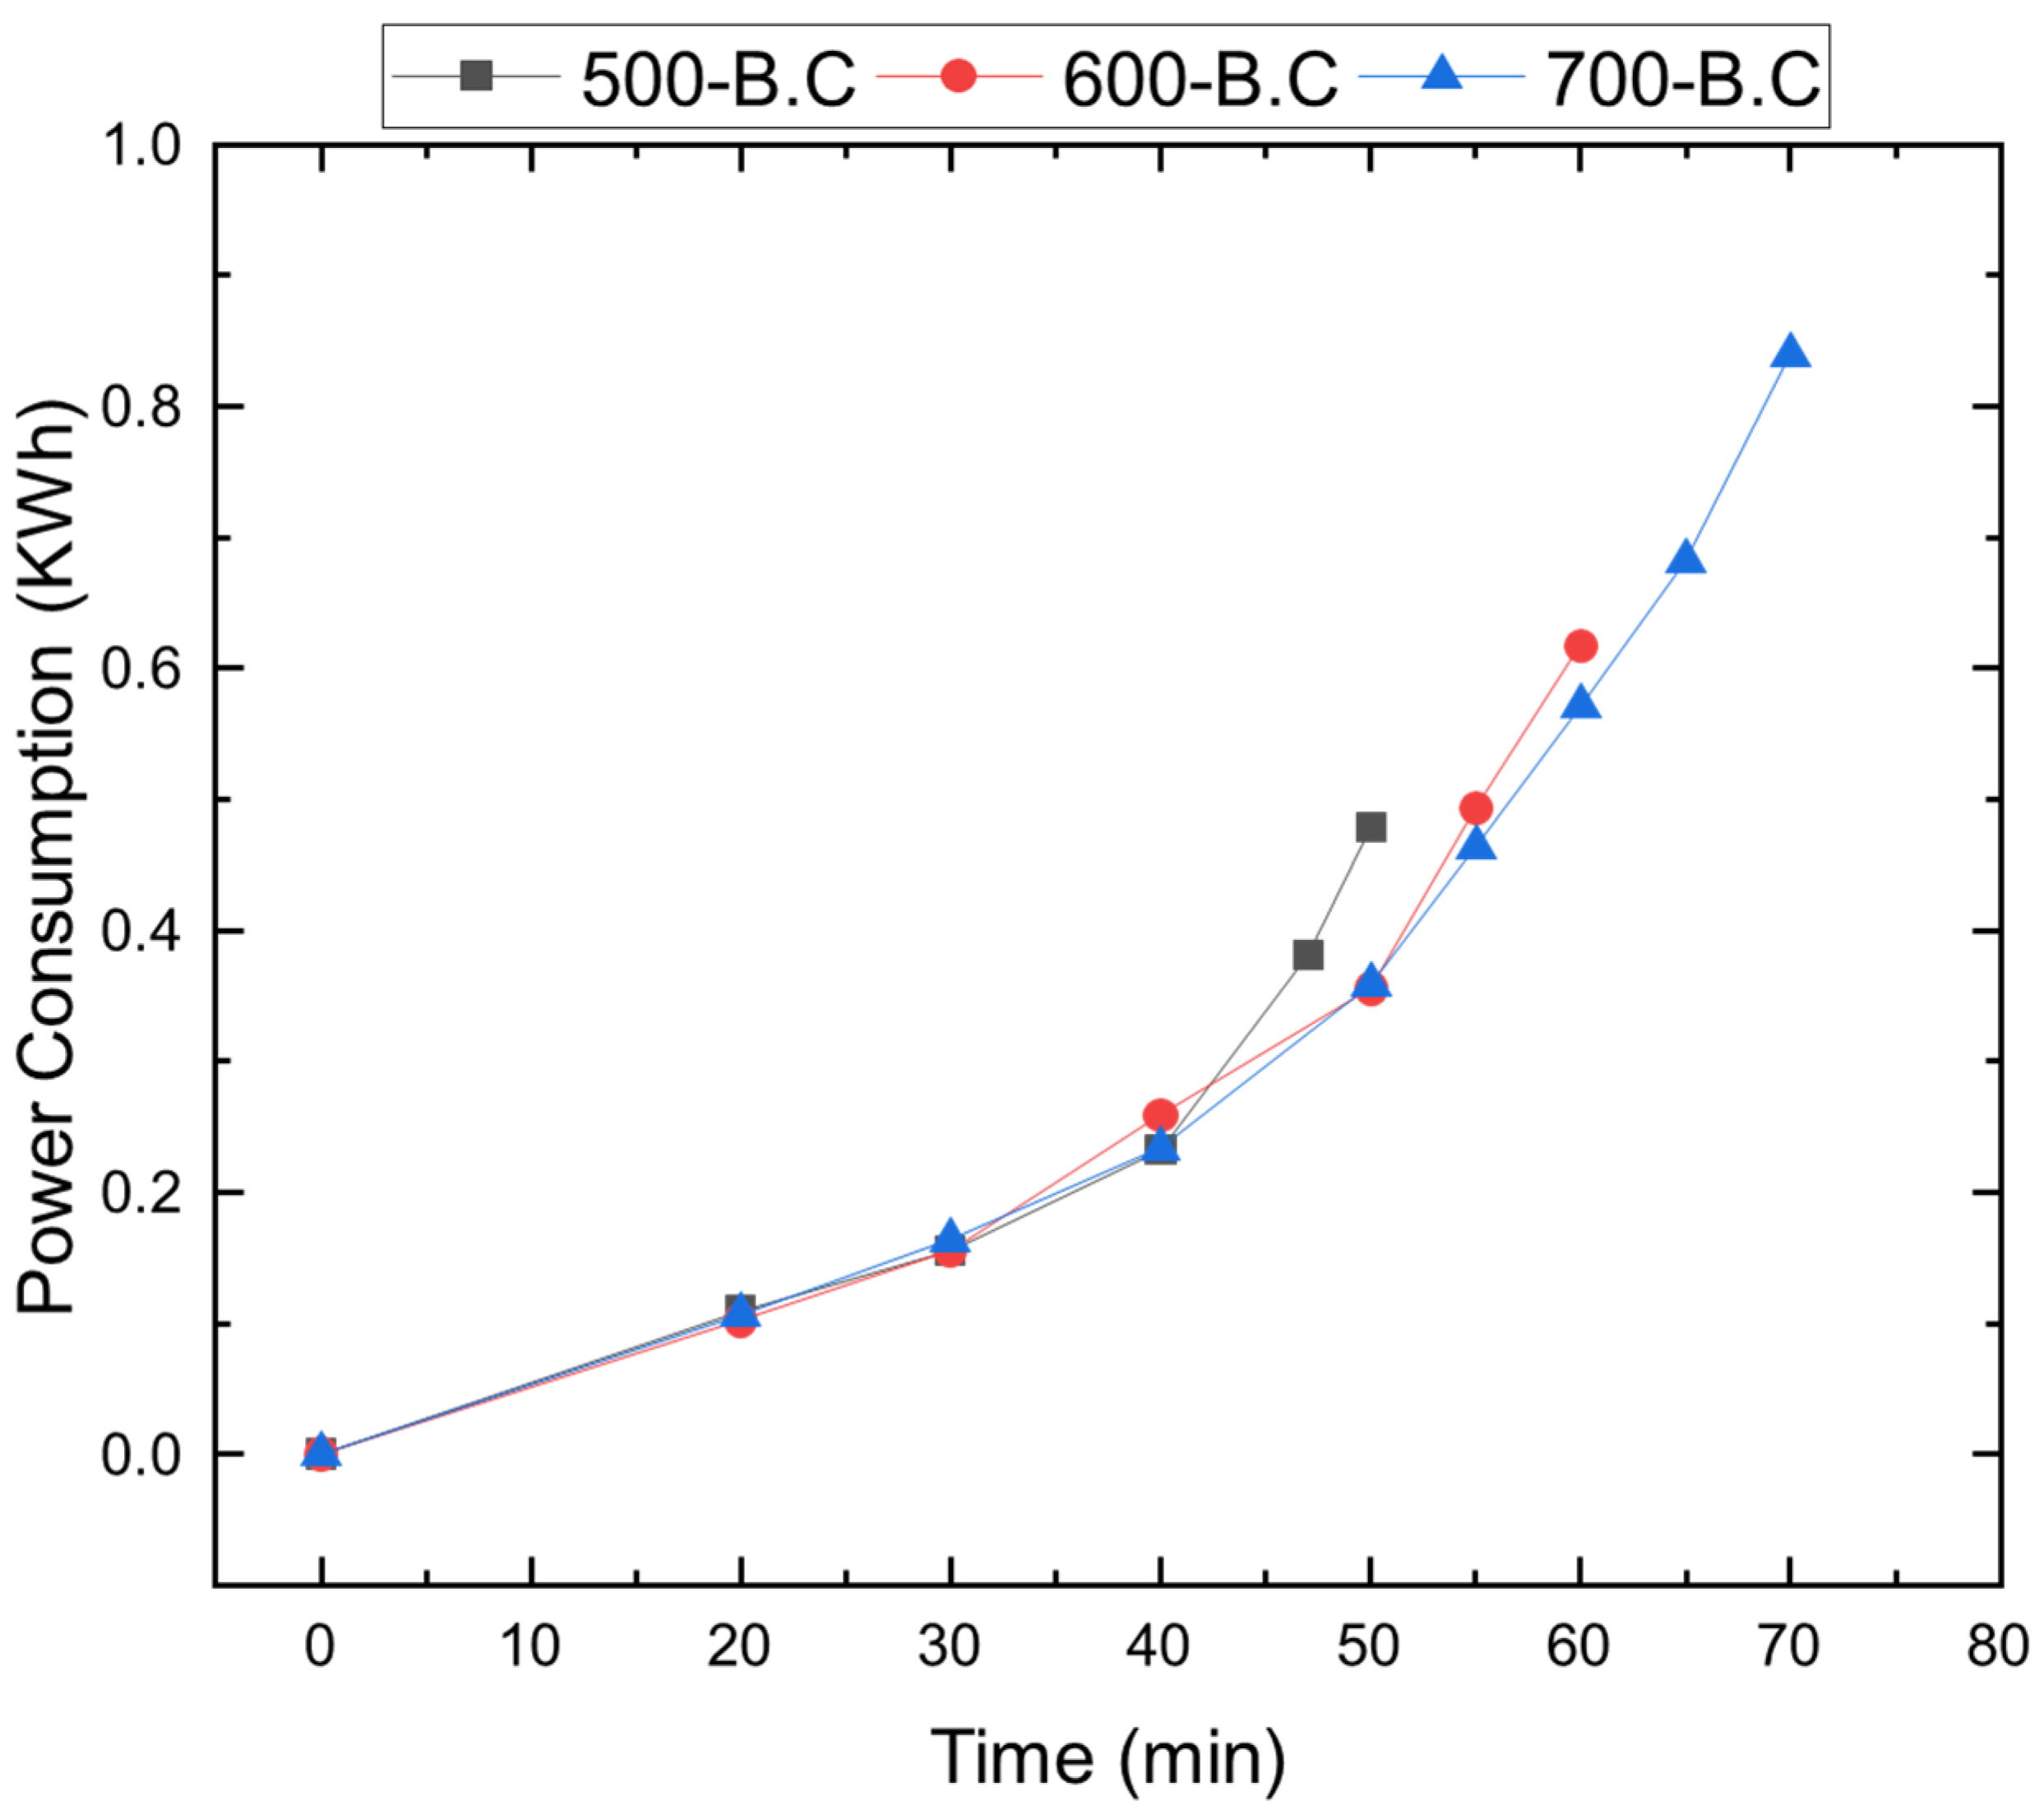

Figure A3.
Boxplot of apparent density of pristine biomass and biochar produced at different pyrolysis temperature (500, 600, 700 °C).
Figure A3.
Boxplot of apparent density of pristine biomass and biochar produced at different pyrolysis temperature (500, 600, 700 °C).
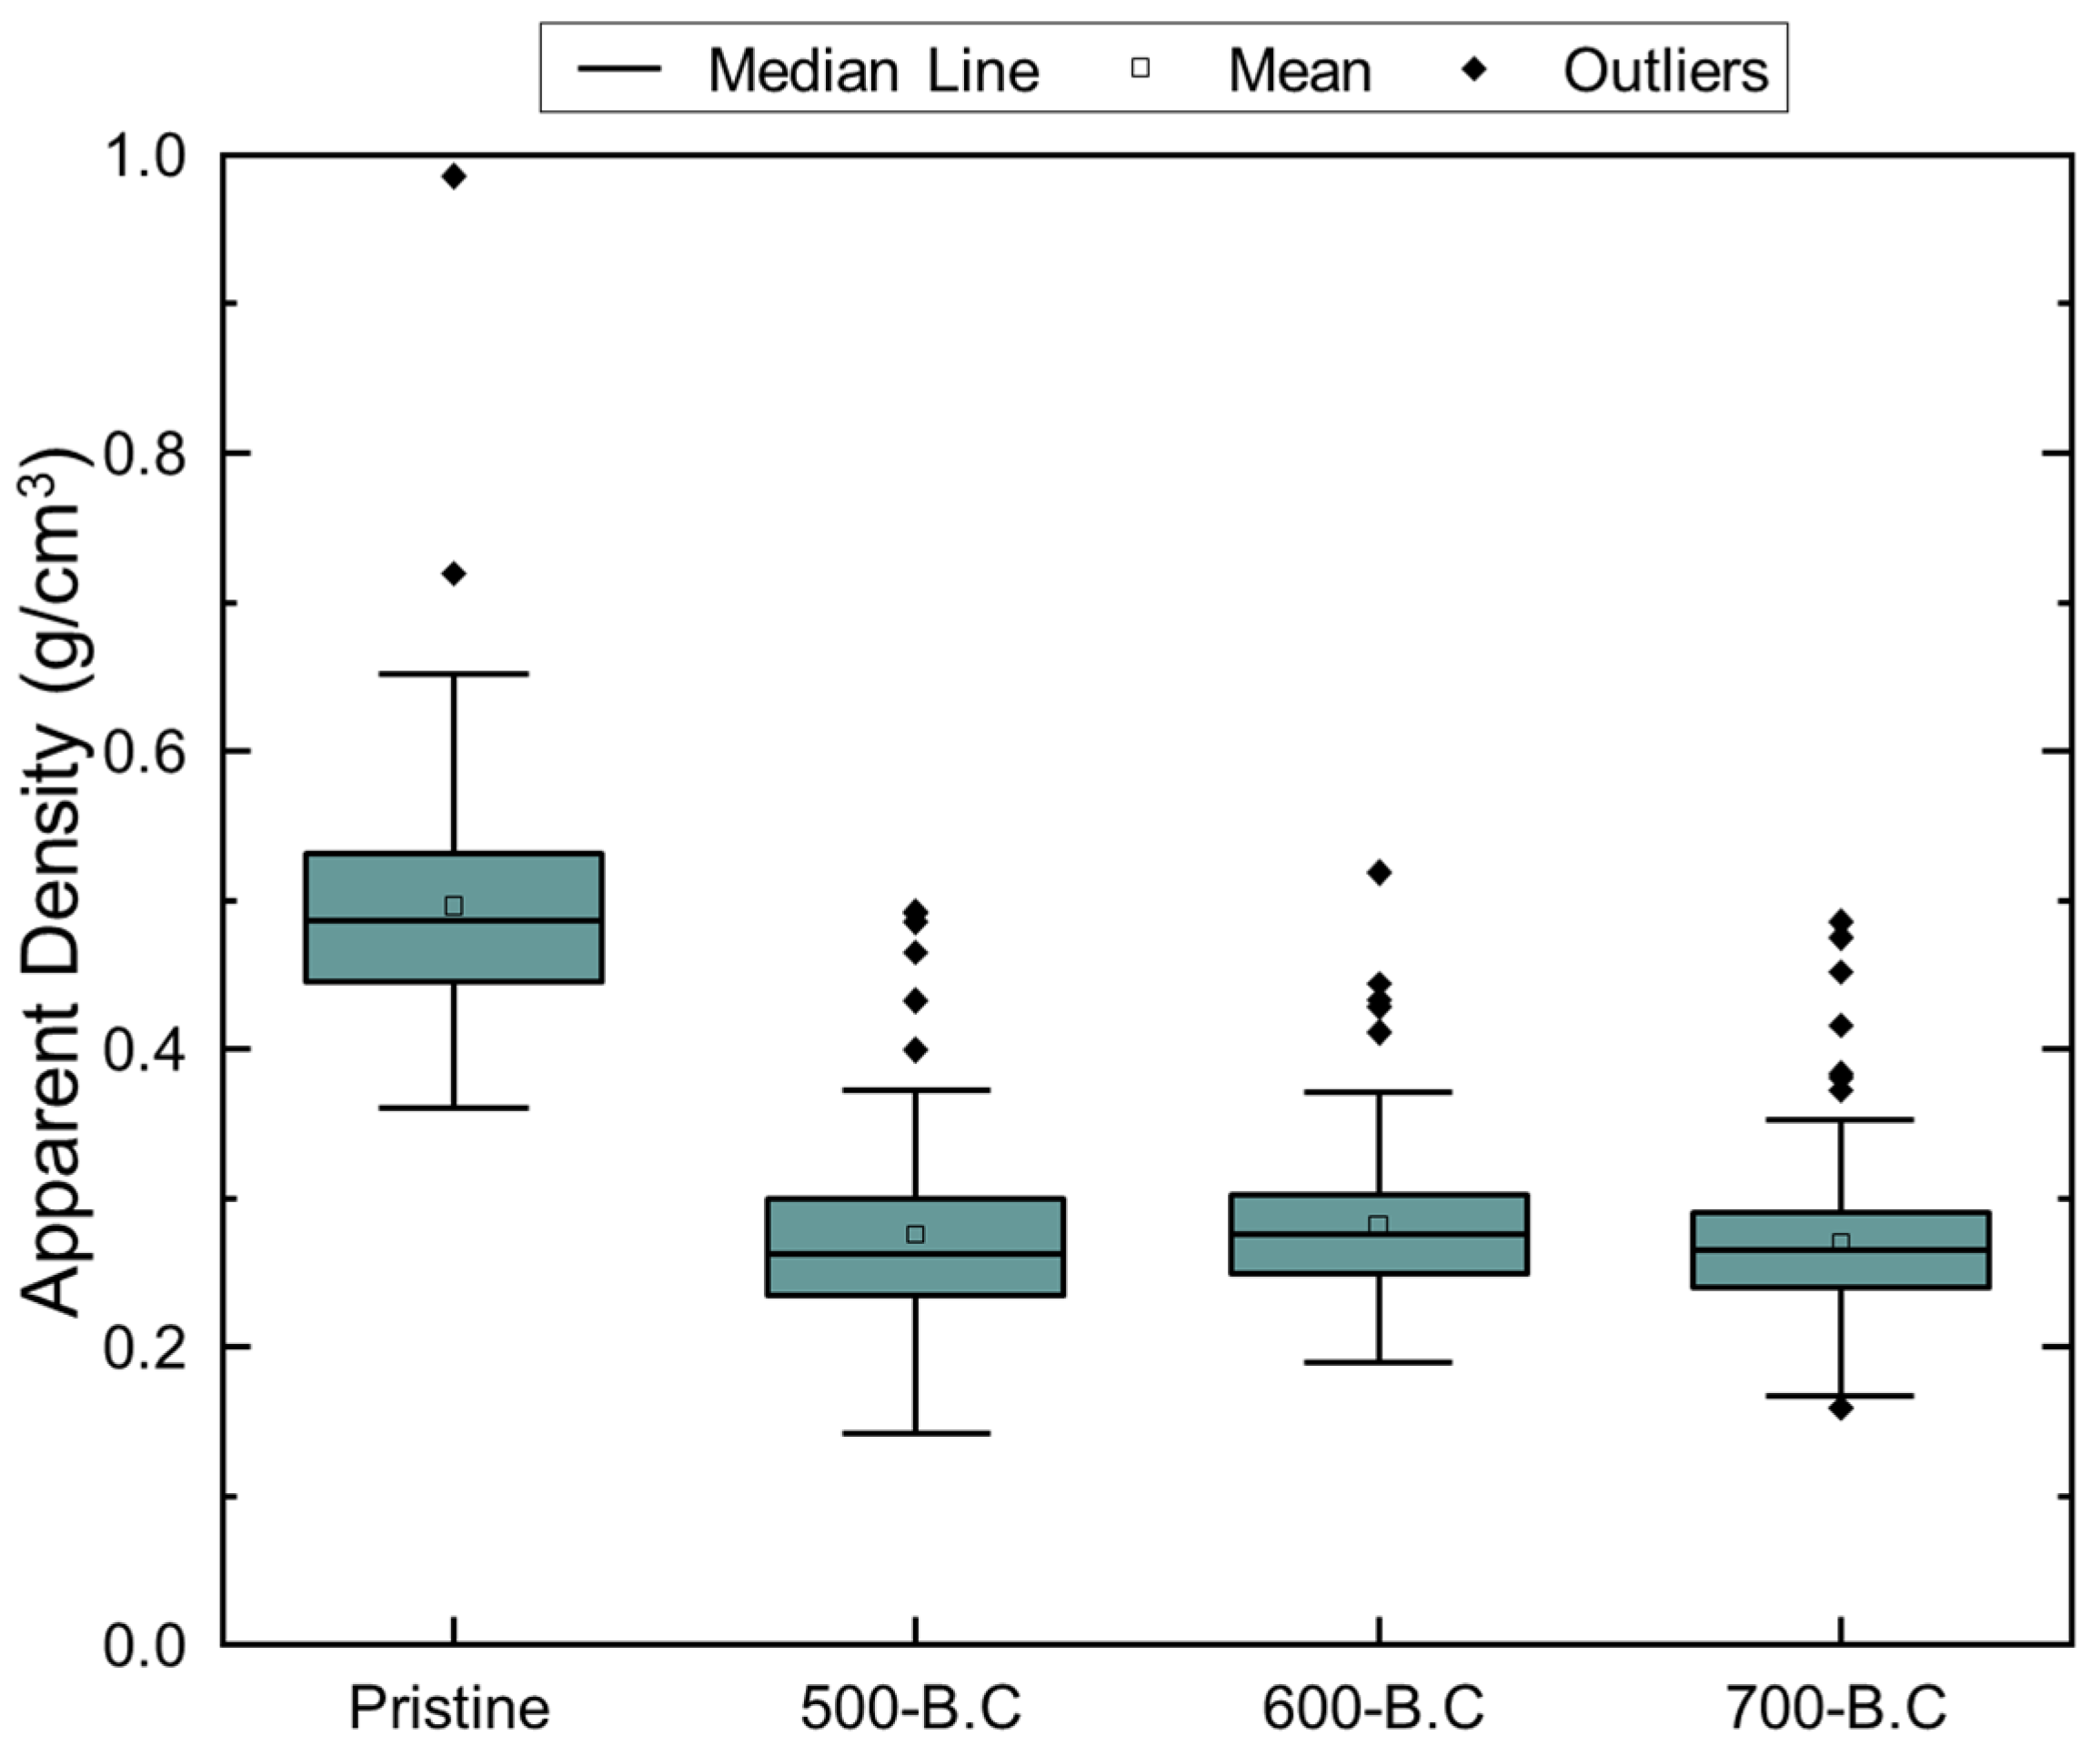
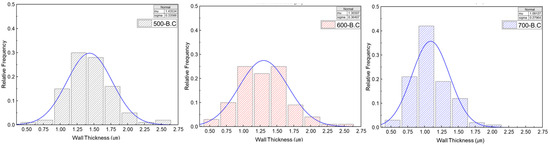
Figure A4.
Distribution of cell wall thickness of biochar with different pyrolysis temperatures measured by FE-SEM.
Figure A4.
Distribution of cell wall thickness of biochar with different pyrolysis temperatures measured by FE-SEM.
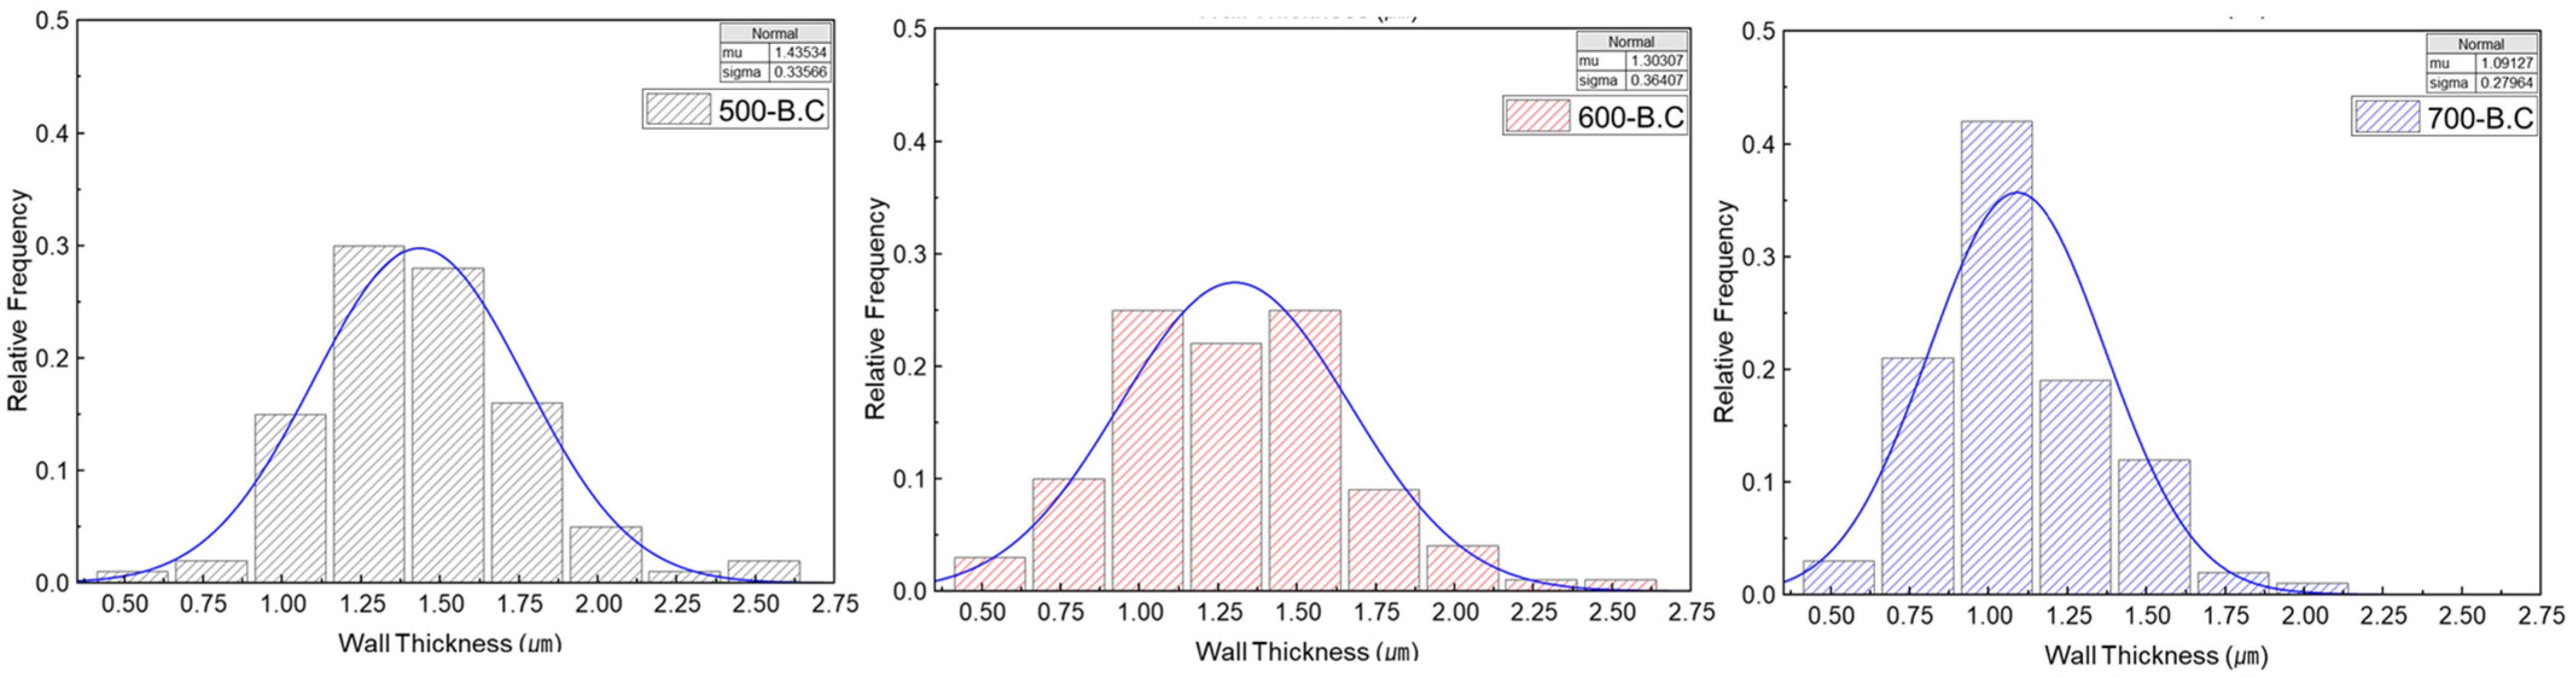

Figure A5.
Removal efficiency of NO and SO2 from biochar with different pyrolysis and activation conditions.
Figure A5.
Removal efficiency of NO and SO2 from biochar with different pyrolysis and activation conditions.
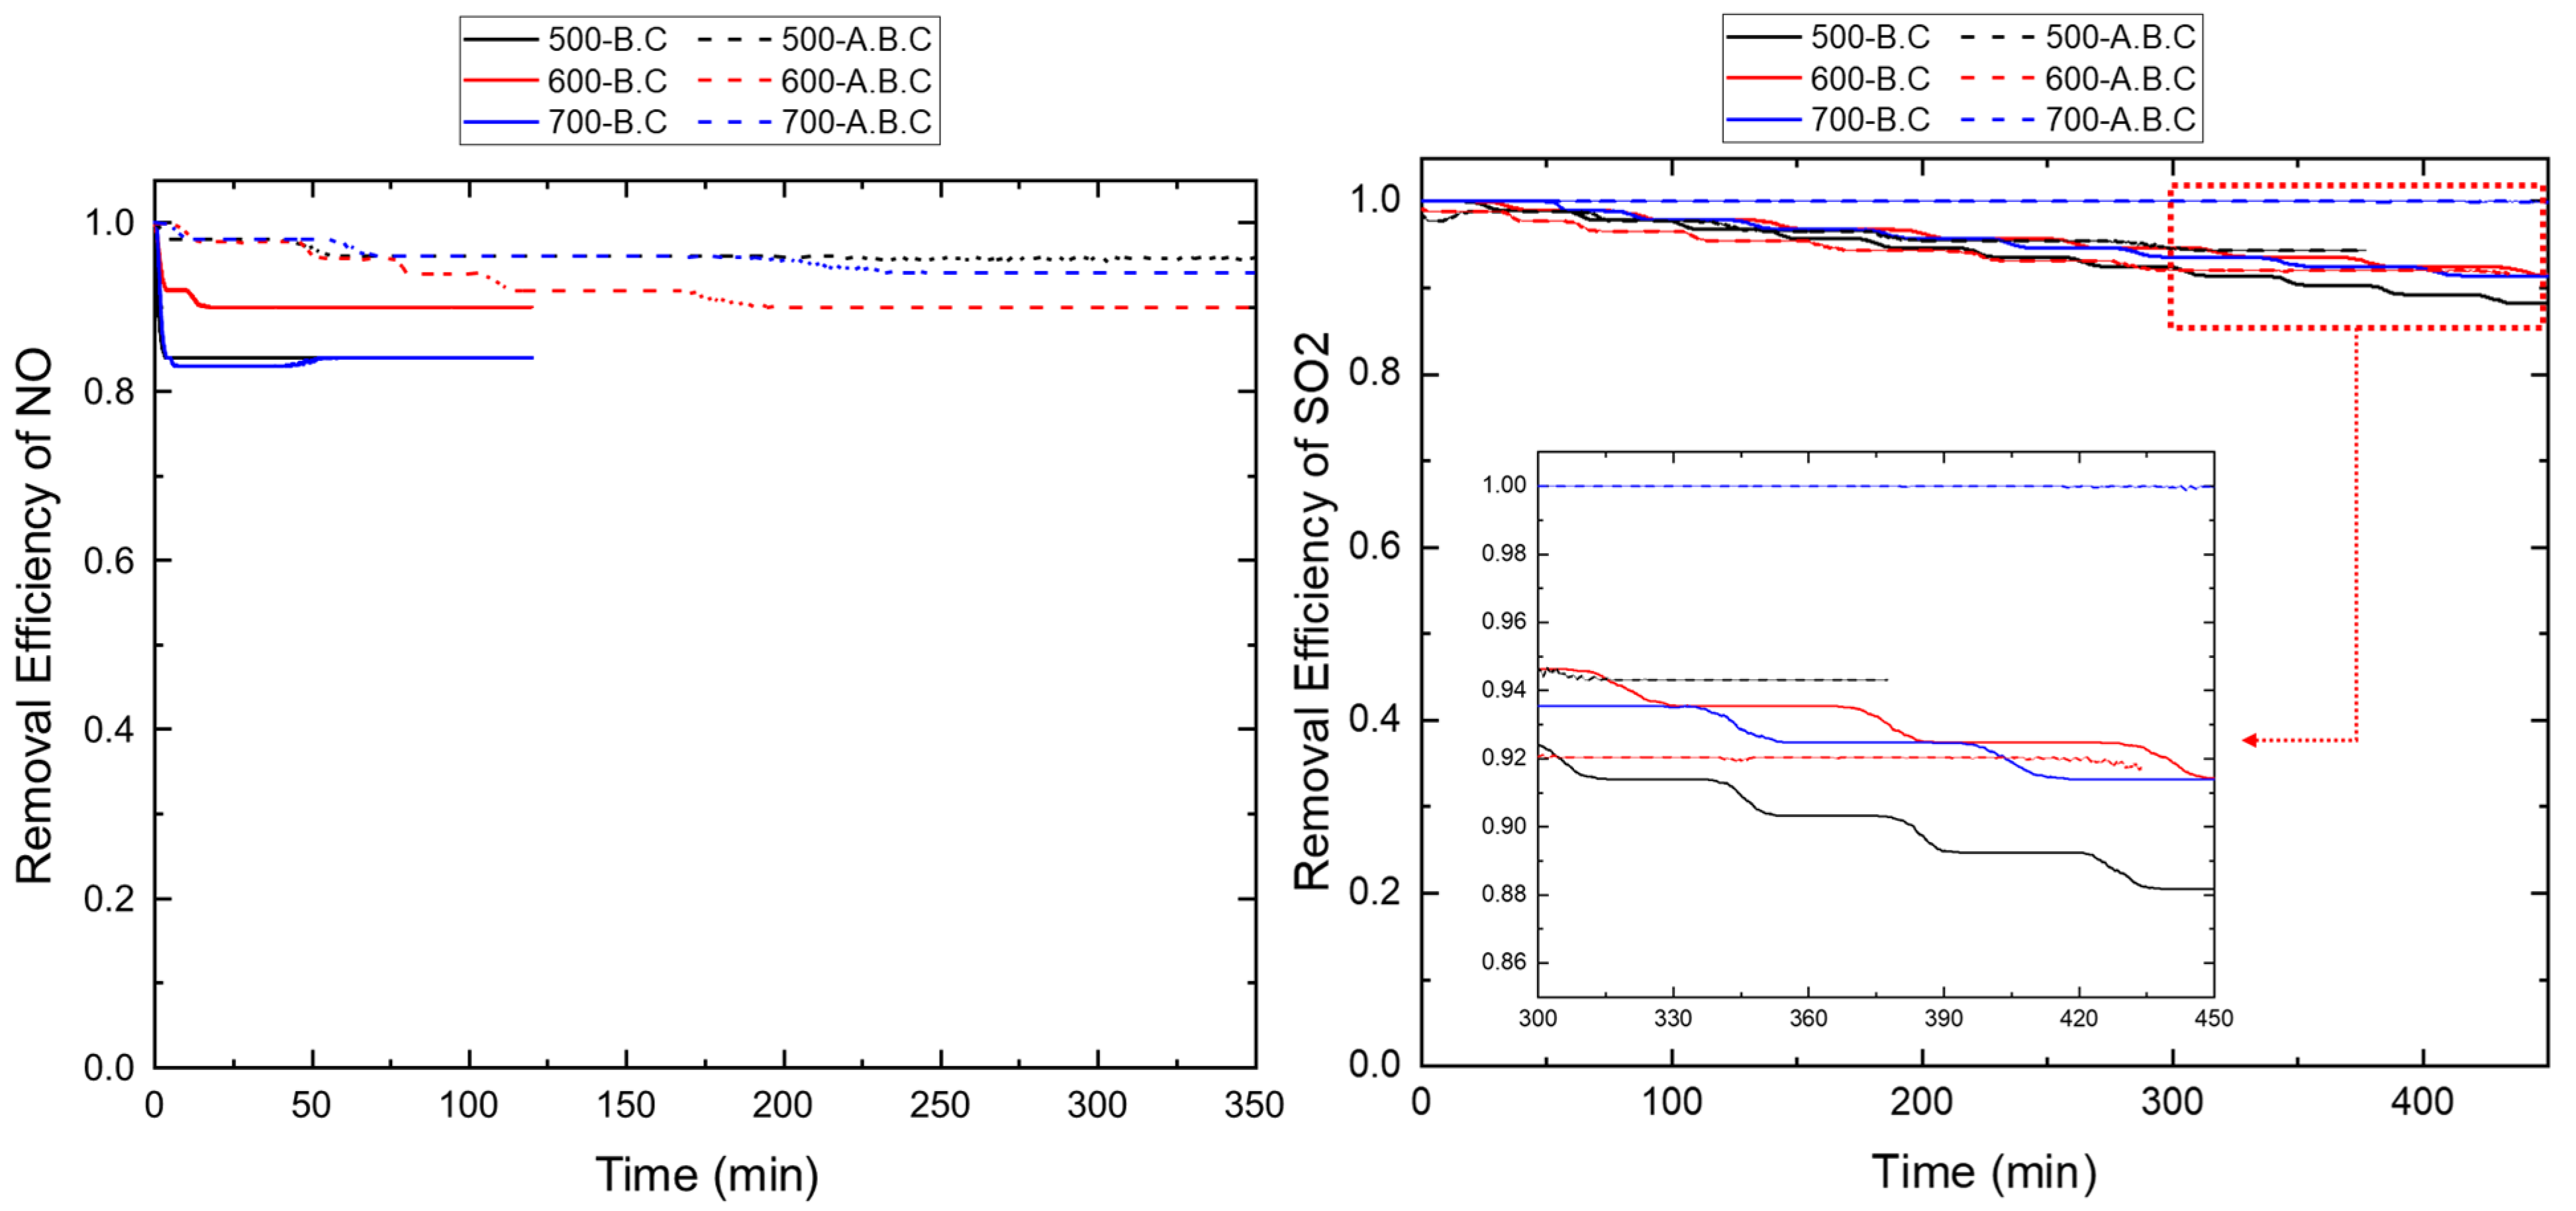

Figure A6.
Proposed mechanism for NO adsorption in the presence of O2 [32,33].
Figure A6.
Proposed mechanism for NO adsorption in the presence of O2 [32,33].
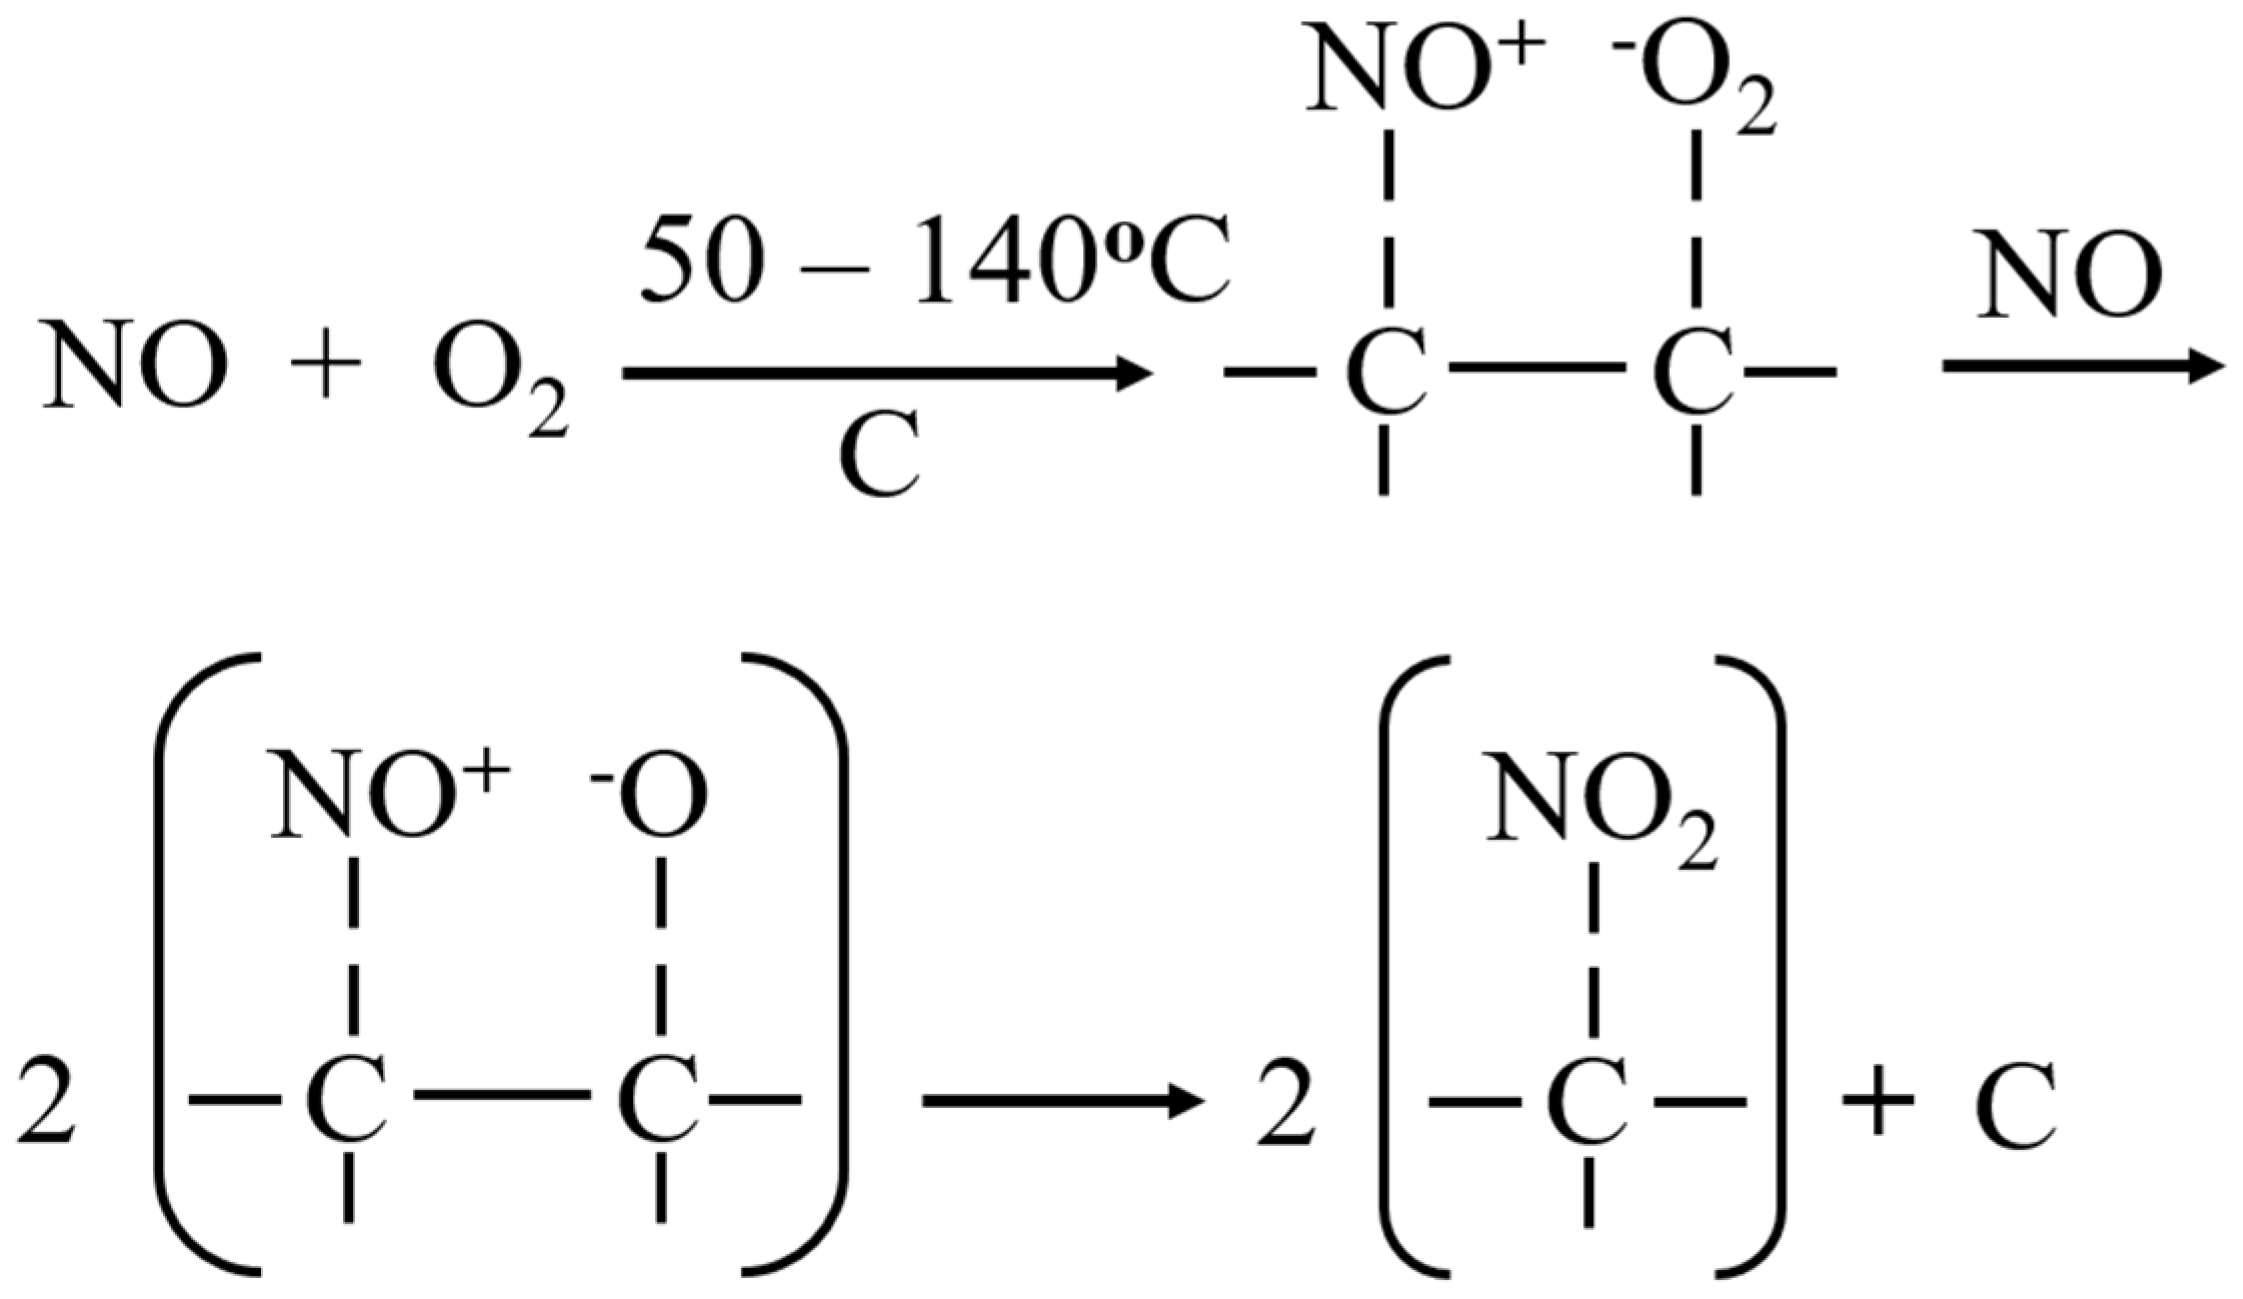
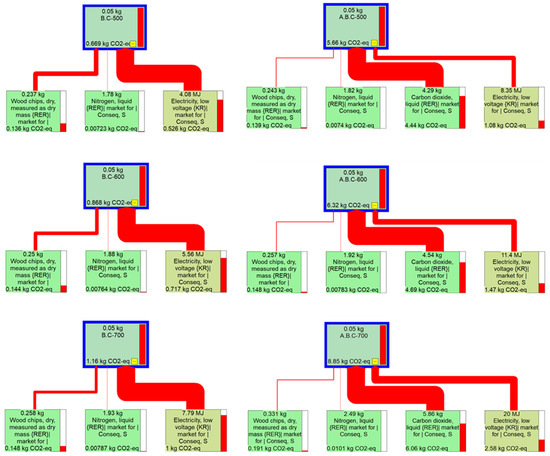
Figure A7.
Life cycle impact analysis of biochar for 50 g packed adsorption with different pyrolysis and activation conditions using IPCC 2021 and GWP 100 methods.
Figure A7.
Life cycle impact analysis of biochar for 50 g packed adsorption with different pyrolysis and activation conditions using IPCC 2021 and GWP 100 methods.
References
- Samanta, A.; Zhao, A.; Shimizu, G.K.H.; Sarkar, P.; Gupta, R. Post-Combustion CO2 Capture Using Solid Sorbents: A Review. Ind. Eng. Chem. Res. 2012, 51, 1438–1463. [Google Scholar] [CrossRef]
- Ko, J.H.; Park, R.S.; Jeon, J.K.; Kim, D.H.; Jung, S.C.; Kim, S.C.; Park, Y.K. Effect of Surfactant, HCl and NH3 Treatments on the Regeneration of Waste Activated Carbon Used in Selective Catalytic Reduction Unit. J. Ind. Eng. Chem. 2015, 32, 109–112. [Google Scholar] [CrossRef]
- Shi, X.; Liu, F.; Xie, L.; Shan, W.; He, H. NH3-SCR Performance of Fresh and Hydrothermally Aged Fe-ZSM-5 in Standard and Fast Selective Catalytic Reduction Reactions. Environ. Sci. Technol. 2013, 47, 3293–3298. [Google Scholar] [CrossRef] [PubMed]
- Shelef, M. Selective Catalytic Reduction of NOx with N-Free Reductants. Chem. Rev. 1995, 95, 209–225. [Google Scholar] [CrossRef]
- Gholami, F.; Tomas, M.; Gholami, Z.; Vakili, M. Technologies for the Nitrogen Oxides Reduction from Flue Gas: A Review. Sci. Total Environ. 2020, 714, 136712. [Google Scholar] [CrossRef]
- Hu, Z.; Jiang, E.; Ma, X. Numerical Simulation on Operating Parameters of SNCR Process in a Municipal Solid Waste Incinerator. Fuel 2019, 245, 160–173. [Google Scholar] [CrossRef]
- Srivastava, R.K.; Jozewicz, W.; Singer, C. SO2 Scrubbing Technologies: A Review. Environ. Prog 2001, 20, 219–228. [Google Scholar] [CrossRef]
- Pacciani, R.; Torres, J.; Solsona, P.; Coe, C.; Quinn, R.; Hufton, J.; Golden, T.; Vega, L.F. Influence of the Concentration of CO2 and SO2 on the Absorption of CO2 by a Lithium Orthosilicate-Based Absorbent. Environ. Sci. Technol. 2011, 45, 7083–7088. [Google Scholar] [CrossRef]
- Li, X.; Han, J.; Liu, Y.; Dou, Z.; Zhang, T. an Summary of Research Progress on Industrial Flue Gas Desulfurization Technology. Sep. Purif. Technol. 2022, 281, 119849. [Google Scholar] [CrossRef]
- Yang, X.; Yi, H.; Tang, X.; Zhao, S.; Yang, Z.; Ma, Y.; Feng, T.; Cui, X. Behaviors and Kinetics of Toluene Adsorption-desorption on Activated Carbons with Varying Pore Structure. J. Environ. Sci. 2018, 67, 104–114. [Google Scholar] [CrossRef]
- Hanif, M.A.; Ibrahim, N.; Jalil, A.A. Sulfur Dioxide Removal: An Overview of Regenerative Flue Gas Desulfurization and Factors Affecting Desulfurization Capacity and Sorbent Regeneration. Environ. Sci. Pollut. Res. 2020, 27, 27515–27540. [Google Scholar] [CrossRef]
- Qie, Z.; Sun, F.; Zhang, Z.; Pi, X.; Qu, Z.; Gao, J.; Zhao, G. A Facile Trace Potassium Assisted Catalytic Activation Strategy Regulating Pore Topology of Activated Coke for Combined Removal of Toluene/SO2/NO. Chem. Eng. J. 2020, 389, 124262. [Google Scholar] [CrossRef]
- Olson, D.G.; Tsuji, K.; Shiraishi, I. The Reduction of Gas Phase Air Toxics from Combustion and Incineration Sources Using the MET–Mitsui–BF Activated Coke Process. Fuel Process. Technol. 2000, 65–66, 393–405. [Google Scholar] [CrossRef]
- Yang, L.; Jiang, W.; Yao, L.; Jiang, X.; Li, J. Suitability of Pyrolusite as Additive to Activated Coke for Low-Temperature NO Removal. J. Chem. Technol. Biotechnol. 2018, 93, 690–697. [Google Scholar] [CrossRef]
- Kawano, T.; Kubota, M.; Onyango, M.S.; Watanabe, F.; Matsuda, H. Preparation of Activated Carbon from Petroleum Coke by KOH Chemical Activation for Adsorption Heat Pump. Appl. Therm. Eng. 2008, 28, 865–871. [Google Scholar] [CrossRef]
- Yuan, M.; Kim, Y.; Jia, C.Q. Feasibility of Recycling KOH in Chemical Activation of Oil-Sands Petroleum Coke. Can. J. Chem. Eng. 2012, 90, 1472–1478. [Google Scholar] [CrossRef]
- Ahmad, M.; Rajapaksha, A.U.; Lim, J.E.; Zhang, M.; Bolan, N.; Mohan, D.; Vithanage, M.; Lee, S.S.; Ok, Y.S. Biochar as a Sorbent for Contaminant Management in Soil and Water: A Review. Chemosphere 2014, 99, 19–33. [Google Scholar] [CrossRef]
- Han, J.; Zhang, L.; Zhao, B.; Qin, L.; Wang, Y.; Xing, F. The N-Doped Activated Carbon Derived from Sugarcane Bagasse for CO2 Adsorption. Ind. Crops Prod. 2019, 128, 290–297. [Google Scholar] [CrossRef]
- Yang, G.; Song, S.; Li, J.; Tang, Z.; Ye, J.; Yang, J. Preparation and CO2 Adsorption Properties of Porous Carbon by Hydrothermal Carbonization of Tree Leaves. J. Mater. Sci. Technol. 2019, 35, 875–884. [Google Scholar] [CrossRef]
- Rao, L.; Liu, S.; Wang, L.; Ma, C.; Wu, J.; An, L.; Hu, X. N-Doped Porous Carbons from Low-Temperature and Single-Step Sodium Amide Activation of Carbonized Water Chestnut Shell with Excellent CO2 Capture Performance. Chem. Eng. J. 2019, 359, 428–435. [Google Scholar] [CrossRef]
- Chao, C.; Deng, Y.; Dewil, R.; Baeyens, J.; Fan, X. Post-Combustion Carbon Capture. Renew. Sustain. Energy Rev. 2021, 138, 110490. [Google Scholar] [CrossRef]
- Srivastava, A.; Gupta, B.; Majumder, A.; Gupta, A.K.; Nimbhorkar, S.K. A Comprehensive Review on the Synthesis, Performance, Modifications, and Regeneration of Activated Carbon for the Adsorptive Removal of Various Water Pollutants. J. Environ. Chem. Eng. 2021, 9, 106177. [Google Scholar] [CrossRef]
- Roberts, K.G.; Gloy, B.A.; Joseph, S.; Scott, N.R.; Lehmann, J. Life Cycle Assessment of Biochar Systems: Estimating the Energetic, Economic, and Climate Change Potential. Environ. Sci. Technol. 2010, 44, 827–833. [Google Scholar] [CrossRef] [PubMed]
- Spokas, K.A.; Cantrell, K.B.; Novak, J.M.; Archer, D.W.; Ippolito, J.A.; Collins, H.P.; Boateng, A.A.; Lima, I.M.; Lamb, M.C.; McAloon, A.J.; et al. Biochar: A Synthesis of Its Agronomic Impact beyond Carbon Sequestration. J. Environ. Qual. 2012, 41, 973–989. [Google Scholar] [CrossRef] [PubMed]
- Opare, E.O.; Struhs, E.; Mirkouei, A. A Comparative State-of-Technology Review and Future Directions for Rare Earth Element Separation. Renew. Sustain. Energy Rev. 2021, 143, 110917. [Google Scholar] [CrossRef]
- Wen, C.; Liu, T.; Wang, D.; Wang, Y.; Chen, H.; Luo, G.; Zhou, Z.; Li, C.; Xu, M. Biochar as the Effective Adsorbent to Combustion Gaseous Pollutants: Preparation, Activation, Functionalization and the Adsorption Mechanisms. Prog. Energy Combust. Sci. 2023, 99, 101098. [Google Scholar] [CrossRef]
- Lee, Y.; Eum, P.-R.-B.; Ryu, C.; Park, Y.-K.; Jung, J.-H.; Hyun, S. Characteristics of Biochar Produced from Slow Pyrolysis of Geodae-Uksae 1. Bioresour. Technol. 2013, 130, 345–350. [Google Scholar] [CrossRef]
- Wen, W.; Wen, C.; Wang, D.; Zhu, G.; Yu, J.; Ling, P.; Xu, M.; Liu, T. A Review on Activated Coke for Removing Flue Gas Pollutants (SO2, NOx, Hg0, and VOCs): Preparation, Activation, Modification, and Engineering Applications. J. Environ. Chem. Eng. 2024, 12, 111964. [Google Scholar] [CrossRef]
- Al-Rahbi, A.S.; Williams, P.T. Production of Activated Carbons from Waste Tyres for Low Temperature NOx Control. Waste Manag. 2016, 49, 188–195. [Google Scholar] [CrossRef]
- Zhang, X.; Zheng, H.; Li, G.; Gu, J.; Shao, J.; Zhang, S.; Yang, H.; Chen, H. Ammoniated and Activated Microporous Biochar for Enhancement of SO2 Adsorption. J. Anal. Appl. Pyrolysis 2021, 156, 105119. [Google Scholar] [CrossRef]
- Shen, B.; Liu, Z.; Xu, H.; Wang, F. Enhancing the Absorption of Elemental Mercury Using Hydrogen Peroxide Modified Bamboo Carbons. Fuel 2019, 235, 878–885. [Google Scholar] [CrossRef]
- Zhang, T.; Walawender, W.P.; Fan, L.T.; Fan, M.; Daugaard, D.; Brown, R.C. Preparation of Activated Carbon from Forest and Agricultural Residues through CO2 Activation. Chem. Eng. J. 2004, 105, 53–59. [Google Scholar] [CrossRef]
- Zhang, X.; Zhang, S.; Yang, H.; Feng, Y.; Chen, Y.; Wang, X.; Chen, H. Nitrogen Enriched Biochar Modified by High Temperature CO2-Ammonia Treatment: Characterization and Adsorption of CO2. Chem. Eng. J. 2014, 257, 20–27. [Google Scholar] [CrossRef]
- Rashidi, N.A.; Yusup, S.; Hameed, B.H. Kinetic Studies on Carbon Dioxide Capture Using Lignocellulosic Based Activated Carbon. Energy 2013, 61, 440–446. [Google Scholar] [CrossRef]
- Zhang, J.; Shao, J.; Huang, D.; Feng, Y.; Zhang, X.; Zhang, S.; Chen, H. Influence of Different Precursors on the Characteristic of Nitrogen-Enriched Biochar and SO2 Adsorption Properties. Chem. Eng. J. 2020, 385, 123932. [Google Scholar] [CrossRef]


Disclaimer/Publisher’s Note: The statements, opinions and data contained in all publications are solely those of the individual author(s) and contributor(s) and not of MDPI and/or the editor(s). MDPI and/or the editor(s) disclaim responsibility for any injury to people or property resulting from any ideas, methods, instructions or products referred to in the content. |
© 2025 by the authors. Licensee MDPI, Basel, Switzerland. This article is an open access article distributed under the terms and conditions of the Creative Commons Attribution (CC BY) license (https://creativecommons.org/licenses/by/4.0/).