Article

Visitor Number Prediction for Daegwallyeong Forest Trail Using Machine Learning

1
Forest Human Service Division, National Institute of Forest Science, Seoul 02455, Republic of Korea
2
Future City Strategy Division, Gumi City Hall, Gumi 39281, Republic of Korea
3
Legislation and Policy Team, Jeonju City Council, Jeonju 54994, Republic of Korea
*
Author to whom correspondence should be addressed.
Sustainability 2025, 17(13), 6061; https://doi.org/10.3390/su17136061
Submission received: 2 May 2025 / Revised: 30 June 2025 / Accepted: 30 June 2025 / Published: 2 July 2025

Abstract

Predicting forest trail visitation is essential for sustainable management and policy development, including infrastructure planning, safety operations, and conservation. However, due to numerous informal access points and complex external influences, accurately monitoring visitor numbers remains challenging. This study applied random forest, gradient boosting, and LightGBM models with Bayesian optimization to predict daily visitor counts across six sections of the National Daegwallyeong Forest Trail, incorporating variables such as weather conditions, social media activity, COVID-19 case counts, tollgate traffic volume, and local festivals. SHAP analysis revealed that tollgate traffic volume and weekends consistently increased visitation across all sections. The impact of temperature varied by section: higher temperatures increased visitation in Kukmin Forest, whereas lower temperatures were associated with higher visitation at Seonjaryeong Peak. COVID-19 cases demonstrated negative effects across all sections. By integrating diverse variables and conducting section-level analysis, this study identified detailed visitation patterns and provided a practical basis for adaptive, section- and season-specific management strategies. These findings support flexible measures such as seasonal staffing, congestion mitigation, and real-time response systems and contribute to the advancement of data-driven regional tourism management frameworks in the context of evolving nature-based tourism demand.

1. Introduction

With the intensification of urbanization and technology-driven lifestyles, there is a growing societal demand for natural environments and an increasing research focus on understanding the interactions between humans and nature [1]. Forest trails are used for leisure, sports, exploration, recreation, and healing [2] and are thus considered multifunctional spaces supporting conservation, education, health, and therapy [3,4]. Increasing research has been dedicated to understanding the human–forest trail relationship, identifying the multifaceted values of trails, and representing these insights in policy and practice.
Research on forest trails has progressively advanced from foundational studies of ecological, social, and economic value to areas such as ecosystem service assessment [5], trail design and management, and disaster response. Recently, this field has incorporated technological innovations such as drones and artificial intelligence (AI) [6]. Big data and AI technologies have gained attention because of their potential to enhance the systematic management, operation, and ecosystem conservation of forests and forest trails [7,8].
The rapid development of big data and AI has introduced a new paradigm to forest trail research. Machine learning (ML) enables computers to learn autonomously from input data and has proven to be useful for analyzing large-scale datasets [9]. In particular, ML has proven effective in uncovering hidden patterns within large datasets, making it well-suited for modeling complex, nonlinear relationships that are often difficult to capture using traditional statistical methods [10,11,12]. Unlike conventional forecasting models that rely on linear assumptions and fixed structures, ML algorithms offer greater flexibility by accommodating high-dimensional and heterogeneous data, including spatial, temporal, environmental, and behavioral variables [13,14]. This flexibility enables the development of predictive models that are not only more accurate, but also more resilient to noise and missing values. Moreover, ML supports scalable and automated model training and prediction processes, allowing models to be updated continuously as new data become available—without requiring manual recalibration. This adaptability is especially useful in dynamic environments like forest trails, where visitor patterns can shift rapidly due to external factors such as weather and seasonality [10,11,12,15]. Consequently, ML-based forecasting improves operational responsiveness, facilitates real-time decision-making, and ultimately contributes to more efficient and sustainable forest trail management [16].
Various comprehensive studies have assessed forests and forest trails in terms of sensor data, spatial information, user behavior patterns, and weather conditions. Chen et al. [17] used vegetation indices and machine learning to detect storm-damaged vegetation and estimate forest damage. Staab et al. [18] used convolutional neural networks to automatically monitor forest trail visitor numbers, highlighting their potential contributions to environmental protection and wildlife management. Rahaman et al. [19] utilized satellite imagery and machine learning techniques to predict deforestation caused by refugee influxes, indicating their applicability in forest degradation monitoring.
The Daegwallyeong Forest Trail, designated as a National Forest Trail by the Korea Forest Service, is recognized for its ecological, historical, and cultural significance and thus requires systematic operation and management. Previous research on National Forest Trails has addressed various topics, including institutional framework development [20], visitor perception analysis through surveys and text mining [21], impact on quality of life [22], and analyses of economic ripple effects [23]. However, few studies have quantitatively analyzed the usage patterns or predicted visitor numbers using big data.
Visitor forecasting for forest trails is not only important for understanding usage patterns but is also closely linked to budgeting decisions related to operations, staff deployment, infrastructure development, and facility maintenance. Furthermore, it serves as a practical foundation for sustainable management and ecosystem conservation. This study aimed to predict visitor numbers at the Daegwallyeong Forest Trail using machine learning models, determine the factors influencing fluctuations in visitor volume, and provide practicable information for forest trail managers and on-site operators in developing effective management strategies.

2. Literature Review

Visitor prediction has been conducted in various fields such as tourism and festival planning, where machine learning approaches have improved prediction accuracy and demonstrated potential as decision support tools [24,25]. Tourism demand forecasting has been performed using various methodologies since the 1960s [26,27].
Although AI-based research on forest trail environments is gradually expanding, relatively few studies have focused specifically on forecasting visitor numbers. Therefore, this literature review primarily examines machine learning-based visitor prediction studies conducted in open parks, nature-based tourist sites, and other walkable destinations. Additionally, relevant studies in non-tourism contexts with comparable predictive objectives were reviewed. Table 1 provides a summary of the major previous studies examined in this study.
A machine learning-based visitor forecasting model was developed to support the post-COVID-19 recovery of Mocho, a tourist destination in northern Peru. Public data from 2011 to 2022, along with TripAdvisor and Google Trends data, were used to compare multiple models, including linear regression, K-nearest neighbors (KNN), decision trees, and random forest. Linear regression demonstrated the highest prediction accuracy and was considered the most viable tool for supporting recovery strategies [28].
Visitor frequency—categorized as high, medium, or low—was predicted for 18 protected areas in Sarawak using KNN, decision tree, and naïve Bayes classifiers. Decision trees showed the best performance. Key variables influencing domestic and international tourist visits were identified, suggesting that visitor forecasting can support ecosystem conservation and infrastructure planning [29].
Museum visitations were forecasted using weather conditions, days of the week, and calendar months as input features. Linear regression, neural networks, XGBoost, and random forest were employed, with XGBoost showing the highest performance. While weather had only a minor impact compared to time-related variables such as day of the week and school holidays, it was suggested that weather might have a greater influence on open-air cultural venues like outdoor performance spaces [30].
A study forecasting daily visitor volume at Huangshan Mountain incorporated weather data, web search trends, and holiday calendars using an ensemble LSTM model. Weather variables were found to be key contributors to prediction accuracy [31].
To mitigate potential overtourism in the city of Liuzhou, China, tourist volume was forecasted using data from 2015 to 2019, including holidays, temperature, weather conditions, and past visitor flow. Eight different models—including random forest, SVR, RNN, and LSTM—were compared, and the SPCA-CNNLSTM hybrid model was found to be particularly effective for short-term forecasting [32].
To develop a forecasting algorithm for the number of visitors by municipality in Gangwon Province, a study analyzed both meteorological and non-meteorological variables. Using a gradient boosting machine (GBM)-based model, the authors identified a strong correlation between weather conditions and visitor volume, with an average correlation coefficient of 0.81, indicating that summer weather significantly influences tourist activity. The findings provide foundational data that can be used to improve the accuracy of future visitor forecasts [33].

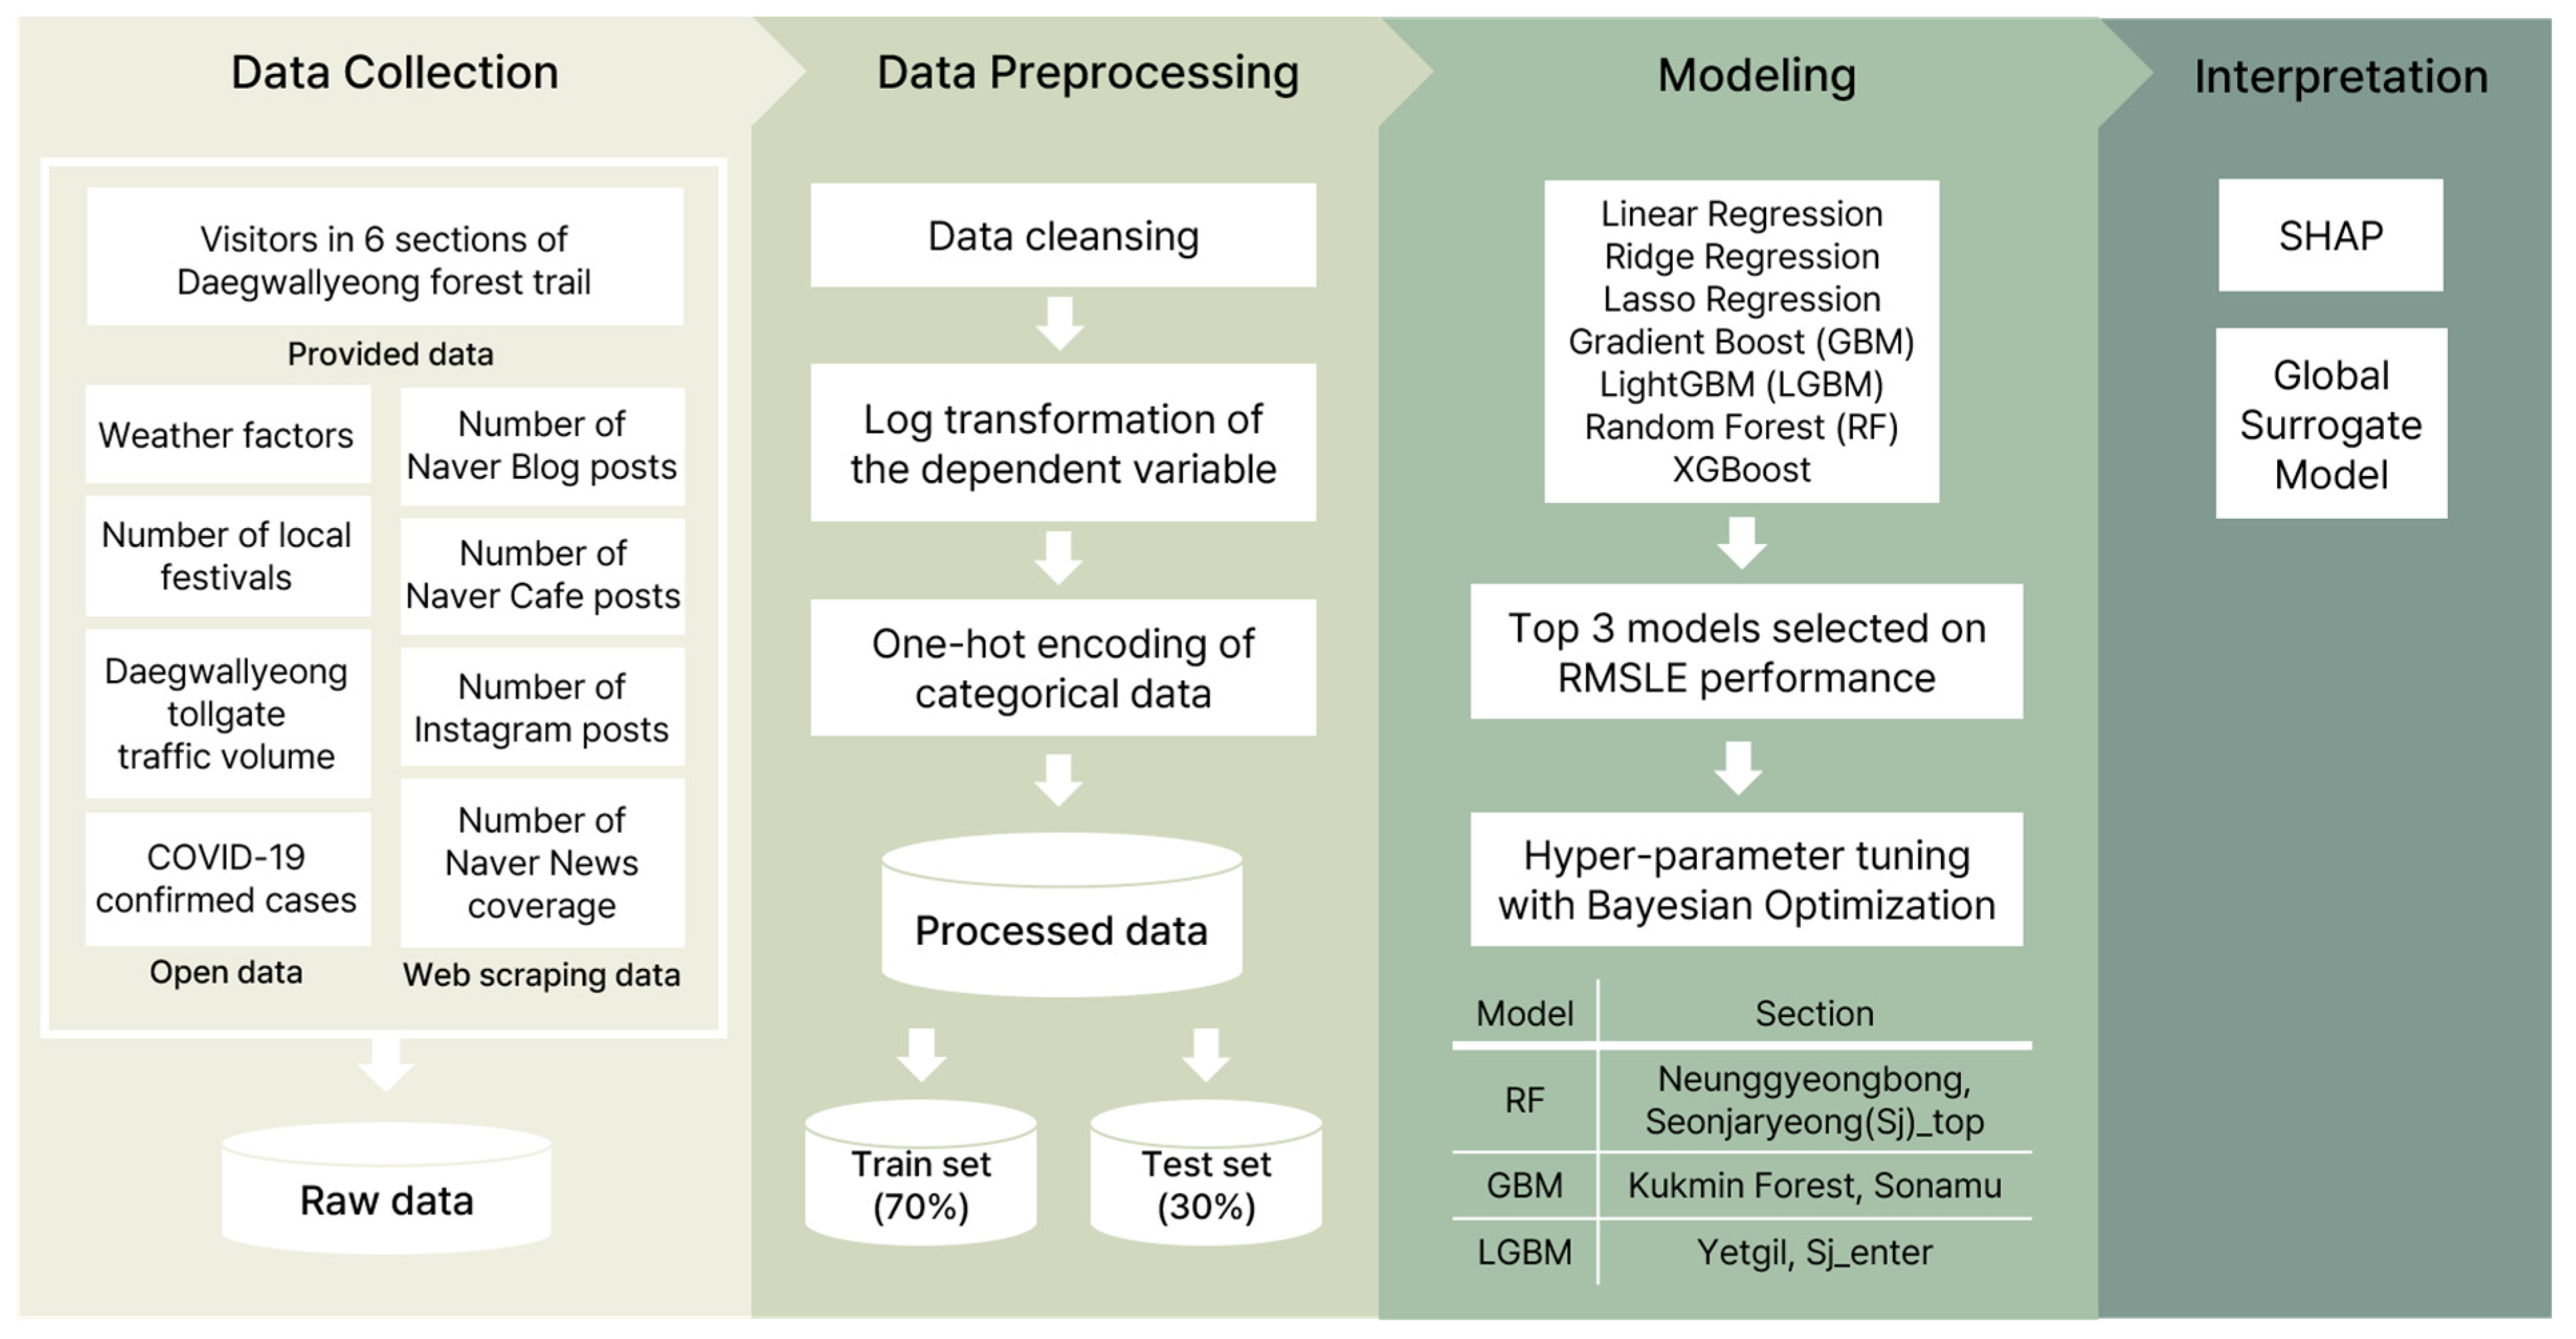
3. Materials and Methods
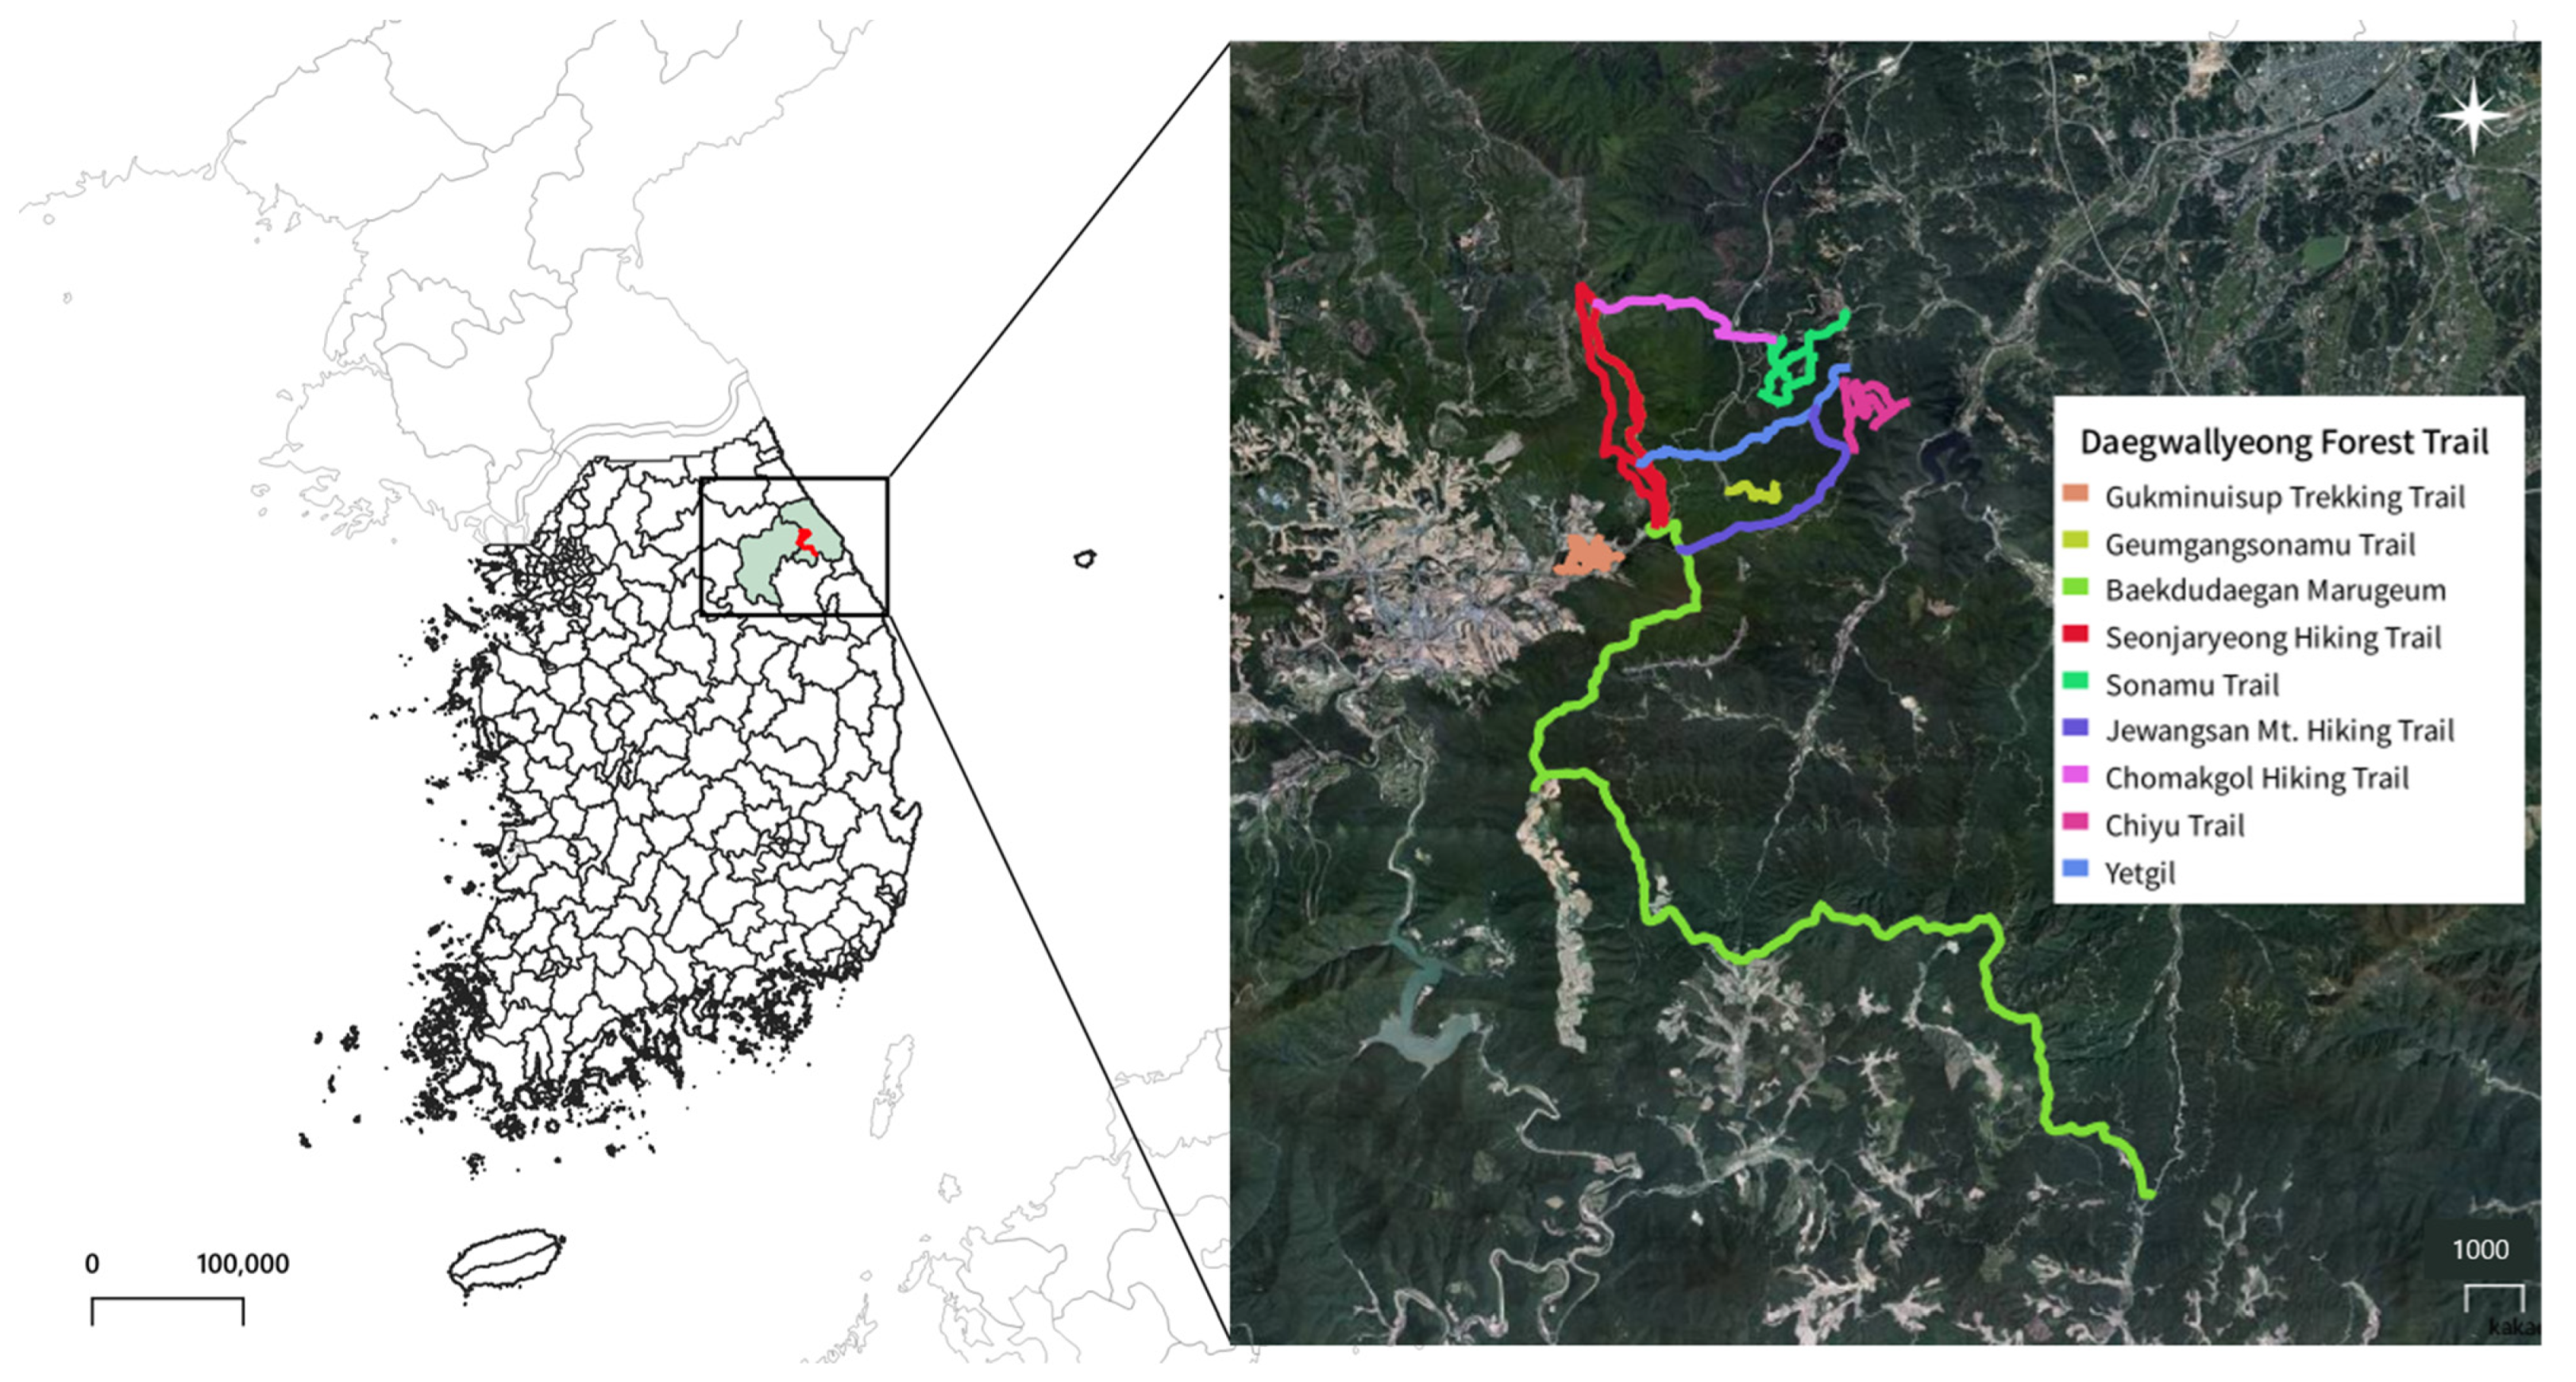
The workflow for the machine learning-based analysis is illustrated in Figure 1. A visitor prediction model for the Daegwallyeong Forest Trail was developed through data collection, data preprocessing, machine learning model evaluation and selection, hyperparameter tuning, and interpretation of the optimized models.

3.1. Study Area

The Daegwallyeong Forest Trail spans a total length of 102.96 km and is Korea’s first National Forest Trail, designated under the Act on the Promotion of Forest Culture and Recreation. It stretches across Gangneung and Pyeongchang in Gangwon and consists of 12 individual courses and 4 circular courses (Figure 2) [34]. Six trail sections equipped with automatic visitor counters were selected for analysis: Daegwallyeong Yetgil (Yetgil), Neunggyeongbong (Nk), Kukmin Forest (Km), Daegwallyeong Sonamu Trail (Sonamu), Seonjaryeong Entrance (Sj_enter), and Seonjaryeong Peak (Sj_top). The characteristics of each section are listed in Table 2.

3.2. Variable Selection

We selected 13 independent variables expected to influence the number of visitors, including 4 weather-related variables, 4 social media- and news-related variables, and 5 additional variables such as tollgate traffic and the number of COVID-19 cases (Table 3).
Various atmospheric factors determine the global climate, such as temperature, precipitation, wind direction, wind speed, humidity, cloud cover, evaporation, solar radiation, and sunshine duration [35]. The Daegwallyeong Forest Trail, located at an elevation of 772.4 m, has an annual average temperature of 6.6 °C, an annual precipitation of 1898.0 mm, and an average wind speed of 4.3 m/s. Notably, >110 frost days are reported per year, demonstrating unique climatic characteristics [36]. Based on the relationship between these regional characteristics and trail usage, we selected daily maximum temperature, average wind speed, total daily precipitation, and average fine dust (PM10) concentration.
Previous studies indicated that tourists rely heavily on social media and online news content when selecting destinations, which suggests that such digital indicators can serve as meaningful variables for explaining or predicting tourism demand and visitor numbers [37,38]. In 2024, KakaoTalk, Instagram, and Naver were identified as the most frequently used apps among Koreans [39]. Accordingly, the number of Instagram posts and Naver Blog, Naver Café, and Naver News articles mentioning “Daegwallyeong Forest Trail” and its subsections were selected.
Consistent with previous findings that transportation accessibility affects tourism demand [40], the daily traffic volume passing through the Daegwallyeong IC tollgate was included as a variable. We also selected local festivals in Gangneung and Pyeongchang (where the trail is located), the number of daily confirmed COVID-19 cases in Korea, and temporal variables, such as the day of the week and month.

3.3. Data Collection

To predict the number of visitors to the Daegwallyeong Forest Trail, visitor count data were collected from automatic counters installed at six trail sections between 1 January 2020 and 31 October 2022. This dataset, provided by the Eastern Regional Office of the Forest Service, includes the trail section, date of collection, and number of visitors.
Weather data was obtained from the Automated Synoptic Observing System (ASOS) provided by the Korea Meteorological Administration Open Data Portal [41]. Maximum daily temperature, average wind speed, and daily precipitation data for the Daegwallyeong station were collected for 1 January 2020–31 October 2022. Daily average PM10 concentration data were collected from the AirKorea platform [42], based on measurements at the Daegwallyeong monitoring site.
To analyze the volume of social media and news content, web posts were screened from 1 January 2020 to 31 October 2022, on Naver Blog [43], Naver Café [44], Naver News [45], and Instagram [46]. Using Python 3 (Python Software Foundation, Beaverton, OR, USA), posts containing keywords such as “Seonjaryeong” and “Daegwallyeong” were searched for, and the posting date, title, and content were recorded.
Tollgate traffic data were obtained from the Korea Expressway Corporation’s Public Data Portal [47], covering the daily traffic volumes for tollgates in the Gangwon region for 1 January 2020–31 October 2022.
COVID-19 case data were sourced from the Korean Public Data Portal [48] via the Ministry of Health and Welfare’s COVID-19 Status API, which provides the daily number of confirmed cases nationwide for 1 January 2020–31 October 2022.
Finally, information on local festival events was collected from the Ministry of Culture, Sports, and Tourism, which provides records of regional festivals held from 1 January 2020 to 31 October 2022.

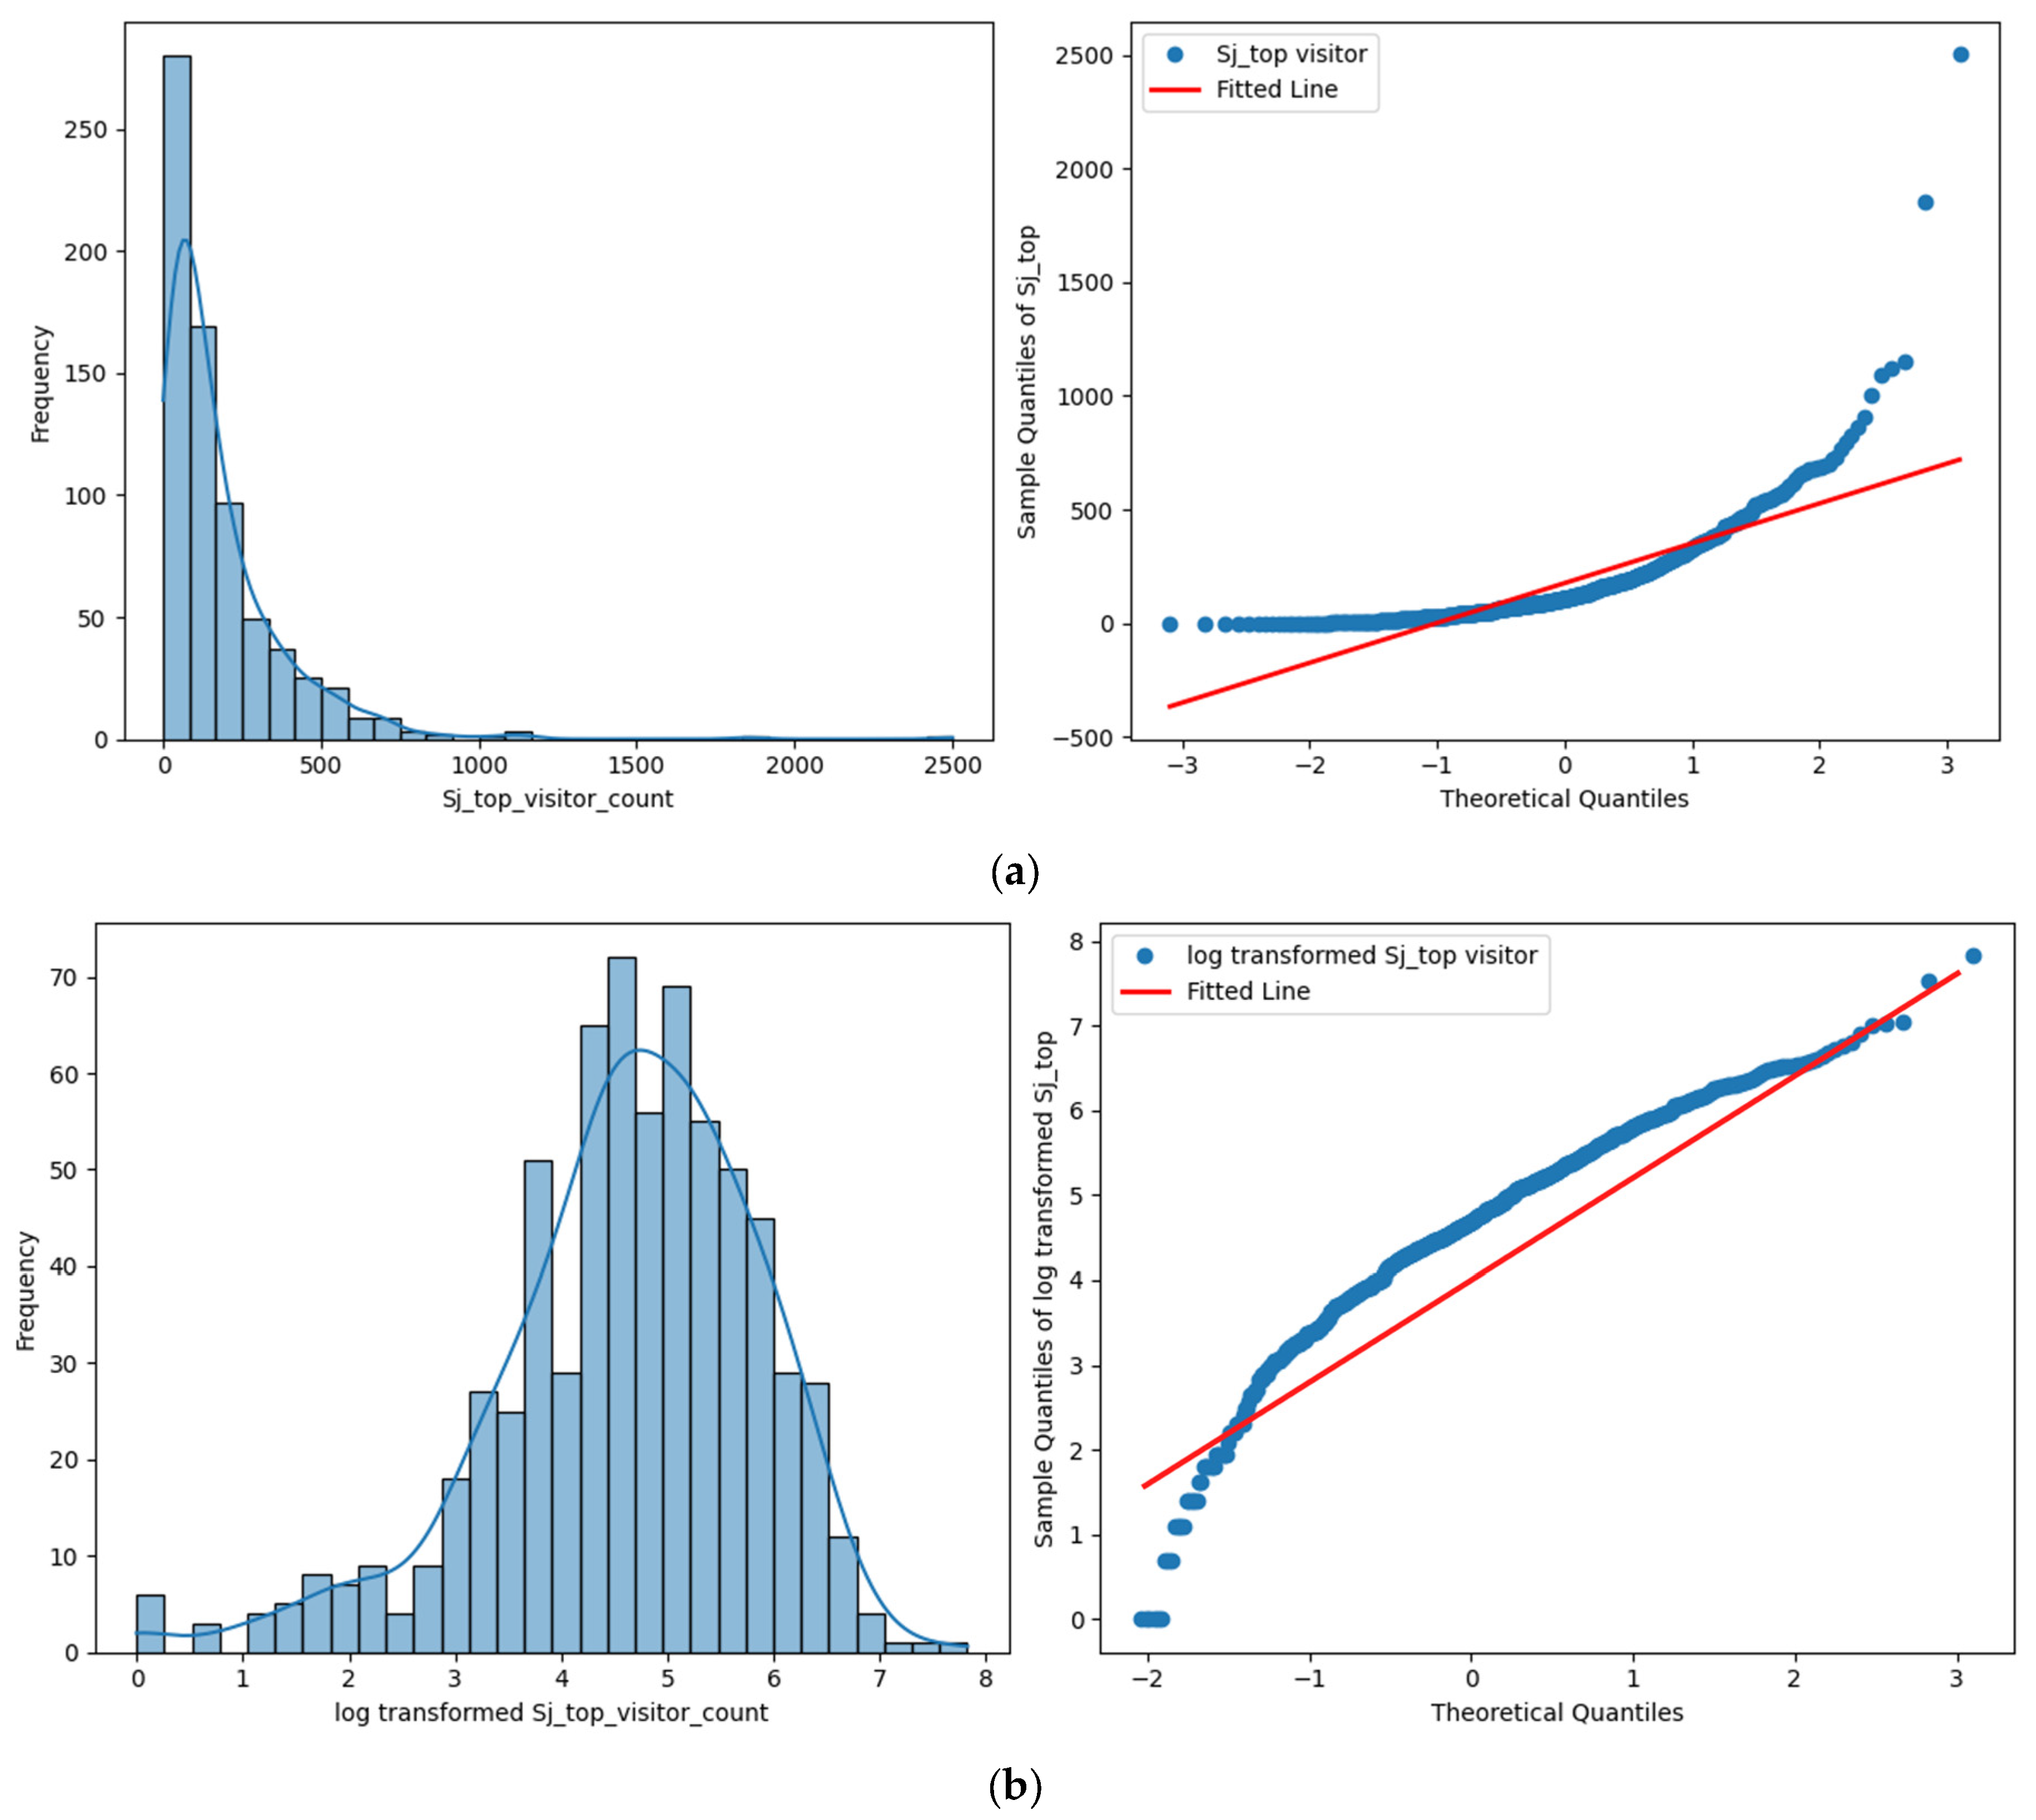
3.4. Data Preprocessing

The data were preprocessed in four stages: data cleansing, scaling of the dependent variable, feature encoding, and data splitting.
During data cleaning, duplicate entries on social media and news posts were removed. The data were then grouped by day for each platform, and the number of posts was aggregated. For tollgate traffic data in the Gangwon region, only the outbound traffic volume from the Daegwallyeong tollgate was extracted, from which the total daily traffic volume was calculated. All collected data were merged daily.
The dependent variable—the number of visitors to the Daegwallyeong Forest Trail—exhibited a skew distribution (Figure 3a, raw data), as illustrated using the dataset from the Seonjaryeong Peak section. This may introduce bias in the regression coefficients, reducing prediction reliability and increasing the likelihood of model overfitting owing to the influence of outliers [49,50]. The data skewness was mitigated using a logarithmic transformation (Figure 3b, log-transformed data).
In machine learning models, categorical values may negatively affect linear regression accuracy. Because categorical values can be interpreted as weights, the prediction accuracy may decline unless they are appropriately converted [51]. Therefore, one-hot encoding was applied to categorical variables such as the day of the week and month. This method converts each category into a combination of binary features with a single active bit, and all other features are set to zero.
Finally, to prevent overfitting and evaluate the generalization performance of the model, the dataset was split based on time. A total of 731 records collected before 31 December 2021 were used as training data, and 313 records collected afterward were used as test data.

3.5. Exploratory Data Analysis (EDA)

EDA refers to visual and descriptive analyses exploring the structure, characteristics, and patterns in data. This is an essential step in developing effective models [52]. Heat maps and bar plots were used to visualize the relationships between visitor numbers and independent variables across different trail sections.

3.6. Machine Learning Model

To determine the most appropriate model for forecasting visitor numbers at the Daegwallyeong Forest Trail, a total of seven regression models were compared. These included linear regression, ridge regression, lasso regression, random forest (RF), gradient boosting (GBM), extreme gradient boosting (XGBoost), and light gradient boosting (LGBM).

3.6.1. Linear Regression

Linear regression is a fundamental predictive model that assumes a linear relationship between independent and dependent variables. It provides a clear and interpretable regression equation. While it is simple and effective for linearly correlated data, it is highly sensitive to multicollinearity and outliers [53].

3.6.2. Ridge Regression

Ridge regression extends linear regression by incorporating L2 regularization, which penalizes the magnitude of coefficients. This approach mitigates multicollinearity and reduces the risk of overfitting by shrinking coefficient values [54].

3.6.3. Lasso Regression

Lasso regression applies L1 regularization, enabling automatic variable selection by shrinking some coefficients to zero. It enhances model interpretability and performs well with high-dimensional datasets. However, strong regularization may overly constrain some relevant features [55].

3.6.4. Random Forest

Random forest is an ensemble learning method that aggregates multiple decision trees to improve predictive accuracy. It is effective in modeling nonlinear relationships and can compute feature importance. Its parallel processing capability makes it suitable for large-scale data [56].

3.6.5. Gradient Boosting (GBM)

Gradient boosting builds a strong learner sequentially by minimizing the residuals of previous models using weak learners. While it improves accuracy progressively, it is prone to overfitting and requires careful hyperparameter tuning [57].

3.6.6. Extreme Gradient Boosting (XGBoost)

XGBoost is an optimized implementation of gradient boosting that enhances training speed and accuracy through techniques such as regularization and tree pruning. It is particularly effective for imbalanced data and large datasets [58,59].

3.6.7. Light Gradient Boosting Machine (LGBM)

LightGBM is a gradient boosting framework optimized for efficiency in speed and memory usage. It supports categorical features natively and adopts a leaf-wise tree growth strategy, offering superior performance on complex datasets [60,61].

3.7. Performance Evaluation and Model Selection

Although hyperparameter optimization can enhance model performance and accuracy [62], owing to time constraints, only three models were selected for the final analysis based on the comparative performance results (Table 3).
The root mean squared logarithmic error (RMSLE) was used to determine model performance. The RMSLE is a commonly used metric in regression analysis that measures the relative error between the predicted and actual values, with lower values indicating better performance.
The RMSLE is calculated as follows:
R M S L E = 1 n i = 1 n log p i + 1 log a i + 1 2  
where n is the total number of observations, p i is the predicted value, and a i is the actual value for i .
It penalizes underestimation more heavily than overestimation and provides robust estimation despite outliers through a logarithmic transformation [63]. After the RMSLE values were computed for each model across all trail sections, the values were summed to derive a single performance score per model, which served as the basis for model selection. Using K-fold cross-validation, each of the seven models was trained on data from different trail sections, and the RMSLE values were calculated (Table 4). Among the models, RF (4.97), LGBM (5.03), and GBM (5.11) recorded the lowest total RMSLE scores. In contrast, linear models generally exhibited relatively high RMSLE values across most trail sections except for the National Forest segment, indicating their limited capacity to capture complex visitation patterns. Although XGBoost showed a moderate total RMSLE score of 5.41, it demonstrated a tendency toward overfitting in the Seonjaryeong top section and was thus excluded from final consideration. RF, LGBM, and GBM were selected as the final models based on their predictive accuracy and interpretability.

3.8. Hyperparameter Tuning

Based on RF, GBM, and LGBM, predictive models were developed to estimate visitor numbers to the Daegwallyeong Forest Trail. Hyperparameter tuning was conducted using Bayesian optimization to optimize the performance of each model. Bayesian optimization determines the global optimum of computationally expensive functions using a surrogate model and has been shown to achieve high performance in hyperparameter optimization tasks for machine learning models [64,65]. The key parameters tuned in this study and corresponding search ranges for the optimal values are listed in Table 5.
For the random forest model, tuning focused primarily on the number of estimators (n_estimators) and maximum depth of the trees (max_depth). The n_estimators parameter refers to the total number of trees in the forest, where a higher number generally improves prediction performance but increases computational time. The max_depth parameter controls the maximum depth of each decision tree. Shallower trees tend to reduce variance but may increase bias [66]. To prevent overfitting, additional adjustments were made to the parameters, such as the minimum number of samples required for node splitting and the minimum number of samples required to form a leaf node.
For the GBM, the main tuned parameters were n_estimators, max_depth, and learning_rate. The learning_rate parameter considers the balance between training speed and prediction accuracy. A smaller value leads to improved accuracy but requires a longer training time, whereas a larger value accelerates training but may reduce performance [57,67].
In the LightGBM model, tuning focused on num_leaves and min_child_weight, which control the complexity of the tree structure, along with parameters related to row and column sampling, helping to maintain data diversity during training [60].
Bayesian optimization is typically used to determine the maximum value of an objective function. Because lower RMSLE values indicate better performance, negative RMSLE (–RMSLE) was set as the objective function for optimization [64,65]. The number of initial exploration points (init_points) was set to 25, and the number of optimization iterations (n_iter) was set to 200, resulting in 225 iterations for extracting the optimal hyperparameters. Based on the tuning results, the final model selections for each trail section were as follows: random forest was applied to Neunggyeongbong and Seonjaryeong Peak; GBM was applied to Kukmin Forest and Daegwallyeong Sonamu Trail; and LGBM was used for Daegwallyeong Yetgil and Seonjaryeong Entrance (Table 6).

3.9. Model Interpretation and Final Predictive Formula

Machine learning algorithms are often considered black-box models because of their complexity, complicating the interpretation of their internal mechanisms [68]. Accordingly, explainable artificial intelligence (XAI) is applied to interpret the decision-making processes of these algorithms, promoting the transparency, reliability, and fairness of model outcomes [69]. In this study, Shapley additive explanations (SHAP) were used to quantify the contribution of each variable to individual predictions to enhance interpretability at the observation level.
SHAP is based on Shapley values in game theory, which consistently quantifies the contribution of each feature to model predictions [70]. As a general-purpose interpretation technique, it has been successfully applied in various domains, such as real-time highway safety detection [71], financial time series analysis [72], and reinforced concrete wall shear strength prediction [73].
These interpretation methods require a reference data point; the prediction with the highest estimated value generated from the test dataset was selected for analysis. As the prediction output f(x) represents the log-transformed value of the dependent variable, it was inversely transformed to its original scale using the expm1 function provided by the NumPy library in Python. This transformation enabled the interpretation of the original unit of visitor counts.
Linear regression models were developed for each trail section and integrated to construct a global surrogate model [74]. The R-squared value was estimated to determine the surrogate model’s explanatory power, which served as the basis for deriving the final predictive model for estimating visitor numbers to the Daegwallyeong Forest Trail.

4. Results

4.1. Numerical Variable Analysis

To explore the trends between visitor numbers and independent numerical variables across different sections of the Daegwallyeong Forest Trail, Pearson correlation coefficients were visualized using heatmaps (Figure 4). In most sections, visitor numbers were relatively strongly correlated with tollgate traffic and the number of Instagram posts. In contrast, daily precipitation and average wind speed generally showed negative correlations with visitor counts.
At Daegwallyeong Yetgil, visitor numbers showed weak positive correlations with tollgate traffic (r = 0.25) and Instagram posts (r = 0.17), while COVID-19 case numbers had a weak negative correlation (r = –0.11).
At Neunggyeongbong, visitor numbers showed strong positive correlations with tollgate traffic (r = 0.70) and Instagram posts (r = 0.45) and negative correlations with COVID-19 case numbers (r = –0.19), average wind speed (r = –0.17), and precipitation (r = –0.11).
At Kukmin Forest, visitor numbers showed strong positive correlations with tollgate traffic (r = 0.69) and maximum temperature (r = 0.66). Similar to the other sections, average wind speed (r = –0.34) and COVID-19 cases (r = –0.24) were negatively correlated with visitor numbers.
At Daegwallyeong Sonamu, a negative correlation was observed between visitor numbers and maximum temperature (r = –0.26), while a weak positive correlation was found with wind speed (r = 0.13).
At the Seonjaryeong Entrance and peak, visitor numbers were positively correlated with tollgate traffic (r = 0.38 and r = 0.41, respectively) and Instagram posts (r = 0.47 and r = 0.37, respectively). In contrast, maximum temperature (r = –0.14 and r = –0.21, respectively) and precipitation (r = –0.12 and r = –0.19, respectively) were negatively correlated with visitor numbers.

4.2. Categorical Variable Analysis
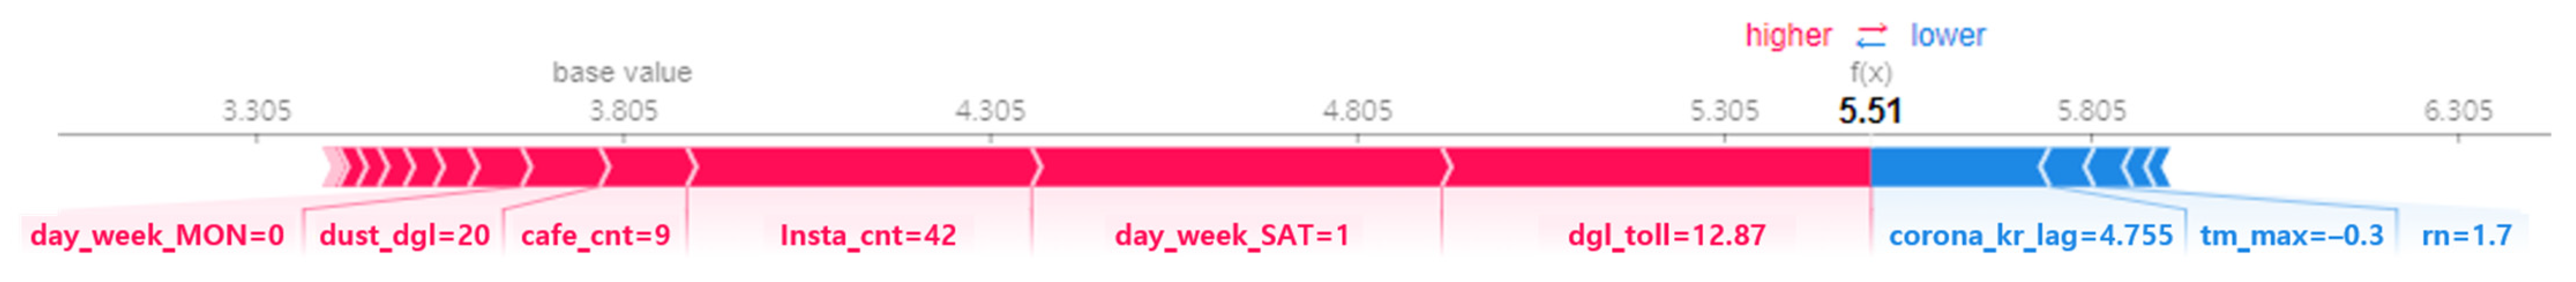
We assessed the average monthly number of visitors based on the categorical independent variables (Figure 5). The analysis excluded trail sections for which data were unavailable, specifically the Neunggyeongbong and Kukmin forests.
Daegwallyeong Yetgil consistently recorded a relatively high number of visitors throughout the year from January to December compared with other sections. In contrast, Seonjaryeong Entrance, Seonjaryeong Peak, and the Daegwallyeong Sonamu Trail showed higher average visitor numbers between October and February, tending toward greater usage in autumn and winter.
Analysis by day of the week revealed that, at Seonjaryeong Entrance, Seonjaryeong Peak, Neunggyeongbong, and Kukmin Forest, average visitor numbers were higher on holidays, Saturdays, and Sundays. At Daegwallyeong Yetgil, visitation peaked on Sundays and Mondays, whereas the Daegwallyeong Sonamu Trail showed a relatively even distribution across all days.
In terms of festival influence, local festivals were generally associated with increased visitor numbers at the Daegwallyeong Yetgil, Neunggyeongbong, and Seonjaryeong Peak sections.

4.3. SHAP Analyses

The SHAP analysis results indicate that, across all six forest trail sections, tollgate traffic volume and weekends (Saturday or Sunday) consistently contributed positively to the predicted number of visitors. These findings suggest that real-time monitoring of tollgate traffic could be effectively utilized to anticipate surges in visitation and to implement crowd management strategies. Furthermore, given the observed pattern of concentrated demand on weekends, there is a need to strengthen weekend-focused management measures.
The impact of temperature varied across trail sections. In Kukmin Forest, higher temperatures were associated with increased visitation, likely reflecting the section’s high accessibility, low difficulty, and popularity for leisure activities in warm weather. In contrast, low temperatures positively influenced visitation to Seonjaryeong Peak, which is consistent with the trail’s popularity as a winter hiking destination. These findings imply that Kukmin Forest should be prioritized for management on warmer days, whereas Seonjaryeong Peak requires increased attention during the winter season.
Precipitation was a negative contributor to predicted visitor counts, particularly in Seonjaryeong Entrance and Peak, indicating that poor weather conditions may substantially reduce visitation to trails with higher physical demands.
Finally, the number of confirmed COVID-19 cases emerged as a negative predictor across all trail sections, demonstrating that public health concerns continue to influence forest trail usage.
The above summarizes the main visitor behavior patterns by variable. Detailed SHAP analyses for each individual trail section are presented in the following subsections.

4.3.1. Daegwallyeong Yetgil

Figure 6 shows the SHAP analyses of the prediction with the highest estimated number of visitors to the Daegwallyeong Yetgil section. The predicted value of 5.51, when inverse-transformed using the exponential function of the natural logarithm, corresponds to ~246 visitors for that day.
According to the SHAP analysis, the variable contributing most significantly to the increase in the predicted value was the day of the week, indicating that the prediction made for Saturday had a strong positive impact on the expected visitor numbers. Additionally, tollgate traffic volume (12.87), the number of Instagram posts (42), and the number of blog and café posts (9) also showed relatively strong positive contributions. These results suggest that traffic volume and social media activities are the key drivers of visits to Daegwallyeong Yetgil. In contrast, the number of COVID-19 cases (4.755), maximum temperature (0.3 °C), and precipitation (1.7 mm) contributed negatively, reducing the predicted number of visitors. This implies that public health concerns and unfavorable weather conditions negatively influence trail usage.
These results reflect the characteristics and popularity of the Daegwallyeong Yetgil section, known for its scenic beauty and adjacent stream. Social media activities, traffic accessibility, weather conditions, and weekends had important influences on visitation patterns.

4.3.2. Neunggyeongbong

Figure 7 presents the SHAP for the prediction with the highest estimated visitor count in the Neunggyeongbong section. The predicted value of 5.07, when inverse-transformed using the exponential function, corresponds to ~158 visitors.
According to the SHAP analysis, the most influential factors driving the increase in predicted visitors were the day of the week (Saturday) and tollgate traffic volume. In contrast, the number of confirmed COVID-19 cases was a major negative driver, suggesting that the pandemic discouraged forest trail visits.
These findings indicate that weekend timing and transportation accessibility benefit visits to the Neunggyeongbong section, whereas weather conditions and public health concerns deter visits.

4.3.3. Kukmin Forest

The predicted value of 6.16, which corresponds to ~473 visitors after inverse transformation, was the highest estimate among the six trail sections (Figure 8).
According to the SHAP analysis, the most influential factors contributing to visitor counts were Saturdays, tollgate traffic volume, and maximum temperature. In contrast, PM10 concentration and average wind speed had a slight negative impact.
These results suggest that weekends, higher temperatures, and increased traffic volumes are the major drivers of visitor demand in the Kukmin Forest section. Given that the trail is known for its low difficulty and excellent accessibility, it is likely that many visitors frequent this section on warm weekends.

4.3.4. Sonamu Forest Trail

The predicted number of visitors for the Daegwallyeong Sonamu Trail section was 37, the lowest among all six trail sections (Figure 9).
According to the SHAP analysis, the number of news articles, day of the week (Monday), number of Instagram posts, PM10 concentration, and tollgate traffic volume influenced the predicted visitor numbers. However, their contributions were relatively limited. The number of confirmed COVID-19 cases was the primary negative driver.
These findings suggest that the spread of COVID-19 and seasonal factors were the main deterrents to visitation at the Daegwallyeong Sonamu Trail section.

4.3.5. Seonjaryeong Entrance

Figure 10 shows the SHAP results for the Seonjaryeong Entrance section. The predicted value of 5.51 corresponds to ~248 visitors after the application of the inverse logarithmic transformation.
The SHAP analysis revealed that Saturdays, tollgate traffic volume, and the number of café and Instagram posts were the primary contributors to increased visitor counts. These findings suggest that weekend timing, transportation accessibility, and social media exposure play important roles in attracting visitors. In contrast, the number of COVID-19 cases, low maximum temperature, and low precipitation contributed negatively. Notably, this section showed the greatest number of positive and negative contributing variables, indicating that visits to this area are highly sensitive to external environmental factors.
These results suggest that the demand for visiting the Seonjaryeong Entrance section is concentrated in weekends and leisure periods and that social media activity, traffic accessibility, and seasonal or weather conditions all play meaningful roles in shaping visitor behavior.

4.3.6. Seonjaryeong Peak

The log-transformed predicted visitor count at Seonjaryeong Peak was 5.45, corresponding to ~232 visitors (Figure 11).
The SHAP analysis indicated that the number of Instagram posts and tollgate traffic volume were the primary contributors to the increase in predicted visitor numbers. Low temperatures and PM10 concentrations showed positive effects, suggesting that cooler, clearer weather conditions may encourage visits. In contrast, precipitation and the number of confirmed COVID-19 cases were major negative drivers.
These results suggest that visitation to the Seonjaryeong Peak section is influenced by a combination of factors, including weather, day of the week, social media activity, and traffic volume. Notably, low temperatures were a key driver of increased visitation, which may be attributed to the trail’s popularity as a winter hiking destination.

4.4. Global Surrogate Model

The linear regression equation used in the visitor prediction model for the entire Daegwallyeong Forest Trail is expressed as follows:
Y i = β 0 + β 1 X 1 i + β 2 X 2 i + β 3 X 3 i +   + β n X n i + ϵ .
Y represents the predicted variable—the number of visitors; Xi denotes the independent variables; β i refers to coefficients for each variable; ϵ represents the error term.
By applying data from all sections of the Daegwallyeong Forest Trail, the predictive equation was derived as follows and the coefficients used are summarized in Table 7.
Y = 144.7 · X 1 +   88.05   ·   X 2 + 26.4 · X 3 + 22.96 · X 4 + 2.74 · X 5 39.21 · X 6 25.93 · X 7 0.82 · X 8 51.74 · X 9 44.1 · X 10 22.42 · X 11 + 2.3 · X 12 13.26 · X 13 + 89.83 · X 14 29.11 · X 15 31.33 · X 16 + 38.24 · X 17 30.54 · X 18 3.12 · X 19 22.96 · X 20 24.4 · X 21 34.94 · X 22 0.32 · X 23 + 0.63 · X 24 + 0.18 · X 25 0.73 · X 26 0.6 · X 27 + 0.3 · X 28 + 5.96 · X 29 + 0.13 · X 30  
where X 1 is Month_OCT, X 2 is Dgl_toll_cnt, X 3 is Month_JAN, X 4 is Month_FEB, X 5 is Month_JUL, X 6 is Day_week_Fri, X 7 is Month_AUG, X 8 is Month_MAR, X 9 is Month_SEP, X 10 is Festival, X 11 is Month_JUN, X 12 is Day_week_Mon, X 13 is Day_week_Tue, X 14 is Day_week_Sat, X 15 is Month_MAY, X 16 is Month_NOV, X 17 is Day_week_Sun, X 18 is Day_week_Holiday, X 19 is Rn, X 20 is Day_week_Wed, X 21 is Day_week_Thu, X 22 is Month_APRIL, X 23 is Café_dglf_cnt, X 24 is Insta_dglf_cnt, X 25 is WS, X 26 is News_dglf_cnt, X 27 is Blog_dglf_cnt, X 28 is Dust_dgl, X 29 is Tm_max, and X 30 is Corona_kr_lag.
The global surrogate model applied a linear regression formula to the entire dataset and achieved a high predictive accuracy (R2 = 0.838).
According to the interpretation of key variables, tollgate traffic volume (X2) was one of the strongest positive predictors, indicating that external transportation accessibility plays a decisive role in determining visitor numbers. The number of Instagram posts (X24) and month (X1, X3) also had positive effects, suggesting that both social media exposure and seasonal factors drive higher visitation demand. In contrast, precipitation (X19) had a negative influence on trail usage.
While COVID-19 case counts (X30) negatively influenced visitor numbers in some section-specific models, the global surrogate model revealed a slight but positive impact. This discrepancy is likely attributable to differences in interpretive scope, with SHAP capturing local instance-specific effects and the surrogate model reflecting global aggregated relationships across the dataset.
These findings demonstrate that the complex structure of machine learning-based prediction models can be effectively approximated using a simplified linear formula. The quantitative interpretation of variable influences is useful for determining practical priorities in visitor management and policy planning.

5. Discussion

Understanding visitor numbers and behavior is essential for effective forest management [75]. The Korea National Park Service currently operates 960 automated counting systems to monitor visitor traffic. However, accurate measurements remain limited for remote or hard-to-reach areas [76], and traditional measurement methods are labor-intensive and time-consuming.
Weather conditions are major determinants of tourism trends. Humidity, wind speed, and precipitation are generally reported to negatively influence travel [77,78]. Similarly, in this study, various climate-related variables negatively impacted visitor numbers at the Daegwallyeong Forest Trail. The SHAP analysis showed that precipitation and average wind speed had negative effects across most trail sections, supporting the notion that weather conditions constrain forest trail use.
This study differs from previous research in its integration of diverse datasets—climatic conditions, accessibility, and social media activity—to forecast visitor demand. The use of SHAP allowed for a detailed and interpretable analysis of variable importance, enabling the identification of section-specific influential factors. In addition, unlike most previous tourism demand forecasting studies that focus on destinations as a whole, this study conducted a section-by-section analysis within the forest trail, allowing for more granular insights into visitor behavior at different trail segments. Although the relatively small number of records poses a risk of overfitting when applying machine learning methods, previous studies [28,32] have successfully used around 1500 records for tourism demand forecasting, supporting the feasibility of this approach.
Non-weather factors such as accessibility and traffic volume also had meaningful impacts on visitor numbers. Increased tollgate inflow was associated with ~88 more visitors, on average. The SHAP analyses confirmed toll traffic as a strong positive predictor across several sections. Although tollgate data do not always directly reflect tourism purposes, previous studies have shown a close correlation between toll traffic and official visitation statistics [79], supporting their reliability. These results are also in line with a prior study in Gangwon Province, which found a strong correlation between weather conditions and visitor volume using a GBM model, indicating that summer weather significantly influences tourism activity [33]. Our study expands on this by comparing multiple models and incorporating social media variables.
Unlike previous studies, this study found relatively high numbers of visitors in some sections during winter, such as at the Seonjaryeong sections, which may reflect public interest in snow-covered landscapes. Winter recreation users often consult weather apps or related social media before planning outdoor activities [80,81], consistent with the current findings that social media exposure, particularly the number of posts, promotes visitor numbers. Social media activity, particularly the number of Instagram posts, also emerged as a strong positive predictor of visitation, emphasizing its role in destination awareness and behavior. This aligns with findings from other studies that used TripAdvisor and Google Trends data to predict visitor behavior [28]. However, this study focused solely on post volume; future research could enhance interpretability by including content, images, and hashtags [82,83].
The number of confirmed COVID-19 cases showed a generally negative effect on visitor numbers in local models but a slight positive effect in the global surrogate model. This suggests that, despite the pandemic, visitation demand was maintained or even increased in certain locations and periods. These findings support previous research indicating that people tended to shift toward outdoor rather than indoor recreational activities during the pandemic [84].
These results highlight the potential value of forest trails as strategic nature-based resources in a post-pandemic context. From a policy perspective, demand prediction systems that integrate weather forecasting and social media activity could support adaptive management strategies, such as seasonal staffing and infrastructure planning. Moreover, this study demonstrates the applicability of machine learning in managing complex, multidimensional tourism data, suggesting its potential role in advancing the digital transformation of nature-based tourism management. The ability to generate timely and interpretable insights from diverse data sources can support evidence-based decision-making and contribute to the development of proactive, data-driven visitor management strategies.

6. Conclusions

6.1. Summary of Key Findings

In the tourism sector, visitor numbers are a critical factor that directly influences the allocation of resources, such as personnel and budgets. This is particularly important for managing tourism assets, such as forest trails. Unlike conventional tourism infrastructures, forest trails often have multiple informal access points beyond designated entrances, making it difficult to accurately monitor the number of visitors. Nonetheless, obtaining reliable visitation data is essential for effective management and improving trail quality.
We developed a machine learning-based prediction model for estimating the number of visitors to the six sections of the Daegwallyeong Forest Trail. Based on section-specific visitation data, this study identified key factors associated with variation in visitor numbers. The SHAP analysis identified tollgate traffic volume, weather conditions, and the number of Instagram posts as the primary factors influencing visitor inflow. Notably, the impact of these factors varied across different sections of the same forest trail, highlighting the need for section-specific management strategies.

6.2. Research Contribution

In contrast to most tourism forecasting studies that treat a destination as a single unit, this study developed section-specific prediction models for six segments of the Daegwallyeong Forest Trail. This methodological distinction enabled the identification of localized behavioral patterns and influencing factors, thereby providing more precise insights for targeted trail management. To enhance model transparency, SHAP was applied to interpret the influence of each variable. Although SHAP has been used in general tourism research, its application to forest trail visitor modeling is rare. Therefore, this study represents an early attempt to combine explainable AI techniques with nature-based tourism forecasting. Moreover, by integrating diverse data sources—including weather, traffic, social media, news, public health, and local events—the model reflects the multifaceted drivers of visitation. In addition, a global surrogate regression model (R2 = 0.838) was introduced to provide overall interpretability. Taken together, these contributions support the development of adaptive, data-driven management strategies for forest-based tourism.

6.3. Policy and Practical Implications

These findings provide a foundation for data-driven policy development in forest trail management and operations. By leveraging predictive models to anticipate visitor density by section and season, it is possible to implement flexible management measures—such as temporary access restrictions, rerouting guidance, and strategies to mitigate congestion and maintain a pleasant visitor experience. Moreover, the predictive insights can inform the development of an integrated regional tourism management system by aligning with local government traffic control measures, public transportation operations, and collaborative policies with nearby attractions. This approach is expected to contribute to the development of adaptive management strategies that respond to evolving demands for nature-based tourism in the context of climate change and the post-pandemic era.

6.4. Limitations and Future Directions

We acknowledge some limitations regarding data collection. First, the visitor data collected from unmanned counters for each trail section contained missing values owing to occasional device malfunctions. These gaps may have affected the accuracy of the dependent variable. Future studies should address this issue through data supplementation and cross-validation. Second, discrepancies may exist between the time of social media post creation and actual visitation time. Future research should consider the temporal alignment between posting and visiting to improve the precision of the model. Finally, this study focused solely on the number of visitors as the dependent variable, without incorporating qualitative aspects such as visitor satisfaction or intention to revisit. Future studies could enhance the analytical depth by incorporating sentiment or image analysis in social media content, among other factors not considered in this study. The geographic scope of the data was also limited to a single forest trail, and caution is therefore advised when generalizing the findings to other contexts. Additionally, the overall volume of data was relatively limited; future research should aim to collect a larger dataset to further improve model robustness and generalizability.

Author Contributions

Conceptualization, S.L.; Data Curation, S.L.; Formal Analysis, S.R. and G.-H.K.; Funding Acquisition, S.L.; Investigation, S.-H.J., G.-H.K. and S.L.; Methodology, S.-H.J.; Project Administration, S.L.; Resources, S.-H.J.; Software, S.-H.J.; Supervision, S.L.; Validation, S.R., G.-H.K. and S.L.; Visualization, S.R. and S.-H.J.; Writing—Original Draft, S.R. and S.-H.J.; Writing—Review and Editing, S.R. and S.L. All authors have read and agreed to the published version of the manuscript.

Funding

This work was supported by the National Institute of Forest Science (task numbers FM0700-2021-01-2023 and FM0400-2024-02-2025).

Institutional Review Board Statement

Not applicable.

Informed Consent Statement

Not applicable.

Data Availability Statement

The original contributions presented in the study are included in the article. Further inquiries can be directed to the corresponding author.

Conflicts of Interest

The authors declare no conflicts of interest.

References

  1. United Nations Human Settlements Programme (UN-Habitat). World Cities Report 2024: Cities and Climate Action. Available online: https://unhabitat.org/world-cities-report-2024-cities-and-climate-action (accessed on 18 April 2025).
  2. Korea Forest Service. Forest Terminology Dictionary. Available online: https://www.forest.go.kr/kfsweb/kfi/kfs/mwd/selectMtstWordDictionary.do?pageIndex=1&pageUnit=10&wrdSn=5391 (accessed on 18 April 2025).
  3. Sanesi, G.; Gallis, C.; Kasperidus, H.D. Urban Forests and Their Ecosystem Services in Relation to Human Health. For. Trees Hum. Health 2010, 1, 23–40. [Google Scholar] [CrossRef]
  4. Walton, A. Forests as Social Mirrors: What do Approaches to Forest Management Tell us About Human Social Relations? Bull. Ecol. Soc. Am. 2023, 105, e2110. [Google Scholar] [CrossRef]
  5. Mengist, W.; Soromessa, T. Assessment of forest ecosystem service research trends and methodological approaches at global level: A meta-analysis. Environ. Syst. Res. 2019, 8, 22. [Google Scholar] [CrossRef]
  6. Di Franco, C.P.; Lima, G.; Schimmenti, E.; Asciuto, A. Methodological Approaches to the Valuation of Forest Ecosystem Services: An Overview of Recent International Research Trends. J. For. Sci. 2021, 67, 307–317. [Google Scholar] [CrossRef]
  7. Food and Agriculture Organization of the United Nations (FAO). The State of the World’s Forests 2024. Available online: https://www.fao.org/documents/card/en/c/cd1211en/ (accessed on 18 April 2025).
  8. Stanford Institute for Human-Centered Artificial Intelligence (HAI). AI Index Report 2022. Available online: https://aiindex.stanford.edu/report/ (accessed on 18 April 2025).
  9. Samuel, A.L. Some Studies in Machine Learning Using the Game of Checkers. IBM J. Res. Dev. 2000, 44, 206–227. [Google Scholar] [CrossRef]
  10. Jordan, M.I.; Mitchell, T.M. Machine Learning: Trends, Perspectives, and Prospects. Science 2015, 349, 255–260. [Google Scholar] [CrossRef]
  11. Dhall, D.; Kaur, R.; Juneja, M. Machine Learning: A Review of the Algorithms and Its Applications. In Proceedings of the ICRIC 2019: Recent Innovations in Computing, Lecture Notes in Electrical Engineering; Springer; Cham, Switzerland, 2019; Volume 597, pp. 47–63. [Google Scholar] [CrossRef]
  12. Dahiya, N.; Gupta, S.; Singh, S. A Review Paper on Machine Learning Applications, Advantages, and Techniques. ECS Trans. 2022, 107, 6137. [Google Scholar] [CrossRef]
  13. Ray, S. A Quick Review of Machine Learning Algorithms. In Proceedings of the 2019 International Conference on Machine Learning, Big Data, Cloud and Parallel Computing (COMITCon), Faridabad, India, 14–16 February 2019; IEEE: Piscataway, NJ, USA, 2019; pp. 35–39. [Google Scholar] [CrossRef]
  14. Sakhypov, A.; Mektebayeva, A.; Rystyghulova, V.; Abildina, A.; Omarzhanova, G. Machine Learning Strategies and Algorithms for Enhancing Real-Time Data Processing in Dynamic and Big Data Systems. Vestn. KazATK 2024, 134, 278–291. [Google Scholar] [CrossRef]
  15. Wang, W.; Siau, K. Artificial Intelligence, Machine Learning, Automation, Robotics, Future of Work and Future of Humanity: A Review and Research Agenda. J. Database Manag. 2019, 30, 61–79. [Google Scholar] [CrossRef]
  16. Sarker, I.H. Machine Learning: Algorithms, Real-World Applications and Research Directions. SN Comput. Sci. 2021, 2, 160. [Google Scholar] [CrossRef]
  17. Chen, X.; Avtar, R.; Umarhadi, D.A.; Louw, A.S.; Shrivastava, S.; Yunus, A.P.; Khedher, K.M.; Takemi, T.; Shibata, H. Post-Typhoon Forest Damage Estimation Using Multiple Vegetation Indices and Machine Learning Models. Weather Clim. Extrem. 2022, 38, 100494. [Google Scholar] [CrossRef]
  18. Staab, J.; Udas, E.; Mayer, M.; Taubenböck, H.; Job, H. Comparing Established Visitor Monitoring Approaches with Triggered Trail Camera Images and Machine Learning Based Computer Vision. J. Outdoor Recreat. Tour. 2021, 35, 100387. [Google Scholar] [CrossRef]
  19. Rahaman, M.; Morshed, M.M.; Bhadra, S. An Integrated Machine Learning and Remote Sensing Approach for Monitoring Forest Degradation Due to Rohingya Refugee Influx in Bangladesh. Remote Sens. Appl. Soc. Environ. 2022, 25, 100696. [Google Scholar] [CrossRef]
  20. Lee, S.; Lee, J.; Kim, S.; Seo, K.; Cho, J.; Seo, J. National Forest Trail Operation and Management Guidelines; Research Report 24-16; National Institute of Forest Science: Seoul, Republic of Korea, 2024; pp. 1–342. ISBN 979-11-6019-916-1.
  21. Kim, G.; Lee, J.; Lee, S. Activation Plan Through User Recognition Analysis of DMZ Punch Bowl Dulle-Gil: Focusing on Comparative Analysis of Survey and Text Mining. J. Tour. Leis. Res. 2022, 34, 47–66. [Google Scholar] [CrossRef]
  22. We, J.; Lee, S.; Lee, J.; Kim, S. The Impact of National Forest Trails on Quality of Life of Migrants from Urban to Mountain Villages: Focused on Jirisan Dullegil Trail. J. Korean Soc. For. Sci. 2023, 112, 230–247. [Google Scholar] [CrossRef]
  23. Lee, S.; Yang, J.D.; Lee, J. Estimating the Impact of DMZ Punchbowl Trail as a National Forest Trail on Local Economy Using the Regional Input-Output Model. J. Korean Soc. For. Sci. 2024, 113, 170–186. [Google Scholar] [CrossRef]
  24. Fuchs, M.; Zanker, M. Multi-Criteria Ratings for Recommender Systems: An Empirical Analysis in the Tourism Domain. Int. Conf. Electron. Commer. Web Technol. 2012, 7447, 100–111. [Google Scholar] [CrossRef]
  25. Jannach, D.; Zanker, M.; Fuchs, M. Leveraging Multi-Criteria Customer Feedback for Satisfaction Analysis and Improved Recommendations. Inf. Technol. Tour. 2014, 14, 119–149. [Google Scholar] [CrossRef]
  26. Gerakis, A.S. Effects of Exchange-Rate Devaluations and Revaluations on Receipts from Tourism. Staff Pap. Int. Monet. Fund 1965, 12, 365–384. [Google Scholar] [CrossRef]
  27. Gray, H.P. The Demand for International Travel by the United States and Canada. Int. Econ. Rev. 1966, 7, 83–92. [Google Scholar] [CrossRef]
  28. Bravo, J.; Alarcón, R.; Valdivia, C.; Serquén, O. Application of Machine Learning Techniques to Predict Visitors to the Tourist Attractions of the Moche Route in Peru. Sustainability 2023, 15, 8967. [Google Scholar] [CrossRef]
  29. Abang Abdurahman, A.Z.; Wan Yaacob, W.F.; Md Nasir, S.A.; Jaya, S.; Mokhtar, S. Using Machine Learning to Predict Visitors to Totally Protected Areas in Sarawak, Malaysia. Sustainability 2022, 14, 2735. [Google Scholar] [CrossRef]
  30. Yap, N.; Gong, M.; Naha, R.K.; Mahanti, A. Machine Learning-Based Modelling for Museum Visitations Prediction. In Proceedings of the 2020 International Symposium on Networks, Computers and Communications (ISNCC), Montreal, QC, Canada, 20–22 October 2020; IEEE: Piscataway, NJ, USA, 2020; pp. 1–7. [Google Scholar] [CrossRef]
  31. Bi, J.-W.; Li, C.; Xu, H.; Li, H. Forecasting Daily Tourism Demand for Tourist Attractions with Big Data: An Ensemble Deep Learning Method. J. Travel Res. 2021, 61, 1719–1737. [Google Scholar] [CrossRef]
  32. Li, W. Prediction of Tourism Demand in Liuzhou Region Based on Machine Learning. Mob. Inf. Syst. 2022, 2022, 9362562. [Google Scholar] [CrossRef]
  33. Jee, J.-B.; Zo, I.-S.; Bae, J.-H. Development of a Prediction Algorithm for the Number of Visitors with Municipality in Gangwon Province. J. Tour. Leis. Res. 2022, 34, 65–78. [Google Scholar] [CrossRef]
  34. Korea Forest Service. National Forest Trail—Daegwallyeong Homepage. Available online: http://www.daegwallyeongsupgil.kr/ (accessed on 18 April 2025).
  35. National Institute of Korean Language. Standard Korean Language Dictionary. Available online: https://stdict.korean.go.kr/main/main.do (accessed on 18 April 2025).
  36. Korea Meteorological Administration. Climate Statistics by Region. 2022. Available online: https://data.kma.go.kr/climate/RankState/selectRankStatisticsDivisionList.do?pgmNo=179 (accessed on 18 April 2025).
  37. Baclig, A.C.; Castres, D.R.M.; Florendo, M.A.C.; Malcino, L.J.; Padilla, J.M.P.; Covita, M.S. Social Media’s Influence on Tourists’ Choice of Destination. Int. J. Res. Innov. Soc. Sci. 2024, 8, 1507–1546. [Google Scholar] [CrossRef]
  38. Li, Y.; Lin, Z.; Xiao, S. Using social media big data for tourist demand forecasting: A new machine learning analytical approach. J. Digit. Econ. 2022, 1, 32–43. [Google Scholar] [CrossRef]
  39. WiseApp. The Most Frequently, Heavily, and Regularly Used Apps by Koreans. WiseApp Insight 2024. Available online: https://www.wiseapp.co.kr/insight/detail/613 (accessed on 10 June 2025).
  40. Lee, I.J.; Yoon, H.S. Development of a Model to Predict the Number of Visitors to Local Festivals Using Machine Learning. J. Inf. Syst. 2020, 29, 35–52. [Google Scholar] [CrossRef]
  41. Korea Meteorological Administration. Open Data Portal. Available online: https://data.kma.go.kr/cmmn/main.do (accessed on 4 June 2025).
  42. AirKorea. Air Quality Monitoring Platform. Available online: https://www.airkorea.or.kr/web/pmRelay?itemCode=10007&pMENU_NO=108 (accessed on 4 June 2025).
  43. Naver Blog. Available online: https://section.blog.naver.com/BlogHome.naver?directoryNo=0&currentPage=1&groupId=0 (accessed on 4 June 2025).
  44. Naver Café. Available online: https://cafe.naver.com (accessed on 4 June 2025).
  45. Naver News. Available online: http://news.naver.com (accessed on 4 June 2025).
  46. Instagram. Available online: https://instagram.com (accessed on 4 June 2025).
  47. Korea Expressway Corporation’s Public Data Portal. Available online: https://data.ex.co.kr (accessed on 4 June 2025).
  48. Korean Public Data Portal. Available online: https://www.data.go.kr (accessed on 4 June 2025).
  49. Osborne, J. Improving your data transformations: Applying the Box-Cox transformation. Pract. Assess. Res. Eval. 2010, 15, 12. [Google Scholar] [CrossRef]
  50. Massa, E.; Jonker, M.A.; Roes, K.; Coolen, A.C.C. Correction of Overfitting Bias in Regression Models. arXiv 2022, arXiv:2204.05827. [Google Scholar]
  51. Grizzle, J.E.; Starmer, C.F.; Koch, G.G. Analysis of categorical data by linear models. Biometrics 1969, 25, 489–504. [Google Scholar] [CrossRef] [PubMed]
  52. Tukey, J.W. Exploratory Data Analysis; Pearson: London, UK, 1977. [Google Scholar]
  53. Montgomery, D.C.; Peck, E.A.; Vining, G.G. Introduction to Linear Regression Analysis, 6th ed.; John Wiley & Sons: Hoboken, NJ, USA, 2021. [Google Scholar]
  54. Hoerl, A.E.; Kennard, R.W. Ridge Regression: Biased Estimation for Nonorthogonal Problems. Technometrics 1970, 12, 55–67. [Google Scholar] [CrossRef]
  55. Tibshirani, R. Regression Shrinkage and Selection via the Lasso. J. R. Stat. Soc. Ser. B Methodol. 1996, 58, 267–288. [Google Scholar] [CrossRef]
  56. Breiman, L. Random Forests. Mach. Learn. 2001, 45, 5–32. [Google Scholar] [CrossRef]
  57. Friedman, J.H. Greedy Function Approximation: A Gradient Boosting Machine. Ann. Stat. 2001, 29, 1189–1232. [Google Scholar] [CrossRef]
  58. XGBoost Developers. XGBoost Documentation. Available online: https://xgboost.readthedocs.io/en/stable/ (accessed on 10 June 2025).
  59. Chen, T.; Guestrin, C. XGBoost: A Scalable Tree Boosting System. In Proceedings of the 22nd ACM SIGKDD International Conference on Knowledge Discovery and Data Mining, San Francisco, CA, USA, 13–17 August 2016; pp. 785–794. [Google Scholar] [CrossRef]
  60. Ke, G.; Meng, Q.; Finley, T.; Wang, T.; Chen, W.; Ma, W.; Ye, Q.; Liu, T.Y. LightGBM: A Highly Efficient Gradient Boosting Decision Tree. In Proceedings of the Advances in Neural Information Processing Systems 30 (NIPS 2017), Long Beach, CA, USA, 4–9 December 2017; Volume 30. [Google Scholar]
  61. Microsoft. LightGBM Documentation. Available online: https://lightgbm.readthedocs.io/en/stable/index.html (accessed on 10 June 2025).
  62. Xie, W.; Chen, W.; Shen, L.; Duan, J.; Yang, M. Surrogate Network-Based Sparseness Hyper-Parameter Optimization for Deep Expression Recognition. Pattern Recognit. 2021, 111, 107701. [Google Scholar] [CrossRef]
  63. Bhattacharya, S.; Kalita, K.; Čep, R.; Chakraborty, S. A Comparative Analysis on Prediction Performance of Regression Models during Machining of Composite Materials. Materials 2021, 14, 6689. [Google Scholar] [CrossRef]
  64. Mockus, J.; Tiesis, V.; Zilinskas, A. The Application of Bayesian Methods for Seeking the Extremum. In Towards Global Optimization; Dixon, L.C.W., Szegő, G.P., Eds.; Elsevier: Amsterdam, The Netherlands, 1978; Volume 2, pp. 117–129. [Google Scholar]
  65. Snoek, J.; Larochelle, H.; Adams, R.P. Practical Bayesian Optimization of Machine Learning Algorithms. Adv. Neural Inf. Process. Syst. 2012, 25, 2951–2959. [Google Scholar]
  66. Scikit-learn. Forests of Randomized Trees. Available online: https://scikit-learn.org/stable/modules/ensemble.html#forests-of-randomized-trees (accessed on 18 April 2025).
  67. Natekin, A.; Knoll, A. Gradient Boosting Machines, a Tutorial. Front. Neurorobotics 2013, 7, 21. [Google Scholar] [CrossRef]
  68. IT DAILY. AI Black Box, Ensuring Transparency through Explainable Artificial Intelligence (XAI). Available online: http://www.itdaily.kr/news/articleView.html?idxno=73632 (accessed on 18 April 2025).
  69. Das, A.; Rad, P. Opportunities and Challenges in Explainable Artificial Intelligence (XAI): A Survey. arXiv 2020. [Google Scholar] [CrossRef]
  70. Lundberg, S.M.; Lee, S.I. A Unified Approach to Interpreting Model Predictions. In Proceedings of the Advances in Neural Information Processing Systems 30 (NIPS 2017), Long Beach, CA, USA, 4–9 December 2017; Volume 30, pp. 4765–4774. [Google Scholar] [CrossRef]
  71. Parsa, A.B.; Movahedi, A.; Taghipour, H.; Derrible, S.; Mohammadian, A.K. Toward Safer Highways, Application of XGBoost and SHAP for Real-Time Accident Detection and Feature Analysis. Accid. Anal. Prev. 2020, 136, 105405. [Google Scholar] [CrossRef] [PubMed]
  72. Mokhtari, K.E.; Higdon, B.P.; Başar, A. Interpreting Financial Time Series with SHAP Values. In Proceedings of the 29th Annual International Conference on Computer Science and Software Engineering, Toronto, ON, Canada, 4–6 November 2019; pp. 166–172. Available online: https://dl.acm.org/doi/abs/10.5555/3370272.3370290 (accessed on 1 May 2025).
  73. Feng, D.C.; Wang, W.J.; Mangalathu, S.; Taciroglu, E. Interpretable XGBoost–SHAP Machine-Learning Model for Shear Strength Prediction of Squat RC Walls. J. Struct. Eng. 2021, 147, 04021173. [Google Scholar] [CrossRef]
  74. Jones, D.R.; Schonlau, M.; Welch, W.J. Efficient Global Optimization of Expensive Black-Box Functions. J. Glob. Optim. 1998, 13, 455–492. [Google Scholar] [CrossRef]
  75. Cessford, G.; Muhar, A. Monitoring options for visitor numbers in national parks and natural areas. J. Nat. Conserv. 2003, 11, 240–250. [Google Scholar] [CrossRef]
  76. Ziesler, P.S.; Pettebone, D. Counting on Visitors: A Review of Methods and Applications for the National Park Service’s Visitor Use Statistics Program. J. Park Recreat. Adm. 2018, 36, 39–55. [Google Scholar] [CrossRef]
  77. Liu, C.; Susilo, Y.O.; Karlström, A. Investigating the Impacts of Weather Variability on Individual’s Daily Activity–Travel Patterns: A Comparison Between Commuters and Noncommuters in Sweden. Transp. Res. Part A Policy Pract. 2015, 82, 47–64. [Google Scholar] [CrossRef]
  78. Wu, J.; Liao, H. Weather, Travel Mode Choice, and Impacts on Subway Ridership in Beijing. Transp. Res. Part A Policy Pract. 2020, 135, 264–279. [Google Scholar] [CrossRef]
  79. Sohn, C.; Kim, G.H. Influences of Weather on the Inbound Traffic Volume of a Tourist Destination. Korea Spat. Plan. Rev. 2014, 83, 99–111. [Google Scholar] [CrossRef]
  80. Rutty, M.; Andrey, J. Weather Forecast Use for Winter Recreation. Weather Clim. Soc. 2014, 6, 293–306. [Google Scholar] [CrossRef]
  81. McCreary, A.; Seekamp, E.; Larson, L.R.; Smith, J.W.; Davenport, M.A. Predictors of Visitors’ Climate-Related Coping Behaviors in a Nature-Based Tourism Destination. J. Outdoor Recreat. Tour. 2019, 26, 23–33. [Google Scholar] [CrossRef]
  82. Ayeh, J.K. Travellers’ Acceptance of Consumer-Generated Media: An Integrated Model of Technology Acceptance and Source Credibility Theories. Comput. Hum. Behav. 2015, 48, 173–180. [Google Scholar] [CrossRef]
  83. Tamaki, S. Likes on Image Posts in Social Networking Services: Impact of Travel Episode. J. Destin. Mark. Manag. 2021, 20, 100615. [Google Scholar] [CrossRef]
  84. Ren, M.; Park, S.; Xu, Y.; Huang, X.; Zou, L.; Wong, M.S.; Koh, S.Y. Impact of the COVID-19 Pandemic on Travel Behavior: A Case Study of Domestic Inbound Travelers in Jeju, Korea. Tour. Manag. 2022, 92, 104533. [Google Scholar] [CrossRef]
Figure 1. Workflow of machine learning-based visitor prediction model development.
Sustainability 17 06061 g001
Figure 2. Map of the Daegwallyeong Forest Trail.
Sustainability 17 06061 g002
Figure 3. Skewness reduction via log transformation: (a) raw visitor data of Seonjaryeong Peak and (b) log-transformed data of Seonjaryeong Peak. The blue curve represents the kernel density estimate (KDE), providing a smoothed visualization of the distribution.
Sustainability 17 06061 g003
Figure 4. Pearson correlation coefficients between trail visitor counts and independent variables.
Sustainability 17 06061 g004
Figure 5. Average number of visitors by categorical variables across trail sections. (a) Yetgil, (b) Neunggyeongbong, (c) Kukmin Forest, (d) Daegwallyeong Sonamu Trail, (e) Seonjaryeong Enterance, (f) Seonjaryeong Peak.
Sustainability 17 06061 g005aSustainability 17 06061 g005b
Figure 6. SHAP analysis of maximum predicted visitor count for Daegwallyeong Yetgil.
Sustainability 17 06061 g006
Figure 7. SHAP analysis of maximum predicted visitor count for Neunggyeongbong.
Sustainability 17 06061 g007
Figure 8. SHAP analysis of maximum predicted visitor count for Kukmin Forest.
Sustainability 17 06061 g008
Figure 9. SHAP analysis of maximum predicted visitor count for Sonamu Forest Trail.
Sustainability 17 06061 g009
Figure 10. SHAP analysis of maximum predicted visitor count for Seonjaryeong Entrance.
Sustainability 17 06061 g010
Figure 11. SHAP analysis of maximum predicted visitor count for Seonjaryeong Peak.
Sustainability 17 06061 g011
Table 1. Review of related work.
StudyMethodDataKey VariablesMain
Contribution
Bravo et al. (2023) [28]Linear regression (LR), k-NN, decision tree, random forest (RF)Arrival of national and international tourists, tourism intelligence system, TripAdvisor, Google TrendsHotels, area, access, domestic promotion, reviews (top 5 variables based on prediction model)Prediction of visitors to tourist attractions on the Moche Route in northern Peru
Abang Abdurahman et al. (2022) [29]k-NN, naïve Bayes, decision treeType of the park, size of the park, number of natural characteristics, number of recreational services, type of connectivity, distance from the nearest cityDomestic tourists: distance and park size
International tourists: park type, natural attributes, and age
Prediction of visitors to protected areas in Sarawak
Yap et al. (2020) [30]LR,
XGBoost,
RF,
neural network
Weather, time, day of the week, school holidaysPrimary key: temporal features
Secondary: weather
Prediction of visitors to a museum
Bi et al. (2021) [31]Comparison of 12 models, including ensemble LSTM with CPSSearch engine trends, weather, temperature, public holidaysHolidayPrediction of visitors to Huangshan Mountain Area
Li (2022) [32]RF, SVR, RNN, LSTM, CNN-LSTM, SPCA-LSTM, SPCA-CNNLSTMHoliday, low temperature, PM2.5 concentration, historical passenger flow, average temperature, high temperature-Tourism demand forecast for Liuzhou
Jee et al. (2022) [33]GBMTemperature, cumulative precipitation, wind speed
humidity, atmospheric pressure, sunshine duration, solar radiation, cloud cover, day of the week, week, year
Meteorological: temperature
Non-meteorological: day of the week
Daily visitor forecasting for 18 municipalities in Gangwon Province
Table 2. Characteristics of the analyzed trail sections.
Trail NameDistanceDifficulty levelDescription
Daegwallyeong Yetgil (Yetgil)6.46 kmModerateScenic streamside trail with views of natural landscape and historical pathways
Neunggyeongbong (Nk)1.95 kmModerateShort hiking distance to the highest peak in southern Daegwallyeong with panoramic landscape views
Kukmin Forest (Km)5.59 kmVery EasyWell-maintained dirt path with wildflowers, diverse tree species, and coniferous forests rich in phytoncides
Daegwallyeong
Sonamu Trail
(Sonamu)
8.60 kmModerate400 ha area with dense Korean pine and spicebush stands, featuring exceptional pine tree scenery
Seonjaryeong
(Sj_enter, Sj_top)
8.36 kmModerateRoute via Seonjaryeong Peak featuring grasslands, renowned backpacking destination, and popular winter trekking course
Table 3. Independent and dependent variables used in the analysis.
VariableDescription
DependentWeatherTm_max Daily maximum temperature (°C)
WsAverage wind speed (m/s)
RnDaily precipitation (mm)
Dust_dglDaily average PM10 concentration in Daegwallyeong
Social mediaBlog_dglf_cntNumber of blog posts (count)
Café_dglf_cntNumber of café posts (count)
Insta_dglf_cntNumber of Instagram posts (count)
NewsNews_dglf_cntNumber of news posts (count)
OthersDgl_toll_cntDaegwallyeong tollgate traffic volume
Corona_kr_lagConfirmed COVID-19 cases in Korea (previous day)
FestivalFestival occurrence in Gangneung and Pyeongchang (yes/no)
Day_weekDay of the week and holidays (Mon–Sun, holidays)
MonthMonth (January–December)
IndependentVisitor_sj_topDaily visitors to the summit of Seonjaryeong Peak
Visitor_sj_enterDaily visitors to the summit of Seonjaryeong Entrance
Visitor_nkDaily visitors to Neunggyeongbong
Visitor_sonamuDaily visitors to Daegwallyeong Sonamu Trail
Visitor_yetgilDaily visitors to Daegwallyeong Yetgil Trail
Visitor_kmDaily visitors to Kukmin Forest
Table 4. RMSLE values for visitor prediction models.
YetgilNkKmSonamuSj_enterSj_topSum
Random forest (RF)0.760.640.471.160.821.144.97
LightGBM (LGBM)0.760.680.461.210.791.115.03
Gradient boosting (GBM)0.800.690.451.210.741.215.11
XGBoost0.850.710.421.210.841.375.41
Lasso regression0.800.930.861.261.071.296.21
Ridge regression0.830.790.402.140.91.176.22
Linear regression0.880.820.442.170.911.196.40
Table 5. Hyperparameter tuning ranges for selected machine learning models.
ModelParameterRange
RFn_estimators(100, 500)
max_depth(6, 12)
min_samples_leaf(2, 10)
min_samples_split(4, 10)
GBMn_estimators(100, 500)
max_depth(6, 12)
learning_rate(0.001, 0.1)
LGBMnum_leaves(35, 60)
max_depth(9, 20)
min_child_weight(20, 50)
subsample(0.1, 0.99)
colsample_bytree(0.1, 0.09)
Table 6. Optimal hyperparameters for final machine learning models.
RFGBM
ParametersNkSj_topParameterKmSonamu
n_estimators196112n_estimators221351
max_depth86max_depth97
min_samples_leaf75learning_rate0.10.01
min_samples_split95
LGBMSectionRMSLE
ParameterYetgilSj_enterYetgil0.555
num_leaves5653Nk0.626
max_depth1214Km0.443
min_child_weight2748Sonamu1.116
subsample0.560.81Sj_enter1.077
colsample_bytree0.480.28Sj_top0.727
Table 7. Summary of variables and coefficients in the global surrogate model.
Variable
Number
Variable
Name
CoefficientVariable NumberVariable
Name
Coefficient
X 1 Month_OCT144.7 X 16 Month_NOV−31.33
X 2 Dgl_toll_cnt88.05 X 17 Day_week_Sun38.24
X 3 Month_JAN26.4 X 18 Day_week_Holiday−30.54
X 4 Month_FEB22.96 X 19 Rn−3.12
X 5 Month_JUL2.74 X 20 Day_week_Wed−22.96
X 6 Day_week_Fri−39.21 X 21 Day_week_Thu−24.4
X 7 Month_AUG−25.93 X 22 Month_APR−34.94
X 8 Month_MAR−0.82 X 23 Café_dglf_cnt−0.32
X 9 Month_SEP−51.74 X 24 Insta_dglf_cnt0.63
X 10 Festival−44.1 X 25 WS0.18
X 11 Month_JUN−22.42 X 26 News_dglf_cnt−0.73
X 12 Day_week_Mon2.3 X 27 Blog_dglf_cnt−0.6
X 13 Day_week_Tue−13.26 X 28 Dust_dgl0.3
X 14 Day_week_Sat89.83 X 29 Tm_max5.96
X 15 Month_MAY−29.11 X 30 Corona_kr_lag0.13
Disclaimer/Publisher’s Note: The statements, opinions and data contained in all publications are solely those of the individual author(s) and contributor(s) and not of MDPI and/or the editor(s). MDPI and/or the editor(s) disclaim responsibility for any injury to people or property resulting from any ideas, methods, instructions or products referred to in the content.

