Article

Do Agricultural Production Services Improve Farmers’ Grain Production Efficiency?—Empirical Evidence from China

College of Economics and Management, Jilin Agricultural University, Changchun 130118, China
*
Author to whom correspondence should be addressed.
Sustainability 2025, 17(13), 6054; https://doi.org/10.3390/su17136054
Submission received: 3 May 2025 / Revised: 6 June 2025 / Accepted: 25 June 2025 / Published: 2 July 2025

Abstract

(1) Background: Global grain production faces challenges such as increasing demands due to population growth, limited arable land resources, and climate change, with natural resource and environmental constraints becoming increasingly stringent. Traditional smallholder economies struggle to meet the increasing demand for grain, resulting in a tight balance between grain supply and demand. Therefore, to improve grain production efficiency (GPE), clarifying the specific effects of agricultural production services (APS), a new driving force on farmers’ GPE, is critical for ensuring grain security and achieving sustainable grain production. (2) Methods: Through the super-efficiency Data Envelopment Analysis (DEA) and Tobit models, and utilizing microdata from 747 farmers from the China Rural Revitalization Survey (CRRS), we analyzed the differences in farmers’ operating scales and types of agricultural production services to determine the extent and specific implementation effects of agricultural production services on the farmers’ GPE. (3) Results: agricultural production services enhanced the farmers’ GPE. Specifically, labor-intensive services (LIS) markedly improved the GPE of smallholder farmers but not large-scale farmers; technology-intensive services (TIS) did not have a substantial influence on either the smallholder farmers or large-scale farmers. There were significant regional differences in the threshold effect of agricultural production services on the GPE of the farmers. (4) Conclusions: Providers of agricultural production services should enhance their service capabilities to meet farmers’ diverse service needs. Government departments should establish uniform service standards and regulate industry development. Village and community organizations should leverage their grassroots coordination functions to facilitate the efficient operation of services. In addition, tailored development models should be developed for farmers of different scales, and they should be provided with financial and technical support as well as institutional guarantees.

1. Introduction

Grain security is a crucial foundation for global peace and development. According to the National Bureau of Statistics of China, China’s total grain production reached 706.5 million tons in 2024, utilizing merely 9% of the global arable land to sustain over 1.4 billion individuals. However, current grain production is constrained by many factors, including high inputs of fertilizers and pesticides with low utilization rates [1] and severe environmental impacts such as non-point source pollution [2]. Enhancing GPE and ensuring the sustainable advancement of grain production have become critical issues. China released its “No. 1 central document” for 2025, emphasizing the need to continuously enhance grain and other key agricultural commodity supply capabilities. With the upgrading of agricultural technology, the approach to increasing grain production has shifted from increasing factor inputs to relying on agricultural production services [3]. According to data from the Ministry of Agriculture and Rural Affairs of the People’s Republic of China, by the end of 2024, China possessed 1.094 million agricultural social service providers, with an annual service area of 2.14 billion mu. Therefore, examining the impact of agricultural production services on GPE is essential. Moreover, due to differences in the types of agricultural production services and the scale of farmers, the impact of agricultural production services on farmers’ GPE may exhibit heterogeneity.
Domestic and foreign studies have conducted in-depth explorations of grain production efficiency and agricultural production services. Most scholars used DEA, stochastic frontier analysis (SFA), super-slacks-based measure (Super-SBM), spatial econometrics analysis, and other methods to measure GPE. Among them, Kaur et al. (2024) found that DEA-based benchmarking has significant energy-saving potential for wheat yield prediction in north-western India [4]. Ren et al. (2024) applied SFA to show that soybean–corn strip intercropping increases farmers’ GPE [5]. Wang et al. (2025), using the Super-SBM model, found that although regional economic development has promoted the sustainable growth of grain production in China, marked regional heterogeneity persists [6]. Some scholars used spatial econometric methods to study China’s GPE. They found that it faces the dual challenges of insufficient driving forces and limited growth space and that technological progress has led to spatial development imbalances [7,8]. Based on this, some scholars found that specialized agricultural production services have gradually become a new driving force for agricultural development in the new era [9]. As a key pathway to achieving Chinese-style agricultural modernization and promoting the organic integration of smallholder farmers with modern agriculture, agricultural production services can effectively compensate for the shortcomings of land-transfer-based scale operations while enhancing production efficiency [10,11]. Moreover, some scholars found that there is a strong correlation between agricultural promotion services and technological efficiency [12], by optimizing farmers’ resource allocation and preventing farmers from abandoning farmland through aid from agricultural production services. Some scholars found that agricultural production services can mitigate the negative impact of an aging labor force on production efficiency [13,14,15]. Other relevant studies showed that developing agricultural production services can increase the yield per unit of grain production, thereby increasing farmers’ income [16,17].
In summary, existing studies have provided a scientific basis for exploring the relationship between agricultural production services and GPE. However, most studies employed spatial econometric models to conduct research from a macro-level perspective, failing to adequately consider the dual heterogeneity of agricultural production services and farmers’ operating scale, making it difficult to accurately and comprehensively measure the underlying mechanisms and implementation effects of agricultural production services on farmers’ GPE. Therefore, this study adopted a micro-level perspective focused on farmers to delve into the underlying mechanisms and effects of agricultural production services on farmers’ GPE. It also distinguished between farmers operating at different scales and different types of agricultural production services to identify the heterogeneous effects of agricultural production services on farmers’ GPE. At the same time, we explored the optimal operating scale for agricultural production services in different provinces for increasing the efficiency of grain production among farmers. This study provides a reference for optimizing agricultural production services to improve the GPE of smallholder and large-scale farmers and promote the modernization of agriculture.

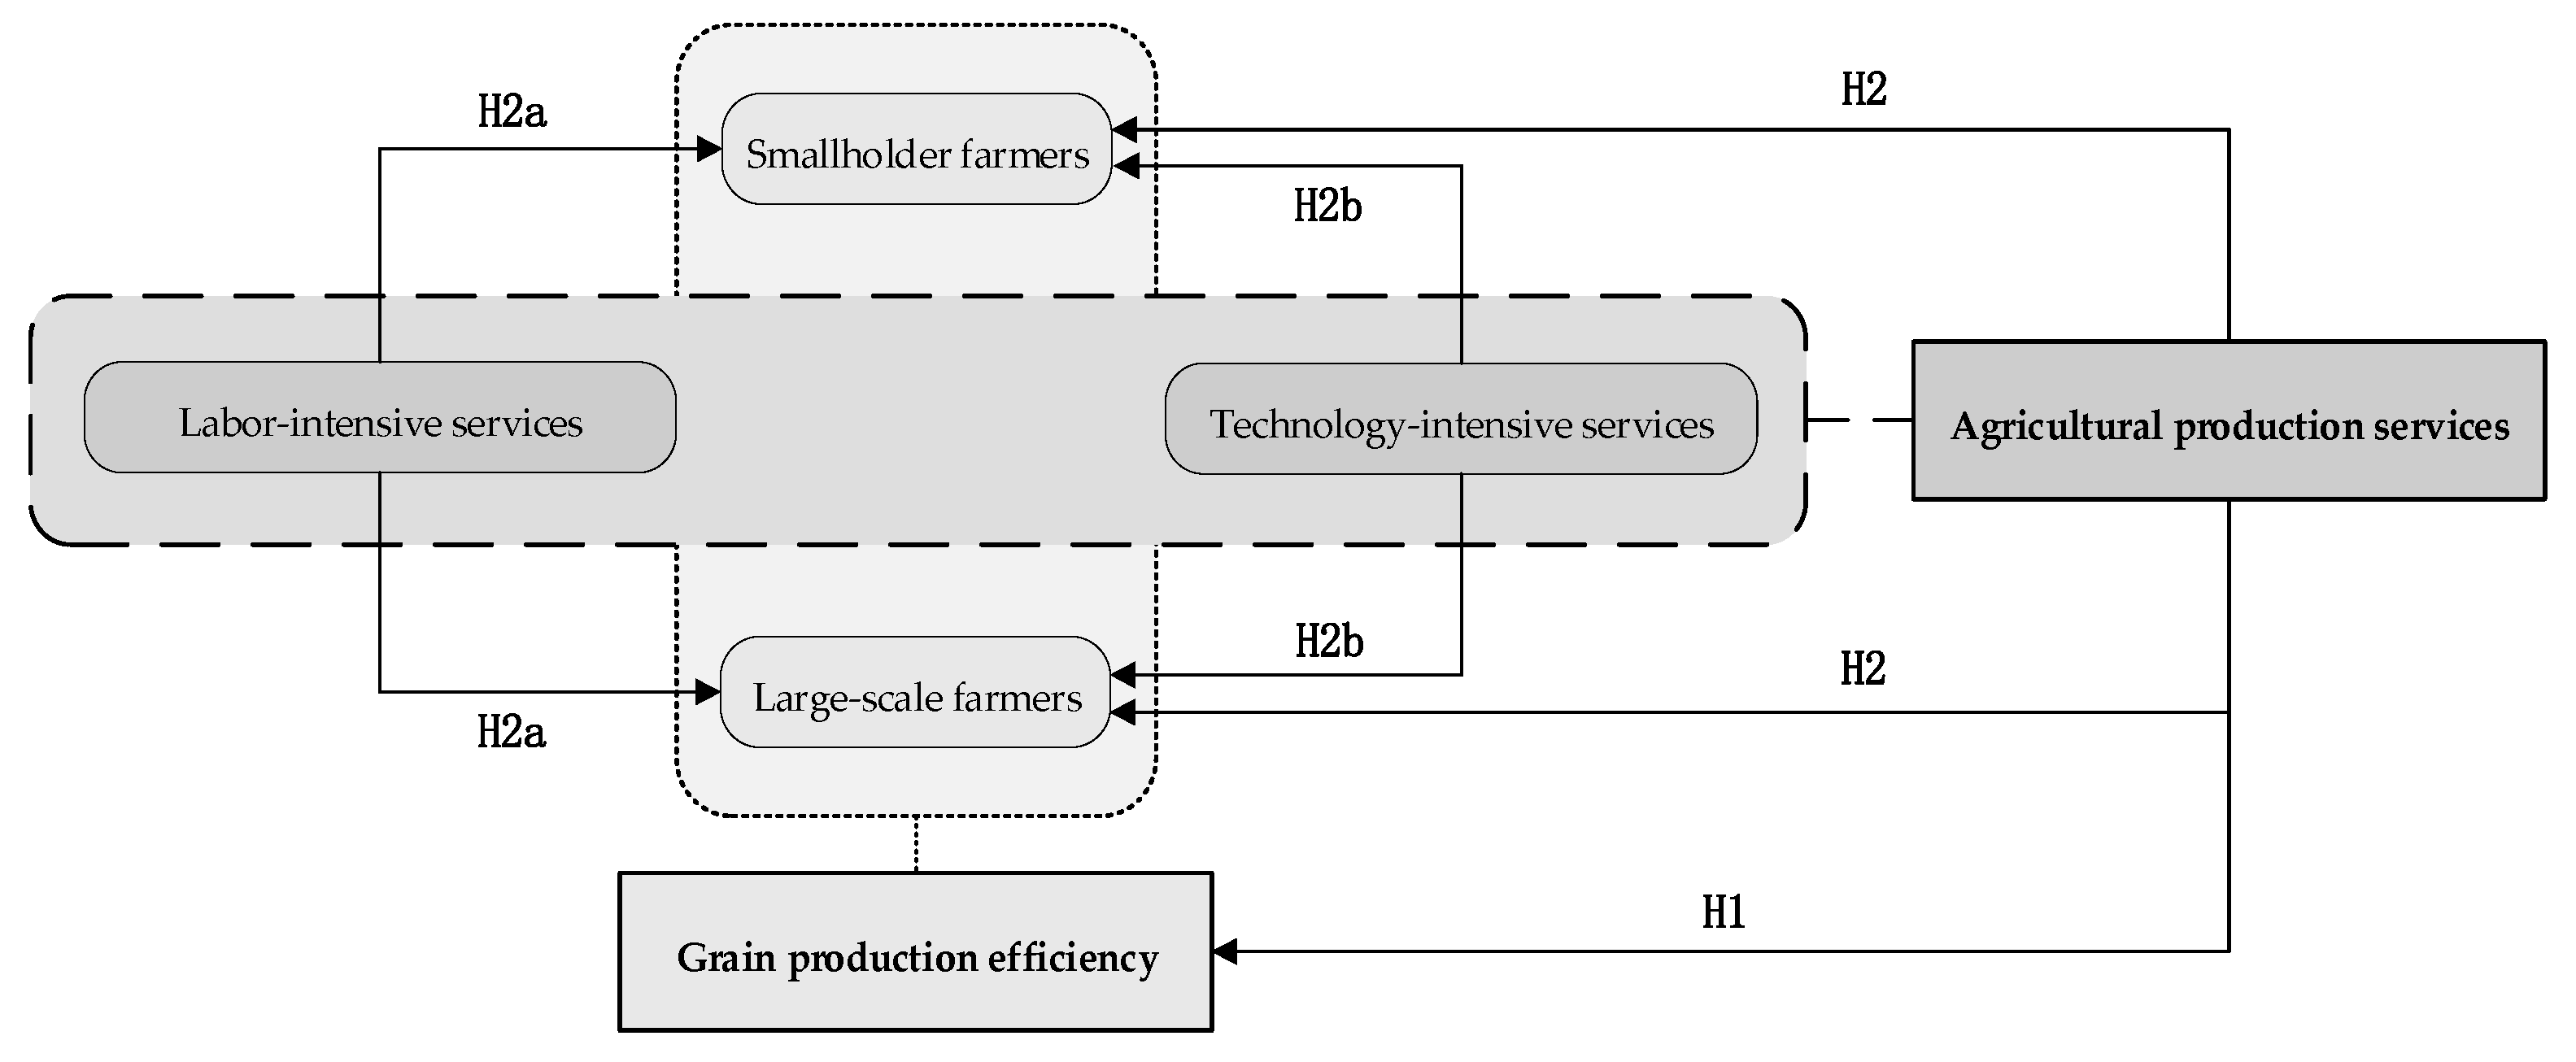
2. Theoretical Analysis Framework

Agricultural production services directly influence farmers’ GPE through the specialization of division of labor effects brought about by differentiating production stages and the scale effects resulting from resource integration. Income derived from pluriactive farming extends farmers’ binding income constraint frontier [18], enhancing their ability to purchase agricultural production services. Grounded on the theory of labor division [19,20], agricultural production services, with their advantages of high efficiency, specialization, and mechanization in various stages of grain production, can break down information barriers in farmers’ grain production processes and can allow for factor substitution within these processes. As rational economic agents [21], farmers will choose to outsource inefficient grain production stages and focus on more efficient production stages to reduce costs and improve GPE through specialization effects. In addition, based on the economies of scale theory, agricultural production services alleviate human capital constraints in grain production through substituting human labor with machinery [22] and improving scale operations by optimizing factor allocation, thereby reducing the average production costs per unit area and improving farmers’ GPE.
China’s land resource endowments and basic rural land system have gradually differentiated farmers into smallholder and large-scale farmers. This study combined the theory of social division of labor, transaction costs theory, and economies of scale theory to explain the intrinsic mechanism underlying the heterogeneous effects of agricultural production services on the GPE of farmers operating on two different scales. Smallholder farmers, constrained by their limited resource endowments, technological knowledge, and risk-bearing capacity, primarily rely on agricultural production services to enhance GPE through the following pathways: First, they address the shortcomings of traditional high-energy-consuming and low-efficiency input factors and achieve a resource restructuring effect. Second, they outsource specific production stages to achieve “specialization in parts” in grain production, thereby reducing their bargaining and coordination costs (such as sunk costs associated with purchasing agricultural machinery and learning new technologies) and realizing a cost-substitution effect. Third, they leverage the spillover effects of standardized technical packages provided by agricultural production services (such as soil testing and fertilizer prescription) to enhance GPE. In comparison, large-scale farmers have more resource endowment advantages. The primary pathways they use to enhance GPE are as follows: First, by internalizing services or contractually locking in service supplies, they reduce transaction risks, leverage scale advantages to reduce unit costs, achieve resource integration and intensive utilization, and form economies of scale [23], thereby enhancing their GPE. Second, they incorporate advanced technological services such as smart agriculture equipment and the Internet of Things to form a closed-loop technical system across the entire value chain, thereby improving their GPE [24]. Third, they optimize resource allocation through services, reorganize and integrate various service modules, such as hosting services for the entire industry chain, to further improve the division of labor, reduce marginal costs, and improve their GPE.
Differences in the technical suitability of agricultural production services for farmers of different scales may influence the farmers’ GPE differently. Smallholder farmers have limited technical knowledge and operational capabilities. As carriers of modernized operational models, agricultural production services can reduce the learning costs for smallholder farmers to master advanced technologies, enabling them to update and upgrade their grain production methods to enhance efficiency [25]. However, due to their small operational scale and dispersed operational models, smallholder farmers face higher costs when adopting new technologies, which may limit the efficiency of technology integration. Therefore, smallholder farmers focus on “external service embedding” and cost substitution and prefer labor-intensive services. Large-scale farmers pursue the maximization of profits from agricultural production activities; they weigh the costs and benefits of their resource endowments and make trade-offs, achieving higher technical efficiency through technological coordination (such as complete mechanization). It is evident that large-scale farmers rely on “internal resource integration” and technological coordination and are more willing to adopt technology-intensive services [26]. However, expanding the operating area of large-scale farmers may increase moral hazards in agricultural production organizations. It may lead to adverse effects of technology-intensive services on the farmers’ GPE (Figure 1).
This study tested the following hypotheses:
H1: 
Agricultural production services can improve farmers’ GPE.
H2: 
Agricultural production services have different effects on farmers’ GPE depending on their operational scale.
H2a: 
Labor-intensive services have different effects on farmers’ GPE depending on their operational scale.
H2b: 
Technology-intensive services have different effects on farmers’ GPE depending on their operational scale.

3. Research Data and Methods

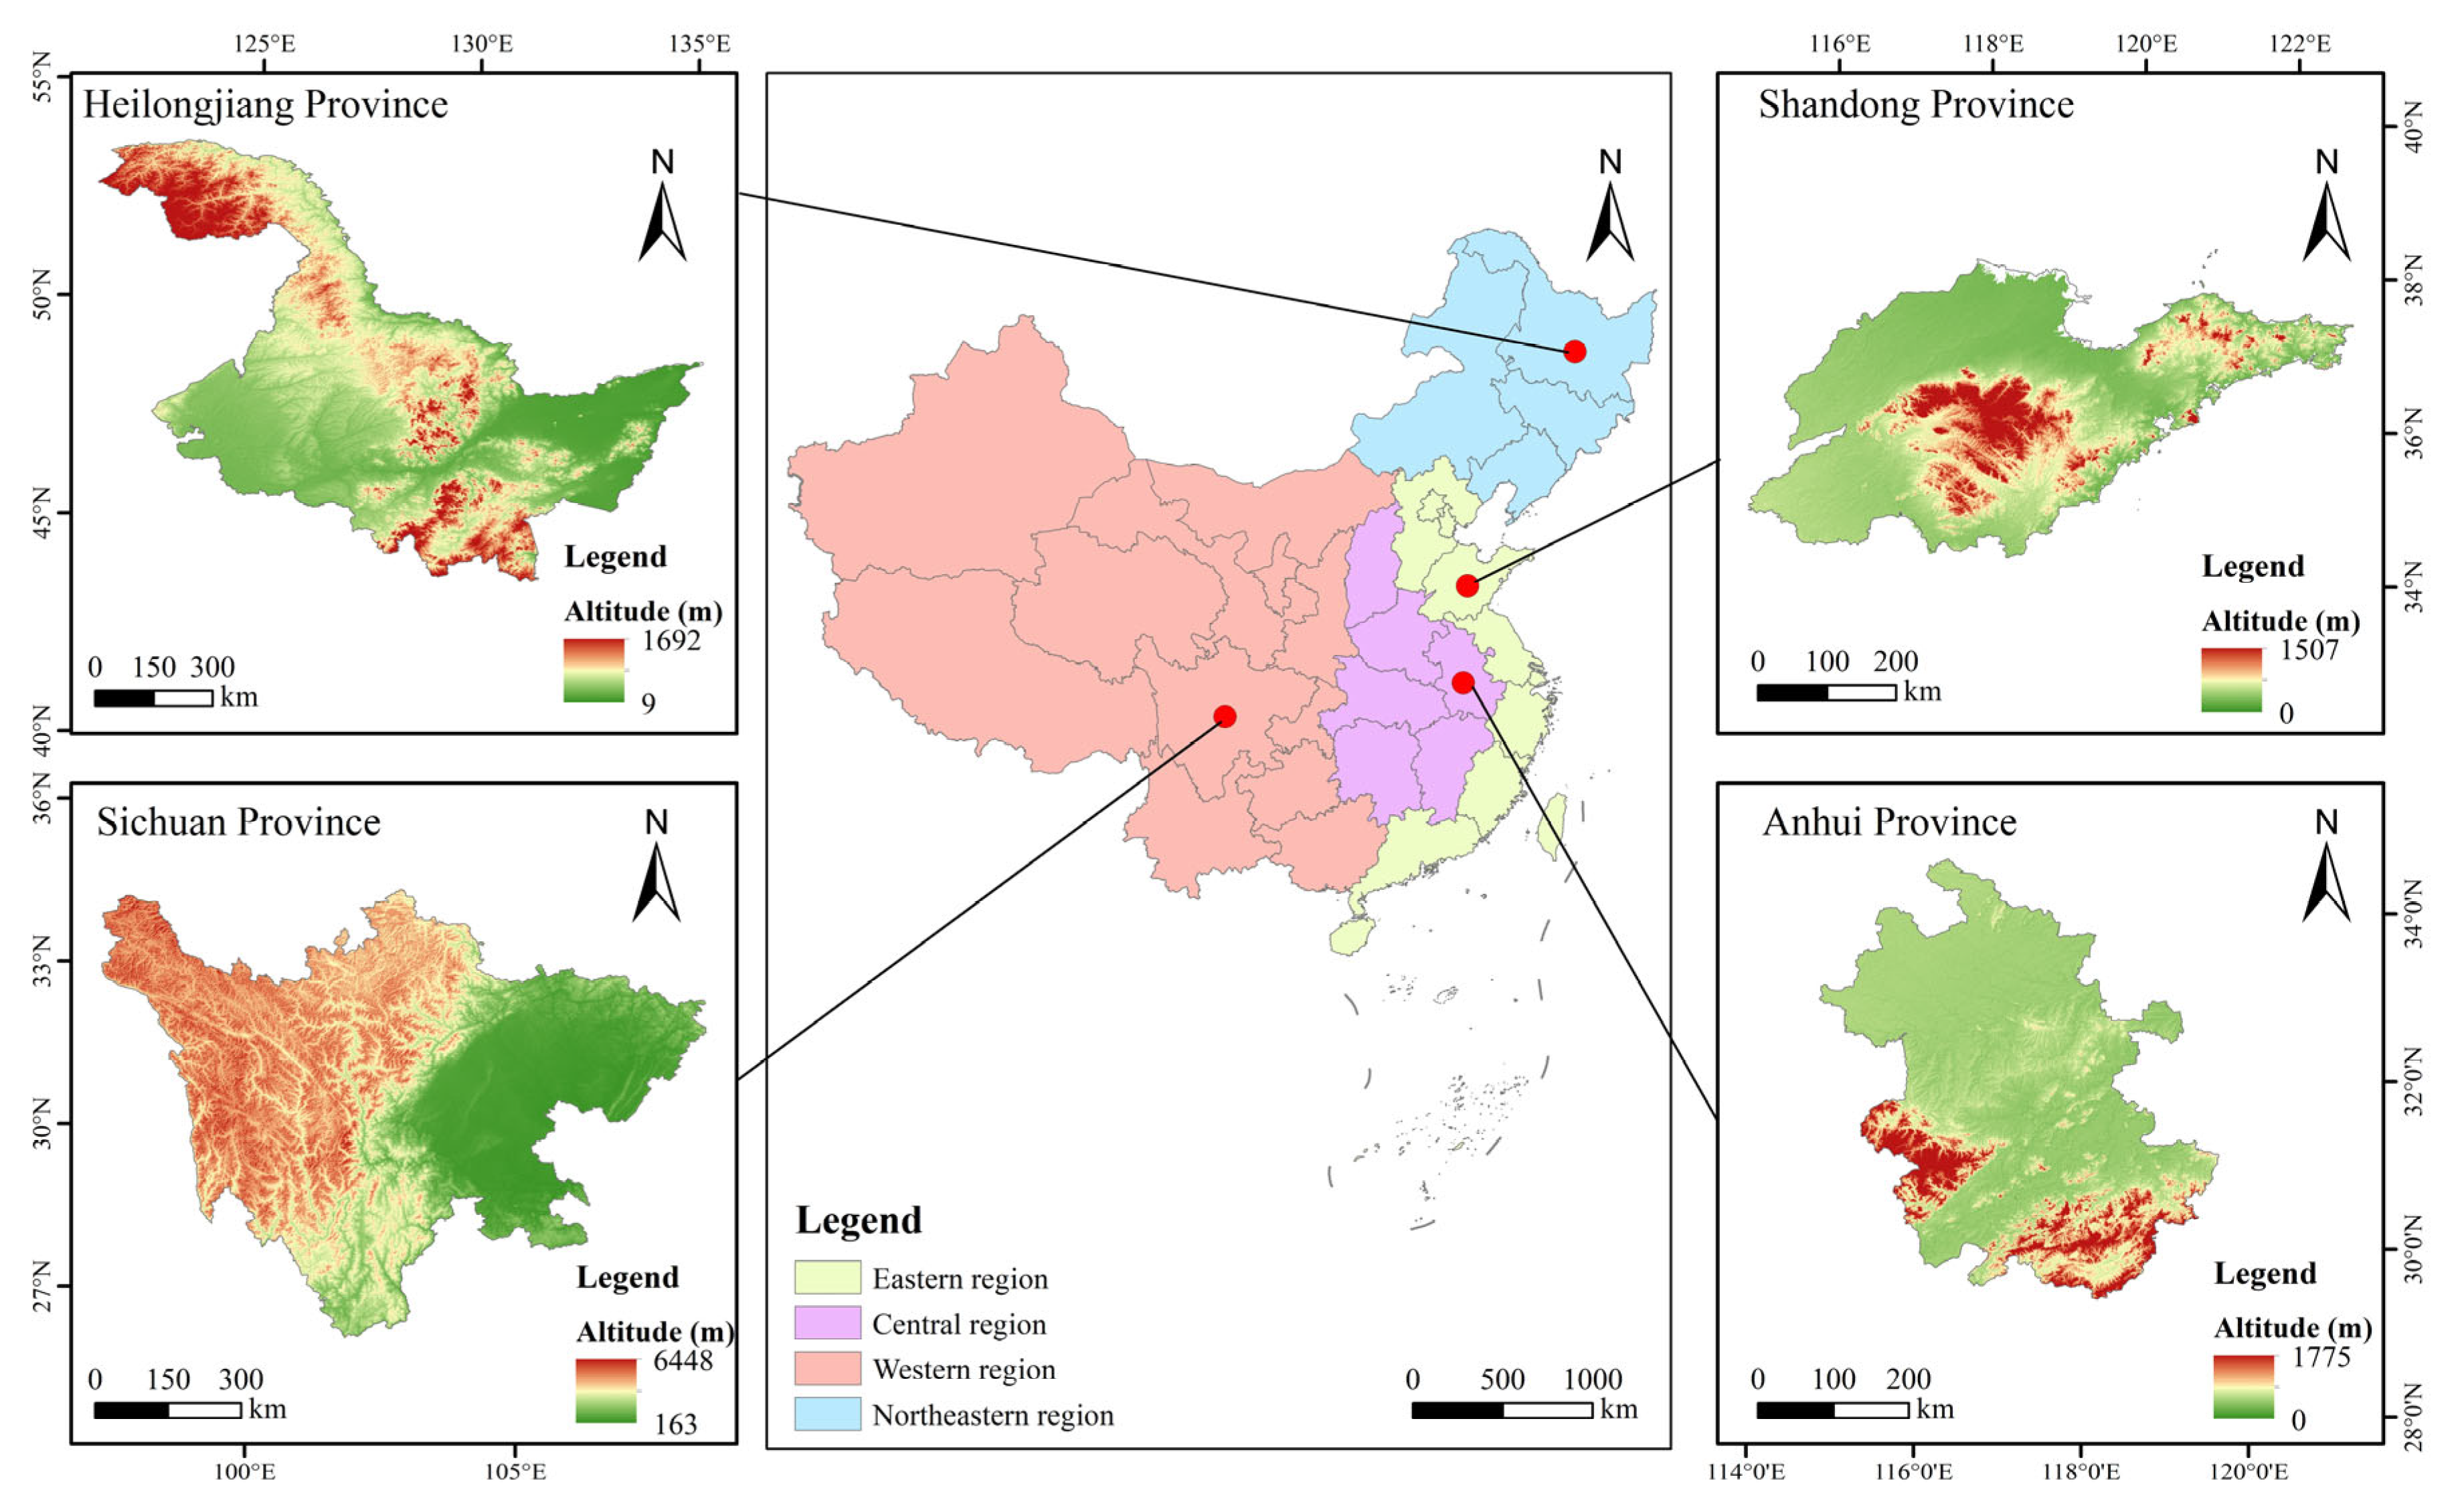
3.1. Data and Variables

All the data were sourced from the CRRS database of the of Rural Development Institute Chinese Academy of Social Sciences. This database comprehensively, objectively, and accurately records the basic conditions of rural area in China. The CRRS mainly covers 10 provinces (autonomous regions): Guangdong Province, Zhejiang Province, Shandong Province, Anhui Province, Henan Province, Heilongjiang Province, Guizhou Province, Sichuan Province, Shaanxi Province, and the Ningxia Hui Autonomous Region. This study prioritized data from China’s five major grain-producing provinces (Heilongjiang Province, Shandong Province, Anhui Province, Sichuan Province, and Henan Province). In this study, considering the unequal distribution of grain-producing farmland in major grain-producing provinces, according to the economic zone distribution by the National Bureau of Statistics of China, the Chinese government’s regional strategy, and the distinct regional characteristics and the distinct regional characteristics of the major grain-producing provinces, we employed four policy divisions of China including Northeast, East, Central, and West. This study selected Heilongjiang Province (northeastern), Shandong Province (eastern), Anhui Province (central), and Sichuan Province (western) for analysis. To more clearly reflect the real situation of GPE in China’s major grain-producing areas, making the research more representative and universal. Figure 2 shows the selected provinces in a map of China. The data included agricultural productive services, the input and output of sample farmers’ agricultural planting, the characteristics of production decision-makers, agricultural production characteristics, etc. CRRS aims to cover entire provinces as comprehensively as possible spatially, selecting sample counties via equidistance random sampling based on provincial county-level per capita Gross Domestic Product (GDP); the sampling method randomly selects townships (towns) and villages. We obtained 747 valid samples after removing incomplete samples.

3.1.1. Core Explanatory Variables

Agricultural production services (APS) is the core explanatory variable of this study. Referring to the method of Chen et al. [27], the proportion of service input cost in the total cost of agricultural production reflects the degree of adoption of agricultural productive services.
P = i ( w i × C i I i )
where P represents APS; i denotes each grain production stage, primarily covering tillage, sowing, irrigation, pest and disease management, harvesting, and transportation; and w i denotes each grain production stage’s degree of importance in the production process. Given the indivisible nature of output values across production stages in agricultural production, the proportion of the cost paid by the i th production link in the total cost of all production links indicates each link’s degree of importance. Therefore, we can transform the above equation into
P = i ( I i I × C i I i ) = i ( C i I i )
where I i represents the total cost of the i th production stage; I represents the total cost of all stages; and C i represents the cost of APS in the i th production stage.
In the empirical analyses, the APS were classified into labor-intensive and technology-intensive services. Labor-intensive services encompass tillage, sowing, irrigation, harvesting, and transportation, while technology-intensive services encompass pest and disease management services. The calculation formulas are shown below.
P l = C l I
where P l represents labor-intensive services, and C l represents the cost of the labor-intensive services.
P t = C t I
where P t represents technology-intensive services, and C t represents the cost of the technology-intensive services.

3.1.2. Dependent Variable

The super-efficiency DEA model was employed to calculate the farmers’ GPE. This study used sowing area (hm2), labor hours (person-hours), and agricultural input costs (CNY) as the input variables and grain output (kg) as the output variable; constructed a grain production input–output indicator system; and calculated the farmers’ GPE.

3.1.3. Control Variables

The control variables primarily encompassed the characteristics of production decision-makers and the characteristics of agricultural production. The characteristics of production decision-makers included the age of farmers (AGE) and educational years (EDU) of the agricultural production decision-makers, as well as whether they hold a position in the village (POS). The characteristics of agricultural production included the extent of the pluriactivity-level farmers (PLF), the average land plot area (ALPA), the disaster status (DS), and the membership status of participating in the farmers’ cooperative (PFC), See Table 1 for details.

3.2. Model Construction

3.2.1. Super-Efficiency DEA Model

The model can overcome the traditional DEA model’s limitations and effectively distinguish the differences between DMUs. If multiple DMUs are relatively effective, the degree of effectiveness can be further distinguished, and the accuracy of the efficiency measurement can be significantly improved [28]. Assuming there are n decision-making units of the same type, and using i types of inputs to obtain j types of outputs [29], the specific expression is as follows:
s . t . m i n θ j = 1 j j 0 n λ j X j + S = θ X 0 j = 1 n λ j Y j S + = Y 0 j j 0 λ j 0 ( j = 1,2 , , n ) S + 0 , S 0
where θ denotes the farmers’ GPE; X 0 signifies the input variables; Y 0 indicates the output variables; X j represents the input quantity of the j th farmer, comprising the farmer’s grain sowing area, labor hours, and agricultural input costs; Y j is the output quantity (grain production) of the j th farmer; λ j denotes the weight coefficient; S + denotes the slack variable; and S denotes the remaining variable.
This study defined farmers with land holdings of less than 2 hectares as smallholder farmers and those with land holdings of 2 hectares or more as large-scale farmers based on the definition of farm size of the Food and Agriculture Organization of the United Nations (FAO). The GPE results are shown in Table 2.

3.2.2. Tobit Model

This study used a super-efficient DEA model to calculate the explanatory variable, the GPE of farmers, which ranged from 0 to 2 and consisted of truncated data. Ordinary least squares (OLS) regression is commonly used in analyses to perform linear regression on entire samples; however, non-linear disturbance terms are included in the disturbance term, which can lead to inconsistent estimates. In contrast, the Tobit model has the characteristics of a two-sided broken tail, which can convert truncated data into a probability model. The model was estimated using maximum likelihood estimation (MLE), which has high estimation accuracy and reliability. The model can be expressed as follows:
Y i = β 0 + β 1 P i + β 2 Q i + μ i
where Y i represents the farmers’ GPE; P i represents APS; β 1 and β 2 are the parameters to be estimated; μ i represents the random disturbance term; and Q i represents the control variables, which are the characteristics of production decision-makers and characteristics of agricultural production.

4. Empirical Results and Analysis

4.1. Empirical Analysis of the Effect of Agricultural Production Services on Farmers’ GPE

Table 3 shows the model estimation results for the impact of APS on the GPE of all the farmers (result 1), smallholder farmers (result 2), and large-scale farmers (result 3). Regression result 1 shows that at the 1% significance level, APS positively and significantly impacted the farmers’ GPE, indicating that APS can significantly enhance farmers’ GPE, supporting hypothesis H1. Differentiating between the farmers working at different scales, regression results 2 and 3 indicate that APS have a significant positive impact on the GPE of smallholder farmers at the 1% level while having a positive but insignificant impact on the GPE of large-scale farmers. This indicates that APS have different effects on small and large-scale farmers’ GPE, supporting hypothesis H2. Thus, for smallholder farmers, APS can break through the constraints of traditional labor and alleviate efficiency gaps caused by resource endowment differences among smallholder farmers through substituting human labor with machinery. For large-scale farmers, their relatively abundant family resource endowments make them more inclined to engage in self-service. Large-scale farmers are more likely to purchase agricultural machinery and equipment to spread out sunk costs than to purchase agricultural production services.

4.2. Empirical Examination of the Effects of Labor-Intensive Services on Farmers’ GPE

Table 4 shows the model estimates of the impact of labor-intensive services on farmers’ GPE in three scenarios: all farmers, smallholder farmers, and large-scale farmers. Regression result 4 indicates that labor-intensive services significantly and positively affected the farmers’ GPE at the 1% significance level, which suggests that labor-intensive services enhance labor substitution effects, increase specialization in production processes, and facilitate the transition of agricultural operating models toward intensification. Under rising labor costs, this reduces the labor input per unit area and the cost of production factors, thereby improving the farmers’ GPE. There were significant differences in the impact of labor-intensive services on the farmers’ GPE depending on their production scale. According to regression results 5 and 6, labor-intensive services significantly enhanced the GPE of smallholder farmers at the 5% significance level while the impact on large-scale farmers was insignificant, supporting hypothesis H2a. In contrast to large-scale farmers, who depend on agricultural income as their primary source of earnings, an increase in the pluriactivity of smallholder farmers led to a heightened demand for labor-intensive services. APS alleviate the labor constraints of smallholder farmers by replacing manual labor with machinery and standardizing operational processes, thereby avoiding unnecessary losses in grain production. Therefore, labor-intensive services can enhance the GPE of smallholder farmers. In contrast, large-scale farmers, in pursuit of profit maximization, weigh the pros and cons of each operational process from the perspective of cost reduction and efficiency improvement. Typically, large-scale farmers already possess the agricultural machinery required for the scale of their farmland, so their demand for labor-intensive services to replace manual labor is not as urgent as that of smallholder farmers. Large-scale farmers purchase labor-intensive services from external providers only if they cannot complete the factor allocation for specific production stages with existing resources. Therefore, large-scale farmers generally prefer to purchase agricultural machinery directly to meet their own service needs.

4.3. Empirical Analysis of the Effects of Technology-Intensive Services on Farmers’ GPE

Table 5 shows the model estimates of the impact of technology-intensive services on the GPE of all the farmers, smallholder farmers, and large-scale farmers. Regression result 7 shows that technology-intensive services positively and significantly influenced the farmers’ GPE at the 10% level. Technology-intensive services, which primarily focus on pest and disease control, serve as vehicles for advanced agricultural technologies to enter the grain production process, thereby standardizing and enhancing the precision of grain production and improving farmers’ GPE. According to regression results 8 and 9, technology-intensive services affected the GPE of small- and large-scale farmers differently, supporting hypothesis H2b. Regression result 8 shows that technology-intensive services positively influenced the GPE of smallholder farmers. However, the impact was not significant, which may be because farmers need to apply pesticides and fertilizers multiple times during the crop growth stage, requiring them to pay significant costs if they choose to purchase services, ultimately leading to increased production costs. Additionally, smallholder farmers typically operate on small, scattered plots and are often inefficiently using large machinery like “A big horse pulls a small cart.” Therefore, smallholder farmers may be less inclined to purchase technology-intensive services after comprehensively considering both production costs and practical circumstances. In contrast, regression result 9 shows that technology-intensive services had a negative but insignificant effect on the large-scale farmers’ GPE. One possible reason for this is the current low level of standardization for technology-intensive services. Different crops require varying concentrations and ratios of pesticides and fertilizers at different growth stages, and the parts of plants where different pesticides are applied also vary, making it difficult to establish a standardized operational process. For example, most drone-based pest control technologies can only spray pesticides onto the upper surface of leaves and fail to cover the lower surface of leaves, roots, or stems of plants. Therefore, the indivisibility and limitations of technology-intensive services, combined with the temporal and spatial heterogeneity of crop growth, have hindered the effectiveness of technology-intensive services. On the other hand, supervision costs are high, and service quality assessments are lacking. Due to the seasonal constraints of pesticide and fertilizer application in grain production, some service providers may reduce service quality to maximize their benefits, leading to moral hazards. This forces large-scale farmers to incur additional costs for supervision. Even so, the lack of effectiveness of technology-intensive services makes it difficult to comprehensively assess the service quality in the short term, potentially resulting in sunk costs from trial-and-error services and hindering improvements in the farmers’ GPE.

4.4. Analyses Based on the Threshold Effect

The above results show that APS positively affected the farmers’ GPE. Next, we asked, can APS continuously promote the improvement of the GPE in different regions and for farmers operating on different scales? Is there a critical point or appropriate operating scale for farmers, and what impact will APS have on farmers’ GPE beyond this operating scale? This study used a threshold regression model to calculate the optimal operating scale for agricultural production services to promote farmers’ GPE by province [30]. This study selected the farm operating scale as the threshold variable and used a sample of 593 farmers who used APS. The farm operating scale used was the original value that was used in the threshold value calculation.
This study examined the significance of the threshold effect and further explored the impact of APS on the farmers’ GPE in each province based on the threshold value (Table 6). The regression results show that, based on the entire sample of farmers surveyed, only the single threshold passed the significance test; the threshold estimate was 5.67, with a 95% confidence interval of [2, 5.81]. When the farmers’ operating scale was less than 5.67 hectares, APS positively promoted the GPE of the farmers at a significance level of 5%. When the farmers’ operating scale was greater than or equal to 5.67 hectares, APS had a positive but insignificant effect on the GPE of the farmers. Heilongjiang Province in the northeast did not pass the threshold test. Possible reasons for this include the significant advantages of agricultural mechanization in Heilongjiang Province. According to data from the Department of Agriculture and Rural Affairs of Heilongjiang Province, the comprehensive mechanization level of crop plowing, planting, and harvesting in Heilongjiang Province reached 99.07%, far exceeding the national average of over 75% reported by the Ministry of Agriculture and Rural Affairs of the People’s Republic of China. Additionally, the average operating scale of the surveyed farmers was 7.82 hectares, which is significantly higher than other provinces. This indicates that Heilongjiang Province is capable of and is suitable for large-scale grain production. At the same time, the subsequent tests showed that the impact of Heilongjiang Province’s APS on the GPE of the farmers passed the significance test at the 5% level, confirming the effectiveness of vigorously developing APS to improve farmers’ GPE in Heilongjiang Province. Shandong Province passed the single threshold significance test with a single threshold estimate of 0.43 and a 95% confidence interval of [0.43, 0.8]. When the farmers’ operating scale was less than 0.43 hectares, APS had a negative impact on their GPE at the 5% significance level. When the farmers’ operating scale was greater than or equal to 0.43 hectares, APS had a significant positive impact on their GPE at the 5% significance level, showing an overall trend of first decreasing and then increasing the GPE. Anhui Province passed the single threshold significance test with a threshold estimate of 0.81 and a 95% confidence interval of [0.77, 1.04]. APS had an overall positive but insignificant impact on the farmers’ GPE. Sichuan Province passed the single threshold significance test with a single threshold estimate of 0.39 and a 95% confidence interval of [0.33, 0.45]. When the farmers’ operating scale was less than 0.39 hectares, APS positively impacted their GPE at a significance level of 1%. When the farmers’ operating scale was greater than or equal to 0.39 hectares, APS had a significant positive impact on their GPE at a significance level of 5%.

4.5. Robustness Test

To ensure the robustness of the above results, this study used two methods to test robustness: replacement measurement models (Test 1) and replacement variables (Test 2). In Test 1, when analyzing the impact of APS on farmers’ GPE, it was necessary to address the measurement errors and the endogeneity caused by two-way causality. Therefore, this study utilized the double-hurdle model in the analysis. In Test 2, the measurement method of the core explanatory variable (APS) was replaced with the proportion of the number of stages in which farmers utilize APS out of the total number of stages of APS. Comparing the results of Tests 1 and 2 in Table 7 with the regression results in Table 3 shows that the robustness test results were consistent with the previous empirical findings, indicating that the conclusions of this study are robust.

5. Discussion

In summary, this study employed the super-efficiency DEA model to measure farmers’ GPE and the Tobit model to analyze the impact of APS on GPE. The results indicate that APS positively influenced farmers’ GPE, a finding consistent with Tang et al. and Yan et al. [11,16].
Previous research indicates that APS alleviate smallholders’ constraints on production factors and reduce costs [31], while revealing an inverted U-shaped relationship between capital endowment and agricultural production efficiency [32]. Building on the heterogeneity of APS adoption and farmers’ operating scale, this study demonstrates that APS exert a stronger positive effect on the GPE of smallholder farmers than on large-scale operators. Due to their operational scale, smallholder farmers may be unable to offset the costs of purchasing and maintaining agricultural machinery with the profits generated from grain operations. Therefore, purchasing agricultural production services for a specific production stage is not only a rational choice for smallholder farmers to control operational costs, but it also enables them to introduce advanced planting technologies into traditional production stages, allowing them to benefit from the efficiency gains brought by technological advancements. Large-scale farmers possess more agricultural machinery than smallholder farmers, making them more inclined to providing services rather than using them.
Gai (2023) established that labor factors and agricultural price adjustments significantly affect farmers’ production efficiency [33]. This study further demonstrated that labor-intensive services exert a greater effect on farmers’ GPE than technology-intensive services. Specifically, labor-intensive services can significantly enhance the GPE of smallholder farmers. Smallholder farmers face constraints from their limited amount of arable land and cannot maintain normal expenses solely with agricultural income. As a result, some labor flows from rural areas to cities, and labor-intensive services can fill the labor gap and meet the needs of smallholder farmers for their pluriactive activities. Technology-intensive services do not significantly affect the GPE of small- or large-scale farmers. Technology-intensive services, such as pest and disease control, are characterized by low levels of standardization for operational procedures, moral hazards in the operational process, and difficulties in measuring operational quality. As a result, technology-intensive services are currently unable to effectively promote farmers’ GPE, and there is room for improvement in service quality. Building on this foundation, we employed a threshold regression model to determine the optimal operational scale of APS for enhancing GPE. The analysis revealed that all farmers met the significance criterion for a single threshold. When farmers’ operating scale exceeded 5.67 hectares, APS no longer exerted significant effects on GPE. Notably, provincial-level thresholds varied significantly: Shandong (0.43), Anhui (0.81), and Sichuan (0.39) met the single-threshold significance criterion, whereas Heilongjiang showed no statistically identifiable threshold. These results demonstrate substantial cross-provincial heterogeneity in optimal operational scales.

6. Conclusions, Policy Recommendations, and Limitations

6.1. Conclusions

Using the CRRS database, this study examined the impact of APS on GPE from the perspective of micro-farmers. It analyzed the effects of different APS on GPE based on the farmers’ operating scale. Using threshold regression, we further explored the optimal operating scale for farmers in each province for improving GPE through using APS. The main findings are as follows: (1) At a significance level of 1%, APS can improve the GPE of farmers. However, there were different effects on smallholder farmers and large-scale farmers. Specifically, APS positively affected the smallholder farmers’ GPE at a significance level of 1%. However, the effect on large-scale farmers’ GPE was insignificant. (2) Labor-intensive services promoted the GPE of farmers at a significance level of 1%. These services significantly positively impacted the smallholder farmers’ GPE at a level of 5%. However, the impact on large-scale farmers’ GPE was insignificant. (3) At the 10% level, technology-intensive services significantly improved the farmers’ GPE. However, their impact on the GPE of smallholder and large-scale farmers was insignificant. (4) There was significant regional heterogeneity in the threshold effect of agricultural productive services on the GPE of farmers, with different threshold values in the different provinces. Shandong Province, Anhui Province, and Sichuan Province, but not Heilongjiang Province, passed the significance test for a single threshold. Overall, all farmers passed the significance test of a single threshold with a threshold of 5.67, and the effect of agricultural productivity services on farmers’ GPE changed from positive and significant to positive but not significant before and after the threshold.

6.2. Policy Recommendations

Based on the above research results, we propose the following recommendations:
Enhance the capability of APS to address the diverse service needs of farmers: Due to the uneven quality of agricultural production services, service providers cannot accurately address farmers’ service needs. Agricultural production service providers should standardize service processes, ensure service quality, develop personalized service plans, adjust fertilizer and pesticide ratios based on the actual growth conditions of the crops, and tailor the services to the local conditions to enhance the precision and professionalism of the operational processes. Additionally, they should invest in advanced production equipment and provide farmers with cutting-edge production technologies to win their trust through high-quality services and encourage more farmers to benefit from the efficiency gains from APS.
Unify service standards and regulate industry development: The government should focus on technology-intensive services with low standardization and poor service quality, such as pesticide application and fertilizer application, and establish industry standards for these APS, and uniformly regulate the service items, service prices, etc. Local governments must establish a long-term agricultural service management mechanism, register and archive regional service organizations, and conduct regular follow-ups with the farmers using the services to evaluate provider quality. Agricultural bureaus should commend exemplary service providers and prioritize their access to subsidies and technical assistance, issue warnings to service providers with poor service quality, and require rectification to eliminate potential moral hazard behaviors during service provision.
Leverage the coordinating role of grassroots organizations to facilitate efficient service operations: Village and community organizations should establish contact with agricultural production service organizations within their regions and leverage their “unifying and dividing” functions to provide targeted assistance to different farmers. For smallholder farmers, scattered plots should be consolidated to enable large agricultural machinery to operate on site. These organizations should represent smallholder farmers in negotiations with qualified service providers regarding service matters, thereby reducing smallholder farmers’ information search costs and reversing their disadvantaged position in the market. When dealing with large-scale farmers, it is important to actively seek out service providers with high levels of specialization, assist in supervising service delivery, and verify service outcomes. Village-level organizations should be guarantors to prevent large-scale farmers’ rights and interests from being infringed upon.
Based on the different operational scales of the farmer, targeted development models should be developed, and financial and technical support and institutional guarantees should be provided. For smallholder farmers, first, a tiered supply model of “service consortiums + smallholder farmers” should be promoted, and village-level full-service management service outlets should be developed. Second, the cost of key services such as agricultural machinery operations should be reduced, pest control should be unified through government subsidies, and the use of smallholder intelligent equipment should be promoted. Third, farmers’ cooperatives should be given support in integrating service demands and representing farmers in market negotiations, and a profit-sharing mechanism combining a guaranteed minimum income and dividend distribution based on shares should be explored. For large-scale farmers, first, a full-chain service system should be established, and agricultural production service organizations should be encouraged to provide integrated solutions covering “tillage, sowing, management, harvesting, and storage.” Second, the application of smart agricultural equipment (such as precision irrigation and drone-mediated remote sensing) should be given priority in terms of subsidies, products such as large-scale agricultural machinery leasing should be developed, and a green channel for large-scale production credit should be established to reduce the risks of intensive management. Third, the institutional guarantee system should be improved, tax incentives should be used to encourage service providers to focus on grain production, and the allocation of land factors should be optimized to promote long-term stable large-scale management.

6.3. Limitations

This study has certain limitations. First, due to geographical restrictions in the database, obtaining information on farmers in other major grain-producing areas was impossible. Differences in terrain, landforms, and resource endowments between regions in China can lead to heterogeneity in the research results. Therefore, in follow-up studies, it will be necessary to expand the research area to include China’s 13 major grain-producing regions. Second, there were certain limitations in the research methods. Efficiency measurements based on the DEA model rely on static cross-sectional data and fail to capture the dynamic effects of technological progress. Subsequent studies should use the SBM model to optimize slack variable processing and combine spatial econometric models to conduct more accurate and comprehensive research on the impact of APS on farmers’ GPE.

Author Contributions

Conceptualization, F.L. and C.L.; methodology, F.L.; software, F.L.; validation, L.G., C.L. and W.X.; formal analysis, F.L. and L.G.; investigation, F.L., L.G., C.L. and W.X.; resources, L.G.; data curation, F.L.; writing—original draft preparation, F.L., C.L. and W.X.; writing—review and editing, F.L. and L.G.; visualization, F.L. and W.X.; supervision, L.G.; project administration, F.L. and L.G.; funding acquisition, L.G. All authors have read and agreed to the published version of the manuscript.

Funding

This research was funded by the National Social Science Foundation of China (18BJY150), the Major Economic and Social Investigation Project funded by the Chinese Academy of Social Sciences (GQDC2020017), the Innovation and Development Strategy Research Project of the Science and Technology Department of Jilin Province (20240701020FG), and the Science and Technology Research Project of the Education Department of Jilin Province (JJKH20250605BS).

Institutional Review Board Statement

Not applicable.

Informed Consent Statement

Not applicable.

Data Availability Statement

Data will be available on request from the first author.

Conflicts of Interest

The authors declare no conflicts of interest.

Abbreviations

The following abbreviations are used in this manuscript:
GPEGrain Production Efficiency
APSAgricultural Production Services
LISLabor-Intensive Services
TISTechnology-Intensive Services

References

  1. Yang, L.; Liang, Z.; You, L.; Hu, P. Productive Services, Circuitous Investment, and Agricultural Fertilizer Reduction and Efficiency Improvement. J. Agrotech. Econ. 2025, 5, 50–68. [Google Scholar] [CrossRef]
  2. Wu, F.; Li, Z.; Zhong, Z. Analysis of Behavioral Logics in Transferees’ Ecological Protection of Farmland from the Perspectives of Contract and Relationships. J. Huazhong Agric. Univ. (Soc. Sci. Ed.) 2025, 2, 194–206. [Google Scholar] [CrossRef]
  3. Luo, B. Strategical Transformation: Understanding the Chinese Pattern of Agricultural Modernization. J. Huazhong Agric. Univ. (Soc. Sci. Ed.) 2022, 4, 1–9. [Google Scholar] [CrossRef]
  4. Kaur, G.; Rajni; Sivia, J.S. Integrating data envelopment analysis and machine learning approaches for energy optimization, decreased carbon footprints, and wheat yield prediction across north-western India. J. Soil Sci. Plant Nutr. 2024, 24, 1424–1447. [Google Scholar] [CrossRef]
  5. Ren, T.; Liu, S.; Nie, Y. The impact of Maize-Soybean strip intercropping on farmers’ production efficiency: Empirical analysis based on the Huang-Huai-Hai and Southwest planting areas. Resour. Sci. 2024, 46, 1346–1357. [Google Scholar] [CrossRef]
  6. Wang, R.; Deng, X.; Gao, Y.; Chen, J. Does regional economic development drive sustainable grain production growth in China? Evidence from spatiotemporal perspective on low-carbon total factor productivity. Socio-Econ. Plan. Sci. 2025, 98, 102129. [Google Scholar] [CrossRef]
  7. Zhang, Q.; Zhang, F.; Wu, G.; Mai, Q. Spatial spillover effects of grain production efficiency in China: Measurement and scope. J. Clean. Prod. 2021, 278, 121062. [Google Scholar] [CrossRef]
  8. Zhang, D.; Wang, H.; Lou, S. Research on grain production efficiency in China’s main grain-producing areas from the perspective of grain subsidy. Environ. Technol. Innov. 2021, 22, 101530. [Google Scholar] [CrossRef]
  9. Shi, R.; Shen, Y.; Du, R.; Yao, L.; Zhao, M. The impact of agricultural productive service on agricultural carbon efficiency—From urbanization development heterogeneity. Sci. Total Environ. 2024, 906, 167604. [Google Scholar] [CrossRef]
  10. Guo, X.; Wen, G. The Development Logic, Realistic Obstacles, and Optimization Paths of Agricultural Socialized Services. Chin. Rural. Econ. 2023, 7, 21–35. [Google Scholar] [CrossRef]
  11. Tang, W.; Zhou, F.; Peng, L.; Xiao, M. Does agricultural productive service promote agro-ecological efficiency? Evidence from China. Therm. Sci. 2023, 27, 2109–2118. [Google Scholar] [CrossRef]
  12. Liu, Q.; Jiang, Y.; Lagerkvist, C.J.; Huang, W. Extension services and the technical efficiency of crop-specific farms in China. Appl. Econ. Perspect. Policy 2023, 45, 436–459. [Google Scholar] [CrossRef]
  13. Xu, B.; Baležentis, T.; Štreimikienė, D.; Shen, Z. Enhancing agricultural environmental performance: Exploring the interplay of agricultural productive services, resource allocation, and marketization factors. J. Clean. Prod. 2024, 439, 140843. [Google Scholar] [CrossRef]
  14. Tian, Y.; Gao, Y.; Pu, C. Do agricultural productive services alleviate farmland abandonment? Evidence from China rural household panel survey data. Front. Environ. Sci. 2023, 11, 1072005. [Google Scholar] [CrossRef]
  15. Jiang, C.; Zhang, Y. Rural Population Aging, Agricultural Producer Services, and Agricultural Technical Efficiency. World Agric. 2022, 6, 90–100. [Google Scholar] [CrossRef]
  16. Yan, H.; Qiao, J. The Impact of Agricultural Productive Services on Grain Production: An Empirical Study based on China′s Provincial Panel Data from 2008 to 2017. Commer. Res. 2020, 8, 107–118. [Google Scholar] [CrossRef]
  17. Han, G.; Cui, W.; Chen, X.; Gao, Q. The sustainability of grain production: The impact of agricultural productive services on farmers’ grain profits. Front. Sustain. Food Syst. 2024, 8, 1430643. [Google Scholar] [CrossRef]
  18. Niu, Q.; Li, G. Off-farm Work, Agricultural Productive Services and Production Efficiency—Empirical Evidence from National Rural Fixed Observation Points Survey. J. Huazhong Agric. Univ. (Soc. Sci. Ed.) 2024, 5, 72–81. [Google Scholar] [CrossRef]
  19. Smith, A. An Inquiry into the Nature and Causes of the Wealth of Nations, 1st ed.; Cannan, E., Ed.; Methuen: London, UK, 1776; Volume 1, Available online: http://hdl.handle.net/1842/1455 (accessed on 12 December 2024).
  20. Young, A.A. Increasing returns and economic progress. Econ. J. 1928, 38, 527–542. [Google Scholar] [CrossRef]
  21. Schultz, T.W. Transforming Traditional Agriculture.; Yale University Press: New Haven, CT, USA, 1964; p. xiv + 212. [Google Scholar] [CrossRef]
  22. Zhu, M.; Zhang, Q. Agricultural productive services and grain production resilience: Influencing mechanisms and empirical tests. J. Hunan Agric. Univ. (Soc. Sci.) 2024, 25, 1–11. [Google Scholar] [CrossRef]
  23. Coase, R.H. The Nature of the Firm. Economica 1937, 4, 386–405. [Google Scholar] [CrossRef]
  24. Chen, T.; Rizwan, M.; Abbas, A. Exploring the role of agricultural services in production efficiency in Chinese agriculture: A case of the socialized agricultural service system. Land. 2022, 11, 347. [Google Scholar] [CrossRef]
  25. Huan, M.; Dai, Y. Mechanization Services, Technology Introduction and Technical Efficiency in China’s Grains Production. Commer. Res. 2023, 2, 145–152. [Google Scholar] [CrossRef]
  26. Xia, B.; Jiang, N. Do large grain growers need socialized agricultural services? Based on a survey of 264 sample farmers in Yangzhou, Jiangsu Province. J. Agrotech. Econ. 2016, 8, 15–24. [Google Scholar] [CrossRef]
  27. Chen, C.; Li, Y.; Liao, X. Productivity effects of rice production outsourcing: Based on panel data of three counties in Jiangsu Province. Chin. Rural. Econ. 2012, 2, 86–96. [Google Scholar] [CrossRef]
  28. Andersen, P.; Petersen, N.C. A procedure for ranking efficient units in data envelopment analysis. Manag. Sci. 1993, 39, 1261–1264. [Google Scholar] [CrossRef]
  29. Zhu, J. Super-efficiency and DEA sensitivity analysis. Eur. J. Oper. Res. 2001, 129, 443–455. [Google Scholar] [CrossRef]
  30. Hansen, B.E. Threshold effects in non-dynamic panels: Estimation, testing, and inference. J. Econom. 1999, 93, 345–368. [Google Scholar] [CrossRef]
  31. Xu, K.; Yi, X.; Zhou, L. Impacts of agricultural production services on green grain production efficiency: Factors allocation perspective. J. Environ. Manag. 2025, 380, 125136. [Google Scholar] [CrossRef]
  32. Wang, B.; Hu, D.; He, X. The Impact of Heterogeneity of Capital Endowment on Agricultural Production Efficiency—Based on the Transaction Cost Perspective of Social Services. J. Northwest AF Univ. (Soc. Sci. Ed.) 2024, 24, 119–130. [Google Scholar] [CrossRef]
  33. Gai, Q.; Li, C.; Zhang, W.; Shi, Q. From Smallholders to Large-scale Farmers: Land Rental and Agricultural Productivity. Econ. Res. J. 2023, 58, 135–152. Available online: https://erj.ajcass.com/#/issue?id=109039&year=2023&issue=5 (accessed on 2 May 2025).
Figure 1. Framework for the influence of agricultural productive services on farmers’ GPE.
Sustainability 17 06054 g001
Figure 2. Overview map of the research areas in China. Note: The base map was produced using the standard map of the Ministry of Natural Resources (Review No.GS (2024)0650), and there are no modifications to the base map.
Sustainability 17 06054 g002
Table 1. Variable selection and descriptive statistics.
Variable TypeVariable NameVariable DescriptionMeanSD
Dependent VariableFarmers’ GPECalculated using the super-efficiency DEA model0.4050.181
Core Explanatory VariablesAPSAgricultural production service costs/total cost of agricultural production0.2510.183
Control
Variables
Characteristics of production decision-makersAGEAge of farmers (years)59.64810.560
EDUYears of education (years)7.7153.723
POSHold a position in the village?
1 = Yes, 0 = No
0.1450.352
Characteristics of agricultural productionPLFoff-farm income/farmers’ total income0.0710.225
ALPAAverage plot area (hm2/plot)0.3950.582
DSAffected by disaster? 1 = Yes, 0 = No0.4950.500
PFCJoined the farmers’ cooperative? 1 = Yes, 0 = No0.1850.388
Data source: Compiled by the author based on the CRRS database “-“.
Table 2. Farmers’ GPE.
Type of FarmerAverageSD
All farmers0.4050.181
Smallholder farmers0.3910.156
Large-scale farmers0.4400.228
Data source: Compiled by the author based on the CRRS database.
Table 3. Model estimation results for the impact of APS on farmers’ GPE.
VariableDependent Variable: Farmers’ GPE
Result 1
All Farmers
Result 2
Smallholder Farmers
Result 3
Large-Scale Farmers
CoefficientCoefficientCoefficient
APS0.116 ***0.099 ***0.020
(0.038)(0.037)(0.119)
AGE−0.014 **−0.002−0.028 *
(0.007)(0.006)(0.016)
EDU0.0040.036 ***−0.121 **
(0.019)(0.014)(0.054)
POS0.033 *−0.0050.115 ***
(0.020)(0.021)(0.038)
PLF−0.038 *−0.016−0.124 *
(0.021)(0.021)(0.072)
ALPA0.047 ***0.239 ***−0.009
(0.014)(0.053)(0.019)
DS−0.084 ***−0.082 ***−0.126 ***
(0.013)(0.013)(0.038)
PFC−0.0010.014−0.035
(0.017)(0.018)(0.032)
constant0.479 ***0.354 ***0.780 ***
(0.048)(0.046)(0.110)
Note: ***, **, and * indicate significance at the 1%, 5%, and 10% levels, respectively. Robust standard errors are shown in parentheses.
Table 4. Model estimation results for the impact of LIS on farmers’ GPE.
VariableDependent Variable: Farmers’ GPE
Result 4
All Farmers
Result 5
Smallholder Farmers
Result 6
Large-Scale Farmers
CoefficientCoefficientCoefficient
LIS0.107 ***0.088 **0.035
(0.039)(0.038)(0.124)
AGE−0.014 **−0.002−0.028 *
(0.007)(0.006)(0.016)
EDU0.0040.037 ***−0.121 **
(0.019)(0.014)(0.054)
POS0.034 *−0.0040.115 ***
(0.020)(0.021)(0.038)
PLF−0.038 *−0.015−0.123 *
(0.021)(0.021)(0.072)
ALPA0.047 ***0.246 ***−0.008
(0.014)(0.054)(0.019)
DS−0.085 ***−0.083 ***−0.127 ***
(0.013)(0.013)(0.038)
PFC0.0030.016−0.035
(0.172)(0.018)(0.032)
constant0.479 ***0.354 ***0.777 ***
(0.048)(0.046)(0.110)
Note: ***, **, and * indicate significance at the 1%, 5%, and 10% levels, respectively. Robust standard errors are shown in parentheses.
Table 5. Model estimation results for the effect of TIS on farmers’ GPE.
VariableDependent Variable: Farmers’ GPE
Result 7
All Farmers
Result 8
Smallholder Farmers
Result 9
Large-Scale Farmers
CoefficientCoefficientCoefficient
TIS0.381 *0.347−0.138
(0.204)(0.214)(0.359)
AGE−0.011 *0.001−0.027 *
(0.006)(0.007)(0.016)
EDU0.0060.039 ***−0.122 **
(0.018)(0.014)(0.054)
POS0.031−0.0070.116 ***
(0.020)(0.021)(0.038)
PLF−0.035−0.012−0.128 *
(0.022)(0.022)(0.072)
ALPA0.043 ***0.247 ***−0.010
(0.014)(0.053)(0.018)
DS−0.087 ***−0.085 ***−0.127 ***
(0.013)(0.013)(0.037)
PFC−0.0020.013−0.034
(0.017)(0.017)(0.032)
constant0.487 ***0.357 ***0.782 ***
(0.048)(0.046)(0.113)
Note: ***, **, and * are significant at the 1%, 5%, and 10% levels, respectively. Robust standard errors are shown in parentheses.
Table 6. Threshold effect test results.
Explained VariableThreshold VariableProvinceType of Inspectionp-ValueThreshold Value and Confidence IntervalThreshold Value RangeResult
Estimated Value95%
Confidence Interval
Farmers’ GPEFarmers’ operating scaleAll
Provinces
single threshold0.005.67[2, 5.81]Farmers’ operating scale ≤ 5.670.137 **
(0.058)
double threshold0.321--Farmers’ operating scale > 5.670.197
(0.229)
Heilongjiang
Province
single threshold0.724---0.292 **
(0.131)
Shandong
Province
single threshold0.0230.43[0.43, 0.8]Farmers’ operating scale ≤ 0.43−0.239 **
(0.109)
double threshold0.738--Farmers’ operating scale > 0.430.453 **
(0.186)
Anhui
Province
single threshold0.0210.81[0.77, 1.04]Farmers’ operating scale ≤ 0.810.054
(0.075)
double threshold0.93--Farmers’ operating scale > 0.810.307
(0.197)
Sichuan
Province
single threshold0.0370.39[0.33, 0.45]Farmers’ operating scale ≤ 0.390.176 ***
(0.067)
double threshold0.263--Farmers’ operating scale > 0.390.237 **
(0.103)
Note: ***, and ** indicate significance at the 1%, and 5% levels, respectively. Robust standard errors are shown in parentheses. The “-” symbol in the table indicates that no data is displayed there.
Table 7. Robustness test.
VariableTest 1Test 2
All
Farmers
Smallholder FarmersLarge-Scale FarmersAll
Farmers
Smallholder FarmersLarge-Scale Farmers
CoefficientCoefficientCoefficientCoefficientCoefficientCoefficient
APS0.115 ***0.098 ***0.010
Replaced APS 0.096 ***0.069 **0.029
Control
Variables
Under controlUnder control
Note: ***, and ** are significant at the 1%, and 5% levels, respectively.
Disclaimer/Publisher’s Note: The statements, opinions and data contained in all publications are solely those of the individual author(s) and contributor(s) and not of MDPI and/or the editor(s). MDPI and/or the editor(s) disclaim responsibility for any injury to people or property resulting from any ideas, methods, instructions or products referred to in the content.

