Article

Evaluation of Dynamic Efficiency and Influencing Factors of China’s Mining-Land Restoration System

1
College of National Parks and Tourism, Central South University of Forestry and Technology, Changsha 410004, China
2
Hunan Provincial Institute of Land and Resources Planning, Changsha 410004, China
*
Author to whom correspondence should be addressed.
Sustainability 2025, 17(13), 6052; https://doi.org/10.3390/su17136052
Submission received: 24 May 2025 / Revised: 25 June 2025 / Accepted: 26 June 2025 / Published: 2 July 2025

Abstract

Land degradation neutrality is crucial for sustainable mining, necessitating a comprehensive assessment of mining and land restoration performance. Current assessments of mining development and land degradation neutrality are isolated. Therefore, this study formulated a comprehensive framework for economic development and land governance, integrating a Dynamic Network Directional Distance Function (DDF) model with structural equation modeling (SEM), using China’s mining development and land restoration governance as a case study, to evaluate the efficiency and its determinants of mining and land restoration systems. The findings are as follows: there are significant regional differences in mining efficiency; the overall land restoration efficiency is higher than mining efficiency; the development of the two stages is unbalanced, and there is no obvious linear correlation between efficiencies; policy and economic factors negatively impact both mining and land restoration efficiency; technological innovation strongly boosts mining efficiency but has a weaker effect on land restoration efficiency; and climate factors slightly hinder land restoration and mildly enhance mining. Therefore, comprehensively analyzing the mining-land restoration system and considering exogenous factors to internalize externalities are crucial for promoting ecological protection, achieving the LDN target in mining areas, and realizing harmonious human-nature development in China.

1. Introduction

Mining acts as a crucial pillar for economic growth in numerous countries and regions. Especially with the rapid development of new energy vehicles and related industries, the demand for certain key mineral resources has surged dramatically. Meanwhile, mining activities can impose multiple potential impacts on the ecological environment, which has triggered extensive international controversy. Against the backdrop of the in-depth advancement of the sustainability concept, the connotation of mining activities has transcended the purely economic realm. With the global enhancement of environmental awareness, the construction of green mines has become an inevitable trend in industry development. Media reports and advocacy by environmental organizations have also continuously heightened public attention to mining. The urgent need for ecological protection has prompted the industry to explore innovative pathways within the sustainable development framework. The United Nations’ 17 Sustainable Development Goals (SDGs) have charted the course for the mining sector. For instance, circular waste management technologies integrate industrial wastes such as metallurgical tailings into closed-loop production. Through the “waste-to-resource” conversion model, these technologies reduce ecological encroachment, respond to green mine construction with efficient resource utilization, and promote mining to practice sustainable development in balancing economic and ecological imperatives [1]. Therefore, mining and its disturbance effects on ecosystems have long been a focus of widespread concern.
The impact of mining is multifaceted [2,3]. Opencast mining results in the destruction of vegetation and leaves large areas of land as barren wasteland. The original natural landscape is replaced by opencast mining pits and overburden dumps. Due to soil degradation and environmental pollution in these areas, vegetation recovery is difficult. Underground mining causes changes in geological structures and results in subsidence. Subsidence alters the surface hydrological system, which may lead to flooding and drainage problems. Moreover, the soil structure and fertility in the subsidence areas are severely affected, further hindering vegetation growth and ecological restoration. Subsidence can also damage infrastructure such as the transport network, settlements, and railway lines, increasing the risk of geological disasters. Abandoned coal piles and exposed underground coal seams can lead to fires. The harmful gases released from fires, such as sulfur dioxide and carbon monoxide, cause serious air pollution and pose a threat to residents’ health. At the same time, the high temperature combustion also raises the surface temperature, further destroying the soil and vegetation [4,5,6]. The impact of mining on water resources cannot be ignored [7]. Mining requires substantial dewatering to keep the mining pits dry, which leads to a decline in the groundwater level in surrounding areas. Chemicals used in mining, such as mercury and cyanide, along with waste rock and tailings generated by mining, infiltrate groundwater and surface water bodies, causing heavy metal pollution. This affects the survival of aquatic organisms. Moreover, these polluted water resources are used for agricultural irrigation or directly consumed by local residents, posing serious threats to ecosystems and human health. Mining also occupies a large amount of farmland. To compensate for the shortage of farmland, farmers are forced to clear new farmland in forests, resulting in further deforestation and exacerbating ecosystem degradation [8]. Therefore, practical measures need to be taken to avoid or reduce the occurrence of degradation.
Sheoran et al. believe that reclamation is a method of treating or restoring degraded land to improve the normal interactions between biotic and abiotic factors in its ecosystem [9]. Rocha-Nicoleite et al. believe that in land restoration planning for mining areas, priority should be given to addressing ecological degradation caused by mining [10]. In 2015, the United Nations Convention on the Prevention of Desertification (UNCCD) proposed the land degradation neutrality (LDN) goal and was part of Target 15.3. Yu et al. considered the role of prevention and control measures on land ecology recovery, and through effective control, such as avoiding degradation, reducing degradation, and restoration measures, it is possible to achieve “net zero growth” in land degradation, and the realistic problem that the “zero degradation” goal is difficult to achieve, and understands LDN as “land degradation balance” [11]. LDN is a land degradation prevention and control process with the goal of achieving “net zero growth” and “balance” as the means. LDN is a new implementation mechanism and measurement standard. In terms of recovery, we must pursue the dynamic balance between degradation and recovery on a specific spatial and temporal scale; in terms of function, we must fully consider suitability, self-stability, and sustainability so that the restored ecosystem can withstand the consideration and test of time; in terms of role, we cannot only pursue filling the depressions of land degradation but also take into account the multiple values and marginal benefits that can be generated, such as ecological, economic, and social [12]. To achieve this balance, we must take into account the balance between social and economic development and resource endowment, resource development and utilization and ecological protection, land space pattern and industrial layout, manual guidance and natural restoration, as well as the interaction between four pairs of balances [13].
Since the 18th National Congress of the Communist Party of China, China has kept pace with the times and taken a global perspective. It has assumed the responsibilities and demonstrated the commitment of a major country, achieving a significant transformation from being a participant to a leader in global environmental governance. “Polluters should bear the responsibility for remediation” is one of the fundamental environmental policies that China has long adhered to. However, as public goods, mining areas are highly non-excludable. This means that while the benefits of land restoration in mining areas are widespread, it is challenging to clearly define responsible parties. Both enterprises and local governments may shirk responsibility due to free-rider mentality. On the other hand, the restored land struggles to generate exclusive returns for investors. Investors expend significant human and material resources but often fail to directly profit from the restoration project, leading to low social capital participation. With the advancement of market—oriented environmental governance reforms, the policy of “polluters should bear the responsibility for remediation” is increasingly being implemented as the “the polluter pays principle” model. That is, through payment, pollution control is handed over to professional companies to complete. This approach achieves pollution control intensification and the internalization of environmental externalities. It imposes constraints on enterprises, requiring them to incorporate environmental pollution control costs into their production and management processes. When calculating total benefits, these costs must be deducted to achieve a comprehensive improvement in social, environmental, and economic benefits. Therefore, effectively improving and resolving the land destruction caused by mining while pursuing mining efficiency and focusing on environmental protection and deeply exploring the relationship between mining and land restoration are extremely necessary for promoting the high-quality development of China’s mining industry and achieving the land degradation neutrality (LDN) goal in mining areas.
Most existing studies on mining and damaged land mainly include the following three perspectives: mining and land destruction, land restoration, and comprehensive management of mining and land restoration.

1.1. Mining and Impact

Venkateswarlu et al. summarized the global distribution of Abandoned Metal Mines (AMLs), including in Africa, Asia, Australia, Europe, and the Americas. They analyzed the impacts of AMLs. For example, mining activities damage soil structures, and large amounts of heavy metals and acid mine drainage (AMD) enter nearby soils and water bodies, threatening human health, altering soil physical and chemical properties, and reducing biodiversity in surrounding areas, and the huge funds for remediation and management increase the economic burden on local governments and communities. They also discussed various remediation methods for AMLs, such as emerging remediation technologies such as transgenic plants and nanotechnology [14]. Bhuiyan et al. analyzed the concentrations of heavy metals in agricultural soil samples around the Barapukuria coal mine in northern Bangladesh. They measured the pH and electrical conductivity (EC) of soil samples using a pH meter and a conductivity meter, respectively, and determined the total organic carbon content (TOC) by titration. Elemental contents in soils were analyzed by energy-dispersive X-ray fluorescence spectroscopy (EDXRF). Soil pollution levels were evaluated using indices such as Enrichment Factor (EF), geoaccumulation index (Igeo), and Pollution Load Index (PLI). Multivariate statistical methods, including principal component analysis (PCA) and cluster analysis (CA), were employed to infer the sources of heavy metals. The study found that the average concentrations of Ti, Mn, Zn, Pb, As, Fe, Rb, Sr, Nb, and Zr in soils exceeded global average levels, and the pollution of multiple elements originated from activities such as coal mining and mine drainage [15].
Li et al. employed a multiple linear regression model to analyze the relationship between coal development and economic growth, using data from 1997 to 2010 and indicators, including raw coal output (RCO), gross value of coal industrial output (GCIOV), new investment in fixed assets of coal (CFANI), gross domestic product (GDP), and gross value of industrial output (GIOV). Additionally, based on 2010 data and indicators such as wastewater (WW), waste gas (WG), waste residues (WR), crop loss (CL), land resource (LR) damage, and soil deterioration (SD), the study used an environmental damage cost model to measure environmental losses from coal mining and washing. The results show that coal development has promoted China’s economic growth to a certain extent. Meanwhile, the total environmental loss from coal mining and washing in 2010 was approximately 65.607 billion RMB, accounting for 0.16% of GDP [16]. Razo et al. evaluated the environmental impact of mining through chemical analysis, X-ray diffraction analysis, and principal component analysis (PCA) on samples from a mining area in Mexico. The study revealed severe pollution of arsenic and heavy metals in water, soil, and sediments in the region. The pollution primarily originates from tailings impoundments, waste rock dumps, and slag piles, with dispersion mainly linked to fluvial transportation via streams and aeolian (wind-driven) transportation of mineral particles [17].
Du et al. determined cadmium concentrations in soil and plant samples using Graphite Furnace Atomic Absorption Spectrometry (GF-AAS) in Y County, a mining-developed area in Hunan Province, and evaluated health risks from cadmium intake via rice consumption by calculating Daily Intake (DI) and Target Hazard Quotient (THQ). The results showed that 57.5% of paddy soil samples in Y County exceeded the Chinese Soil Environmental Quality Standard limit (0.30 mg/kg). In rice grains, 59.6% of samples exceeded the Chinese Food Safety Standard limit (0.20 mg/kg), and 11.1% had cadmium levels exceeding 1 mg/kg (termed “Cd-contaminated rice”). Both DI and THQ values were higher than the regulatory limits, indicating a high health risk [18]. Li et al. measured total mercury (T-Hg) concentrations in mine waste, stream water, soil, and moss samples using Cold Vapor Atomic Absorption Spectrometry (CVAAS), dual-stage gold amalgamation, and Cold Vapor Atomic Fluorescence Spectrometry (CVAFS) to assess the potential environmental impacts of artisanal mercury mining. Results showed that T-Hg concentrations in all sample types exceeded background levels. Surface soil exhibited significantly higher T-Hg concentrations than deeper soil layers, indicating that atmospheric deposition is the primary source of mercury contamination [19].
Li et al. systematically reviewed relevant literature from 2005 to 2012, collected data from 72 mining areas, and used the geoaccumulation index to assess heavy metal pollution levels in the environment. Results showed that soil heavy metal concentrations in all mining areas exceeded China’s soil background values. Human health risks were evaluated by quantifying non-carcinogenic risks using the Hazard Quotient (HQ) and carcinogenic risks using probability (Risk). Except for coal mining areas, health risk indices (HI) for six other types of mining areas all exceeded 1, indicating non-carcinogenic health risks to surrounding residents. Most mining areas had As carcinogenic risk values higher than 1 × 10⁻⁵, with these risk levels being unacceptable or nearly unacceptable [20]. Acosta et al. studied two tailing ponds (Lirio and Gorguel) in Spain, analyzing soil properties and heavy metal contents in samples. Using correlation matrices and principal component analysis (PCA), they analyzed the relationships between heavy metals and soil properties. Results showed that both tailing ponds were contaminated by heavy metals, and the polluted soil could even infiltrate groundwater, causing severe environmental pollution [21]. Simón et al. conducted a detailed study on the soil pollution caused by the collapse of a pyrite mine tailings pond in Aznalcollar, Spain, on April 25, 1998. Elemental contents were determined by ICP-MS, revealing the main pollutants in the area as Zn, Pb, Cu, As, Sb, Cd, Bi, and Tl. As the tailings dried and oxidized, sulfides were oxidized to sulfates, increasing the solubility of pollutants. However, rainfall would further exacerbate the pollution [22].
Wang et al. measured the pH, total organic carbon (TOC), and cation exchange capacity (CEC) of 29 soil samples from the Xikuangshan antimony mine area near Lengshuijiang City, Hunan Province. Heavy metal contents were determined using various spectroscopic techniques (ICP-MS, AFS-2202, ICP-AES). Hierarchical cluster analysis (HCA) and principal component analysis (PCA) were employed to identify pollution sources, while Pollution Index (PI) and Integrated Pollution Index (IPI) were calculated to assess soil contamination levels. Results showed that concentrations of all ten heavy metals significantly exceeded their natural background values. Enrichment factor (EF) and PI calculations indicated the highest EF value for Sb, with PI values demonstrating severe soil contamination [23]. Equeenuddin et al. conducted a detailed study on the hydrogeochemical characteristics of acid mine drainage (AMD) and its pollution impacts on local creeks, rivers, and groundwater in the Makum Coalfield, India, through field sampling, laboratory analysis, and geochemical modeling. Results show significant pollution impacts of AMD on local water bodies, particularly severe on creeks and groundwater [24].

1.2. Land Restoration

Andrés et al. evaluated four post-mining restoration treatments using biological indicators—soil mesofaunal communities: simple soil spreading, soil spreading + herb sowing, soil spreading + tree planting, and soil spreading + sowing + planting. After 12 years of restoration, none of the treatments fully restored the pre-mining forest soil conditions [25]. Hilson critically analyzed current research and policy approaches to address mercury pollution in small-scale gold mining, revealing that despite multiple educational programs to inform gold miners about the environmental and health impacts of mercury, these efforts have been ineffective. Additionally, mercury reduction technologies implemented in small-scale gold mines have not been widely adopted [26]. Macías et al. introduced a multi-step passive remediation system comprising a Natural Fe-Oxidizing Lagoon (NFOL), limestone-based Dispersed Alkaline Substrate (DAS), and magnesium hydroxide-based Dispersed Alkaline Substrate (MgO-DAS), which successfully transformed zinc-rich acid mine drainage (AMD) into non-metallic water for metal pollution remediation. The success of this pilot project provides a reference for applying this technology in other AMD-contaminated areas [27].
Chen proposed two methods of mining pollution control by analyzing the distribution of metal mine resources in my country. The first is to control tailings pollution from the source to ensure the deep treatment of the ore slurry during the ore dressing process; the second is to use physical, chemical, and phytorepair technologies to repair the pollution situation, thereby achieving sustainable development of the mining area [28]. Akcil and Koldas conducted a detailed analysis of the causes of acid mine drainage (AMD) and proposed three primary AMD governance strategies: primary prevention, secondary control, and tertiary control. These strategies involve preventing the occurrence of acid generation processes, preventing the migration of acidic drainage, and collecting and treating contaminated water. Meanwhile, treatment methods such as neutralization treatment, biological/natural degradation, water cover, wetland treatment, and ion exchange resin treatment were discussed [29]. Zhang et al. conducted a comprehensive environmental impact analysis of the entire opencast coal mine production process, including the land reclamation stage, using the Life Cycle Assessment (LCA) method. Results show that dust is the most severe environmental impact category, with a contribution rate of 36.81%. The study recommends implementing economically feasible measures to mitigate environmental impacts from opencast coal mine production, such as water spraying for dust control, clean transportation, improving processing efficiency, and advancing mining technologies [30].
Based on the completion criteria and vegetation data, Grant constructed a State-and-Transition Successional Model to identify whether the rehabilitation areas are on the desired successional trajectory. The model identified five desired successional states (S1-S5) and nine deviated states (D1-D9) and described the characteristics and transition factors of these states in detail. It was found that from 1991 to 2002, a total of 6429 hectares of native species rehabilitation areas were developed, and 98% of them were on or above the desired successional trajectory [31]. Lei et al. proposed a multi-objective integration approach based on landscape planning. The principles and technologies of ecological restoration and landscape ecology are applied in the process of ecological restoration in mining areas to achieve ecological restoration and sustainable development of mining areas [32]. Neri and Sanchez introduced a procedure to evaluate environmental rehabilitation practices in limestone quarries and validated its effectiveness through applications in nine limestone quarries in southeastern Brazil. The results showed that most quarries generally performed unsatisfactorily in planning practices, operational practices, and management practices [33]. Doley et al. proposed a model that identifies differences in ecological functions under different rehabilitation pathways and provides scientific, flexible, and sustainable solutions for rehabilitation through scenario analysis, landscape suitability assessment, flexibility of ecosystem functions, and dynamic goal adjustment [34]. Anawar et al. studied the adaptability, tolerance, and evolution of vegetation in the abandoned São Domingos copper sulfide mine area in Portugal, as well as the responses of these plant communities to contamination levels and tailings properties caused by mining. The study found that proper soil development can promote vegetation growth, mine rehabilitation, and ecological restoration; selecting specific native plant species for vegetation restoration and soil stabilization is feasible [35].

1.3. Comprehensive Management of Mining and Land Restoration

Song et al. decomposed the production chain of coal enterprises into production processes and pollution treatment processes, established an SBM model to evaluate the comprehensive efficiency of production and pollution treatment processes of Chinese coal enterprises, and analyzed the input redundancy and output deficiency of enterprises, providing improvement directions for enterprises [36]. Liu et al. constructed three indicators—operational efficiency, environmental efficiency, and unified efficiency—using the Range-Adjusted Measure (RAM) model within the data envelopment analysis (DEA) framework. They analyzed the efficiency changes in the coal industry consolidation policies of Shanxi Province and Inner Mongolia Autonomous Region during 2005–2012 to evaluate the sustainability impacts of the consolidation policies. The results show that although the consolidation policies had a negative impact on productivity in the short term, closing small coal mines and encouraging mergers may improve the environmental efficiency of the industry in the long term. Market mechanisms play a significant role in the efficient allocation of resources, and pure nationalization is not the optimal approach to achieve sustainable development [37]. Wang et al. studied the diversity of Mineral Resources Carrying Capacity (MRCC) in Chinese mining cities, constructing an evaluation index system for MRCC from four dimensions—economy, society, potential, and environment—with seven indicators selected. Evaluations were conducted on 21 typical Chinese mining cities. The results show that MRCC is stronger in central and western mining cities, as well as growing mining cities, which have significant potential in the mining industry. Mining development in mature and growing mining cities is relatively stable or favorable, with higher contributions to employment and the economy. Regenerating mining cities have achieved industrial transformation, demonstrating better economic scale and guarantee periods. However, contradictions exist between mineral resource exploitation and the environment in western and growing mining cities [38].
Li et al. employed a modified dynamic DEA-SBM model to evaluate coal production efficiency and land destruction efficiency, with coal industry employees as input, GDP as the desirable output, land destruction as the undesirable output, and fixed assets in the coal industry as the carryover variable. By considering time factors, this model can observe the changes in coal production and land destruction over time. The results show that seven provinces including, Shanxi, Inner Mongolia, Fujian, Jiangxi, Shandong, Guizhou, and Shaanxi, had an overall efficiency of 1 over six years and required no further improvement; 17 provinces needed improvement, with the need for improvement increasing in 15 of these provinces [39]. Wang et al. utilized the Range-Adjusted Measure (RAM) based on data envelopment analysis (DEA) to evaluate China’s regional energy and environmental efficiency from 2006 to 2010. They analyzed the types of Returns to Scale (RTS) and Damages to Scale (DTS) in different regions and explored the energy conservation and CO2 emission reduction potentials across China. The results show that Beijing, Shanghai, and Guangdong had the highest integrated energy and environmental efficiency, serving as benchmarks for other regions; the eastern region exhibited the highest integrated efficiency under natural disposability, while the western region performed best under managerial disposability; China’s average production efficiency slightly decreased, whereas emission efficiency began to increase in the later study period; most regions showed decreasing returns to scale or increasing damages to scale; by 2010, China still had substantial potential for energy conservation and CO2 emission reduction [40]. Starting from the perspective of climate change, Shi et al. applied a dynamic two-stage directional distance function data envelopment analysis (DEA) model to comprehensively analyze the two stages of mining production and land reclamation in 29 provinces of China. The research results show that the overall efficiency of mining production and land reclamation in most provinces of China fluctuates around 0.5, which indicates a large room for improvement. The efficiency in the mining production stage is relatively stable, while the efficiency in the land reclamation stage is generally higher than that in the mining production stage. However, there are significant differences in the land reclamation efficiency of some provinces, and it is still necessary to improve the overall efficiency level [41].
Thus, in the field of mining research, traditional academic perspectives often treat mining operations and mining-damaged land restoration as independent systems. Some studies focus on analyzing the externalities of mining activities, such as topographical changes caused by resource extraction, intensified soil erosion, groundwater system damage, and soil pollution and ecological degradation induced by tailings stacking; another part of the research focuses on land restoration technologies, including engineering and biological measures such as vegetation reconstruction and terrain reshaping. However, in actual production, mining and land restoration are not isolated but form a dynamically linked whole. During the mining process, the choice of mining method (such as open-pit or underground mining) directly determines the type and degree of land damage. Vibration from blasting operations may cause surface collapse, while waste rock discharge occupies and damages a large amount of land, and these damage conditions in turn affect the safety and sustainability of subsequent mining activities. At the same time, land rehabilitation plans need to consider mining planning—for example, reserving restoration areas in advance and reasonably designing the slope of waste dumps to reduce the difficulty of later restoration; the condition of restored land also provides a reference for new rounds of mining decisions, such as areas with good vegetation recovery can be used as temporary transport routes, and soil fertility data after restoration can guide the resource utilization of mining waste. This two-way interaction indicates that only by treating mining and land restoration as an organic whole can the collaborative development of resource development and ecological protection be achieved.
In terms of research methods, some studies treat the entire process of mining and land restoration as a “black box”, only focusing on inputs and outputs, namely mining activities and restoration outcomes, but ignoring the analysis of how land damage caused by mining affects land restoration. This leads to difficulties in excavating the essential laws of system operation. Other studies, although regarding the two as a system, only consider internal influencing factors without incorporating external factors into the scope of consideration. For example, the emergence of new technologies may optimize the collaborative model of mining and restoration. This makes the research results seriously divorced from actual production, unable to provide effective guidance for the collaborative practice of mining activities and land restoration, and ultimately difficult to achieve the balanced development of resource development and ecological protection.
Although some studies recognize the impact of external factors on the mining and land restoration system and attempt to incorporate them into analysis, there are still obvious limitations in indicator selection. For instance, they only focus on climatic factors such as the influence of temperature while failing to include key elements such as socioeconomic factors and scientific and technological levels in the research scope. Additionally, these studies generally lack the distinction between endogenous and exogenous variables, confusing the two. In research models, exogenous and endogenous variables are treated as constraint conditions simultaneously, which makes it impossible to effectively reveal the causal relationships among various factors, thereby affecting the guiding value of research conclusions for actual production practices.
Therefore, from a systematic perspective, applying a dynamic network model and comprehensively considering external influencing factors to evaluate the efficiency of China’s mining-land rehabilitation system is of great significance for land degradation neutrality (LDN).

2. Model and Data

2.1. Model Selection

The Data Envelope Analysis (DEA) method was first proposed by Charnes, Cooper and Rhodes in 1978. It is a non-parametric efficiency evaluation method used to evaluate the productivity and performance of multi-input and multi-output problems. In DEA, each organization or individual is regarded as a decision-making unit, and each decision-making unit has a series of inputs and outputs. The DEA model evaluates how these decision-making units effectively convert inputs into outputs through the amount of outputs generated by the decision-making unit under a given input. After the proposed model, it will be widely used in various fields, including education, medical care, finance and manufacturing.
The traditional DEA model can only examine the efficiency of a specific period and treats the production process as a “black box”, where only the initial inputs and final outputs are known, while the intermediate processes remain unclear. Therefore, to explore the specific production process, multistage DEA models have emerged. For example, the two-stage DEA model proposed by Chen and Zhu [42]. The model achieves this objective by introducing an optimal intermediate output. However, it treats the production process as a closed system, meaning that the intermediate outputs generated in the first stage must be fully utilized as inputs in the second stage, and the inputs required for the second stage must be entirely derived from the first stage (i.e., intermediate outputs). In practical problems, the outputs of the first stage include both desirable and undesirable outputs, with only the desirable ones typically serving as inputs for the second stage. Additionally, the inputs required for the second stage often originate not solely from the first stage’s outputs—for example, additional investments may be injected.
Based on this, scholars have continuously improved the model by considering the undesirable outputs in the first stage and the additional inputs in the second stage to make it more comprehensive. For example, part of the outputs in the first stage can be used as inputs in the second stage (i.e., desirable outputs), while the other part has no role in the second stage (i.e., undesirable outputs). Alternatively, the inputs required for the second stage not only come from the intermediate outputs of the first stage but also require additional external inputs (i.e., supplementary investments). These two scenarios treat the production process as a semi-open system. This study refers to the concept of the dynamic two-stage DEA model, integrates the aforementioned two models, and regards the production process as a fully open system: the first stage includes both desirable and undesirable outputs, and the second stage requires not only the outputs of the first stage but also external inputs. Meanwhile, it considers the impact of exogenous variables such as climate change on the efficiency of mining production and land restoration and employs the combined model DDF-SEM.

2.2. Model Construction and Model Formulation

2.2.1. Dynamic Network DDF Model

According to the model, a schematic diagram of the model variables is shown in Figure 1.
Max t = 1 T V t ( W 1 t θ 1 t + W 2 t θ 2 t )
S.T. is the constraints:
j = 1 n λ j t X ij t θ 1 t X ip t i   t
j = 1 n λ j t Z dj t θ 1 t Z dp t d   t
j = 1 n λ j t q kj t θ 1 t q kp t k   t
j = 1 n λ j t = 1   t
λ j t 0   j   t
j = 1 n μ j t Z dj t θ 2 t Z dp t d   t
j = 1 n μ j t W gj t θ 2 t W gp t g   t
j = 1 n μ j t y rj t θ 2 t y rp t r   t
j = 1 n μ j t = 1   t
μ j t 0   j   t
Z d j t (d = 1, ...D) is the link variable between the two stages (destruction of land area);
X i j t (i = 1, ...I) is the input of the mining stage (mining employees);
q k j t (k = 1, ...K) is the output of the mining stage (production of non-petroleum mineral resources);
W g j t (g = 1, ...G) is the additional input of the land restoration stage (restoration investment);
y r j t (i = 1, ...I) is the output of the land restoration stage (restoration of land area);
λ j and μ j ,   respectively, represent the weights of the evaluated decision-making units in the first and second stages, and θ 1 and θ 2 , respectively, represent the efficiency scores in the first and second stages. C h j t is carryover (fixed asset investment).

2.2.2. PLS-SEM

Structural equation modeling is used to identify the influencing factors of efficiency. We adopted the partial least squares structural equation modeling (PLS-SEM). Compared with covariance-based structural equation modeling (CB-SEM), it features broader applicability, stronger processing capability for complex models, a simple and practical algorithm, strong data robustness, and great flexibility. The following three are the characteristic parameters of the model.
The factor loading is the partial regression coefficient obtained by performing regression analysis of the latent variable on the observed variable. The specific formula is:
η i = j = 1 k γ i j X i j + ζ i
η i is the i-th latent variable;
X i j is the j-th observed variable of the i-th latent variable;
γ i j is the partial regression coefficient of the j-th observed variable on the latent variable and η i , i.e., is the factor loading;
ζ i is the error term.
In PLS-SEM, the average variance extracted (AVE) is used to measure the extent to which a latent variable explains its observed variables. The formula for its calculation is:
AVE = 1 n i = 1 n λ i 2
λ i is the standardized factor loading of the i-th observed variable;
N is the number of observed variables associated with a latent variable.
In PLS-SEM, the formula for heterotrait-monotrait ratio (HTMT) calculation is:
H T M T i j = 1 K i K j g = 1 K i h = 1 K j r g , h 2 K i ( K i 1 ) g = 1 K i 1 h = g + 1 K i r i j , i 2 K j ( K j 1 ) g = 1 K j 1 h = g + 1 K j r j j , i
H T M T i j : the HTMT value between construct i and construct j;
K i , K j , respectively, denote the number of indicators belonging to construct i and construct j;
r g , h is the correlation coefficient between the g-th indicator of construct i and the h-th indicator of construct j;
r i j , i is the correlation coefficients among the indicators of construct i;
r j j , i is the correlation coefficients among the indicators of construct j.

2.3. Variable Selection

In the production function, labor, capital, and land are the most fundamental factors. Mining, as a secondary industry, and land restoration, as a tertiary industry, form a system whose operation always revolves around these factors. So we can select indicators such as mining employees, restoration investment, fixed assets’ investment, and restoration of land area from the three dimensions of labor force, capital input, and land resources to scientifically evaluate the efficiency of the mining-land restoration system. When assessing efficiency, outputs should consider both desired outputs, such as non-petroleum mineral resources and undesired outputs, such as destruction of land area, and only by comprehensively considering both types of outputs can the actual effectiveness of the system be truly reflected. The efficiency of mining and land restoration is indirectly influenced by external environmental factors: the natural environment can be measured by indicators such as average annual temperature and others; the social and economic environment is gauged by standards such as regional gross domestic product and so on; and technological level is reflected through indicators such as R&D institutions in industrial enterprises above designated size by region and the like.
In the indicator screening process, the literature frequency statistics method is used to systematically review past studies, and high-frequency core indicators are identified by the frequency of indicators as the basis for constructing the evaluation system. In addition, indicator selection also balances literature relevance, focusing on the system core; system completeness, covering key factors and outputs; and indicator conciseness, streamlining redundancy to ensure the evaluation system is scientifically accurate, practical, and efficient.
The weights of endogenous indicators can be solved by the Dynamic Network DDF model itself, while the weights of exogenous indicators are usually solved by the PLS-SEM regression method. This approach of combining the two methods can make full use of their respective advantages, determine the indicator weights more accurately, and thus enhance the explanatory power of the model. Table 1 shows the variables involved.
Figure 2 shows the process. This study divides the mining-land restoration system into the mining stage and the land restoration stage. Mining employees are used as the input variable in the mining stage. Destruction of land area is an undesirable output variable. Since oil and natural gas extraction mainly involves deep mining and has a small impact on the surface, it is not included in the scope of variable statistics, so production of non-petroleum mineral resources is a desirable output. Among them, the destruction of land area is undesirable, while the production of non-petroleum mineral resources is desirable. The smaller the former, the better, and the larger the latter, the better. The second stage is the land restoration stage. Restoration investment is used as the input variable and restoration of land area is used as the output variable. The destruction of land area is used as an intermediate variable to connect two stages. Fixed assets’ investment serves as a carryover connecting different periods.
In addition to the influencing factors that can be controlled within the system, external factors that cannot be controlled outside the system must also be considered. Mining is one of the industries most susceptible to the natural environment. Its production and mining are based on nature, so it has a certain sensitivity to environmental changes [43]. For example, the impact of climate change on mineral resource development is complex and extensive, which not only increases the uncertainty of mining operations but also has a profound impact on the operating costs, environmental responsibilities, and relationships with the region. Extreme weather events such as floods, droughts, and high temperatures can interfere with mining operations, damage infrastructure, and affect the quality and output of ore. Water shortages may limit mining activities, especially in water-intensive mineral mining, where accessibility and cost of water resources are key issues. Therefore, this study selects indicators such as temperature, sunshine duration, and precipitation as exogenous variables at the natural factor level. In addition, the mining industry will also be affected by economic factors such as regional gross domestic product, government policies, and financial support factors such as expenditure on energy conservation and environmental protection, and technical factors such as the number of relevant professional talents, the number of R&D institutions, and the number of patent applications. Therefore, regional gross domestic product (Regional GDP), expenditure on energy conservation and environmental protection (ECEP), number of R&D institutions in industrial enterprises above designated size by region (R&D institutions), number of R&D personnel in industrial enterprises above designated size by region (R&D personnel) and statistics on patents of industrial enterprises above designated size by region (patents) are selected as exogenous variables at the social factor level.

2.4. Data Source and Descriptive Statistical Analysis

Due to the lack of data in Shanghai and the Tibet Autonomous Region, this study takes 29 Chinese provinces outside Shanghai and the Tibet Autonomous Region as the research object. The 29 provinces include Beijing, Tianjin, Chongqing, Hebei, Shanxi, Liaoning, Jilin, Heilongjiang, Jiangsu, Zhejiang, Anhui, Fujian, Jiangxi, Shandong, Henan, Hubei, Hunan, Guangdong, Hainan, Sichuan, Guizhou, Yunnan, Shaanxi, Gansu, Qinghai, Inner Mongolia, Guangxi, Ningxia, and Xinjiang.
The data on the number of mining employees, average annual temperature, annual precipitation, sunshine duration, regional GDP, ECEP, and fixed assets’ investment used in this study are sourced from the China Statistical Yearbook 2018–2022 [44,45,46,47,48]. Among them, the average temperature and annual precipitation of each province are represented by those of the provincial capital cities. Production data of non-petroleum mineral resources are derived from the China Land and Resources Statistical Yearbook 2018 [49] and China Natural Resources Statistical Yearbook 2019–2022 [50,51,52,53]. Data on destruction of land area, restoration investment, and restoration of land area are obtained from the China Statistical Yearbook on Environment 2018–2022 [54,55,56,57,58]. The number of R&D institutions, the number of R&D personnel, and the number of patents are sourced from the China Statistical Yearbook on Science and Technology 2018–2022 [59,60,61,62,63].
Table 2 analyzes the known data. There are obvious differences in the number of mining employees in various regions of China. The maximum is 893,000 people, the minimum is only 4000 people, and the standard deviation is 16.89, indicating that the distribution of mining employment in various regions is relatively concentrated, but there are large differences in some regions. The average output of non-petroleum mineral resources is 321.61 million tons, the maximum value is 1259.6661 million tons, and the minimum value is 5.1514 million tons, which has a lot to do with the distribution of natural resources in various regions. The maximum value of the land area destroyed by mining is 924,777 hectares, the minimum value is 302 hectares, and the standard deviation is 113,294.65. The average mining ecological restoration investment is RMB 1086.3268 million, and the sample standard deviation is 134,726.27, which is closely related to the destruction of land in various regions. The average value of mine restoration land area is 4025.25 hectares, the minimum restoration area is 32 hectares, the highest restoration area is 30,491 hectares, and the standard deviation is 5108.36. There are great differences in the intensity and effect of mine restoration in various regions. The average value of fixed asset investment is 37.524 billion yuan, with a maximum value and a minimum value that are nearly 500 times different, reflecting the imbalance in the economic development level of various regions.
The average temperature in various regions of China is affected by latitude factors. The maximum temperature is 25.80 °C, and the minimum temperature is only 5.10 °C. There is a clear regional distribution. However, due to the particularity of the average temperature factor, the standard deviation is 5.15, and the temperature level varies slightly between regions. The average annual precipitation is 953.62 mm, but the region varies greatly, with a maximum and a minimum value differing by 17 times. The average sunshine duration is 2071.26 h, but the regions vary greatly, with the maximum and minimum values being nearly 3 times different. The average sunshine duration is 2071.26 h, the maximum is 3421.4 h, the minimum is 858.5 h, and the standard deviation is 550. This is related to the geographical location and climatic conditions of each region. The average regional GDP is 3229.542 billion yuan, with a maximum value and a minimum value that are nearly 50 times different, indicating that the economic development level of various regions in China is quite different. The average ECEP is 19.41 billion yuan, but the region has a large difference, indicating that the investment in environmental protection is different in each region. The average number of R&D institutions is 3329.14, but there are great differences between regions, with a maximum value and a minimum value differing by 1200 times. This may be related to the industrial structure and economic development stages of various regions. The average number of R&D personnel is 154,900, the maximum is 973,000, the minimum is 2,500 and the standard deviation is 20.94. The number of R&D personnel in some regions is large and the R&D capabilities are strong, while the number of R&D personnel in some regions is small and the R&D capabilities are relatively weak. The average number of patents is 36,600, the maximum is 340,900, the minimum is 400, and the standard deviation is 5.94, indicating that there is a significant gap in the output of innovative achievements in various regions.

3. Results and Discussion

Using MaxDEA Ultra 9.1, the overall efficiency of 29 provinces from 2017 to 2021, as well as the efficiency of the mining production stage, land restoration stage, and overall efficiency for each individual year during this period, were obtained.

3.1. Efficiency and Dynamic Changes

According to the results, the overall efficiency of 29 provinces from 2017 to 2021 and the efficiency of each individual year were obtained. Table 3 presents the overall efficiency and annual efficiency of the 29 provinces during the 2017–2021 period.
From the perspective of overall efficiency of each province, Zhejiang, Ningxia, and Xinjiang have the highest overall efficiency, all of which are above 0.5. However, Guizhou, Heilongjiang, and Beijing have relatively low overall efficiency, with fluctuations around 0.12. The comprehensive efficiency of Anhui, Chongqing, Fujian, Henan, Hubei, Liaoning, Tianjin, Shandong, and Jiangsu has not reached 0.2 and needs further improvement. Figure 3 shows the national overall efficiency through a national distribution map.
According to the China Statistical Yearbook, China is divided into four major regions: the Eastern Region, Central Region, Western Region, and Northeastern Region. Specifically, the Eastern Region includes 10 provinces/municipalities: Beijing, Tianjin, Hebei, Shanghai, Jiangsu, Zhejiang, Fujian, Shandong, Guangdong, and Hainan; the Central Region consists of 6 provinces: Shanxi, Anhui, Jiangxi, Henan, Hubei, and Hunan; the Western Region comprises 12 provinces/autonomous regions/municipalities: Inner Mongolia, Guangxi, Chongqing, Sichuan, Guizhou, Yunnan, Tibet, Shaanxi, Gansu, Qinghai, Ningxia, and Xinjiang; and the Northeastern Region is composed of three provinces: Liaoning, Jilin, and Heilongjiang.
From a regional perspective, the overall efficiency of the eastern region is highly differentiated. Zhejiang (0.547) leads in overall efficiency. Although Guangdong (0.217) and Jiangsu (0.144) have large economic aggregates, their overall efficiency fails to meet expectations, mainly due to differences in input-output mechanisms and industrial structures. Relying on the digital economy, high-end manufacturing, and modern service industries, Zhejiang has formed a “low input, high output” model: in the mining stage in 2021, it only invested 0.4 million employees but produced 446,697,200 tons of non-oil minerals, with only 5561 hectares of land damaged and a restoration investment of 1,293,950,000 yuan. The output efficiency per unit input and environmental cost control are significantly better than those of Guangdong and Jiangsu. In 2021, Guangdong invested 14,000 employees but only produced 420,329,000 tons of non-oil minerals, with 20,817 hectares of land damaged and a restoration investment of 914,290,000 yuan, resulting in a high restoration cost per unit area. Jiangsu invested 54,000 employees to produce only 118,883,500 tons, with 14,224 hectares of land damaged and a restoration investment of 1,529,060,000 yuan. Its labor input is 13.5 times that of Zhejiang, but its output is only 26.6% of Zhejiang’s, indicating that scale expansion has not brought about efficiency improvement. In terms of industrial structure, Zhejiang has a high proportion of high-end industries, strong resource utilization efficiency, and environmental friendliness, while Guangdong and Jiangsu have a large proportion of traditional manufacturing industries. Mining activities rely more on extensive input, leading to resource waste and high restoration costs. Although the scale of fixed asset investment is huge, resource allocation has not been effectively transformed into production efficiency, ultimately forming an efficiency differentiation between Zhejiang and Guangdong/Jiangsu. Cities such as Beijing (0.104) and Tianjin (0.156) are facing problems such as resource and environmental pressure and industrial relocation, which affect the overall efficiency. Hebei (0.250), Fujian (0.194), Shandong (0.145), and Hainan (0.250) all face challenges in industrial development and resource allocation.
The overall efficiency of the central region is mostly at a medium level, and the internal differences are small. Among them, Jiangxi (0.424) has relatively high efficiency because it is rich in mineral resources such as copper, tungsten, and rare earths. In recent years, it has actively undertaken industrial transfers from the eastern region. The revenue of the electronic information industry broke through one trillion yuan in 2022. Relying on the resource advantages of the “Asian Lithium Capital” and other areas, the new energy vehicle industry has attracted the gathering of leading enterprises, formed an industrial cluster effect, and promoted the improvement of input-output efficiency. However, the efficiencies of Shanxi (0.215), Anhui (0.199), Henan (0.181), Hubei (0.178), and Hunan (0.206) are close. As important agricultural and industrial bases, their resource endowments and industrial structures have obvious constraints: Shanxi has long relied on coal resources, with extensive mining methods and a single industrial structure. With an investment of 846,000 employees (2021), these resource advantages have not been transformed into diversified economic drivers. Traditional manufacturing industries account for a high proportion in Henan, Anhui, and other provinces. For example, in 2021, Henan invested 2.747 billion yuan in restoration, but the industrial transformation lagged behind. Although the non-oil output of Anhui was 60,100 tons (2021), it faced the problem of insufficient development of high-tech industries. Although the industrial systems of Hubei and Hunan are complete, the upgrading of traditional industries is slow. For example, in 2021, Hubei’s restoration area was 3253 hectares, but it was still restricted by the pressure of overcapacity. It generally presents the common characteristic of “resource endowment relying on traditional industries and insufficient conversion efficiency of emerging industries”.
The overall efficiency of the Western Region varies significantly. Ningxia (0.534), Xinjiang (0.501), and Inner Mongolia (0.473) exhibit higher efficiency. Ningxia has developed well in the energy chemical industry and characteristic agriculture; Xinjiang has gained advantages in oil and natural gas mining/processing as well as planting and trade of characteristic agricultural products by virtue of abundant energy resources and unique geographical location; and Inner Mongolia has achieved high efficiency through the energy industry and animal husbandry. In contrast, Guizhou (0.139), Chongqing (0.197), and others show lower efficiency. Guizhou’s relatively weak economic foundation, complex geographical environment, and difficult infrastructure construction (e.g., transportation) have restricted industrial development and resource utilization efficiency; Chongqing faces challenges such as traditional industry transformation and emerging industry cultivation during industrial upgrading, affecting the improvement of overall efficiency.
The overall efficiency of Liaoning (0.163), Jilin (0.234), and Heilongjiang (0.120) in the northeastern region is relatively low, which is directly related to the long-term reliance on traditional resource development models in the region. As an energy base, Heilongjiang has experienced severe land damage caused by mineral extraction activities such as the Daqing Oilfield due to lagging technology. The damaged area from 2017 to 2021 has always been higher than 50,000 hectares, while the restoration area is less than 5000 hectares. Relying on traditional industries such as steel and equipment manufacturing, Liaoning had a non-oil mineral output of 29,100 tons in 2021, but the damaged land reached 57,400 hectares. The slow industrial transformation has resulted in high resource consumption and ecological costs. Although Jilin’s efficiency temporarily rose to 0.540 in 2020 due to a surge in restoration investment (225.78 million yuan), the traditional automobile industry was impacted by new energy, and the cultivation of emerging industries was insufficient. In 2021, the efficiency quickly fell back to 0.155, reflecting the deep-seated contradiction of a single industrial structure. Overall, due to the resource-based industries accounting for more than 60% and insufficient investment in restoration technology (the restoration investment of the three provinces was all less than 700 million yuan in 2021), the three provinces have formed a vicious cycle of “mining-damage-inefficient restoration”, leading to low overall efficiency.
The Hu Line (Heihe-Tengchong Line) was proposed by geographer Hu Huanyong in 1935, initially used to depict the spatial differentiation of population density in China—the southeast side of the line carries 96% of the population with 36% of the national territory, while the northwest side shows the characteristic of “vast land with sparse population”. This line is not only a boundary line of population density but also implies the spatial differentiation of resource endowment, ecological carrying capacity, and economic structure. Therefore, in this paper, according to the Hu Line, among the 29 provinces, Inner Mongolia, Sichuan, Shaanxi, Gansu, Qinghai, Ningxia and Xinjiang are classified as the northwest side, while the rest of the provinces are classified as the southeast side of the Hu Line. For provinces crossing the Hu Line, they are usually classified according to the side where the main body of the province is located. The average values of overall efficiency of the provinces on both sides are calculated, respectively, and it is found that the efficiency of the northwest side is 0.365 while that of the southeast side is 0.226.
The average overall efficiency of the 7 provinces on the northwest side of the Hu Line is higher than that of the 22 provinces on the southeast side, and this difference stems from multiple factors.
In terms of resource endowment, provinces on the northwest side, such as Inner Mongolia and Xinjiang, are rich in non-petroleum mineral resources. In 2021, Inner Mongolia’s non-petroleum output reached 125,966.61 ten thousand tons, and Shaanxi’s fixed asset investment amounted to 108,792.3008 million yuan. Large-scale mining has promoted input-output efficiency. In contrast, the southeast side (e.g., Zhejiang) has only 0.4 ten thousand mining employees and a non-petroleum output of 44,669.72 ten thousand tons. The diversified industrial structure results in a low proportion of mining, making it difficult to form economies of scale.
In terms of land destruction and restoration, take Inner Mongolia as an example. It damaged 143,000 hectares of land in 2021, with a restoration investment of 7168.47 million yuan. Concentrated damage and restoration reduced unit costs. Qinghai’s restored area in 2021 was 5556 hectares, even exceeding the damaged area. On the southeast side, however, Beijing only had 1267 hectares of damaged land, with scattered restoration investment. Provinces such as Tianjin have extremely little mining activity, leading to low restoration efficiency.
In terms of policies and investment, the northwest side (e.g., Inner Mongolia) had a fixed asset investment of 109,182.0403 million yuan in 2021. National resource development and ecological compensation policy preferences provided financial support. The southeast side (e.g., Jiangsu) had a restoration investment of 1529.06 million yuan in 2021, which was lower than that of the northwest side.
At the technical management level, Gansu and Qinghai on the northwest side applied specialized restoration technologies for special landforms. For example, in the restoration of mines in the Loess Plateau region, the “terracing renovation + soil conditioner” technology was adopted. Shaanxi’s restoration investment of 3650.78 million yuan in 2021 corresponded to a restored area of 11,275 hectares, showing high efficiency. The southeast side (e.g., Anhui) invested 1328.29 million yuan in 2021 but only restored 2945 hectares, suffering from insufficient technical investment and decentralized management.
This difference is essentially the result of two models: the northwest side’s “resource development-concentrated restoration-policy support” and the southeast side’s “industrial transformation-decentralized restoration-insufficient investment”, reflecting the periodic characteristics of resource utilization and ecological protection in regional development.
As shown in Figure 4, to visualize the overall efficiency and its changing trends of 29 provinces each year, we adopted a heat map visualization method. In the figure, the color ranging from light to dark represents the overall efficiency from low to high.
According to the results, overall, Ningxia Hui Autonomous Region, Xinjiang Uygur Autonomous Region, and Zhejiang Province are relatively efficient, and the values are at the forefront in most years from 2017 to 2021. The overall efficiency of Beijing, Anhui Province, Fujian Province, Gansu Province, Guizhou Province, Hainan Province, Hebei Province, Henan Province, Heilongjiang Province, Hubei Province, Hunan Province, Jilin Province, Jiangsu Province, Jiangxi Province, Liaoning Province, Shanxi Province, Shaanxi Province, Sichuan Province, Tianjin City, Chongqing City, and other provinces is relatively low, with most of them at the midstream and downstream levels.
Judging from the efficiency changes in each province, Anhui Province, Guangdong Province, Heilongjiang Province, Hubei Province, Hunan Province, Qinghai Province, Shandong Province, Xinjiang Uygur Autonomous Region, Yunnan Province, and Chongqing City showed an overall upward trend from 2017 to 2021. For example, after Anhui Province fell from 0.276 in 2017 to 0.107 in 2020, it rebounded to 0.128 in 2021; Guangdong Province rose from 0.194 in 2017 to 0.280 in 2021. The efficiency fluctuations in Beijing, Fujian Province, Gansu Province, Guangxi Zhuang Autonomous Region, Guizhou Province, Hainan Province, Hebei Province, Henan Province, Jilin Province, Jiangsu Province, Jiangxi Province, Liaoning Province, Inner Mongolia Autonomous Region, Ningxia Hui Autonomous Region, Shanxi Province, Shaanxi Province, Sichuan Province, and Tianjin City are significantly fluctuating. For example, Beijing was 0.103 in 2017, fell to 0.041 in 2020, and rose sharply to 0.181 in 2021; Fujian Province rose first, then fell, and then rose again from 2017 to 2021, starting at 0.160 in 2017, rose to 0.185 in 2019, fell to 0.129 in 2020, and rose to 0.315 in 2021. Although Zhejiang Province has fluctuations, it is on an upward trend, reaching 0.537 in 2017 and rising to 0.561 in 2021.

3.2. Efficiency and Decomposition

According to the results, the annual efficiency of the mining stage and land restoration stage for 29 provinces from 2017 to 2021 was obtained, respectively.

3.2.1. Changes in Efficiency of the Mining Stage

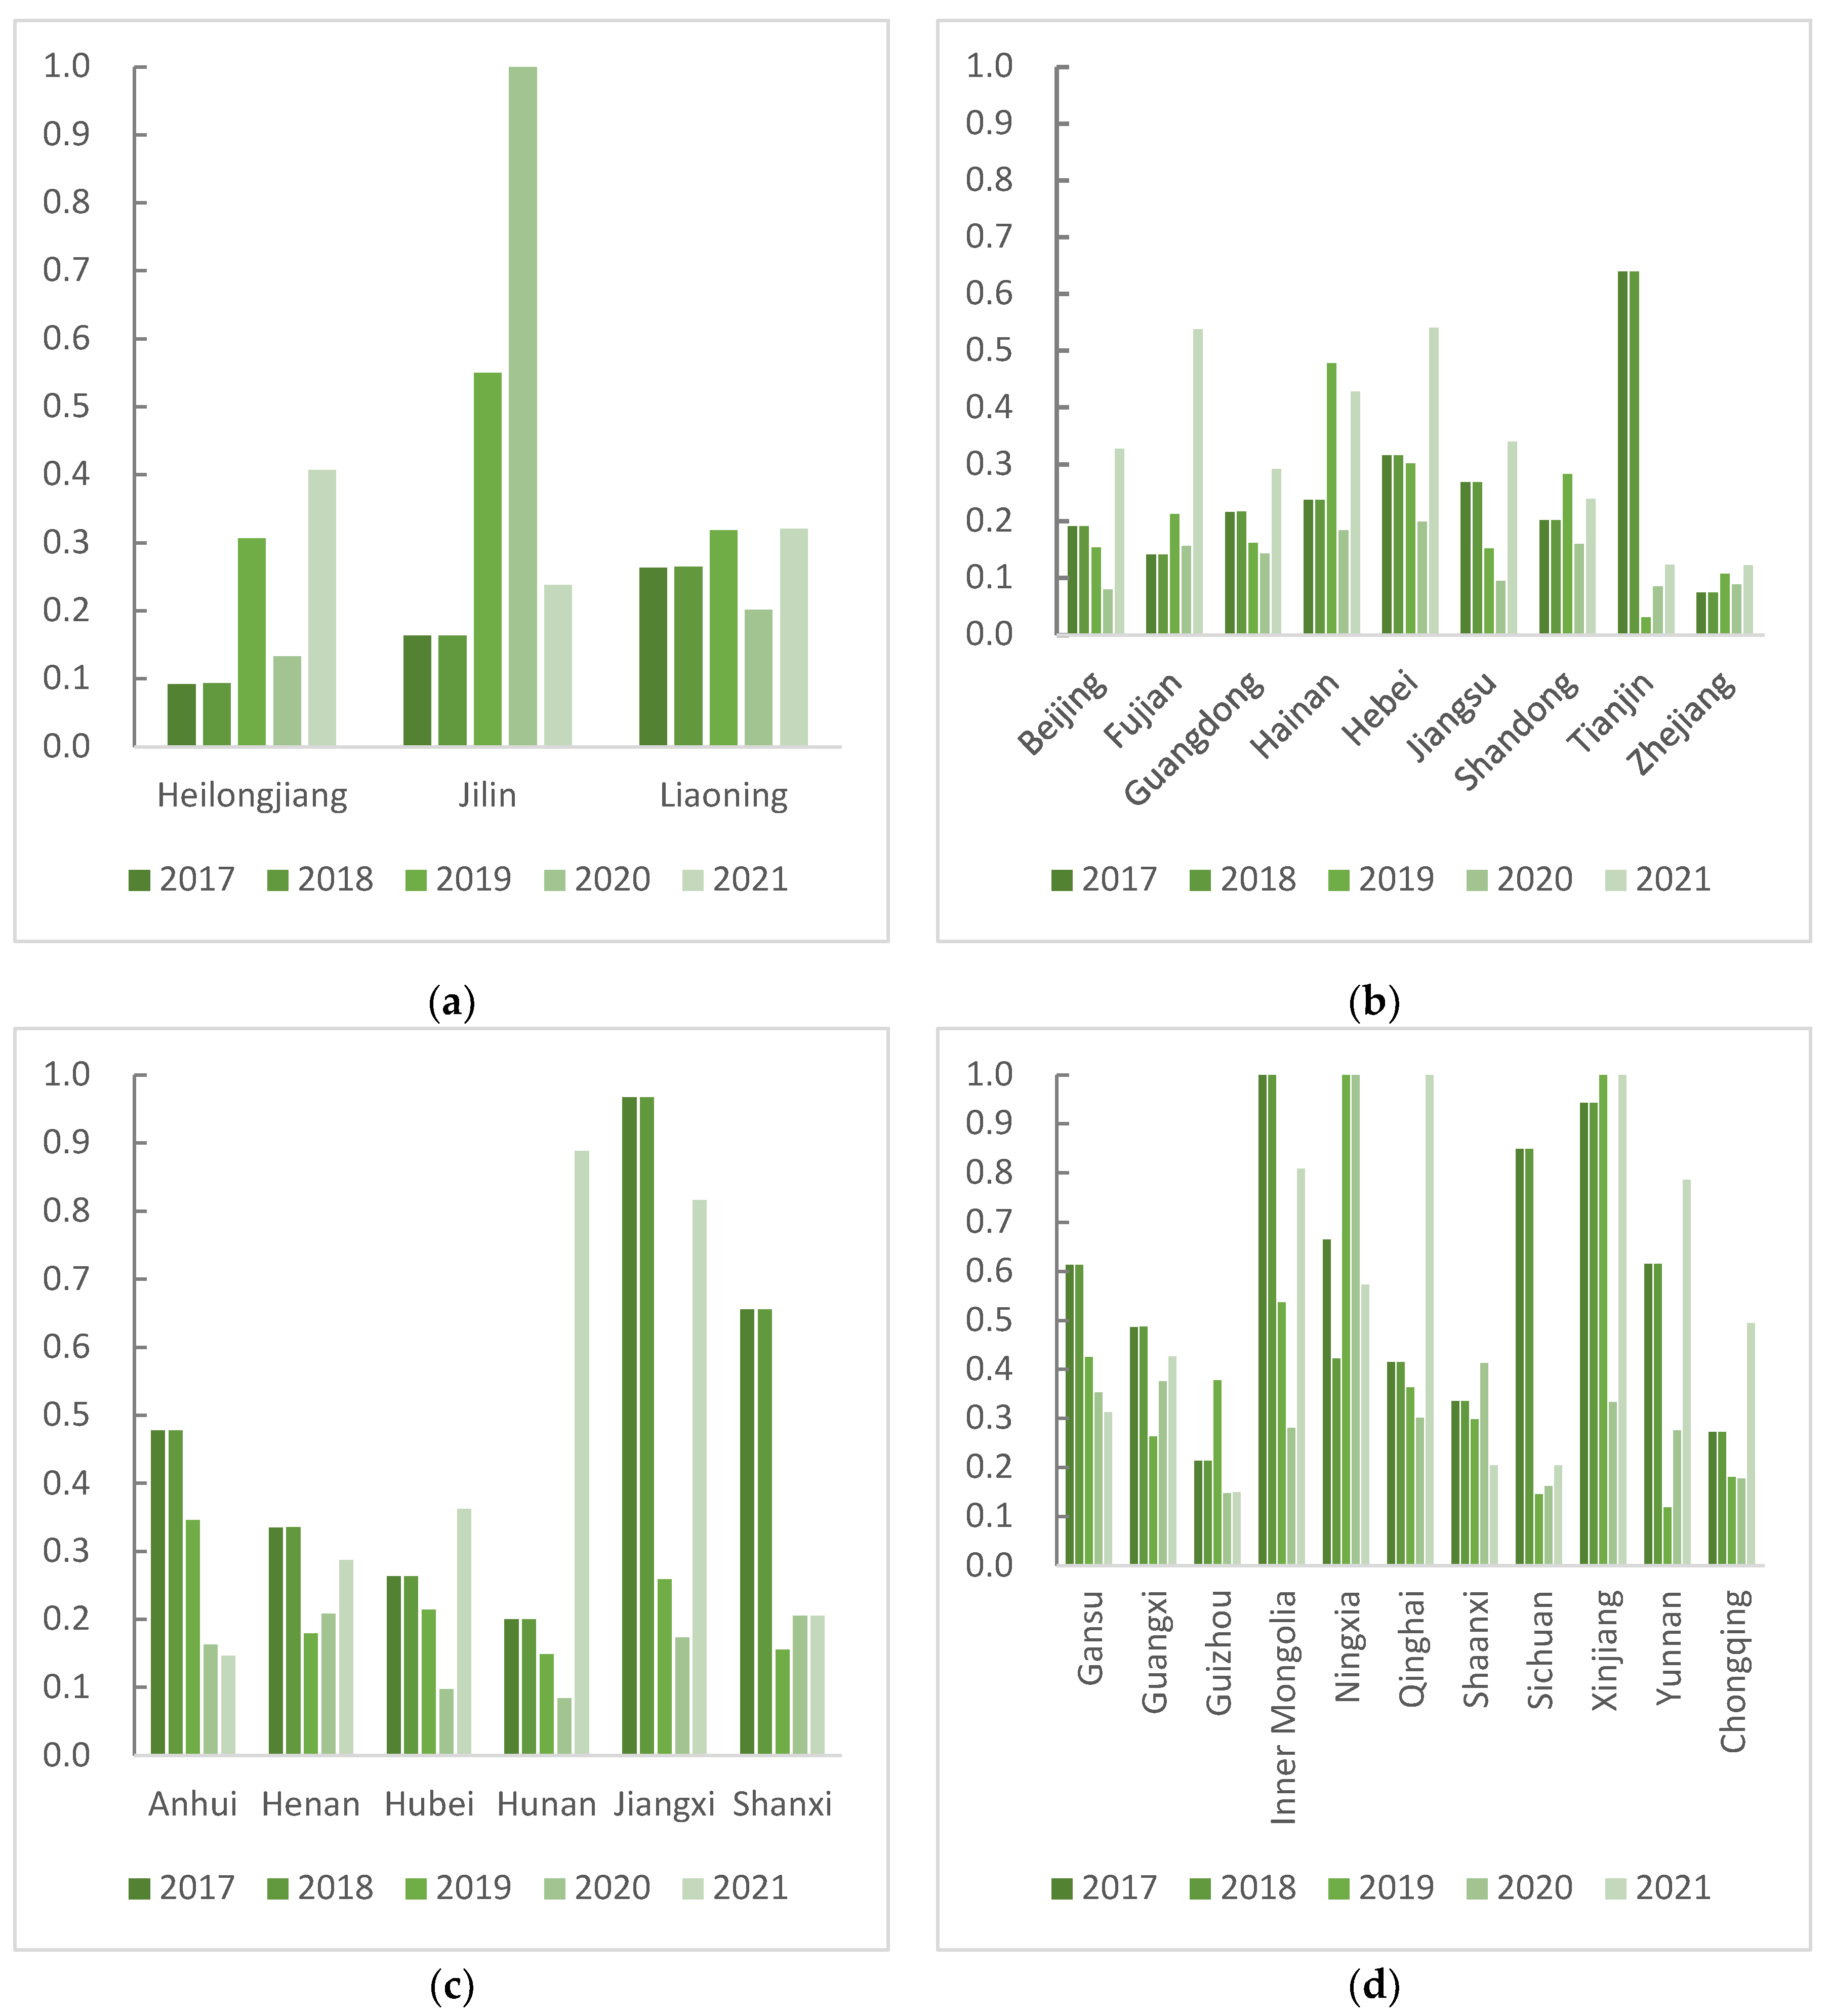
Figure 5 shows the efficiency of the mining stage in the four regions more intuitively through the bar chart. The specific efficiency values of the mining stage are shown in Table 4. Based on input and output, the mining efficiency of each region is analyzed as follows.
As shown in Figure 5a, the overall efficiency of the mining stage in the northeast region is low and showing an upward trend. From 2017 to 2021, Heilongjiang increased from 0.013 to 0.070, Jilin rose from 0.018 to 0.073, and Liaoning increased from 0.024 to 0.097.
In terms of input, the number of mining employees in the northeast region is generally declining. For example, Heilongjiang dropped from 256,000 in 2017 to 232,000 in 2021. In terms of output, production of non-petroleum mineral resources has increased and decreased, such as Heilongjiang, which rose from 156.2395 million tons in 2017 to 199.1649 million tons in 2021. This shows that to a certain extent, resource utilization efficiency has been improved, which has promoted the improvement of mining efficiency. At the same time, the area of destructed land is also showing a downward trend. The protection and utilization of land are gradually optimized during the mining process, reducing undesirable outputs and helping to improve mining efficiency.
As shown in Figure 5b, the efficiency differences in the mining stage in the eastern region are obvious. Zhejiang has always maintained a high efficiency of 1.000 from 2017 to 2021. The efficiency of Beijing and Tianjin has not reached 0.1 in five years. The efficiency of provinces such as Fujian and Guangdong fluctuated. For example, Fujian was 0.178 in 2017, and after rising to 0.220 in 2018, it fell year by year to 0.093 in 2021.
With only 4000 to 5000 employees in Zhejiang, with efficient production methods, production of non-petroleum mineral resources is stable and high, and destruction of land area is relatively small, and mining efficiency is always the highest. Although Fujian’s production of non-petroleum mineral resources has increased, the input reduction is limited, the destruction of land area has increased, and efficiency has decreased.
As shown in Figure 5c, the efficiency of the mining stage in the central region is mostly at a moderate level, and the trend of change is different. Among them, Jiangxi was higher in 2017–2018, and then declined. Anhui, Henan, Hubei, Hunan, and other places have relatively low efficiency and fluctuations. For example, Anhui was 0.074 in 2017 and then rose to 0.083 in 2019 and then dropped to 0.052 in 2020.
The number of employees in the central region has generally declined, such as in Anhui, which dropped from 203,000 in 2017 to 130,000 in 2021. Production of non-petroleum mineral resources and destruction of land area vary. Taking Henan as an example, production of non-petroleum mineral resources rose from 265.4462 million tons in 2017 to 387.22 million tons in 2021. With the reduction of input, production of non-petroleum mineral resources increased significantly, while the destruction of land area fluctuated within a reasonable range, and mining efficiency was significantly improved.
As shown in Figure 5d, the efficiency of the mining stage in the western region is extremely different. Ningxia, Guangxi, and Inner Mongolia performed outstandingly in some years, such as Ningxia 0.464 in 2017 and 0.658 in 2018. However, the efficiency of Guizhou, Sichuan, and other places is relatively low. For example, Guizhou fluctuated between 0.036 and 0.060 from 2017 to 2020 and was 0.083 in 2021.
The number of employees in the western region varies differently, and production of non-petroleum mineral resources and destruction of land area fluctuate greatly. Taking Guangxi as an example, from 2018 to 2020, production of non-petroleum mineral resources increased significantly from 439.3509 million tons to 617.5068 million tons, and the number of employees dropped from 30,000 to 8000. Although the area of destructed land has also changed, the significant increase in output and the significant reduction in input have greatly improved efficiency; from 2020 to 2021, production decreased and efficiency decreased.

3.2.2. Changes in Efficiency of the Land Restoration Stage

Figure 6 shows more intuitively the efficiency of the land restoration stage in the four regions from 2017 to 2021 through the bar chart. The specific efficiency values of land restoration stage are shown in Table 5. Based on input and output, the mining efficiency of each region is analyzed as follows.
As shown in Figure 6a, the overall efficiency in the Northeast region shows a trend of rising first and then falling, and there are large internal differences. Heilongjiang grew from 0.092 in 2017 to 0.407 in 2021, with a relatively obvious growth. Jilin reached a high efficiency of 1.000 in 2020 but dropped to 0.238 in 2021. Liaoning’s efficiency is relatively stable, maintaining between 0.2 and 0.32 from 2017 to 2021, but there is still a lot of room for improvement.
In terms of input, the changes in restoration investment vary from province to province. In terms of output, the restoration of land area has increased. For example, Heilongjiang invested 29.65 million yuan in 2017 and increased to 488.94 million yuan in 2021, and the restoration area increased from 32 hectares in 2017 to 3008 hectares in 2021. With the increase in investment in Heilongjiang, the restoration area has increased significantly, and its efficiency has increased from 0.092 in 2017 to 0.407 in 2021. Jilin’s input in 2020 has significantly decreased, and the restoration area has decreased significantly, but its efficiency has reached the highest level.
As shown in Figure 6b, the regional efficiency differences in the eastern region are significant. Tianjin’s efficiency was relatively high from 2017 to 2018, but it declined significantly from 2019 to 2021. Zhejiang’s efficiency has always been low, ranging from 0.074 to 0.122 from 2017 to 2021. Fujian’s efficiency has improved significantly in 2021, from the previous 0.1–0.2 to 0.538.
From the perspective of input-output, taking Beijing as an example, the area of restoration grew slowly from 2017 to 2019 and grew rapidly from 2020 to 2021. At the same time, investment also increased significantly, and efficiency first decreased and then increased, indicating that the previous investment was not fully converted into the growth of the area of restoration, and the efficiency of investment utilization in the later stage has been improved. Fujian’s restoration investment decreased in 2021, but the increase in restoration area has greatly improved efficiency and more efficient resource utilization.
As shown in Figure 6c, the overall efficiency of the central region fluctuates greatly, and the development of each province is uneven. Jiangxi was extremely efficient from 2017 to 2018, and then it dropped significantly. Anhui, Henan, Hubei, and other places have relatively low efficiency and fluctuations. For example, Anhui has dropped from 0.478 in 2017 to 0.147 in 2021.
Taking Anhui as an example, from 2017 to 2019, the restored area increased from 3712 hectares to 4681 hectares, with a year-on-year growth of 26.10%. However, the investment increased more significantly, from 628.90 million yuan to 1291.14 million yuan, with a year-on-year growth of 105.30%, leading to a decline in efficiency. From 2020 to 2021, both the restored area and investment decreased, with the restored area showing a year-on-year growth of −0.27% and the investment a year-on-year growth of −14.60%, further reducing efficiency. In Hunan, from 2017 to 2019, the investment increased by 411.25% year-on-year, and the restored area increased by 176.79% year-on-year. The faster growth of investment led to a decline in efficiency. From 2020 to 2021, the investment decreased while the restored area increased, and the efficiency was significantly improved, which to a certain extent reflects the positive impact of the optimization of the input-output structure on efficiency.
As shown in Figure 6d, the overall efficiency of the western region is relatively high, and some provinces have performed outstandingly. Inner Mongolia, Ningxia, and Xinjiang have achieved high efficiency of 1.000 in many years. Efficiency fluctuations in Gansu, Sichuan, and other places were obvious, such as Sichuan, which was 0.849 from 2017 to 2018 and fell to 0.146 from 2019.
Taking Inner Mongolia as an example, from 2017 to 2019, investment increased while the restored area fluctuated but showed an overall upward trend, maintaining a relatively high level of efficiency. From 2020 to 2021, investment continued to rise, and the restored area also increased. Although efficiency experienced some fluctuations, it remained at a high level, indicating that investment effectively promoted the growth of the restored area and sustained high efficiency. In Sichuan, investment increased from 2017 to 2019, but the investment failed to be effectively translated into stable growth of the restored area. The restored area first decreased and then increased, leading to a significant decline in efficiency.

3.2.3. Two-Stage Efficiency Matrix Analysis

Table 6 shows the mining efficiency and land restoration efficiency of 29 provinces from 2017 to 2021. Figure 7 clearly shows the comprehensive performance of the average efficiency of each province in two stages through the form of a radar map. There are great differences in efficiency in different stages of China’s provinces. The fluctuations between provinces are also very large every year, which is closely related to the mineral resources and measures taken in each region. In five years, land restoration efficiency has generally been higher than mining efficiency. The average mining efficiency is 0.154, and the average land restoration efficiency is 0.365.
By region, the overall efficiency of the Northeast and the Central Region is in the middle range in the two stages. Jiangxi is relatively efficient in the mining stage (0.211) and land restoration stage (0.636), and the development of these two aspects is relatively balanced and has good results; Heilongjiang is relatively low in both stages, with the mining stage being 0.034 and the land restoration stage being 0.206, which faces great challenges in resource development and land restoration.
The eastern provinces are more scattered on the radar map. For example, Zhejiang is extremely efficient in the mining stage (1.000) but has low efficiency in the land restoration stage (0.093); Beijing and Tianjin are at a relatively low level in both stages.
The differences in provinces in the western region are obvious. Inner Mongolia (0.725), Ningxia (0.732), and Xinjiang (0.844) have outstanding efficiency in the land restoration stage, but in the mining stage, Ningxia (0.336) and Inner Mongolia (0.221) are relatively good, while Xinjiang (0.158) needs to be improved. Guizhou’s efficiency is relatively low in both stages, with the mining production stage being 0.057 and the land restoration stage being 0.220. Therefore, most provinces have an imbalance in efficiency during the mining stage and land restoration stage.
As shown in Figure 8, we adopted a scatter plot to take the average values of mining efficiency and land restoration efficiency of 29 provinces from 2017 to 2021 as the horizontal and vertical axes, respectively. Each scatter point represents a province, intuitively reflecting the relationship and distribution characteristics between the efficiencies of the two stages in each province.
From the quadrant, the first quadrant is high mining efficiency-high land restoration efficiency, the second quadrant is low mining efficiency-high land restoration efficiency, the third quadrant is low mining efficiency-low land restoration efficiency, and the fourth quadrant is high mining efficiency-low land restoration efficiency.
There is no distribution of provinces in the first quadrant, which means there is no province that can achieve high efficiency in both stages at the same time. There is an imbalance in the development process of 29 provinces. The provinces distributed in the second quadrant have invested more resources in the land restoration stage and achieved good results, but the mining link is relatively weak, and there are more provinces in the western region. These areas pay more attention to ecological restoration or have shortcomings in mining technology and industrial planning, resulting in low mining efficiency.
The provinces distributed in the third quadrant performed poorly in both stages, with more provinces in the eastern region, and these provinces may face major challenges in resource development and ecological protection. Provinces distributed in the fourth quadrant have high efficiency in the mining stage and may have advantages in resource mining technology and management models. However, insufficient investment or backward technology in land restoration leads to low land restoration efficiency. This situation may cause long-term ecological problems, and development strategies need to be adjusted in a timely manner, and land restoration work needs to be strengthened.
Overall, the distribution of scatter points in the graph is mostly concentrated in the second and third quadrants, namely low mining efficiency—high land restoration efficiency and low mining efficiency—low land restoration efficiency. Most provinces have low mining efficiency and are very different from the efficiency combination of the land restoration stage. The development levels of different provinces in the two links of mineral resource development and land restoration are uneven.
Judging from the distribution trend of scatter points, there is no obvious linear correlation between the efficiency of the mining stage and the efficiency of the land restoration stage. This shows that the level of mining efficiency in a province cannot directly determine its land restoration efficiency. The development of the two stages is affected by different factors. For example, the degree and method of impact of factors such as resource endowment, industrial policies, technical level, and capital investment on mining and land restoration are different, resulting in no simple correlation between the two.

3.2.4. Influencing Factors of Mining-Land Restoration Efficiency

In order to explore the relationship between exogenous factors and mining efficiency, land restoration efficiency, and overall efficiency, this study analyzes the PLS-SEM multivariate statistical analysis method (partial least squares structural equation modeling, a structural equation model based on the partial least squares method). Due to the large difference in variable units, IBM SPSS Statistics 27.0.1 was used for standardization. The selected data are the overall efficiency, mining efficiency, and land restoration efficiency of the 29 provinces from 2017 to 2021 and the average of the temperature, annual precipitation, sunshine duration, regional GDP, ECEP, R&D institutions, R&D personnel, and patents.
The results shown in Table 7 indicate that in terms of the measurement model’s convergent validity, except for the climate-related factor “sunshine duration”, the factor loadings of observed variables for each latent factor are all greater than 0.7, and the average variance extracted (AVE) values of all latent factors exceed 0.5, suggesting that the measurement model has good convergent validity. Regarding the discriminant validity of the measurement model, according to the criteria of the Fornell–Larcker Criterion, since the square root of the AVE value of each latent factor is greater than its correlation coefficient with any other latent factor, the measurement model is determined to have good discriminant validity; additionally, the confidence intervals of the HTMT (heterotrait-monotrait ratio) estimates between all latent factors do not include 1, further verifying that the measurement model has good discriminant validity [64].
As shown in Figure 9, land restoration efficiency has a significant positive impact on overall efficiency (0.707). Improving land restoration efficiency can directly enhance overall efficiency, and the impact is substantial. Mining efficiency also has a significant positive effect on overall efficiency (0.733), slightly higher than that of land restoration efficiency, indicating that improving mining efficiency plays a more critical role in contributing to overall efficiency. Policy and economic factors have a significant negative impact on land restoration efficiency (−0.522), suggesting that current policies or economic measures inhibit the improvement of land restoration efficiency. These factors exhibit a highly significant negative effect on mining efficiency (coefficient = −0.802), implying that existing policy or economic conditions may impose substantial constraints on mining efficiency. Climatic factors have a weak negative impact on land restoration efficiency, possibly because extreme weather conditions (such as droughts and floods) increase the difficulty of restoration. Conversely, climatic factors have a slight positive impact on mining efficiency—for example, moderate temperature and other favorable climatic conditions facilitate mining operations. Technological innovation has a weak positive effect on land restoration efficiency, indicating that the application of current technological innovations has not yet fully unleashed its potential in the field of land restoration. In contrast, technological innovation has an extremely strong positive impact on mining efficiency (coefficient = 0.910), demonstrating that technological innovation serves as the core driving force for improving mining efficiency.

4. Conclusions and Policy Recommendations

4.1. Conclusions

(1) From 2017 to 2021, the overall efficiency of 29 provinces in China showed obvious regional differentiation characteristics. The eastern region has a large efficiency differentiation, with Zhejiang leading the way; the central region is generally medium and has small differences; the western region has a large difference, with Ningxia, Xinjiang, and other provinces relatively high efficiency, while Guizhou, Chongqing, and other areas are relatively low, and the northeast region is generally low. The efficiency of some provinces such as Anhui, Guangdong, and Xinjiang, are on the rise, while provinces, such as Beijing, Fujian, and Inner Mongolia are fluctuating significantly. The average overall efficiency of the 7 provinces on the northwest side of the Hu Line is higher than that of the 22 provinces on the southeast side.
(2) The regional differences in mining efficiency are significant; the eastern Zhejiang is extremely efficient, and the northeast and some western provinces are relatively low. The impact of input-output is obvious, such as the improvement of resource utilization efficiency in the Northeast region promoting efficiency growth, the central Henan investment decreasing but the rise in output increasing efficiency, while the efficiency fluctuates greatly when the investment in Guangxi in the west decreases.
(3) Overall, land restoration efficiency is higher than mining efficiency. Inner Mongolia and Ningxia in the western region performed outstandingly, while in Zhejiang in the eastern region, it was relatively low. The input-output structure has a great impact, such as the increase in investment in Heilongjiang, Northeast China, which has increased efficiency; the rapid growth of investment in Anhui in central China, which has led to a decline in efficiency; and the reduction in investment in Hunan, which has decreased, but the efficiency of the restoration area has increased.
(4) The overall development of mining efficiency and land restoration efficiency is unbalanced, and most provinces performed inconsistently in the two stages. There is no obvious linear correlation between the two, and the efficiency of one stage cannot directly determine the efficiency of the other stage.
(5) Policy and economic factors have a significant negative impact on mining and land restoration efficiency, limiting the improvement of efficiency. Technological innovation has a strong positive driving force on mining efficiency and is the core driving force but has a weak impact on land restoration efficiency. Climate factors have a weak negative impact on land restoration and a slight positive impact on mining.
In summary, through the DDF-SEM model, analyzing mining efficiency and land restoration efficiency simultaneously, as well as the interrelationship between the two stages, and comprehensively considering the impact of external factors on efficiency from the perspectives of policy-economy, technological innovation, and climate, is essential for the comprehensive analysis of the mining-land restoration system. This approach is crucial for achieving the direct goal of land degradation neutrality (LDN) and further realizing the ultimate goal of sustainable development for the mining industry and social economy, which balances the environment and economy [65].

4.2. Policy Recommendations

For mining, it is necessary to accelerate the integration of mining areas, integrate regional resources, share technologies, machinery, and equipment, achieve economies of scale, and change the fragmented situation of small and medium-sized mines. For land restoration, provinces with low efficiency levels should be encouraged to learn from provinces with similar external environments and resource endowments, introduce advanced mining and land reclamation technologies, and implement technological transformations to improve their own efficiency levels. At the same time, the restoration achievements should be publicly disclosed in real time, and the latest conditions of the restored areas should be strictly tracked and feedback. Damaged land can also be converted into mining-related parks to play a role in publicity and education.
Mining companies can introduce high-tech mining equipment, increase R&D efforts, enhance technological capabilities, and achieve scientific mining to conform to the trend of high-quality development. The government should strengthen the construction of surrounding infrastructure to escort the integration of resources around mining areas and the improvement of restoration efficiency. National and local authorities should also improve laws and regulations to guide the coordinated development of regional production and the environment.

Author Contributions

Conceptualization, C.L.; data curation, Y.H.; formal analysis, J.Y.; funding acquisition, J.Y. and C.L.; methodology, J.Y. and C.L.; project administration, S.Z.; resources, S.Z.; visualization, Y.H.; writing—original draft, J.Y.; writing—review and editing, C.L. All authors have read and agreed to the published version of the manuscript.

Funding

This research was funded by the Hunan Provincial Key Laboratory of Land Resource Evaluation and Utilization: Land Use Change, Carbon Emissions, and Associated Effects in the Dongting Lake Ecological Economic Zone, grant number SYS-ZX-202406, and the 2024 Annual Hunan Province College Student Innovation Training Program General Project, grant number S202410538102.

Institutional Review Board Statement

Not applicable.

Informed Consent Statement

Not applicable.

Data Availability Statement

The data presented in this study are available in the following public domain resources: China Statistical Yearbook, China Land and Resources Statistical Yearbook, China Natural Resources Statistical Yearbook, China Statistical Yearbook on Environment, China Statistical Yearbook on Science and Technology.

Acknowledgments

The authors wish to thank all participants in the conception, discussion, revision, and improvement of this article and the manuscript reviewers for their constructive comments.

Conflicts of Interest

The authors declare no conflicts of interest.

Abbreviations

The following abbreviations are used in this manuscript:
Regional GDPRegional gross domestic product
ECEPExpenditure on Energy Conservation and Environmental Protection
R&D InstitutionsR&D Institutions in Industrial Enterprises above Designated Size by Region
R&D PersonnelR&D Personnel in Industrial Enterprises above Designated Size by Region
PatentsStatistics on Patent of Industrial Enterprises above Designated Size by Region
AVEAverage variance extracted
HTMTHeterotrait-monotrait ratio

References

  1. Ma, L.; Ghorbani, Y.; Kongar-Syuryun, C.B.; Khayrutdinov, M.M.; Klyuev, R.V.; Petenko, A.; Brigida, V. Dynamics of backfill compressive strength obtained from enrichment tails for the circular waste management. Resour. Conserv. Recycl. Adv. 2024, 23, 200224. [Google Scholar] [CrossRef]
  2. Mahdi, H.; Morteza, O.; Yousef, A. Evaluation of positive and negative impacts of mining on sustainable development by a semi-quantitative method. J. Clean. Prod. 2022, 366, 132955. [Google Scholar]
  3. Blenda, L.S.; Bifano, I.C.; Moura, B.B.E.A.; Rocha, S.J.S.S.; Jacovine, L.A.G. Compensating the negative environmental impacts of mining with financial mechanisms in Brazil. Land. Use Policy 2021, 104, 105351. [Google Scholar]
  4. Prakash, A.; Gupta, R.P. Land-use mapping and change detection in a coal mining area—A case study in the Jharia coalfield, India. Int. J. Remote Sens. 1998, 19, 391–410. [Google Scholar] [CrossRef]
  5. Shi, X.; Peng, Y.; Wang, S.; Zhang, Y.; Zhang, J.; Song, H.; Cui, Y.; Sun, F.; Liu, H.; Xiao, Q.; et al. Revising the coal mining CH4 emission factor based on multiple inventories and atmospheric inversion approach at one of the world’s largest coal production areas: Shanxi province, China. Sci. Total Environ. 2025, 965, 178616. [Google Scholar] [CrossRef]
  6. Larsen, R.K.; Boström, M.; District, M.R.H.; District, V.S.R.H.; Wik-Karlsson, J. The impacts of mining on Sámi lands: A knowledge synthesis from three reindeer herding districts. Extr. Ind. Soc. 2022, 9, 101051. [Google Scholar]
  7. Li, L.; Li, W.; Wang, Q. Prediction and zoning of the impact of underground coal mining on groundwater resources. Process. Saf. Environ. 2022, 168, 454–462. [Google Scholar] [CrossRef]
  8. Schueler, V.; Kuemmerle, T.; Schroder, H. Impacts of Surface Gold Mining on Land Use Systems in Western Ghana. Ambio 2011, 40, 528–539. [Google Scholar] [CrossRef]
  9. Sheoran, V.; Sheoran, A.S.; Poonia, P. Soil reclamation of abandoned mine land by revegetation: A review. Int. J. Soil Sediment. Water 2010, 3, 13. [Google Scholar]
  10. Rocha-Nicoleite, E.; Overbeck, G.E.; Müller, S.C. Degradation by coal mining should be priority in restoration planning. Perspect. Ecol. Conserv. 2017, 15, 202–205. [Google Scholar] [CrossRef]
  11. Yu, H.C.; Bian, Z.F.; Chen, F. Dynamic mechanism of land ecological restoration in mining area: Based on land degradation neutrality (LDN) Framework. China Land Sci. 2020, 34, 86–95. [Google Scholar]
  12. Yu, H.C.; Bian, Z.F.; Yin, D.Y. Solutions to Territorial Ecological Protection and Restoration with Land Degradation Neutrality (LDN) Orientation. China Land Sci. 2023, 37, 1–10. [Google Scholar]
  13. Yu, H.C. Measurement and Regulation Strategies of Land Ecosystem Degradation for Desert Mining Area in Xinjiang. PhD Thesis, China University of Mining and Technolog, Xuzhou, China, 2021. [Google Scholar]
  14. Venkateswarlu, K.; Nirola, R.; Kuppusamy, S.; Thavamani, P.; Naidu, R.; Megharaj, M. Abandoned metalliferous mines: Ecological impacts and potential approaches for reclamation. Rev. Environ. Sci. Bio-Technol. 2016, 15, 327–354. [Google Scholar] [CrossRef]
  15. Bhuiyan, M.A.H.; Parvez, L.; Islam, M.A.; Dampare, S.B.; Suzuki, S. Heavy metal pollution of coal mine-affected agricultural soils in the northern part of Bangladesh. J. Hazard. Mater. 2010, 173, 384–392. [Google Scholar] [CrossRef]
  16. Li, L.; Lei, Y.L.; Pan, D.Y. Economic and environmental evaluation of coal production in China and policy implications. Nat. Hazards 2015, 77, 1125–1141. [Google Scholar] [CrossRef]
  17. Razo, I.; Carrizales, L.; Castro, J.; Diaz-Barriga, F.; Monroy, M. Arsenic and heavymetal pollution of soil, water and sediments in a semi-arid climate mining area in Mexico. Water Air Soil Pollut. 2004, 152, 129–152. [Google Scholar] [CrossRef]
  18. Du, Y.; Hu, X.F.; Wu, X.H.; Shu, Y.; Jiang, Y.; Yan, X.J. Affects of mining activities on Cd pollution to the paddy soils and rice grain in Hunan province, Central South China. Environ. Monit. Assess. 2013, 185, 9843–9856. [Google Scholar] [CrossRef]
  19. Li, P.; Feng, X.B.; Shang, L.H.; Qiu, G.L.; Meng, B.; Liang, P.; Zhang, H. Mercury pollution from artisanal mercury mining in Tongren, Guizhou, China. Appl. Geochem. 2008, 23, 2055–2064. [Google Scholar]
  20. Li, Z.Y.; Ma, Z.W.; van der Kuijp, T.J.; Yuan, Z.W.; Huang, L. A review of soil heavy metal pollution from mines in China: Pollution and health risk assessment. Sci. Total Environ. 2014, 468, 843–853. [Google Scholar] [CrossRef]
  21. Acosta, J.A.; Faz, A.; Martinez-Martinez, S.; Zornoza, R.; Carmona, D.M.; Kabas, S. Multivariate statistical and GIS-based approach to evaluate heavy metals behavior in mine sites for future reclamation. J. Geochem. Explor. 2011, 109, 8–17. [Google Scholar] [CrossRef]
  22. Simón, M.; Ortiz, I.; Garcia, I.; Fernandez, E.; Fernandez, J.; Dorronsoro, C.; Aguilar, J. Pollution of soils by the toxic spill of a pyrite mine (Aznalcollar, Spain). Sci. Total Environ. 1999, 242, 105–115. [Google Scholar] [CrossRef] [PubMed]
  23. Wang, X.Q.; He, M.C.; Xie, J.; Xi, J.H.; Lu, X.F. Heavy metal pollution of the world largest antimony mine-affected agricultural soils in Hunan province (China). J. Soils Sediments 2010, 10, 827–837. [Google Scholar] [CrossRef]
  24. Equeenuddin, S.M.; Tripathy, S.; Sahoo, P.K.; Panigrahi, M.K. Hydrogeochemical characteristics of acid mine drainage and water pollution at Makum Coalfield, India. J. Geochem. Explor. 2010, 105, 75–82. [Google Scholar] [CrossRef]
  25. Andres, P.; Mateos, E. Soil mesofaunal responses to post-mining restoration treatments. Appl. Soil Ecol. 2006, 33, 67–78. [Google Scholar] [CrossRef]
  26. Hilson, G. Abatement of mercury pollution in the small-scale gold mining industry: Restructuring the policy and research agendas. Sci. Total Environ. 2006, 362, 1–14. [Google Scholar] [CrossRef]
  27. Macias, F.; Caraballo, M.A.; Rotting, T.S.; Perez-Lopez, R.; Nieto, J.M.; Ayora, C. From highly polluted Zn-rich acid mine drainage to non-metallic waters: Implementation of a multi-step alkaline passive treatment system to remediate metal pollution. Sci. Total Environ. 2012, 433, 323–330. [Google Scholar] [CrossRef]
  28. Chen, Y. Pollution Status of Heavy Metals in China’s Metallic Mining Areas and Treatment Measures Concerned. In Legislation, Technology and Practice of Mine Land Reclamation, 1st ed.; Hu, Z., Ed.; Crc Press: London, UK, 2014; pp. 435–441. [Google Scholar]
  29. Akcil, A.; Koldas, S. Acid Mine Drainage (AMD): Causes, treatment and case studies. J. Clean. Prod. 2006, 14, 1139–1145. [Google Scholar] [CrossRef]
  30. Zhang, L.; Wang, J.M.; Feng, Y. Life cycle assessment of opencast coal mine production: A case study in Yimin mining area in China. Environ. Sci. Pollut. Res. 2018, 25, 8475–8486. [Google Scholar] [CrossRef]
  31. Grant, C.D. State-and-transition successional model for bauxite mining rehabilitation in the jarrah forest of western Australia. Restor. Ecol. 2006, 14, 28–37. [Google Scholar] [CrossRef]
  32. Lei, K.; Pan, H.Y.; Lin, C.Y. A landscape approach towards ecological restoration and sustainable development of mining areas. Ecol. Eng. 2016, 90, 320–325. [Google Scholar] [CrossRef]
  33. Neri, A.C.; Sanchez, L.E. A procedure to evaluate environmental rehabilitation in limestone quarries. Environ. Manag. 2010, 91, 2225–2237. [Google Scholar] [CrossRef] [PubMed]
  34. Doley, D.; Audet, P.; Mulligan, D.R. Examining the Australian context for post-mined land rehabilitation: Reconciling a paradigm for the development of natural and novel ecosystems among post-disturbance landscapes. Agric. Ecosyst. Environ. 2012, 163, 85–93. [Google Scholar] [CrossRef]
  35. Anawar, H.M.; Canha, N.; Santa-Regina, I.; Freitas, M.C. Adaptation, tolerance, and evolution of plant species in a pyrite mine in response to contamination level and properties of mine tailings: Sustainable rehabilitation. J. Soils Sediments 2013, 13, 730–741. [Google Scholar] [CrossRef]
  36. Song, M.L.; Wang, S.H.; Cen, L. Comprehensive efficiency evaluation of coal enterprises from production and pollution treatment process. J. Clean. Prod. 2015, 104, 374–379. [Google Scholar] [CrossRef]
  37. Liu, J.; Liu, H.F.; Yao, X.L.; Liu, Y. Evaluating the sustainability impact of consolidation policy in China’s coal mining industry: A data envelopment analysis. Clean. Prod. 2016, 112, 2969–2976. [Google Scholar] [CrossRef]
  38. Wang, R.; Cheng, J.H.; Zhu, Y.L.; Xiong, W.W. Research on diversity of mineral resources carrying capacity in Chinese mining cities. Resour. Policy 2016, 47, 108–114. [Google Scholar] [CrossRef]
  39. Li, Y.; Chi, Y.H.; Lin, T.Y. Coal production efficiency and land destruction in China’s coal mining industry. Resour. Policy 2019, 63, 101449. [Google Scholar] [CrossRef]
  40. Wang, K.; Lu, B.; Wei, Y.M. China’s regional energy and environmental efficiency: A Range-Adjusted Measure based analysis. Appl. Energy 2013, 112, 1403–1415. [Google Scholar] [CrossRef]
  41. Shi, Z.; Wu, Y.J.; Chiu, Y.; Wu, F.P.; Shi, C.F. Dynamic Linkages among Mining Production and Land Rehabilitation Efficiency in China. Land 2020, 9, 76. [Google Scholar] [CrossRef]
  42. Chen, Y.; Zhu, J. Measuring information technology’s indirect impact on firm performance. Inf. Technol. Manag. 2004, 5, 9–22. [Google Scholar] [CrossRef]
  43. Liu, Y.Z. Study on the effect of extreme precipitation on mining production in China. Master’s Thesis, Shandong Normal University, Jinan, China, 2020. [Google Scholar]
  44. National Bureau of Statistics of China. China Statistical Yearbook 2018, 1st ed.; China Statistics Press: Beijing, China, 2018; pp. 69–304.
  45. National Bureau of Statistics of China. China Statistical Yearbook 2019, 1st ed.; China Statistics Press: Beijing, China, 2019; pp. 69–304.
  46. National Bureau of Statistics of China. China Statistical Yearbook 2020, 1st ed.; China Statistics Press: Beijing, China, 2020; pp. 69–304.
  47. National Bureau of Statistics of China. China Statistical Yearbook 2021, 1st ed.; China Statistics Press: Beijing, China, 2021; pp. 69–304.
  48. National Bureau of Statistics of China. China Statistical Yearbook 2022, 1st ed.; China Statistics Press: Beijing, China, 2022; pp. 69–304.
  49. Ministry of Natural Resources of the People’s Republic of China. China Land and Resources Statistical Yearbook 2018, 1st ed.; Geological Publishing House: Beijing, China, 2019; pp. 48–49.
  50. Ministry of Natural Resources of the People’s Republic of China. China Natural Resources Statistical Yearbook 2019, 1st ed.; Geological Publishing House: Beijing, China, 2020; pp. 70–71.
  51. Ministry of Natural Resources of the People’s Republic of China. China Natural Resources Statistical Yearbook 2020, 1st ed.; Geological Publishing House: Beijing, China, 2021; pp. 70–71.
  52. Ministry of Natural Resources of the People’s Republic of China. China Natural Resources Statistical Yearbook 2021, 1st ed.; Geological Publishing House: Beijing, China, 2022; pp. 70–71.
  53. Ministry of Natural Resources of the People’s Republic of China. China Natural Resources Statistical Yearbook 2022, 1st ed.; Geological Publishing House: Beijing, China, 2023; pp. 70–71.
  54. Ministry of Ecology and Environment. China Statistical Yearbook on Environment 2018, 1st ed.; China Statistics Press: Beijing, China, 2018; pp. 68–69.
  55. Ministry of Ecology and Environment. China Statistical Yearbook on Environment 2019, 1st ed.; China Statistics Press: Beijing, China, 2019; pp. 68–69.
  56. Ministry of Ecology and Environment. China Statistical Yearbook on Environment 2020, 1st ed.; China Statistics Press: Beijing, China, 2020; pp. 68–69.
  57. Ministry of Ecology and Environment. China Statistical Yearbook on Environment 2021, 1st ed.; China Statistics Press: Beijing, China, 2021; pp. 68–69.
  58. Ministry of Ecology and Environment. China Statistical Yearbook on Environment 2022, 1st ed.; China Statistics Press: Beijing, China, 2022; pp. 68–69.
  59. Department of Social, Science and Technology, and Cultural Statistics, National Bureau of Statistics and Department of Strategic Planning, Ministry of Science and Technology. China Statistical Yearbook on Science and Technology 2018, 1st ed.; China Statistics Press: Beijing, China, 2018; pp. 37–55.
  60. Department of Social, Science and Technology, and Cultural Statistics, National Bureau of Statistics and Department of Strategic Planning, Ministry of Science and Technology. China Statistical Yearbook on Science and Technology 2019, 1st ed.; China Statistics Press: Beijing, China, 2019; pp. 37–55.
  61. Department of Social, Science and Technology, and Cultural Statistics, National Bureau of Statistics and Department of Strategic Planning, Ministry of Science and Technology. China Statistical Yearbook on Science and Technology 2020, 1st ed.; China Statistics Press: Beijing, China, 2020; pp. 37–55.
  62. Department of Social, Science and Technology, and Cultural Statistics, National Bureau of Statistics and Department of Strategic Planning, Ministry of Science and Technology. China Statistical Yearbook on Science and Technology 2021, 1st ed.; China Statistics Press: Beijing, China, 2021; pp. 37–55.
  63. Department of Social, Science and Technology, and Cultural Statistics, National Bureau of Statistics and Department of Strategic Planning, Ministry of Science and Technology. China Statistical Yearbook on Science and Technology 2022, 1st ed.; China Statistics Press: Beijing, China, 2022; pp. 37–55.
  64. Luo, L.; Fan, Y. Influence of Spectator Experience on Behavioral Intentions: Mediated by Satisfaction and Moderated by Player Identification. J. Tianjin Univ. Sport. 2021, 36, 554–562. [Google Scholar]
  65. Kongar-Syuryun, C.; Babyr, N.; Klyuev, R.; Khayrutdinov, M.; Zaalishvili, V.; Agafonov, V. Model for Assessing Efficiency of Processing Geo-Resources, Providing Full Cycle for Development—Case Study in Russia. Resources 2025, 14, 51. [Google Scholar] [CrossRef]
Figure 1. Schematic diagram of model variables.
Sustainability 17 06052 g001
Figure 2. Mining-land restoration flow chart.
Sustainability 17 06052 g002
Figure 3. National distribution map of overall efficiency of 29 provinces (2017–2021).
Sustainability 17 06052 g003
Figure 4. Heat map of efficiency of 29 provinces (2017–2021).
Sustainability 17 06052 g004
Figure 5. Mining efficiencies: (a) Northeast China; (b) Eastern China; (c) Central China; (d) Western China.
Sustainability 17 06052 g005
Figure 6. Land restoration efficiencies: (a) Northeast China; (b) Eastern China; (c) Central China; (d) Western China.
Sustainability 17 06052 g006
Figure 7. Radar chart of average efficiency of mining stage and land restoration stage for 29 provinces (2017–2021).
Sustainability 17 06052 g007
Figure 8. Scatter plot of average efficiency of mining stage and land restoration stage for 29 provinces (2017–2021).
Sustainability 17 06052 g008
Figure 9. Structural equation model diagram of efficiency driving factors.
Sustainability 17 06052 g009
Table 1. Input and output variables.
Stage VariableUnit
Mining StageInputMining Employees10,000 people
OutputNon-Petroleum Mineral Resources10,000 tons
Destruction of Land AreaHectare
Land Restoration StageInputRestoration Investment10,000 RMB
OutputRestoration of Land AreaHectare
Carryover Fixed Assets’ Investment100 million RMB
Exogenous Factor Average Annual TemperatureCentigrade
Annual Precipitationmm
Sunshine DurationHour
Regional GDP100 million RMB
ECEP100 million RMB
R&D Institutions10,000 units
R&D Personnel10,000 people
Patents10,000 items
Table 2. Variables and data analysis.
VariableMeanMinMaxSD
Mining Employees (10,000 people)13.310 0.400 89.300 16.890
Non-Petroleum Mineral Resources (10,000 tons)32,161.000 515.140 125,966.610 25,152.130
Destruction of Land Area (Hectare)56,040.460 302.000 924,777.000 113,294.650
Restoration Investment (10,000 RMB)108,632.680 1581.000 849,398.000 134,726.270
Restoration of Land Area (Hectare)4025.250 32.000 30,491.000 5108.360
Fixed Assets’ Investment
(100 million RMB)
375.239 3.111 1722.780 289.390
Average Annual Temperature (Centigrade)14.790 5.100 25.800 5.150
Annual Precipitation (mm)953.620 145.500 2459.300 521.420
Sunshine Duration (Hour)2071.262 858.500 3421.400 550.000
Regional GDP (100 million RMB)32,295.420 2465.100 124,719.500 26,038.116
ECEP (100 million RMB)194.100 35.722 747.439 118.156
R&D Institutions (10,000 units)3329.145 27.000 32,938.000 6346.821
R&D Personnel (10,000 people)15.4920.25197.29520.937
Patents (10,000 items)3.6600.04434.0945.939
Table 3. Overall efficiency and annual efficiency of 29 provinces (2017–2021).
RegionProvinceOverall Efficiency20172018201920202021
NortheastLiaoning0.1630.1440.1480.1850.130.208
Jilin0.2340.090.0920.2940.540.155
Heilongjiang0.120.0520.0540.1660.090.238
EastBeijing0.1040.1030.1020.0940.0410.181
Fujian0.1940.160.180.1850.1290.315
Guangdong0.2170.1940.1930.1920.2240.28
Hainan0.250.2230.2040.4110.1540.259
Hebei0.250.2130.2110.2220.1220.479
Jiangsu0.1440.1860.1810.1090.0620.185
Shandong0.1450.1180.1220.1770.090.218
Tianjin0.1560.3240.3230.0190.0490.067
Zhejiang0.5470.5370.5370.5530.5440.561
CentralAnhui0.1990.2760.2710.2150.1070.128
Henan0.1810.2030.2070.110.1170.269
Hubei0.1780.1990.210.1440.1110.226
Hunan0.2060.1330.1370.1170.0780.567
Jiangxi0.4240.620.6640.1990.1550.481
Shanxi0.2150.3520.3470.0990.1310.146
WestGansu0.2910.3510.3470.2620.1940.3
Guangxi0.4150.3390.3420.2980.5760.52
Guizhou0.1390.1340.1320.2190.0920.116
Inner Mongolia0.4730.6920.6880.320.1980.467
Ningxia0.5340.5640.540.5570.5660.444
Qinghai0.2940.2540.2470.2250.1740.571
Shaanxi0.2080.1990.1950.1640.2770.204
Sichuan0.2530.4450.4460.0870.1210.165
Xinjiang0.5010.5330.5260.5880.1890.669
Yunnan0.2940.3420.3390.0930.1740.523
Chongqing0.1970.1640.1660.1290.1330.395
Table 4. Mining stage efficiency of 29 provinces (2017–2021).
RegionProvince20172018201920202021
NortheastLiaoning0.024 0.032 0.052 0.058 0.097
Jilin0.018 0.020 0.038 0.081 0.073
Heilongjiang0.013 0.015 0.027 0.047 0.070
EastBeijing0.014 0.013 0.035 0.003 0.034
Fujian0.178 0.220 0.159 0.101 0.093
Guangdong0.172 0.169 0.222 0.305 0.269
Hainan0.209 0.172 0.344 0.125 0.090
Hebei0.111 0.107 0.142 0.044 0.418
Jiangsu0.103 0.093 0.066 0.029 0.030
Shandong0.036 0.041 0.072 0.021 0.197
Tianjin0.009 0.008 0.007 0.013 0.011
Zhejiang1.000 1.000 1.000 1.000 1.000
CentralAnhui0.074 0.064 0.083 0.052 0.109
Henan0.072 0.078 0.042 0.026 0.251
Hubei0.134 0.156 0.074 0.125 0.089
Hunan0.066 0.073 0.086 0.072 0.246
Jiangxi0.272 0.362 0.140 0.137 0.146
Shanxi0.048 0.038 0.043 0.057 0.087
WestGansu0.088 0.081 0.099 0.034 0.287
Guangxi0.192 0.197 0.333 0.776 0.614
Guizhou0.054 0.050 0.060 0.036 0.083
Inner Mongolia0.384 0.376 0.103 0.116 0.125
Ningxia0.464 0.658 0.114 0.132 0.315
Qinghai0.093 0.080 0.087 0.047 0.142
Shaanxi0.062 0.054 0.031 0.140 0.203
Sichuan0.041 0.042 0.029 0.080 0.125
Xinjiang0.122 0.109 0.176 0.044 0.339
Yunnan0.069 0.062 0.066 0.073 0.260
Chongqing0.056 0.059 0.078 0.089 0.295
Table 5. Land restoration stage efficiency of 29 provinces (2017–2021).
RegionProvince20172018201920202021
NortheastLiaoning0.264 0.264 0.318 0.201 0.320
Jilin0.163 0.164 0.550 1.000 0.238
Heilongjiang0.092 0.093 0.306 0.133 0.407
EastBeijing0.191 0.191 0.154 0.079 0.327
Fujian0.141 0.141 0.212 0.156 0.538
Guangdong0.216 0.217 0.162 0.143 0.291
Hainan0.237 0.237 0.478 0.184 0.428
Hebei0.316 0.316 0.302 0.199 0.541
Jiangsu0.269 0.269 0.151 0.095 0.340
Shandong0.201 0.202 0.283 0.160 0.239
Tianjin0.639 0.639 0.031 0.085 0.123
Zhejiang0.074 0.074 0.107 0.089 0.122
CentralAnhui0.478 0.478 0.346 0.162 0.147
Henan0.335 0.336 0.179 0.208 0.287
Hubei0.263 0.263 0.214 0.097 0.363
Hunan0.200 0.200 0.148 0.084 0.888
Jiangxi0.967 0.967 0.259 0.174 0.817
Shanxi0.656 0.656 0.155 0.205 0.206
WestGansu0.613 0.613 0.426 0.353 0.313
Guangxi0.486 0.487 0.263 0.376 0.426
Guizhou0.213 0.213 0.378 0.148 0.150
Inner Mongolia1.000 1.000 0.537 0.281 0.808
Ningxia0.665 0.422 1.000 1.000 0.572
Qinghai0.415 0.415 0.364 0.301 1.000
Shaanxi0.336 0.336 0.298 0.413 0.204
Sichuan0.849 0.849 0.146 0.162 0.205
Xinjiang0.943 0.943 1.000 0.334 1.000
Yunnan0.615 0.615 0.119 0.276 0.787
Chongqing0.272 0.273 0.180 0.177 0.494
Table 6. Mining efficiency and land restoration efficiency of 29 provinces (2017–2021).
RegionProvinceMiningLand Restoration
NortheastLiaoning0.053 0.273
Jilin0.046 0.423
Heilongjiang0.034 0.206
EastBeijing0.020 0.188
Fujian0.150 0.238
Guangdong0.227 0.206
Hainan0.188 0.313
Hebei0.164 0.335
Jiangsu0.064 0.225
Shandong0.073 0.217
Tianjin0.009 0.303
Zhejiang1.000 0.093
CentralAnhui0.076 0.322
Henan0.094 0.269
Hubei0.116 0.240
Hunan0.109 0.304
Jiangxi0.211 0.636
Shanxi0.054 0.375
WestGansu0.118 0.464
Guangxi0.422 0.408
Guizhou0.057 0.220
Inner Mongolia0.221 0.725
Ningxia0.336 0.732
Qinghai0.090 0.499
Shaanxi0.098 0.318
Sichuan0.063 0.442
Xinjiang0.158 0.844
Yunnan0.106 0.482
Chongqing0.116 0.279
Table 7. Results of structural equation modeling.
Latent Factor Observed VariablesFactor LoadingsAVEHTMT Confidence Interval
ClimateTemperature0.9290.835Excluding 1
Sunshine Duration−0.865
Precipitation0.945
Policy and EconomicsRegional GDP0.9580.899Excluding 1
ECEP0.939
Science and Technology InnovationR&D Personnel0.990 0.984Excluding 1
Patents0.993
R&D Institutions0.992
Disclaimer/Publisher’s Note: The statements, opinions and data contained in all publications are solely those of the individual author(s) and contributor(s) and not of MDPI and/or the editor(s). MDPI and/or the editor(s) disclaim responsibility for any injury to people or property resulting from any ideas, methods, instructions or products referred to in the content.

