1. Introduction
Debris flows are one of the most destructive geological hazards in mountainous areas, characterized by rapid flows of water mixed with soil, rock, and other loose material. These flows often result in severe loss of life and property, particularly in steep and highly weathered regions under intense rainfall conditions [
1,
2,
3,
4]. In recent years, global climate change and intensified land use have increased the frequency and magnitude of rainfall-induced debris flows in semi-arid mountainous areas, such as western China [
5,
6].
To understand and mitigate such hazards, numerical modeling has emerged as a critical tool for simulating debris flow initiation, propagation, and deposition [
7,
8]. Various physically based models have been developed and applied in both academic and engineering practice. For instance, RAMMS (Rapid Mass Movements Simulation) is well-suited for modeling fast-moving, dry granular flows, especially in alpine terrains, and includes entrainment capabilities and avalanche-type rheologies. DAN3D, a depth-averaged model using Voellmy and Bingham flow laws, is effective for large-scale landslide runouts but often requires site-specific calibration. Debris-2D, a depth-averaged monophase model based on the shallow water equations, is widely used for simulating debris flow runout and hazard zoning, particularly in European and alpine contexts [
9]. In contrast, FLO-2D offers several distinct advantages: it incorporates a well-established grid-based flow solver for shallow water-like flows, supports a wide range of rheological parameters, and is relatively flexible for simulating hyper-concentrated debris flows in both urban and natural landscapes [
10,
11,
12]. Meanwhile, recent advances in two-phase debris flow models have further improved the physical realism of simulations by explicitly incorporating solid–fluid interactions and phase separation effects [
13,
14,
15,
16]. Compared with RAMMS and Debris-2D, FLO-2D is particularly advantageous for simulating rainfall-triggered debris flows in complex topography with high resolution over extended areas [
17,
18]. While RAMMS::Debrisflow provides highly detailed impact force modeling and entrainment capabilities, it is primarily designed for dry granular or snow-avalanche type flows and typically requires well-constrained initial conditions. Similarly, DAN3D is effective for modeling large-scale landslide runouts but is less suited to rainfall-triggered debris flows in catchments with ongoing sediment supply. In contrast, FLO-2D supports rainfall–runoff coupling and dynamic sediment-laden flow routing, which is critical for medium-scale mountainous basins with convective rainfall regimes and complex topography, such as Suyukou Gully.
Despite these advances, most existing studies have focused on large-scale debris flow basins or catastrophic historical events [
2,
7,
19], often overlooking the growing hazard potential in medium-scale tourist zones, where detailed, scenario-based debris flow modeling remains limited despite increasing seasonal exposure and evolving land use risks. In such contexts, even moderately sized debris flows can pose disproportionate threats due to the spatial concentration of vulnerable infrastructure and human activity. Scenic gullies in semi-arid regions, such as those in western China, frequently lack early warning systems and dynamic hazard assessments calibrated to modern hydrometeorological scenarios. Therefore, there is an urgent need to conduct high-resolution, scenario-based modeling of debris flows in such underrepresented environments to inform proactive risk governance and landscape management strategies.
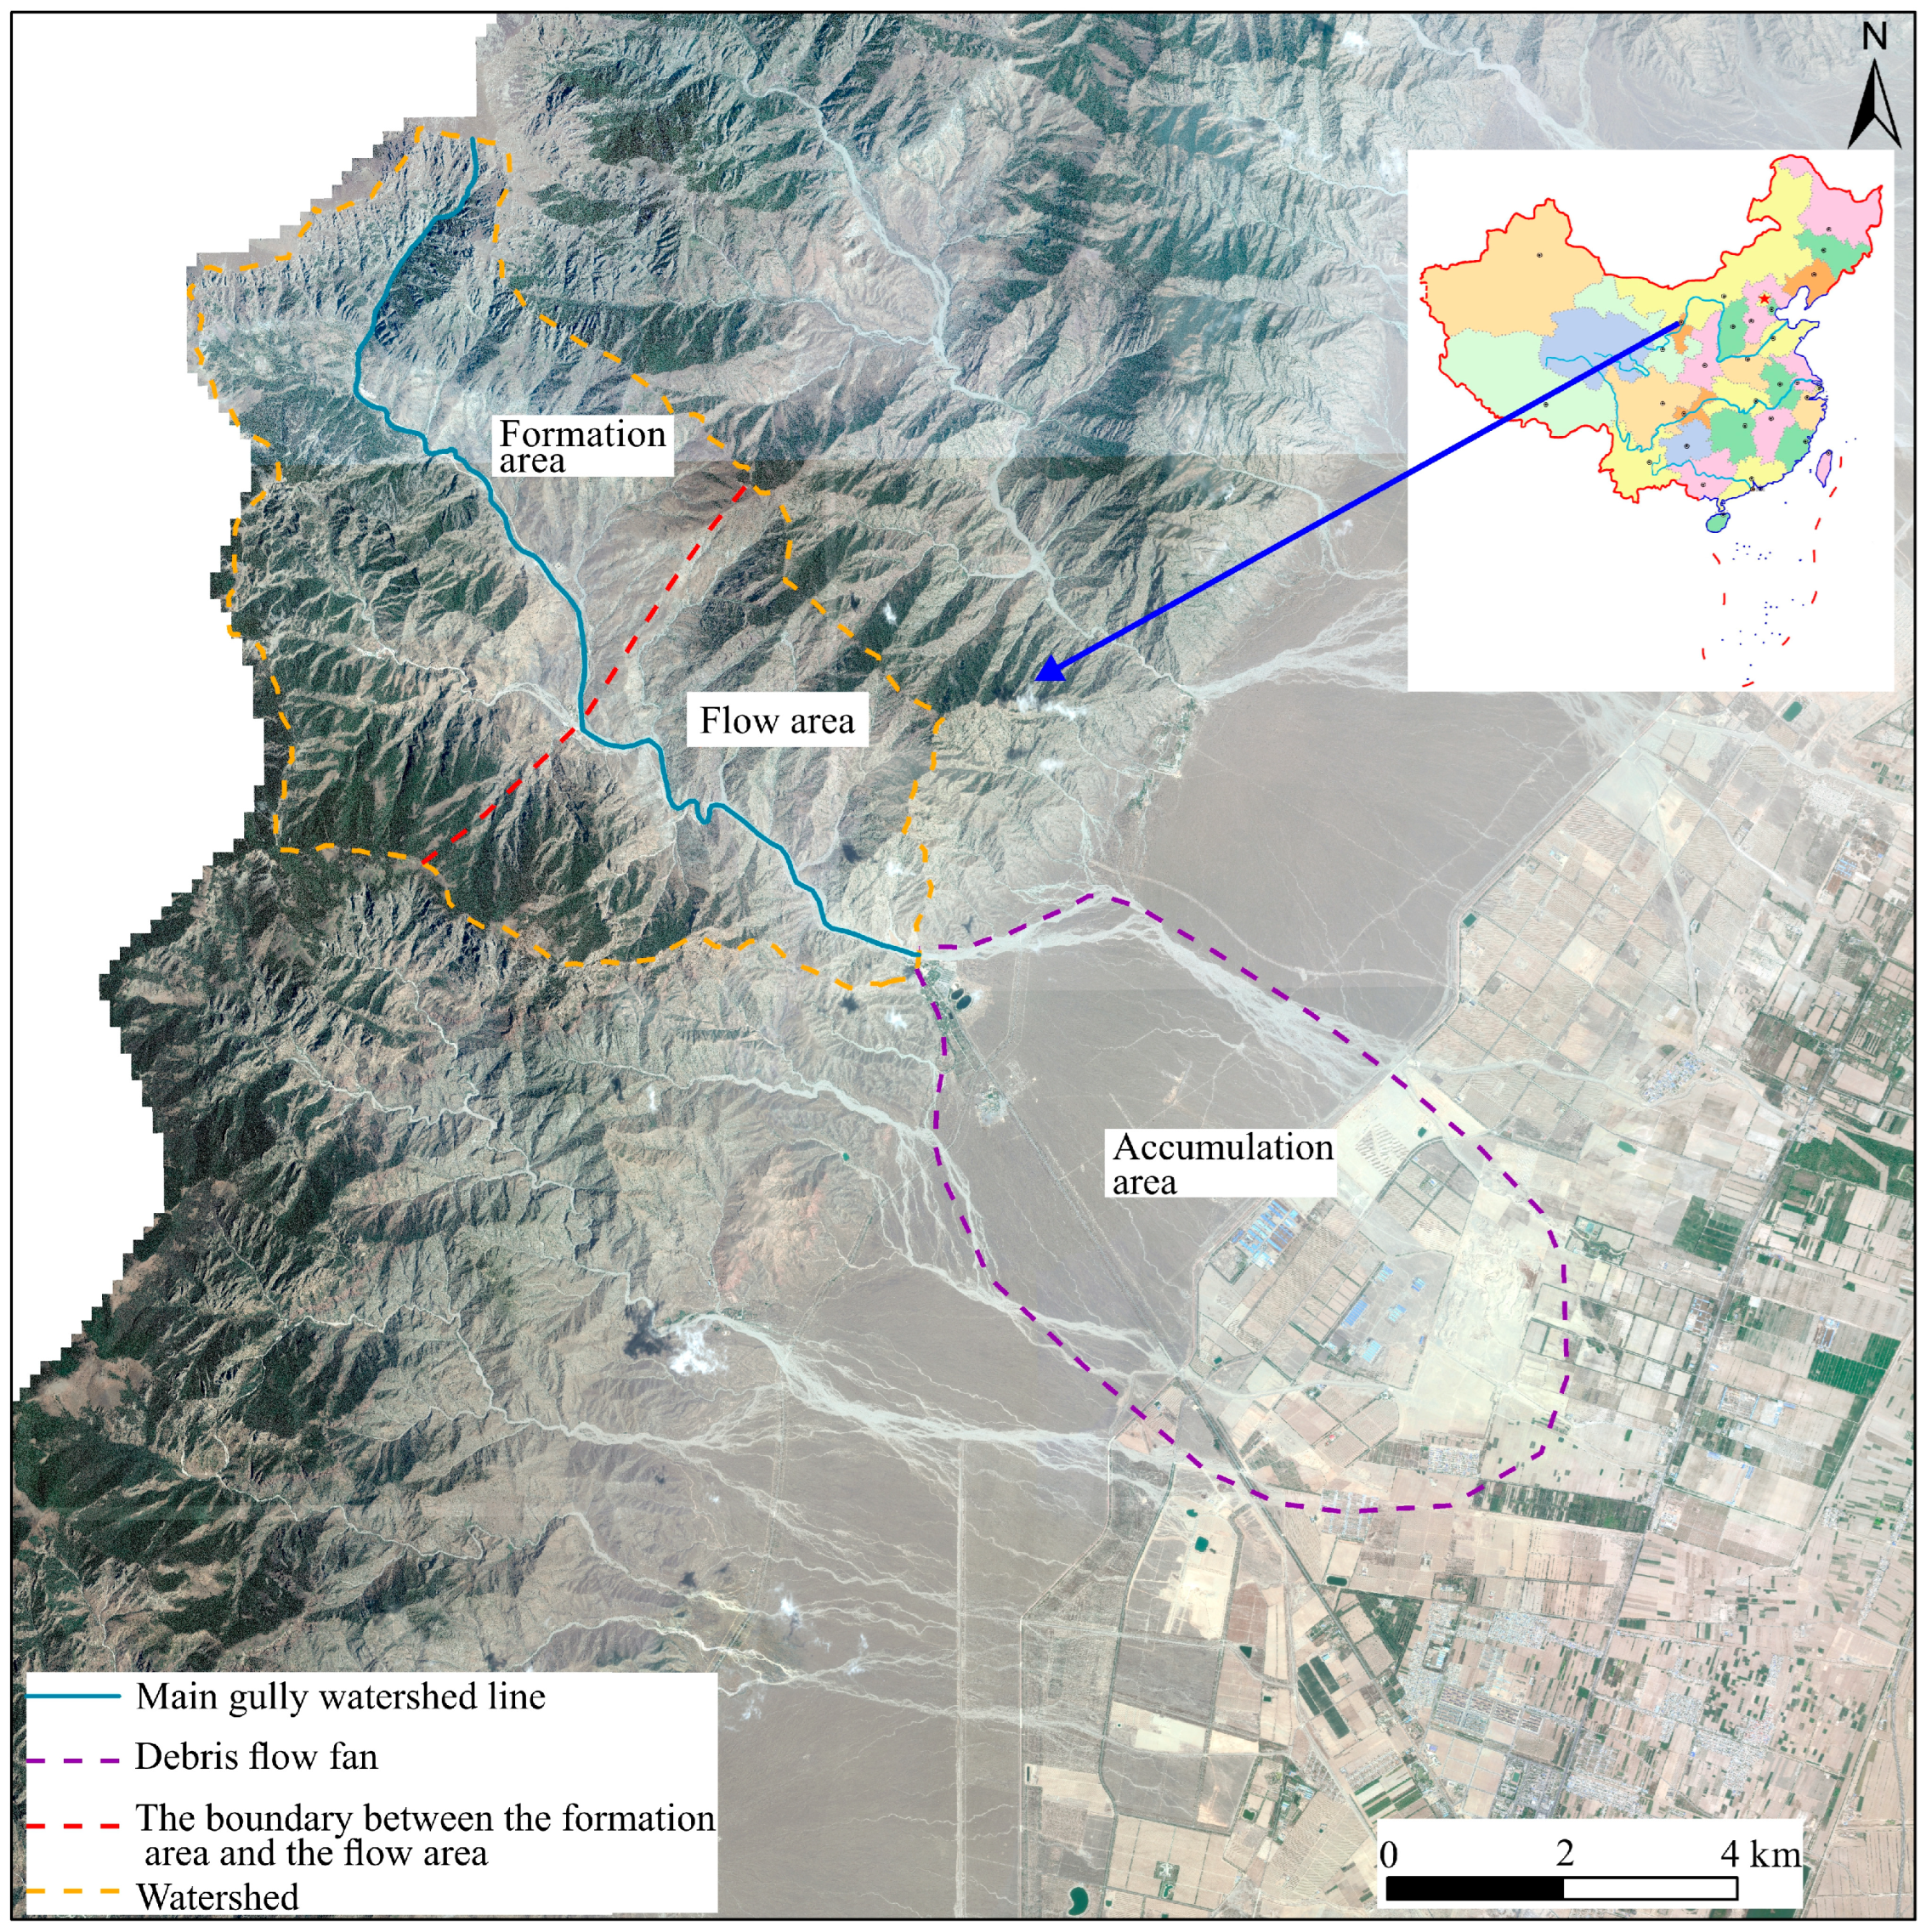
The Suyukou Gully catchment in Ningxia, China, was selected as the representative study area due to its high debris flow susceptibility and growing tourism-related risk. Here, we aim to develop a comprehensive understanding of debris flow behavior and risk in Suyukou Gully by applying the FLO-2D numerical model under multiple rainfall return periods (10-, 20-, 50-, and 100-year scenarios). This study is based on high-resolution DEM data (original 5 m DEM resampled to 20 m grid), field survey results, sediment property analysis, and design rainfall intensities. Our specific objectives are to (1) simulate the debris flow runout behavior and associated parameters, such as flow depth, velocity, and flow depth distributions; (2) delineate the hazard intensity zones based on dynamic indicators; (3) evaluate hazard and exposure patterns to support mitigation planning. The results of this study provide theoretical insights and practical tools for risk management in under-monitored mountainous tourist areas and demonstrate the feasibility of integrating process-based modeling with empirical calibration for effective hazard assessment.
Beyond hydrometeorological triggers, the regional geological structure plays a significant role in sustaining the debris flow activity. In addition to geomorphological and hydrological triggers, the development of debris flows in Suyukou Gully is closely associated with its regional tectonic setting. The gully lies within a NE–SW trending fault zone along the eastern margin of the Helan Mountains, where intense tectonic activity has led to widespread rock fragmentation, fault breccia formation, and closely spaced joint sets [
20,
21]. These structural features not only facilitate infiltration and frost-induced weathering but also produce a continuous source of unconsolidated debris through gravitational rockfall and thermal cracking [
22]. Structural dissection further enhances the slope instability, promoting shallow landsliding and channel bank collapse during extreme rainfall. These litho-structural conditions provide the fundamental basis for sustained debris flow activity in the region and justify the selection of Suyukou Gully as a representative site for process-based modeling and hazard assessment.
3. Methodology: Numerical Simulation and Parameter Setting
3.1. Overview of the FLO-2D Model
While a full model chain integrating separate hydrological, triggering, and hydraulic components [
14,
24,
25] is ideal for comprehensive simulation of runoff-generated debris flows, this study employed a semi-coupled approach within FLO-2D. The rainfall input (hyetograph) and time-varying sediment concentration (Cv) were used to implicitly represent runoff generation and sediment mobilization processes, which is a commonly accepted method for medium-scale, data-limited catchments. Future work could explore further refinement with explicit hydrological–triggering–hydraulic coupling. As Suyukou Gully is a steep, rocky headwater catchment with limited soil cover and abundant loose colluvium, the use of a semi-coupled rainfall–runoff approach in FLO-2D is appropriate, as demonstrated in similar headwater debris flow studies [
24,
25]. Future improvements could explore integration with dedicated hydrological models for such catchments.
FLO-2D is a grid-based two-dimensional model used extensively for simulating flood and debris flow processes across complex topography [
10]. It solves the shallow water equations (Saint-Venant equations) in their depth-averaged form and incorporates a range of flow resistance and rheological formulations. For debris flows, the model accounts for non-Newtonian behavior using a composite viscoplastic model that includes yield stress and apparent viscosity terms [
11].
The FLO-2D model is a fixed-bed, monophase model, which means that it does not simulate erosion or deposition. However, it may limit the model’s ability to reproduce channel evolution or scour-depth variability in long-duration or highly erosive flows [
17]. For Suyukou Gully, where bedrock outcrops dominate and historical evidence suggests limited channel incision during past debris flows, the fixed-bed assumption was adopted to simplify the modeling framework and reduce computational complexity, consistent with the objectives of this study [
26].
In this study, a semi-coupled approach was adopted to model debris flow initiation and propagation. Design rainfall hyetographs were first developed for the selected return periods based on regional IDF curves. These hyetographs were then converted to inflow hydrographs using rainfall–runoff transformation relationships calibrated from historical event data and catchment response characteristics. The resulting hydrographs, representing superficial flow at the channel headwaters, were applied as inflow boundary conditions in FLO-2D. The debris flow rheology (Cv, τy, η) was controlled dynamically during the simulation based on the sediment availability and entrainment potential derived from the field survey and sediment source analysis. No separate hydrological model was used; instead, the transformation from rainfall to debris flow was incorporated through a Cv-based flow property control within FLO-2D.
3.2. Input Data and Preprocessing
- (1)
Topography
The terrain model used in this study was derived from a 5 m resolution Digital Elevation Model (DEM) provided by the Ningxia Geological Survey Institute. To balance resolution and computational efficiency, the DEM was resampled to 20 × 20 m using bilinear interpolation. Preprocessing included hydrological conditioning (sink filling and stream burning) in ArcGIS, followed by format conversion to ASCII grids compatible with FLO-2D. It is acknowledged that the resampling to a 20 m grid resolution may introduce certain limitations in capturing small-scale topographic features and flow channelization, as noted by [
27,
28]. However, the 20 m resolution was selected to balance the computational efficiency with sufficient terrain representation for catchment-scale debris flow modeling.
- (2)
Rainfall Data
Design storm profiles for 10-, 20-, 50-, and 100-year return periods were obtained from the Ningxia Rainstorm and Flood Atlas (2016 edition). The Suyukou regional rain gauge data were used to verify the intensity–duration–frequency (IDF) relationship and calibrate rainfall disaggregation. Each rainfall event was modeled as a single-peak hyetograph with front-loaded intensity, representing convective storm characteristics typical of the region [
20]. The hyetographs were discretized into 10 min intervals, with total rainfall depths of 38.5 mm (10-year), 52.3 mm (20-year), 69.4 mm (50-year), and 85.2 mm (100-year), respectively.
- (3)
Sediment and Geotechnical Data
Debris material properties were derived from field samples collected in the source and transport zones. A particle size analysis confirmed a coarse-grained distribution with over 85% of particles in the 2–200 mm range, indicative of low-cohesion, granular flow regimes [
22]. For the model rheology, yield stress and viscosity were computed as exponential functions of volume concentration (Cv), based on established empirical relationships [
11].
- (4)
Land Use and Roughness
Land cover types were classified using satellite imagery and field reconnaissance. Based on the classifications, Manning’s roughness coefficients
n were assigned as follows: main gully: 0.23 s·m
−1/3; vegetated slopes: 0.28 s·m
−1/3; paved road surfaces: 0.05 s·m
−1/3. These values are within the recommended range of the FLO-2D technical manual and have been used in comparable studies [
11,
18].
3.3. Simulation Parameters and Calibration
The FLO-2D model was calibrated using both field evidence and literature references [
17,
18].
Table 1 summarizes the core parameters. Model calibration was conducted by comparing simulation outputs with field observations of past debris flow extents. The spatial deviation of the simulated flow front from the observed deposition limit was less than 350 m under the 100-year scenario, indicating good model reliability. To enhance the credibility of model parameters, a comparative analysis was conducted between the selected input values and both regional case studies and FLO-2D guideline recommendations.
The final selection of model parameters was informed by both local field data and comparisons with regional studies and FLO-2D guideline recommendations. For example, a volume concentration value of Cv = 0.35 was adopted for the initial model setup, based on field observations of sediment grain-size distribution, lithology, and source material characteristics, and calibrated referencing similar debris flow studies in semi-arid catchments [
11,
17,
18]. No direct measurement of Cv in the flowing mixture was performed, as this variable is difficult to measure directly in the field. This value is slightly higher than the 0.30 baseline commonly used in FLO-2D simulations [
11], reflecting the abundance of large angular clasts and low clay content observed in the field.
Similarly, the derived yield stress τ
y and viscosity η were computed using the exponential empirical relations with Cv provided in the FLO-2D technical documentation. When compared with literature values, the resulting τ
y range (2.8–4.5 kPa) is compatible with coarse-channel debris flow cases reported in [
18] and falls within the recommended range for non-Newtonian Bingham flows. The dynamic viscosity η ranged between 60 and 105 Pa·s, again higher than typical values for matrix-supported flows, but justified by the observed field particle size composition dominated by sub-rounded to angular cobbles.
For the surface roughness, the Manning’s n values used (0.23–0.28 s·m
−1/3) are slightly higher than the default values recommended in the FLO-2D manual (0.15–0.20 s·m
−1/3) but are consistent with the values reported in [
11] for similar mountainous gully environments with a high surface roughness and vegetation cover. Specifically, the main channel was assigned n = 0.23 s·m
−1/3, vegetated slopes were assigned n = 0.28 s·m
−1/3, and paved roads n = 0.05 s·m
−1/3. These values were spatially distributed across the 20 m model grid based on land cover classification derived from field mapping and satellite imagery. These values fall slightly above the FLO-2D manual’s default for natural channels (0.15–0.20) but are in agreement with values applied in [
11] and reflect the significant surface irregularity and vegetation density in the gully environment.
Overall, these parameter selections reflect the localized geomorphological and sedimentological characteristics of Suyukou Gully while maintaining comparability with regional and model-standard ranges. The close match between calibrated simulation results and field-mapped deposition limits supports the suitability of these inputs and confirms the reliability of parameter transferability in similar tectonically active debris flow settings. In this study, the term “deposition” refers to areas of simulated flow thickening (increased flow depth) and decreased velocity under the fixed-bed framework, which are interpreted as potential depositional zones. The model does not simulate actual sediment mass accumulation or bed change.
The model calibration was conducted using spatial data from the 2014 debris flow event, including post-event SPOT-5 imagery and field surveys conducted in 2019. The calibration focused on matching the spatial extent of the deposition-prone area and front position. Given that the simulations used synthetic design rainfall hyetographs (return period-based) rather than the real event rainfall, the comparison was performed in a qualitative manner, aiming to reproduce the overall flow depth distribution and fan extent. The mapped deposition-prone area from the simulation showed a 7.6% difference in area compared to the observed extent of the 2014 debris deposits. The front position deviation was within 350 m. The flow depth and thickness were not directly compared due to the fixed-bed model assumptions and lack of direct field measurements of depth profiles from the event. This semi-quantitative calibration approach aligns with practices in similar debris-flow-modeling studies.
3.4. Boundary and Initial Conditions
Initial conditions assumed dry ground surface (zero initial depth), with the debris flow input initiated at upstream grid nodes based on the rainfall–runoff transformation. To account for catchment response time, a lag time of 10–15 min was applied, representing the estimated delay between rainfall onset and surface flow initiation in the steep source areas. This lag time was derived from previous field observations and regional hydrological response characteristics [
20].
Boundary conditions were set as follows: upstream boundary: closed (no inflow), flow initiated by rainfall; lateral boundaries: closed (no lateral exchange); outlet boundary: free-flow condition, allowing runout over fan surface.
The inflow boundary conditions were defined at the upper channel entry points, corresponding to the main tributary convergence zones identified from the DEM and field mapping. The inflow hydrographs were applied at these points as time series inputs. The conversion from hydrological discharge to debris flow mixture discharge was achieved by coupling the inflow hydrograph with time-varying Cv values, representing progressive sediment mobilization. Cv values increased during peak rainfall stages, reflecting enhanced sediment entrainment, and decreased during recessive stages (
Figure 2). This method allowed for the simulation to capture the dynamic evolution of the debris flow rheology as the flow propagated from initiation zones to deposition areas. The upstream inflow hydrograph reflects the cumulative runoff from the full contributing area above the gully head. However, an additional rainfall contribution along the middle and lower gully during routing was not explicitly modeled, which may lead to underestimation or overconcentration of discharge in some downstream segments. This simplification is a known limitation of fixed-hydrograph FLO-2D modeling under distributed rainfall conditions [
11,
29].
These conditions reflect the physical characteristics of Suyukou Gully, which lacks external inflow and is topographically bounded, with an open fan terminus. The computational domain extended beyond the mapped accumulation area and included the entire gully system and fan region. No artificial lateral boundaries or rigid walls were imposed; flow was controlled solely by the DEM-defined terrain.
3.5. Scenario Design and Output Analysis
To evaluate the debris flow behavior under different hydrometeorological conditions, four rainfall scenarios were simulated:
Scenario A: 10-year return period.
Scenario B: 20-year return period.
Scenario C: 50-year return period.
Scenario D: 100-year return period.
For each scenario, a synthetic hydrograph was generated, and the peak discharge (Q
p) was converted to debris flow discharge (Q
c) using a bulking factor based on Cv [
7]. Key outputs from the simulation included the following:
Maximum flow depth (m).
Maximum velocity (m·s−1).
Spatial distribution of deposition.
Hazard intensity classification based on H × V (depth × velocity).
Hazard zoning was performed in ArcGIS by reclassifying the FLO-2D outputs according to the international risk criteria [
30,
31]. These outputs served as the foundation for subsequent vulnerability and risk assessments.
Risk classification in this study was based on a matrix approach combining the hazard intensity and vulnerability level. The hazard zoning (
Section 4.3) was derived from the H × V product, classified into three levels (high, moderate, low). Vulnerability mapping used exposure data on infrastructure, population density, and land use. The risk matrix (3 × 3) was constructed by overlaying hazard and vulnerability layers in the GIS environment, assigning risk levels to each grid cell. The resulting risk zones were used to calculate area percentages for high-risk, moderate-risk, and low-risk categories.
3.6. Model Uncertainty and Sensitivity Analysis
The sensitivity analysis in this study focused on Cv and Manning’s
n because these two parameters are known to have the greatest influence on the flow rheology, velocity, and runout extent in debris flow modeling using FLO-2D [
11,
17]. Other parameters, such as initial flow depth, grid size, and laminar resistance coefficient, were fixed according to model guidelines and site conditions, and their effects were considered secondary compared to Cv and
n.
To evaluate the robustness of the model, the sensitivity analysis was conducted by varying two key parameters:
Volume concentration (Cv): varied ±0.05 s·m−1/3 from baseline (0.30–0.40 s·m−1/3).
Manning’s n: varied ±0.05 s·m−1/3 from base values.
The results show that increasing the Cv significantly decreased the flow mobility, reducing the runout by ~9.8% and increasing the deposition thickness. In contrast, decreasing the Manning’s n by 0.05 s·m−1/3 increased peak velocities by ~12% and shifted deposition zones downstream.
These findings suggest that parameter uncertainty—especially in Cv—has a greater influence on the hazard extent than roughness alone, underscoring the importance of accurate field-based sediment sampling. While the model does not account for entrainment or channel evolution, the input calibration and multi-scenario design help constrain predictive uncertainty to a manageable level for planning applications [
20].
4. Results and Discussion
4.1. Debris Flow Propagation Characteristics: A Four-Stage Dynamic Process
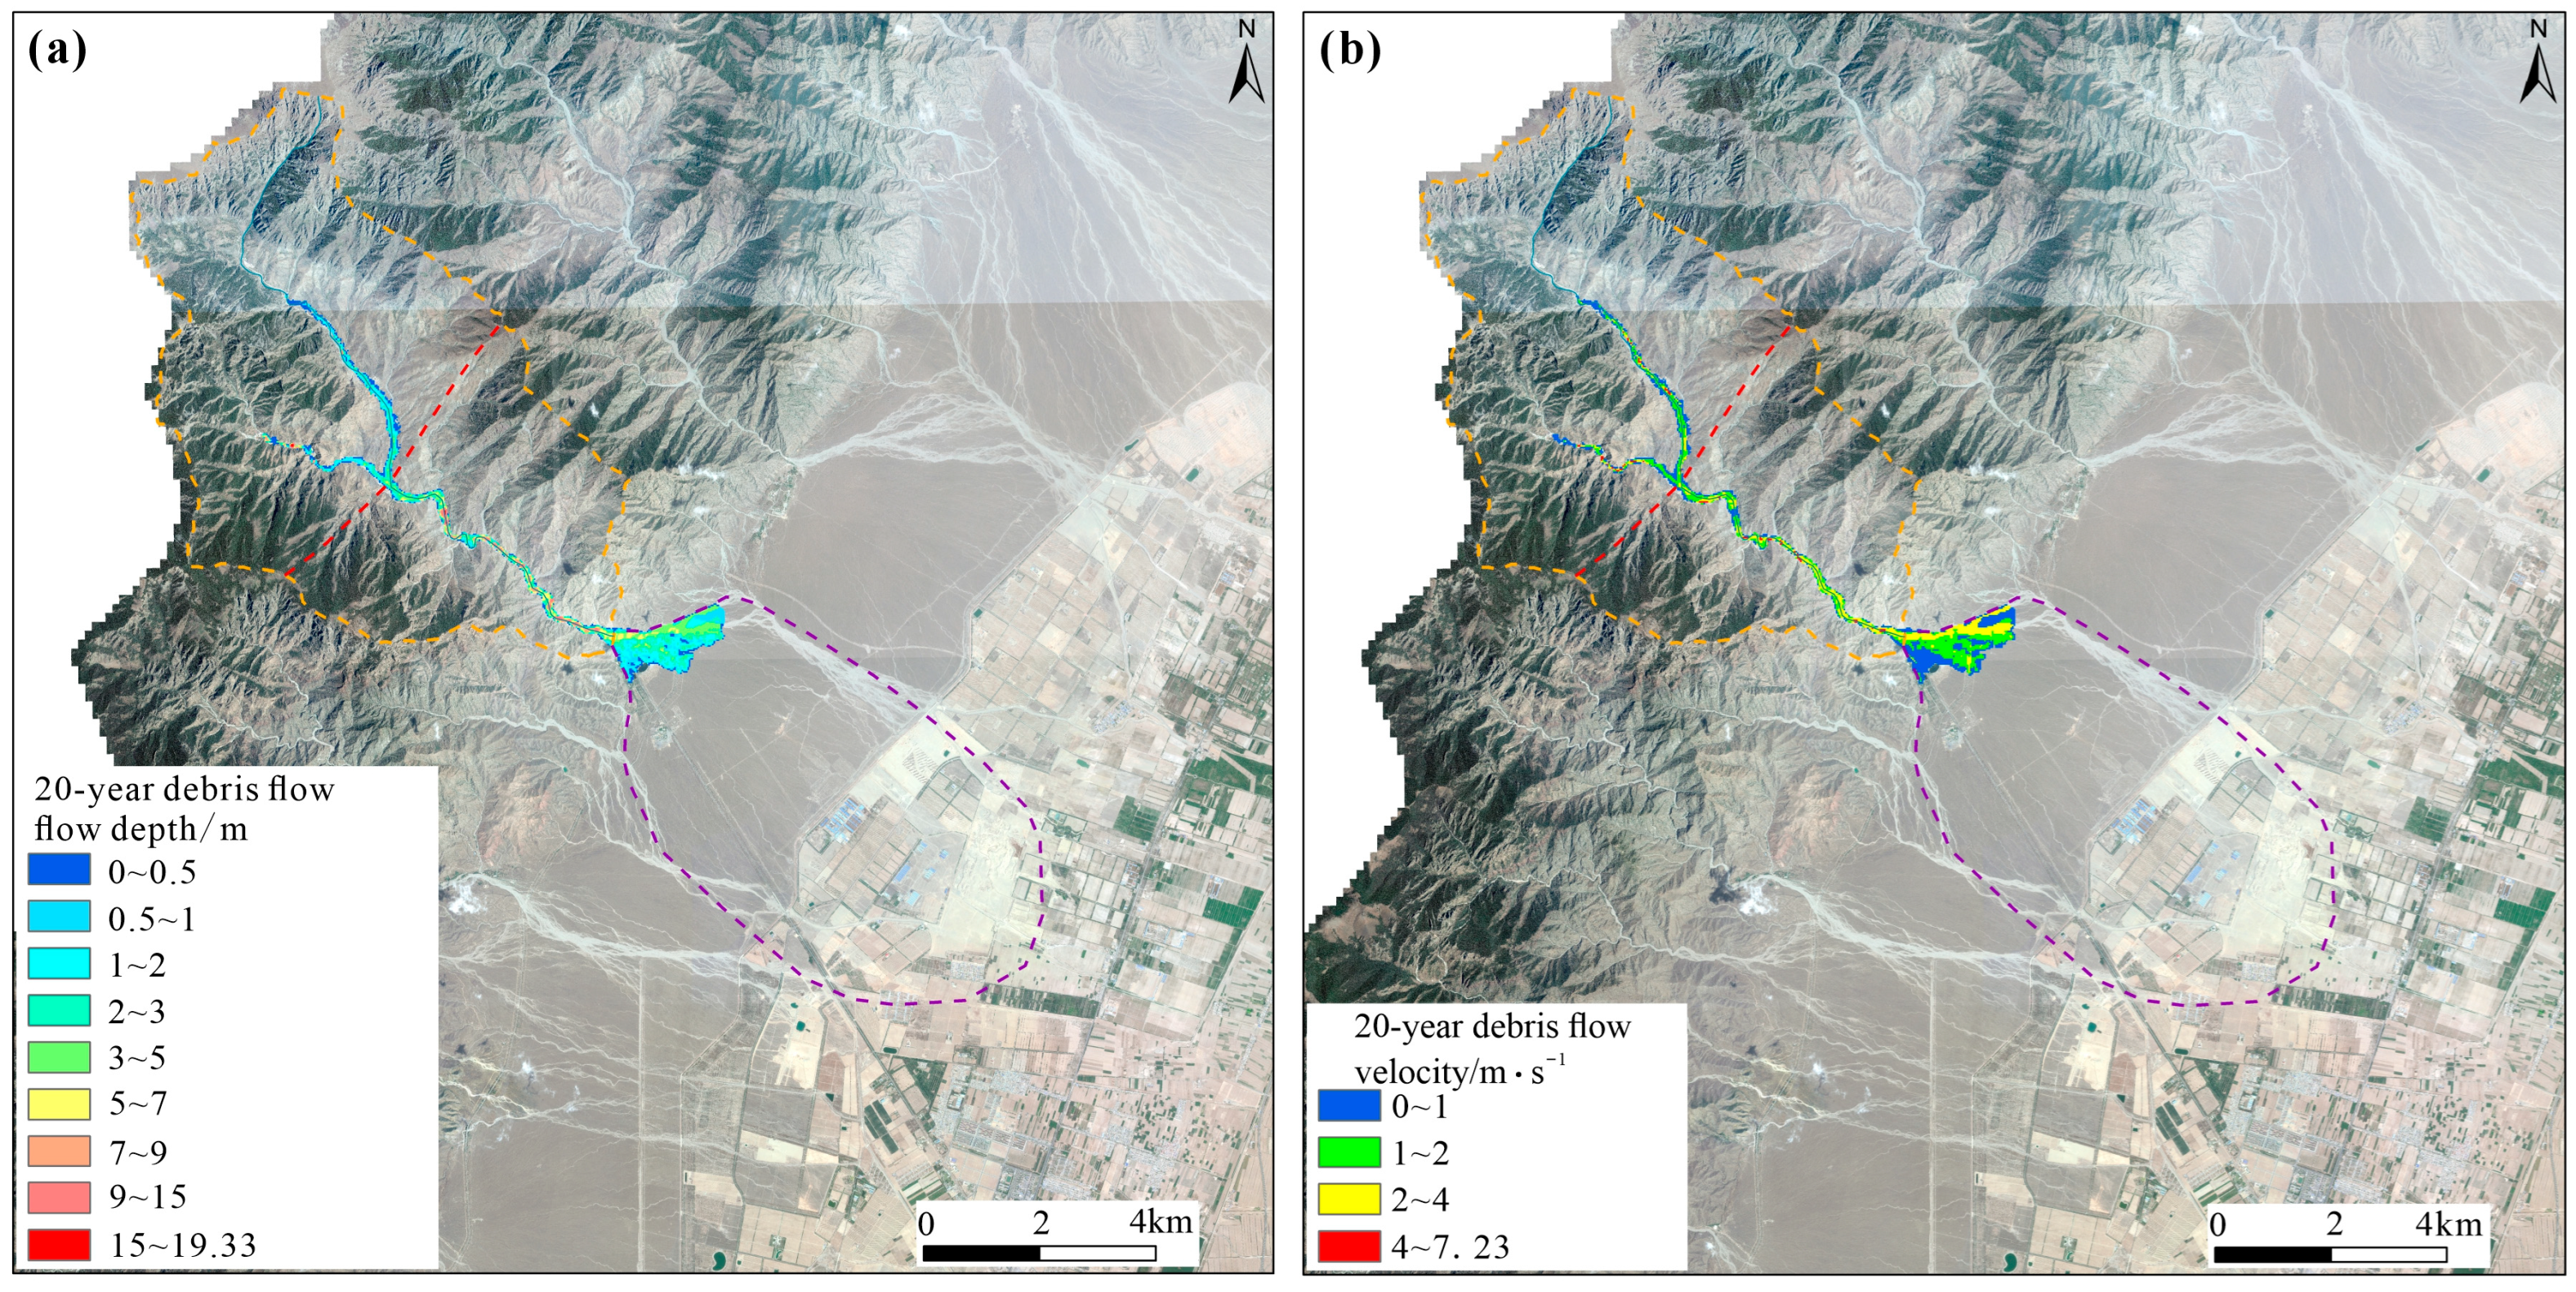
The following staged description of debris flow evolution is based on the modeled flow depth and velocity patterns from the FLO-2D simulation results. While the fixed-bed model does not simulate dynamic erosion or sediment accumulation, the spatial and temporal variations in the flow behavior allow for the interpretation of likely process stages in the flow evolution. The FLO-2D simulations captured the dynamic evolution of debris flows under four rainfall return periods (10-, 20-, 50-, and 100-year). The simulated flows exhibited typical characteristics of coarse-grained, high-density debris flows with distinct surge fronts and rapid peak formation. As the rainfall intensity increased, debris flows developed faster, achieved higher peak velocities, and mobilized greater volumes of sediment from the upper channel.
These modeled surging behaviors reflect not only hydrological responses but also physical sediment sourcing processes rooted in slope-channel coupling. Field investigations and simulation results jointly support a process chain linking hillslope water input, material detachment, and channel entrainment. During the initiation phase, intense rainfall rapidly saturates slope colluvium derived from tectonically fragmented bedrock. This saturation reduces shear strength, triggering small-scale sliding and slope wash. Once this material enters headwater channels, it is subjected to hydraulic entrainment under steep slopes and high runoff energy. The combination of steep longitudinal gradient (125.3‰), low channel roughness, and poorly sorted coarse sediments enables the rapid transition from runoff-dominated to debris-flow-dominated regimes. In the simulation, this is reflected by sudden acceleration in the flow velocity and a sharp rise in yield stress values in upper-channel cells. This mechanism is consistent with the debris flow formation pathways documented in tectonically active mountain belts across western China [
3,
20].
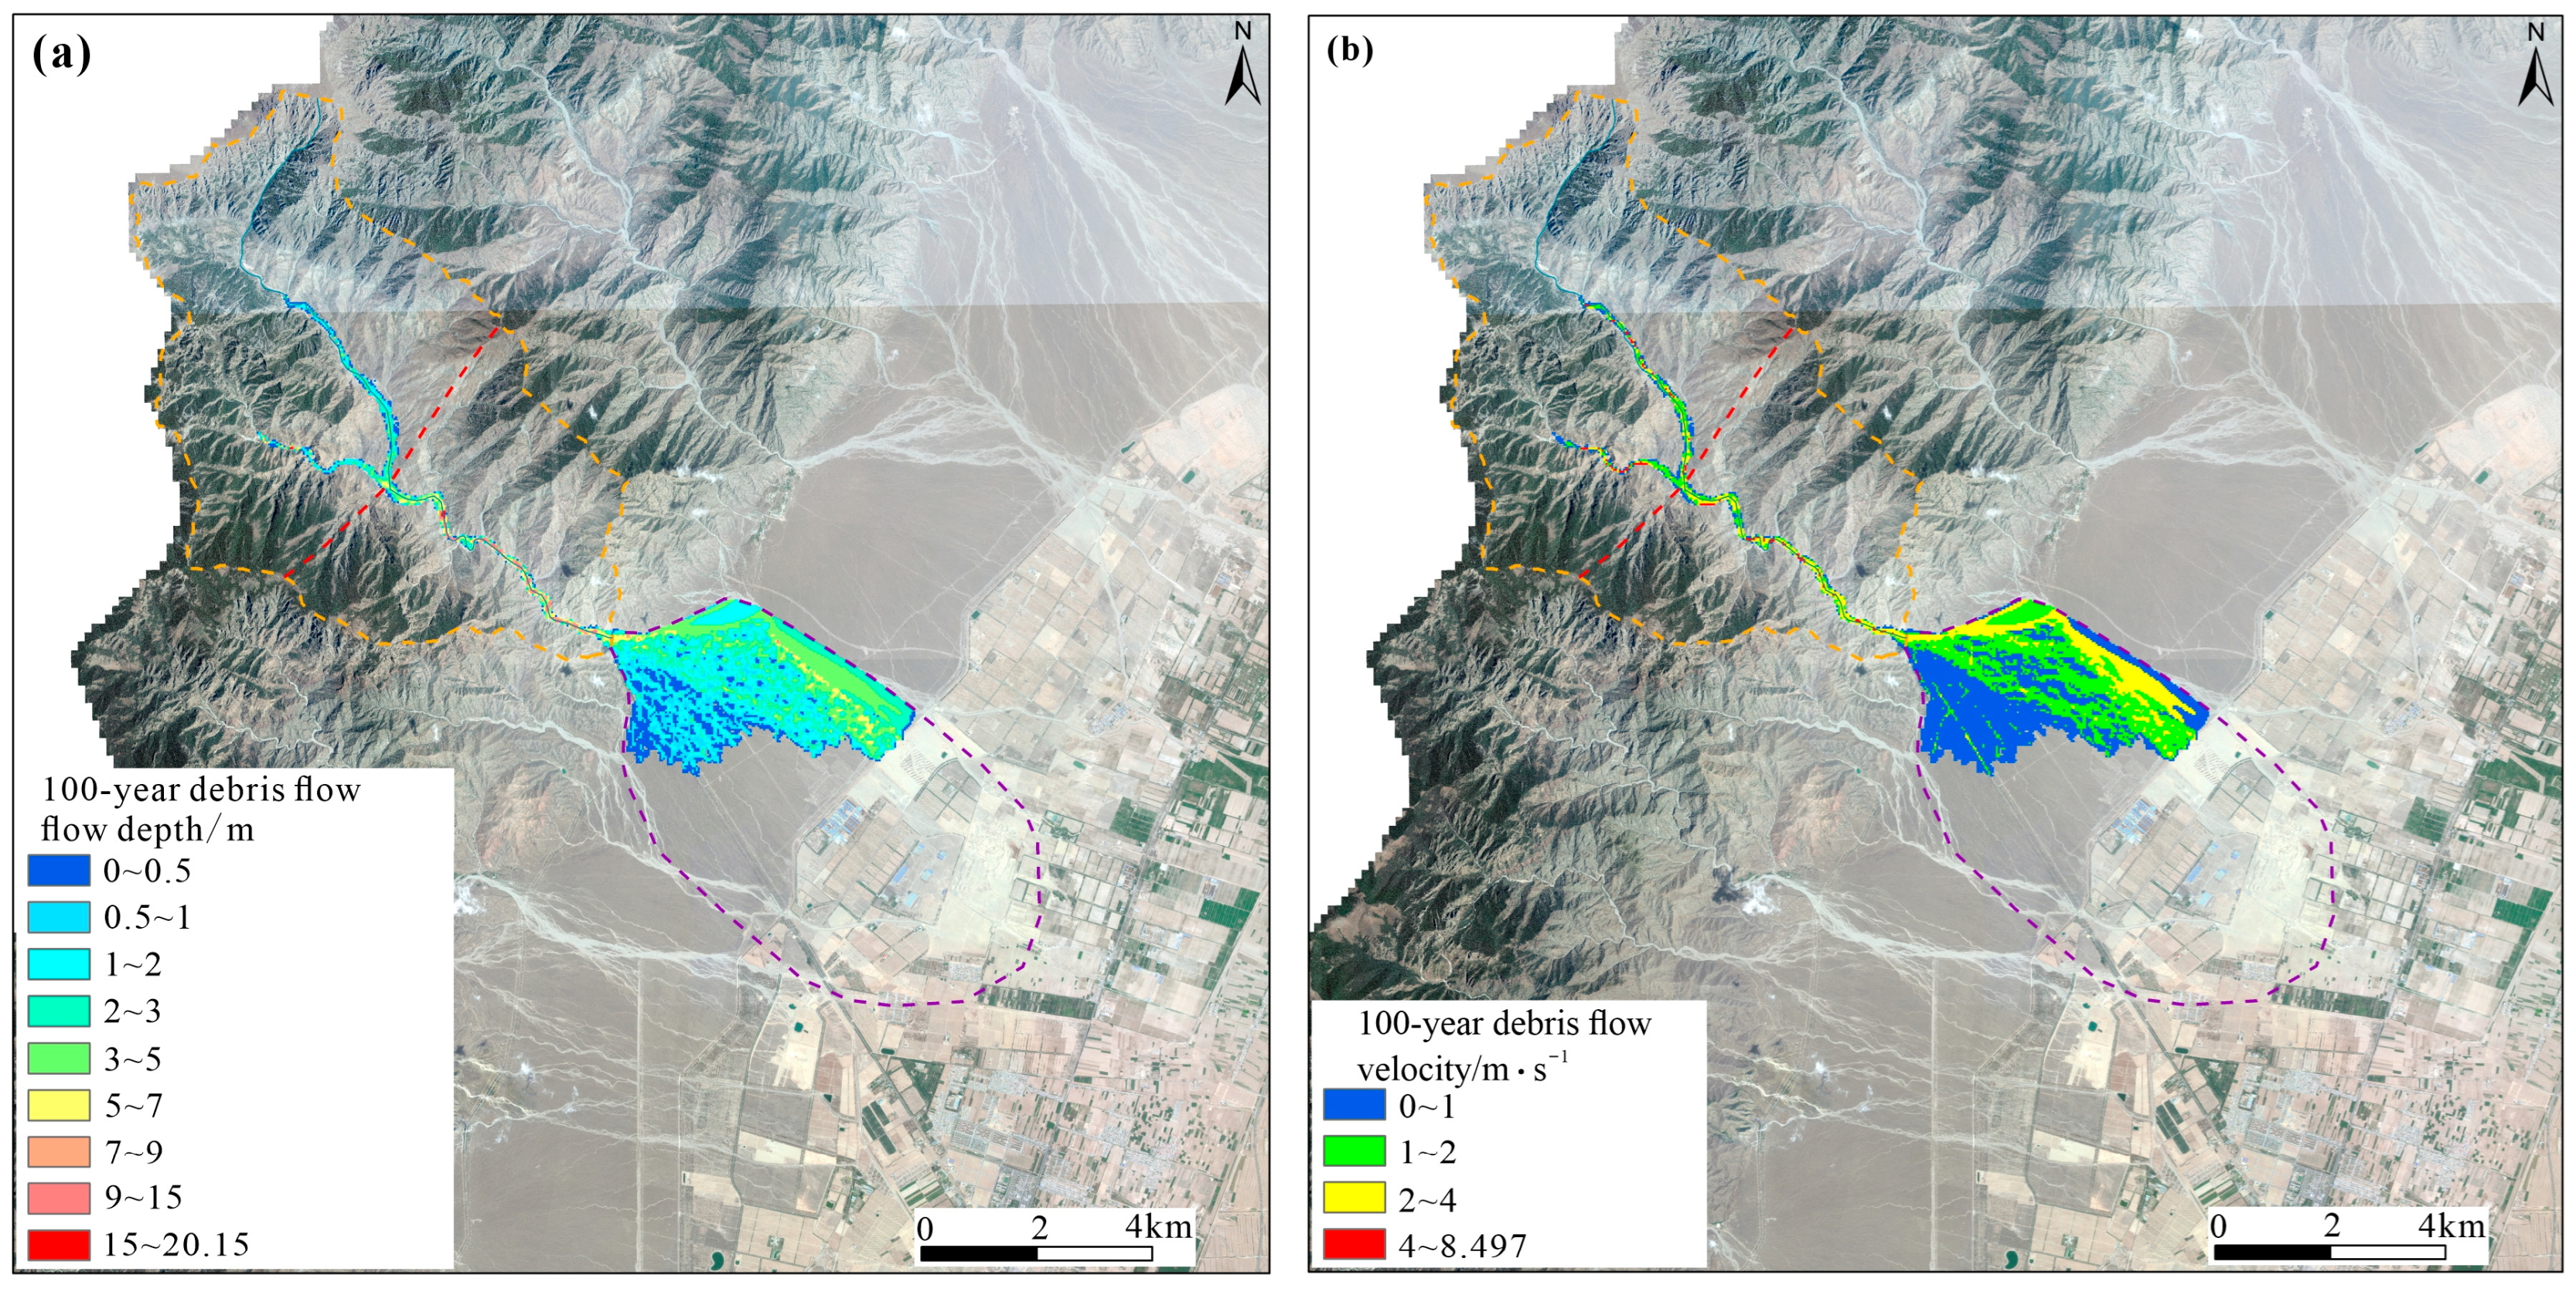
Under the 100-year scenario, the peak debris flow discharge reached 1195.88 m3/s, with maximum flow velocities up to 8.85 m·s−1 and flow depths exceeding 20 m in localized constrictions of the main channel. These extreme values were generally located in steep upstream sections and narrow bends, which acted as bottlenecks for flow convergence and energy concentration. This overall behavior can be further decomposed into four hydrodynamic stages observed across all simulation scenarios, which clarify the temporal evolution of the debris flow response and facilitate operational interpretation.
Initiation Phase (0–600 s): In the early phase of each simulation, rainfall infiltration on the steep slopes of the source zone saturates shallow colluvium, triggering local slope failures. These failures coincide with the formation of rapid surface runoff, which coalesces in rills and shallow channels. In the 100-year case, initiation occurs within the first 8–10 min, with sediment-laden surges forming in confined gullies and expanding quickly downstream.
Acceleration to Peak Phase (600–1800 s): Flow velocities increase as the rainfall intensity peaks and the sediment concentration rises. This stage is marked by the formation of quasi-stable surge fronts, characterized by steep flow depth gradients and coarse boulder transport. In the 100-year scenario, the peak flow discharge reaches 1195.88 m3/s, with maximum flow velocities of 8.85 m·s−1 and depths exceeding 20 m, especially at upstream channel constrictions. Dynamic confinement and convergence in this zone amplify flow intensity and internal shear stress.
Deposition Phase (1800–3000 s): As the flow exits the steep terrain into the depositional fan, kinetic energy rapidly decreases. Flow expansion, slope break, and reduced shear stress facilitate deposition. Coarse boulders settle near the fan apex, while fine fractions are transported further. Deposition is not uniform but exhibits episodic lobe formation, with alternating high-density surges and viscous tails.
Dissipation Phase (after 3000 s): Final stages are characterized by residual flow stagnation and laminar extension at the fan fringe. Channels bifurcate, and deposition zones broaden laterally. The flow ceases in low-gradient, vegetated terrain, with limited potential for remobilization under current conditions. This stage-based interpretation offers valuable insight for time-critical warning and emergency response strategies, especially when coupled with rainfall nowcasting and in situ flow detection (
Figure 3,
Figure 4,
Figure 5 and
Figure 6).
Moreover, the simulated propagation patterns reflect not only temporal rainfall forcing but also the geomorphic and mechanical feedbacks that underpin the debris flow evolution in Suyukou Gully. These spatiotemporal flow characteristics align closely with the observed topographic and sedimentary settings, suggesting that the initiation and mobilization of debris flows in this basin are governed by a coupled mechanism involving hydrological triggering and slope-channel feedbacks.
During extreme rainfall, the steep hillslopes experience a rapid rainfall–runoff conversion due to a low infiltration capacity and minimal vegetation interception. This leads to oversaturation of shallow colluvial layers composed of tectonically fragmented debris, reducing their shear strength below critical thresholds. Shallow landslides or slope wash are thus triggered, producing high volumes of loose sediment that are rapidly transported into the gully system.
Once in the channel, the sediment undergoes secondary mobilization through concentrated runoff. The modeled flow velocities suggest that upstream peak values (6–9 m·s−1) exceed the critical entrainment threshold for coarse particles (D > 200 mm), especially in zones of longitudinal convergence and lateral channel constriction. The simulated transition from the sheet flow to surge front reflects the development of a high-density, non-Newtonian flow behavior, with an increasing sediment–water interaction and transient flow bulking.
Furthermore, the dynamic variation in modeled Cv (volume concentration) over time suggests that the material supply mechanism is not static but evolves with sediment exhaustion and water–solid phase separation. This is particularly evident in the later stages of the simulation, where the flow becomes more fluid-dominant and the frontal lobes decelerate sharply near the fan apex. These patterns highlight the importance of both upstream sediment availability and mid-channel hydraulic structure in determining debris flow evolution and hazard potential.
4.2. Depositional Patterns, Runout Extents, and Remote Sensing Validation
The flow depth values presented in
Figure 2,
Figure 3,
Figure 4 and
Figure 5 represent the maximum flow depths (proxy for potential deposition zones) recorded over the entire simulation period. The model outputs indicate that the majority of debris flow deposition occurred in the lower part of the main channel and the alluvial fan at the outlet. In this study, the term “sediment thickness” in figures refers to simulated flow depth (h) predicted by FLO-2D, which under the fixed-bed assumption is used as a proxy for potential deposition-prone areas. It does not represent the actual deposited sediment thickness. The “depositional extent and thickness” reported below also reflect the model-predicted flow behavior under this framework. In the 100-year simulation, the runout distance exceeded 5.1 km from the initiation zone, and the total estimated depositional volume surpassed 130,000 m
3 (
Figure 7).
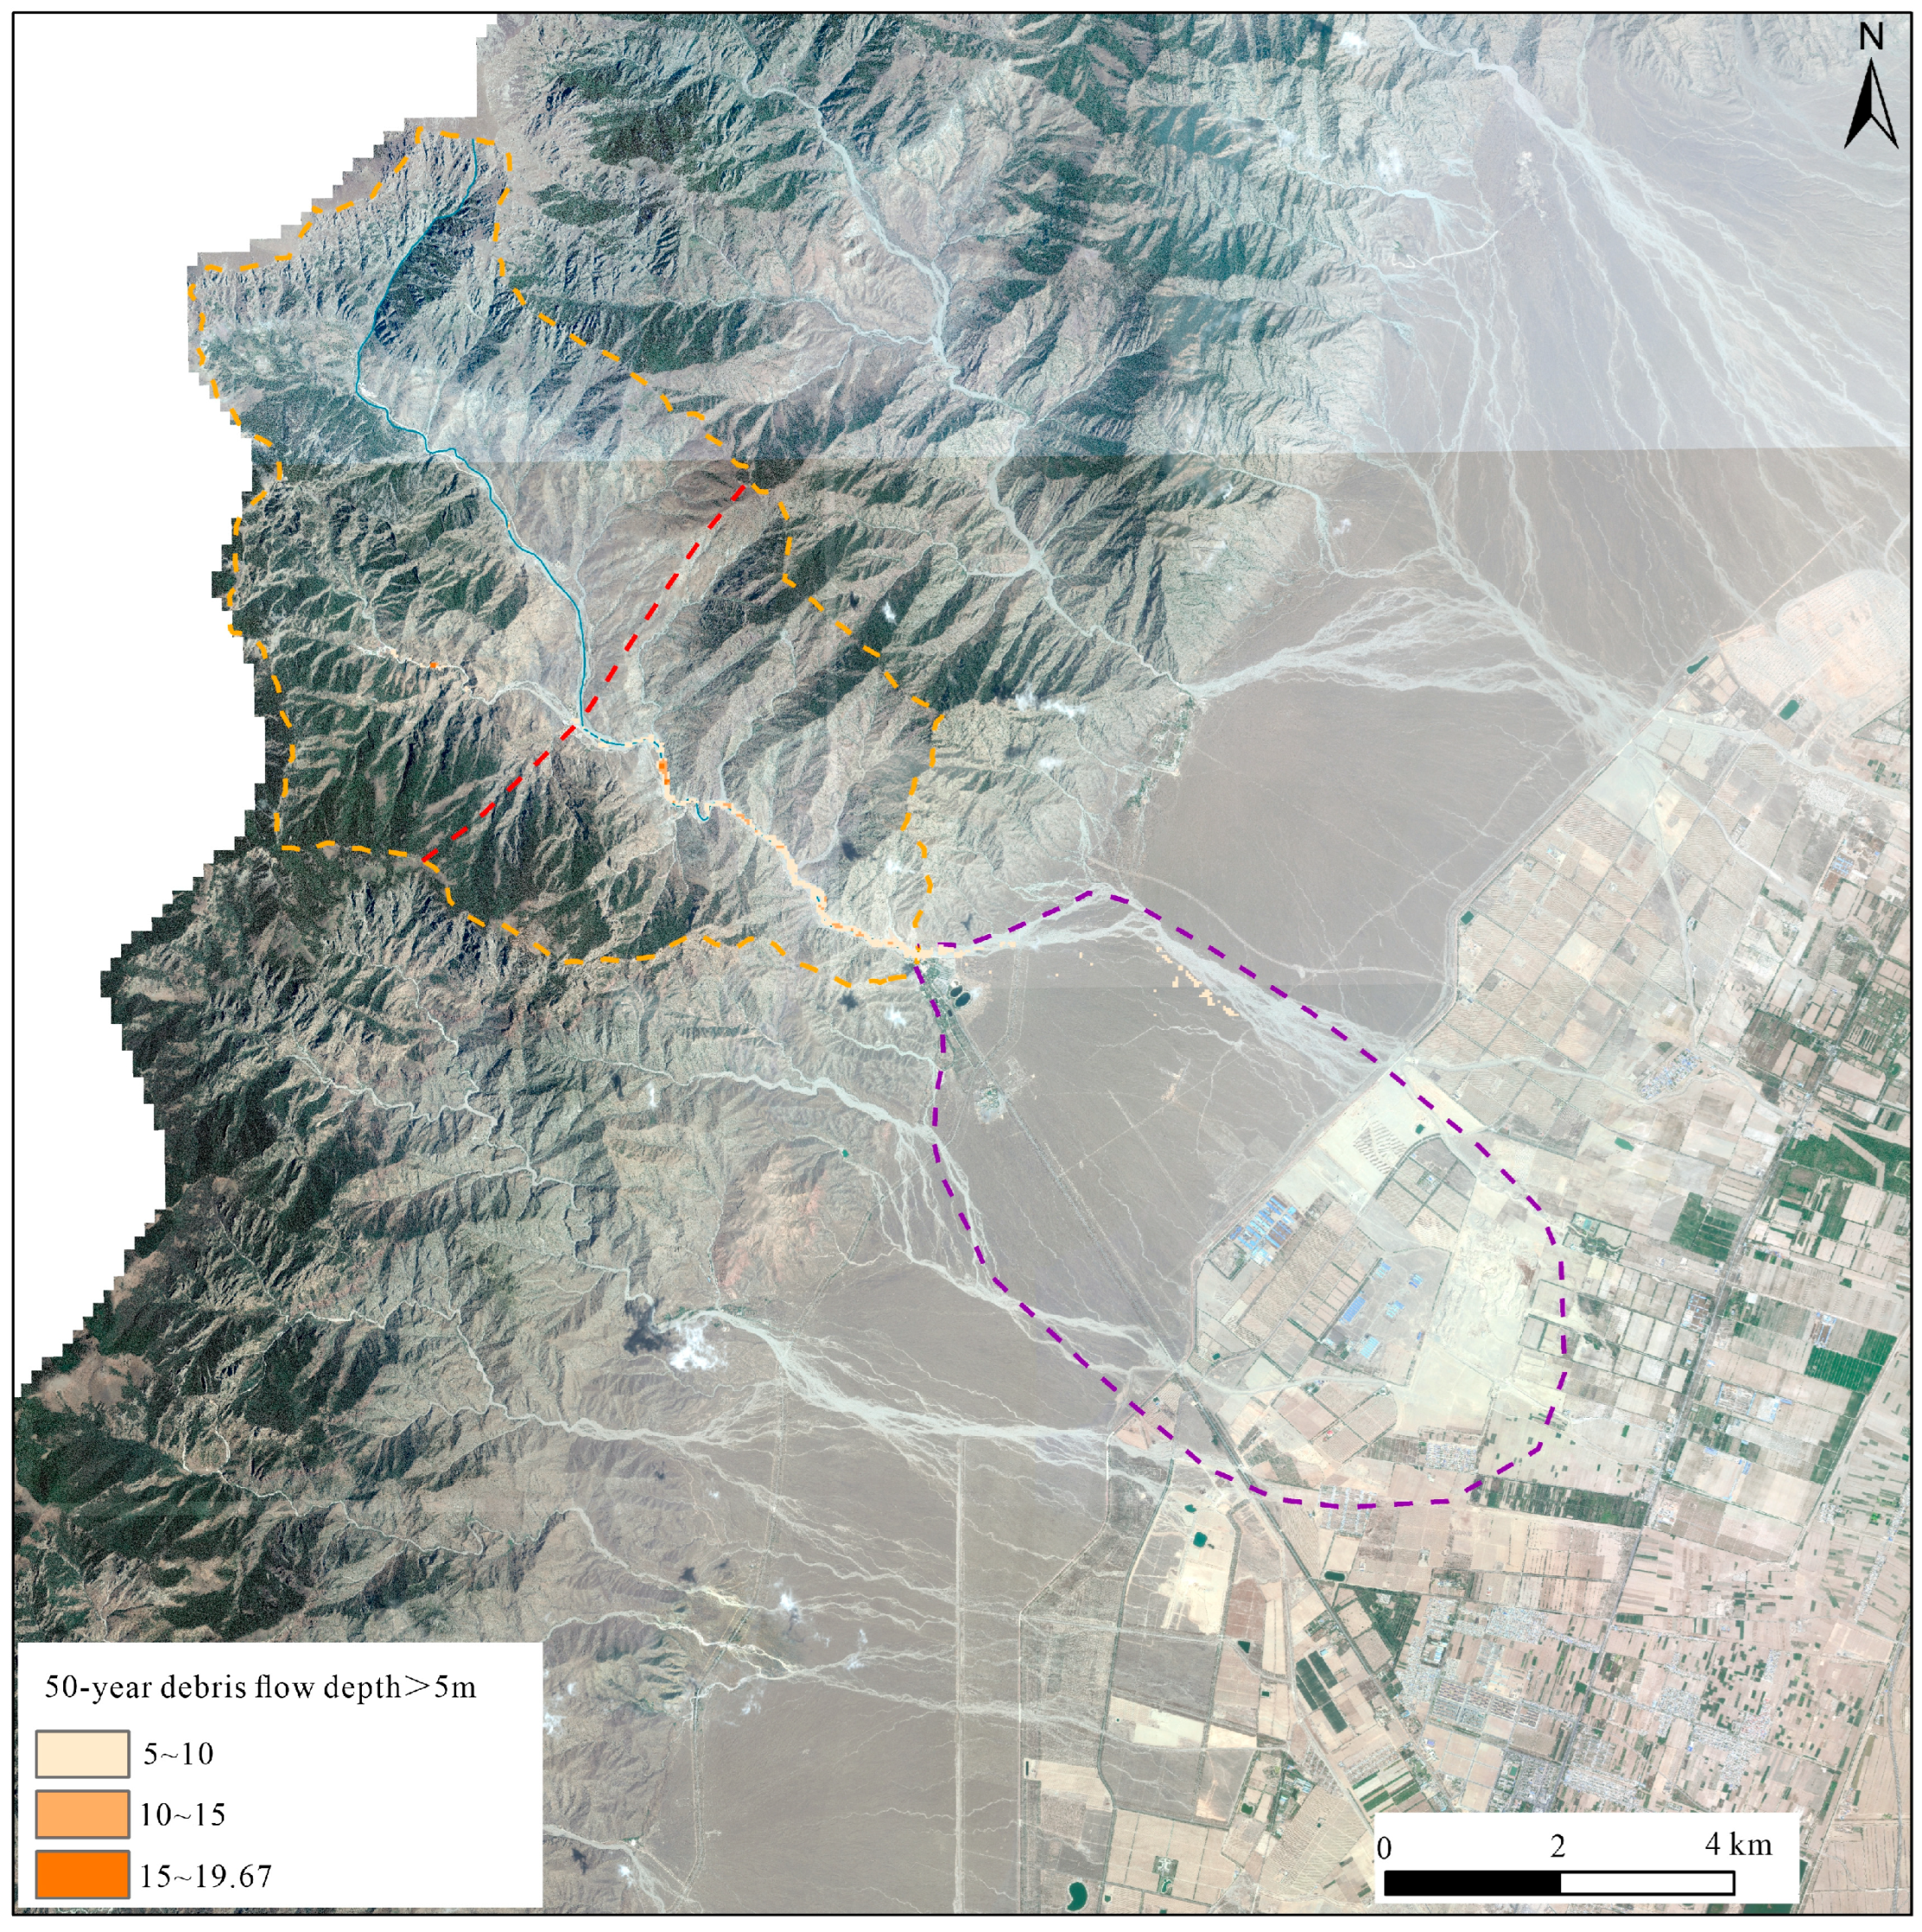
Spatially, the deposition was concentrated in two main zones:
Inner-fan zone: Proximal to the gully mouth, with maximum depositional depths > 9 m, resulting from the abrupt decrease in the slope and sudden energy loss, as defined in
Section 2.2.
Fan fringe zone: Laterally expanded debris lobes with thicknesses between 1 and 3 m, primarily affecting open areas near the Suyukou Scenic Area’s infrastructure.
This depositional pattern is consistent with field evidence of historical debris flow events, confirming the channel–fan transition as a critical hazard interface.
To evaluate the spatial accuracy of the simulation, the modeled deposition front under the 100-year return period was compared with historical debris flow extents delineated from remote sensing imagery and field surveys. Specifically, the 2014 post-event SPOT-5 image and 2018 GF-1 high-resolution data were used to extract fan boundary positions via visual interpretation and object-based image classification. Field surveys conducted in 2019 further confirmed the extent of depositional lobes and sediment fan apex locations.
The comparison indicates that the simulated runout front deviates by within 350 m from the 2014 debris fan edge and matches the observed depositional centroid with a positional offset of approximately 6.2% in fan length. The maximum simulated deposition thickness near the apex (9.2 m) also corresponds closely with the measured field profiles (ranging from 8.7 to 9.5 m), providing quantitative support for the model performance. Furthermore, the spatial alignment of the modeled flow paths with topographic lows and gully branches visible in satellite data supports the reliability of DEM-based terrain routing in the FLO-2D environment.
These findings validate that the model not only reproduces bulk dynamic parameters, such as flow depth and velocity, but also performs well in replicating spatial hazard distribution. The integration of model outputs with high-resolution satellite imagery and field-mapped extents enables effective hazard zone delineation and offers a robust foundation for land use regulation in debris-flow-prone areas.
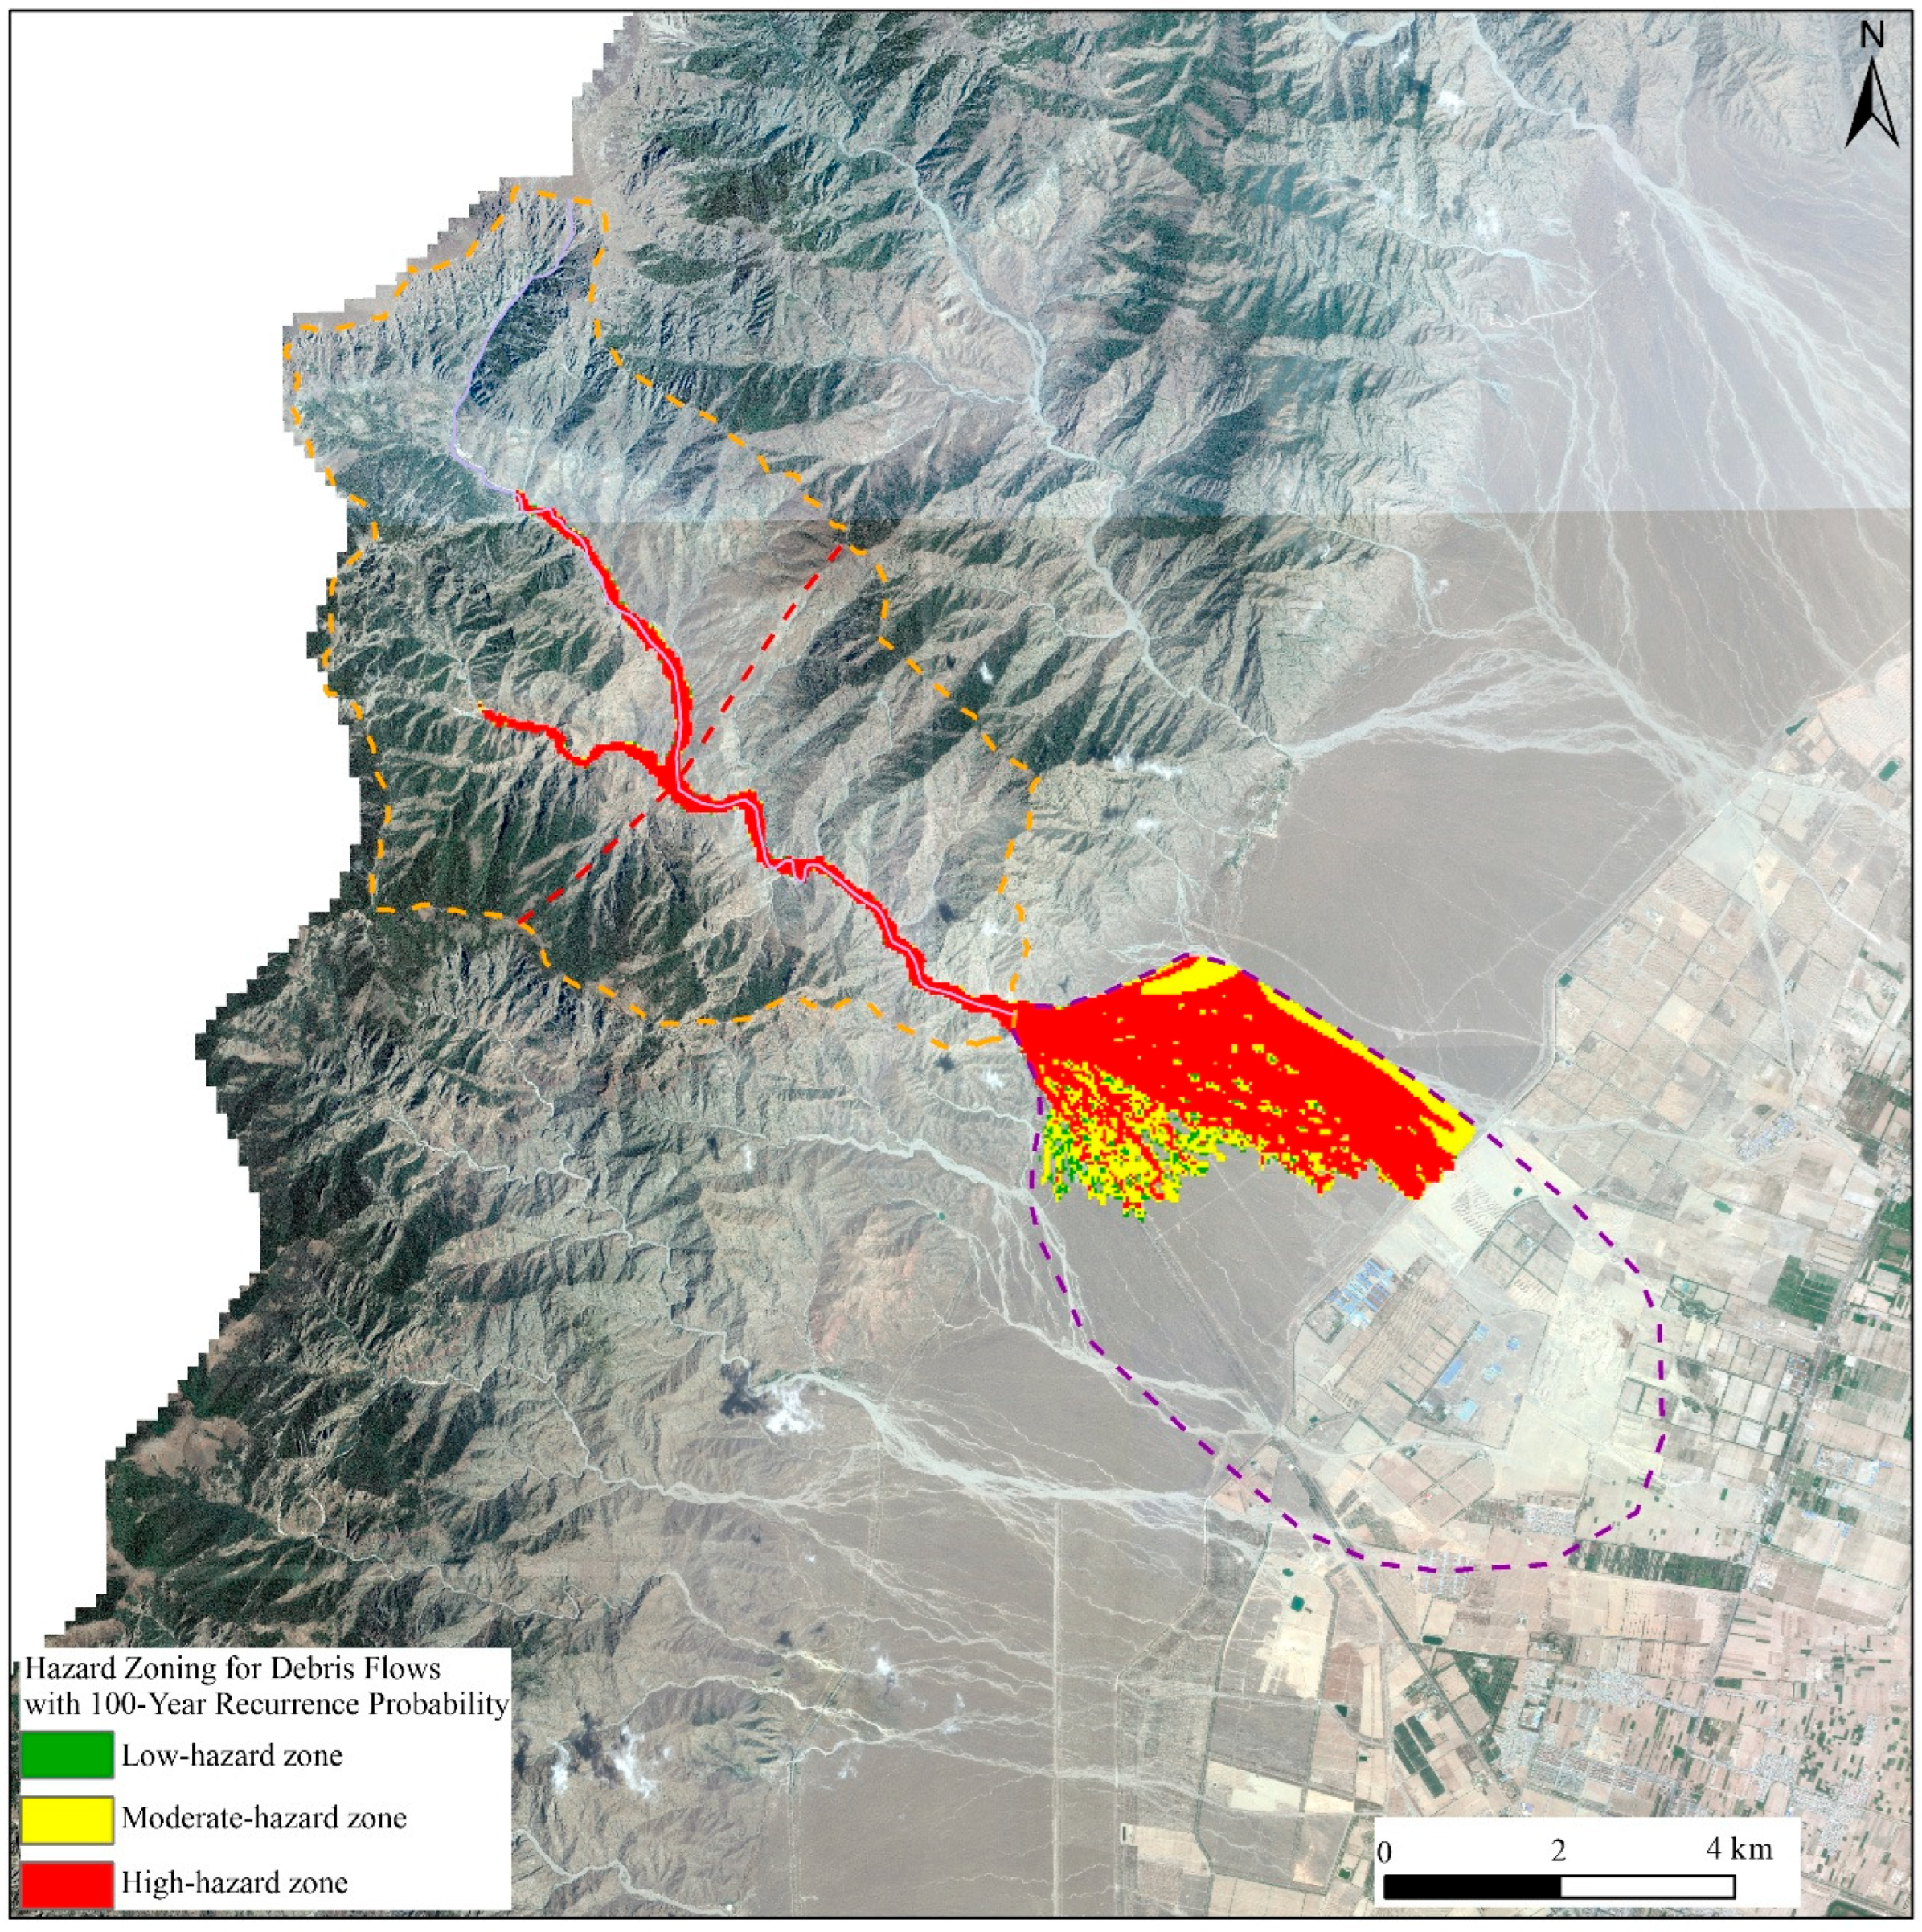
4.3. Hazard Intensity Zoning (H × V) and Risk Zones
Using the simulation outputs of the flow depth (H) and velocity (V), the debris flow hazard intensity (H × V) was classified based on the H × V product method [
30,
31]:
High hazard: H > 1.5 m or H × V > 1.5 m2/s.
Moderate hazard: 0.5 m < H < 1.5 m and 0.5 < H × V < 1.5 m2/s.
Low hazard: H < 0.5 m and H × V < 0.5 m2/s.
In the 100-year return period scenario, we observed the following:
High-hazard zones covered ~714,000 m
2 (76.6%), including nearly the entire gully and northern parts of the fan; moderate-hazard zones (~173,000 m
2, 18.6%) were distributed in peripheral fan areas and vegetated buffer zones; low-hazard zones (~44,000 m
2, 4.8%) mainly occurred in topographic depressions and the low-gradient regions (
Figure 8,
Figure 9,
Figure 10 and
Figure 11).
The GIS-based overlay analysis revealed that several tourist service facilities and sections of the S104 provincial road fall within the high-hazard zone, necessitating immediate attention in regional hazard mitigation plans. In this study, the term “hazard zoning” refers specifically to intensity mapping based on H × V, for each modeled return period. A full-risk mapping that integrates the hazard intensity with exposure and vulnerability is presented in
Section 4.5 [
32,
33].
4.4. Model Accuracy and Sensitivity
The simulated flow front under the 100-year event matched the observed fan apex within 350 m of the horizontal deviation, demonstrating good agreement between modeling and field observations [
22]. The accuracy of the flow depth and flow depth distributions was further validated through comparison with post-event geomorphic surveys. In addition, the comparison between simulated and observed debris-flow deposition areas was conducted by overlaying post-event field mapping with simulated maximum flow depth contours (threshold ≥ 0.5 m), following area-based validation approaches proposed by [
9,
14,
34]. The results showed good spatial agreement, with minor deviations at the fan margins due to local topographic complexity.
The sensitivity analysis of the Cv and Manning’s n revealed that increasing the Cv led to a higher flow viscosity and reduced the runout distance; decreasing the n increased the flow velocity and promoted the channel incision over a lateral spread. These results underline the importance of accurate rheological parameter selection in semi-arid mountainous catchments with highly constrained flow paths.
Despite the favorable match between model predictions and observed deposition extents, several limitations should be noted regarding the FLO-2D model configuration. The fixed-bed assumption restricts the ability to simulate sediment entrainment, bed scouring, and vertical erosion processes, which can be critical in channels with loose or reworkable substrates. As a result, the FLO-2D may underpredict the incision depth in high-energy reaches and overestimate the deposition in fan apex zones, particularly when sediment availability is abundant and dynamically evolving.
Sensitivity tests were conducted to evaluate how small variations in key parameters affect the model outputs. A ±0.05 adjustment in volume concentration (Cv) altered the runout distance by approximately 9.7%, while changing Manning’s n by ±0.05 affected peak velocity by up to 12.3%. These findings reinforce that careful calibration of rheological and hydraulic parameters is essential to maintain spatial accuracy, especially in fan transition zones where deposition is strongly governed by the interplay between momentum loss and channel confinement.
The peak debris flow discharge of approximately 1195 m
3/s corresponds to the combined effect of flow depth, velocity, and channel width. Due to the wide and shallow morphology of the upper gully reaches, large total discharge can occur with relatively moderate peak velocities (~9 m·s
−1), consistent with observations in similar gully-type catchments [
11,
17]. This explains the apparent discrepancy between peak discharge and velocity.
It should be noted that the observed phase separation phenomenon is partly influenced by the time-varying Cv curve adopted in the model setup (Cv increasing to 0.35 at peak flow and decreasing during falling limbs), which reflects progressive sediment mobilization and limited availability in later flow stages. Moreover, a phenomenon akin to phase separation—commonly referred to as water–solid segregation—was observed in the latter stages of the simulation. As flow energy decreased near the fan fringe, the coarse fraction exhibited premature deposition while the finer sediment and interstitial water continued to advance. This behavior, although not explicitly modeled in FLO-2D, manifested through differential flow thickness and velocity gradients across the fan surface. The emergence of low-density lobes at distal locations suggests that even under uniform rainfall input, internal material sorting can significantly influence final flow depth distributions. Recognizing this behavior is vital for accurately delineating residual hazard zones, particularly where infrastructure lies near the outer margins of debris fans. While FLO-2D performed well in reproducing flow extent and deposition, its structural assumptions limit simulation of bed erosion, entrainment, and sediment sorting. To enhance modeling flexibility in future studies, a multi-model framework may be adopted. For instance, to enhance modeling flexibility in future studies, a multi-model framework combining FLO-2D’s efficient flow routing, RAMMS: Debrisflow’s impact force estimation, and HEC-RAS’s hydraulic precision could improve the overall representation of debris flow dynamics. However, none of these models fully simulate physically based erosion and deposition processes, which remain a challenge for current modeling approaches. This ensemble approach is particularly useful in complex terrains where different physical mechanisms dominate in different zones of the catchment.
4.5. Implications for Risk Management and Emergency Planning
Based on the modeling results, four key implications emerge for Suyukou Gully and similar debris-flow-prone regions:
- (1)
Engineering Design and Infrastructure Planning
The fan apex should be prioritized for mitigation works, such as check dams, debris traps, and energy dissipation basins. Fan fringe and trail areas may benefit from flow-guiding embankments and controlled discharge zones. Retrofitting critical assets (e.g., tourist toilets, pavilions, and road shoulders) with reinforced bases or movable platforms is recommended [
32,
33].
The exposure analysis in this study utilized spatial datasets, including road networks, critical tourism infrastructure (parking lots, visitor centers), seasonal population density from park visitation records, and official land-use zoning maps. The risk zoning was generated by overlaying the H × V hazard intensity maps with these exposure layers in the GIS framework. This allowed for the identification of high-risk zones where both the hazard intensity and human exposure are concentrated, providing a spatial basis for targeted mitigation planning.
- (2)
Early Warning Systems and Rainfall Thresholds
The 33.2 mm/h critical threshold [
20] offers a solid empirical basis for setting rainfall-triggered alerts. Upstream rainfall–sediment coupling logic could be embedded into a real-time warning system using optical and radar sensors. Debris detection nodes should be placed at two choke points along the main gully for early-stage acoustic or pressure monitoring. In addition, the reliability and effectiveness principles outlined by [
35,
36] should be incorporated into the design of early warning systems to ensure a robust performance under varying hydrometeorological scenarios.
- (3)
Emergency Response and Temporal Planning
The simulation suggests that the change from initial rainfall to peak debris flow requires less than 30 min. Emergency evacuation corridors and protocols should therefore be pre-emptive, not reactive. Alert time buffers of at least 15 min are necessary for safe evacuation from the gully fan and highway.
- (4)
Integrated Land Use and Community Risk Governance
The results advocate for the delineation of permanent no-build zones in high hazard areas. Seasonal tourist management policies (e.g., rainy season closures, visitor flow control) should be incorporated into local administrative planning. GIS-based dynamic risk zoning maps can serve as tools for public engagement and participatory planning, especially with growing ecological tourism in the region (
Figure 12).
In addition to technical planning, this study underscores the need for integrated governance mechanisms linking geological hazard assessment with tourism management and emergency systems. In the context of scenic areas like Suyukou Gully, where infrastructure and transient populations coexist in hazard-prone zones, effective risk mitigation requires cross-sectoral coordination. Early warning systems, seasonal access control, and public hazard awareness initiatives should be jointly developed by geological agencies, tourism authorities, and emergency responders. A dynamic “risk–exposure–response” framework is recommended to support proactive risk governance in similar mountainous tourism areas.
For Suyukou Gully, the integrated risk mapping indicates that mitigation priorities should focus first on high-risk zones along the lower fan margin, where critical tourist infrastructure overlaps with high H × V intensity areas. Engineering measures should be implemented in these zones before expanding to medium-risk sectors. Additionally, visitor flow management during the rainy season should prioritize restrictions in these overlapping zones. The engineering design should also account for the active deposition area at the fan apex to ensure long-term sediment management and effective reduction in sediment transport risk [
37]. This phased approach enables effective resource allocation and enhances disaster resilience in tourist areas with similar debris flow hazard profiles. Looking forward, potential future increases in short-duration, high-intensity rainfall events associated with regional climate change may further elevate debris flow hazard levels and alter risk profiles. This highlights the importance of incorporating climate adaptation considerations into long-term risk management planning for Suyukou Gully and similar mountainous tourist destinations.
5. Conclusions
This study employed the FLO-2D numerical model to simulate the debris flow dynamics in Suyukou Gully under different rainfall return periods, based on high-resolution DEM (original 5 m DEM resampled to 20 m grid), rainfall statistics, field surveys, and sediment characterization. The model effectively reproduced debris flow propagation, deposition, and spatial hazard distribution.
Key findings include the following:
- (1)
The debris flow behavior is strongly influenced by the rainfall intensity and sediment concentration. Under the 100-year event, the peak discharge exceeded 1195 m3/s, with flow depths surpassing 20 m and the runout distance exceeding 5.1 km.
- (2)
Hazard zoning based on flow depth–velocity coupling identified that over 75% of the fan area falls within high-hazard zones, with tourist infrastructure directly exposed.
- (3)
The simulation accuracy was validated through comparison with post-event remote sensing data and field surveys, showing good alignment in the flow extent and depositional thickness.
The results support the use of FLO-2D as a practical tool for hazard assessment and mitigation planning in small- to medium-scale debris-flow-prone catchments. While model limitations, such as the fixed-bed assumption, exist, careful parameter calibration and scenario-based validation can ensure reliable outputs for risk-informed land use and emergency response planning. The findings provide a practical modeling framework for risk-informed planning in small- to medium-scale debris-flow-prone tourist areas, which can be adapted to similar catchments in mountainous regions.


