
Effect of Drying Conditions on Kinetics, Modeling, and Thermodynamic Behavior of Marjoram Leaves in an IoT-Controlled Vacuum Dryer


 ,
,  ,
,  ,
,  ,
,  ,
,  and
and 
Abstract
1. Introduction
2. Materials and Methods
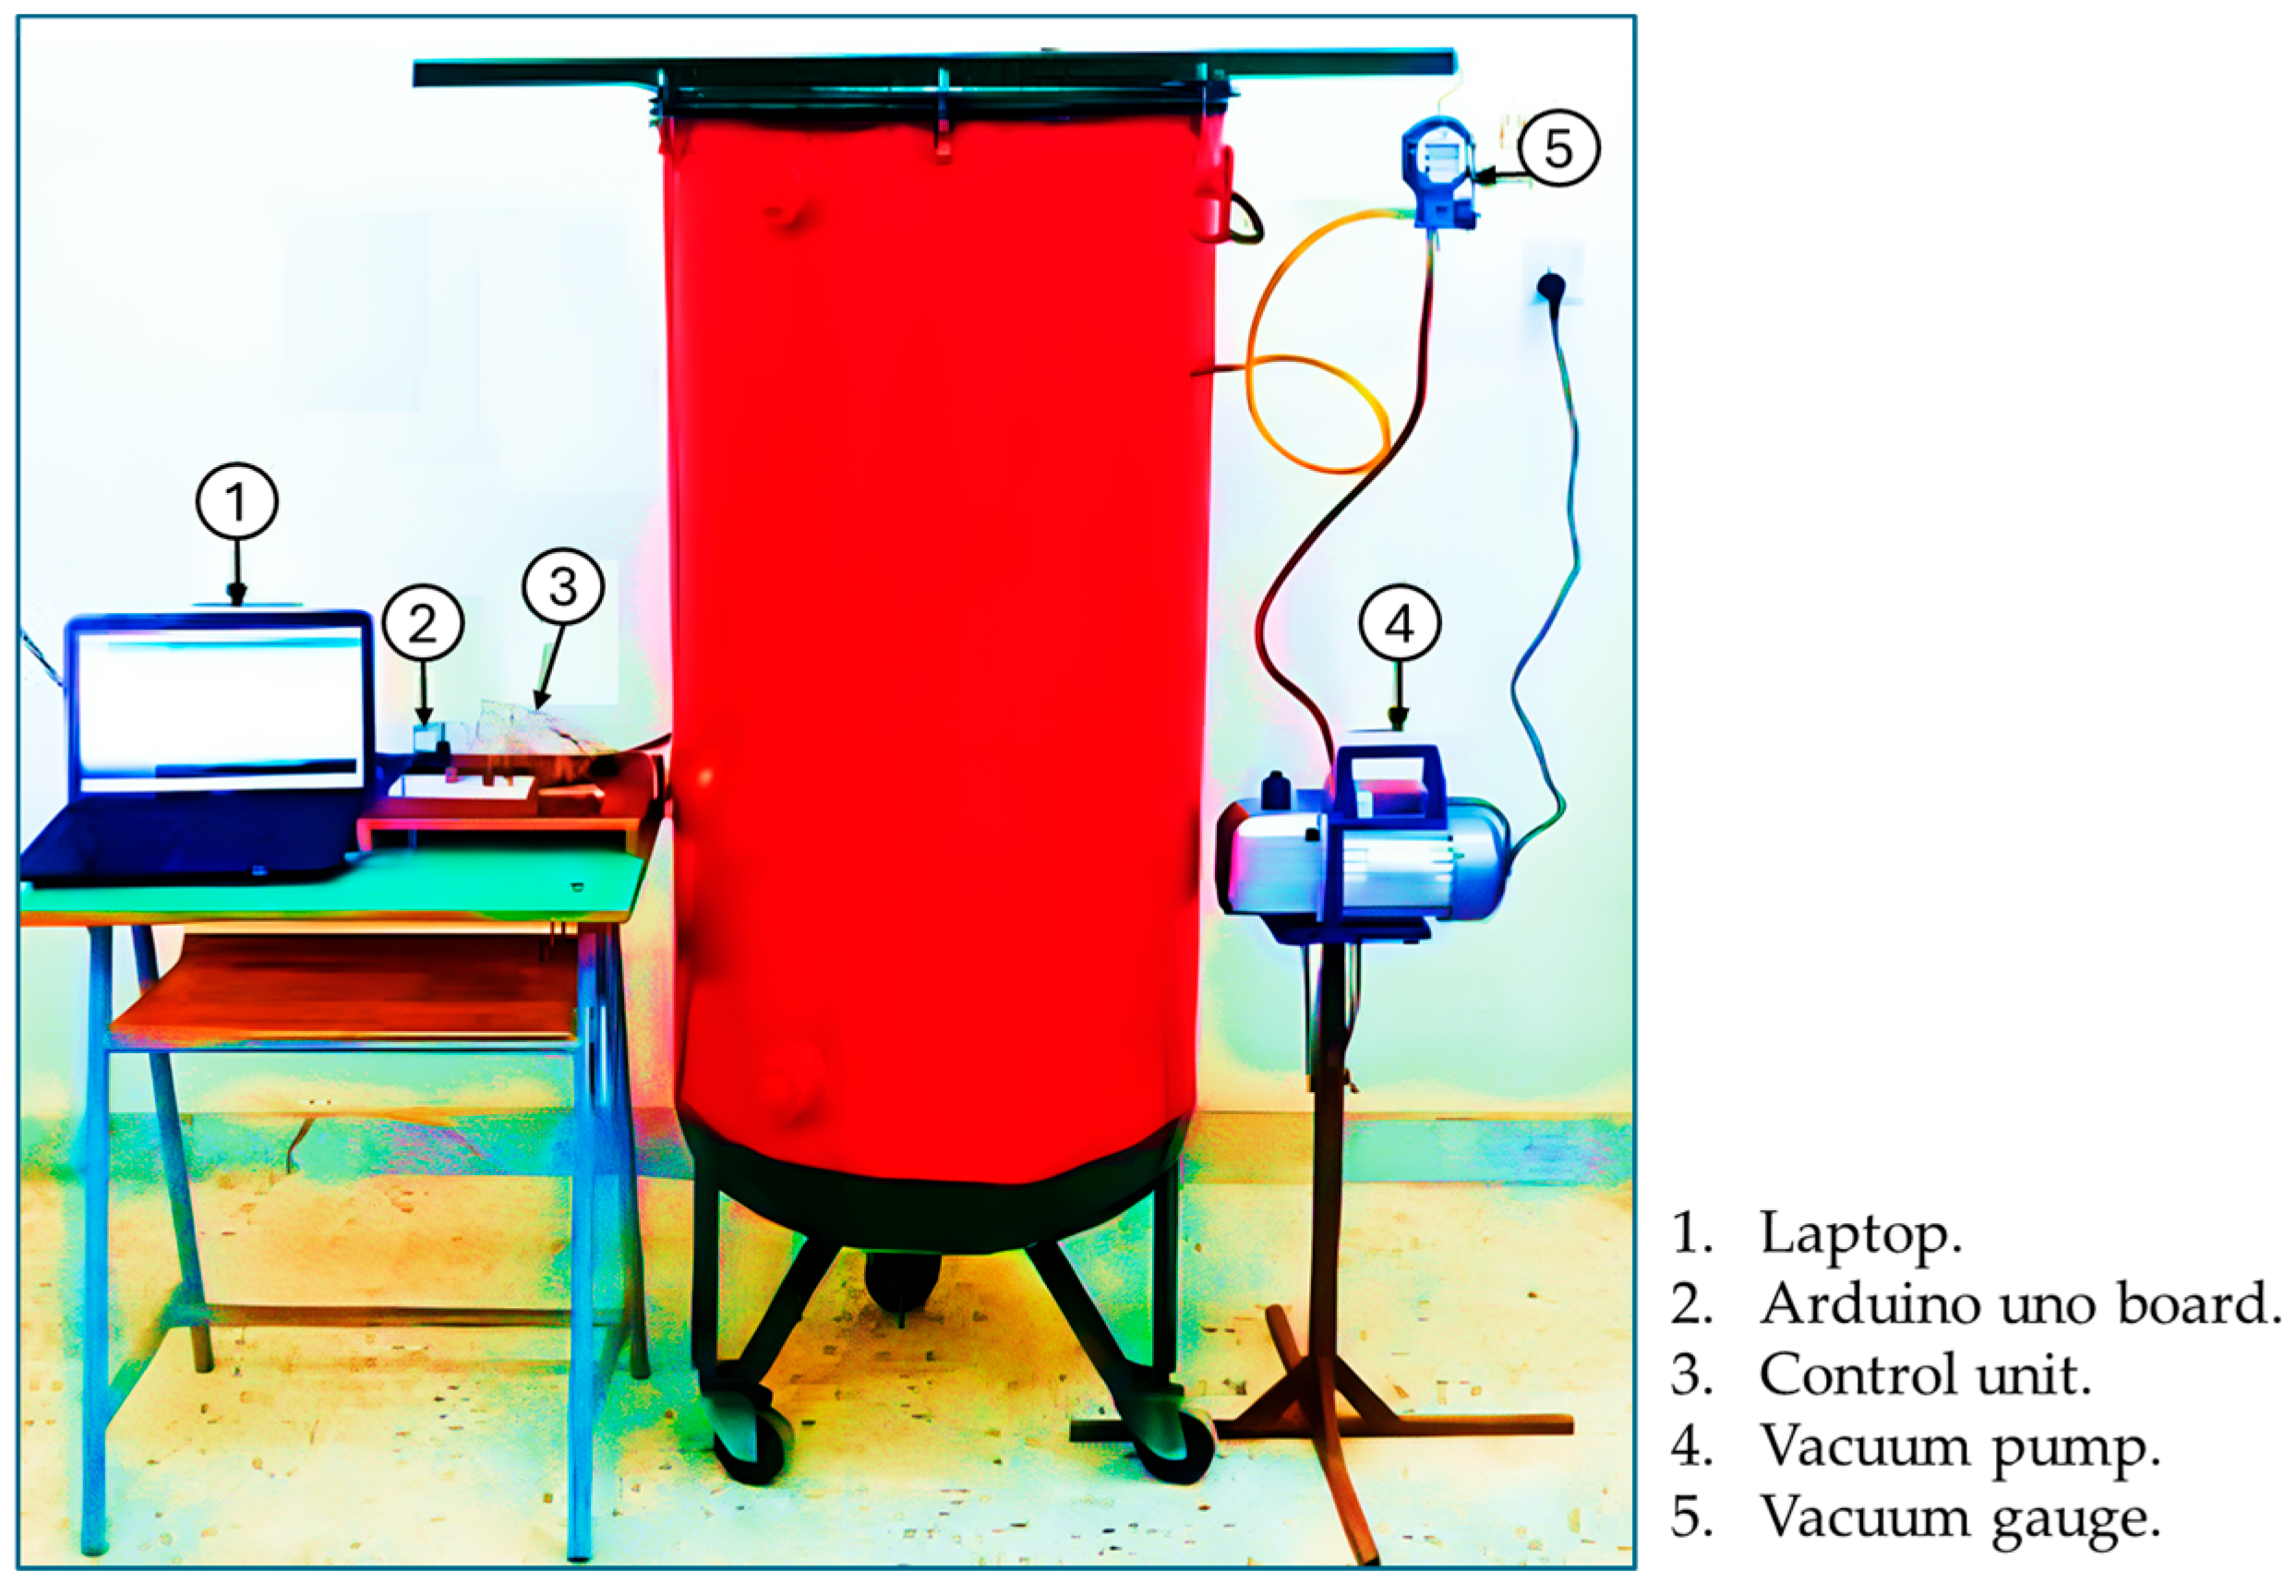
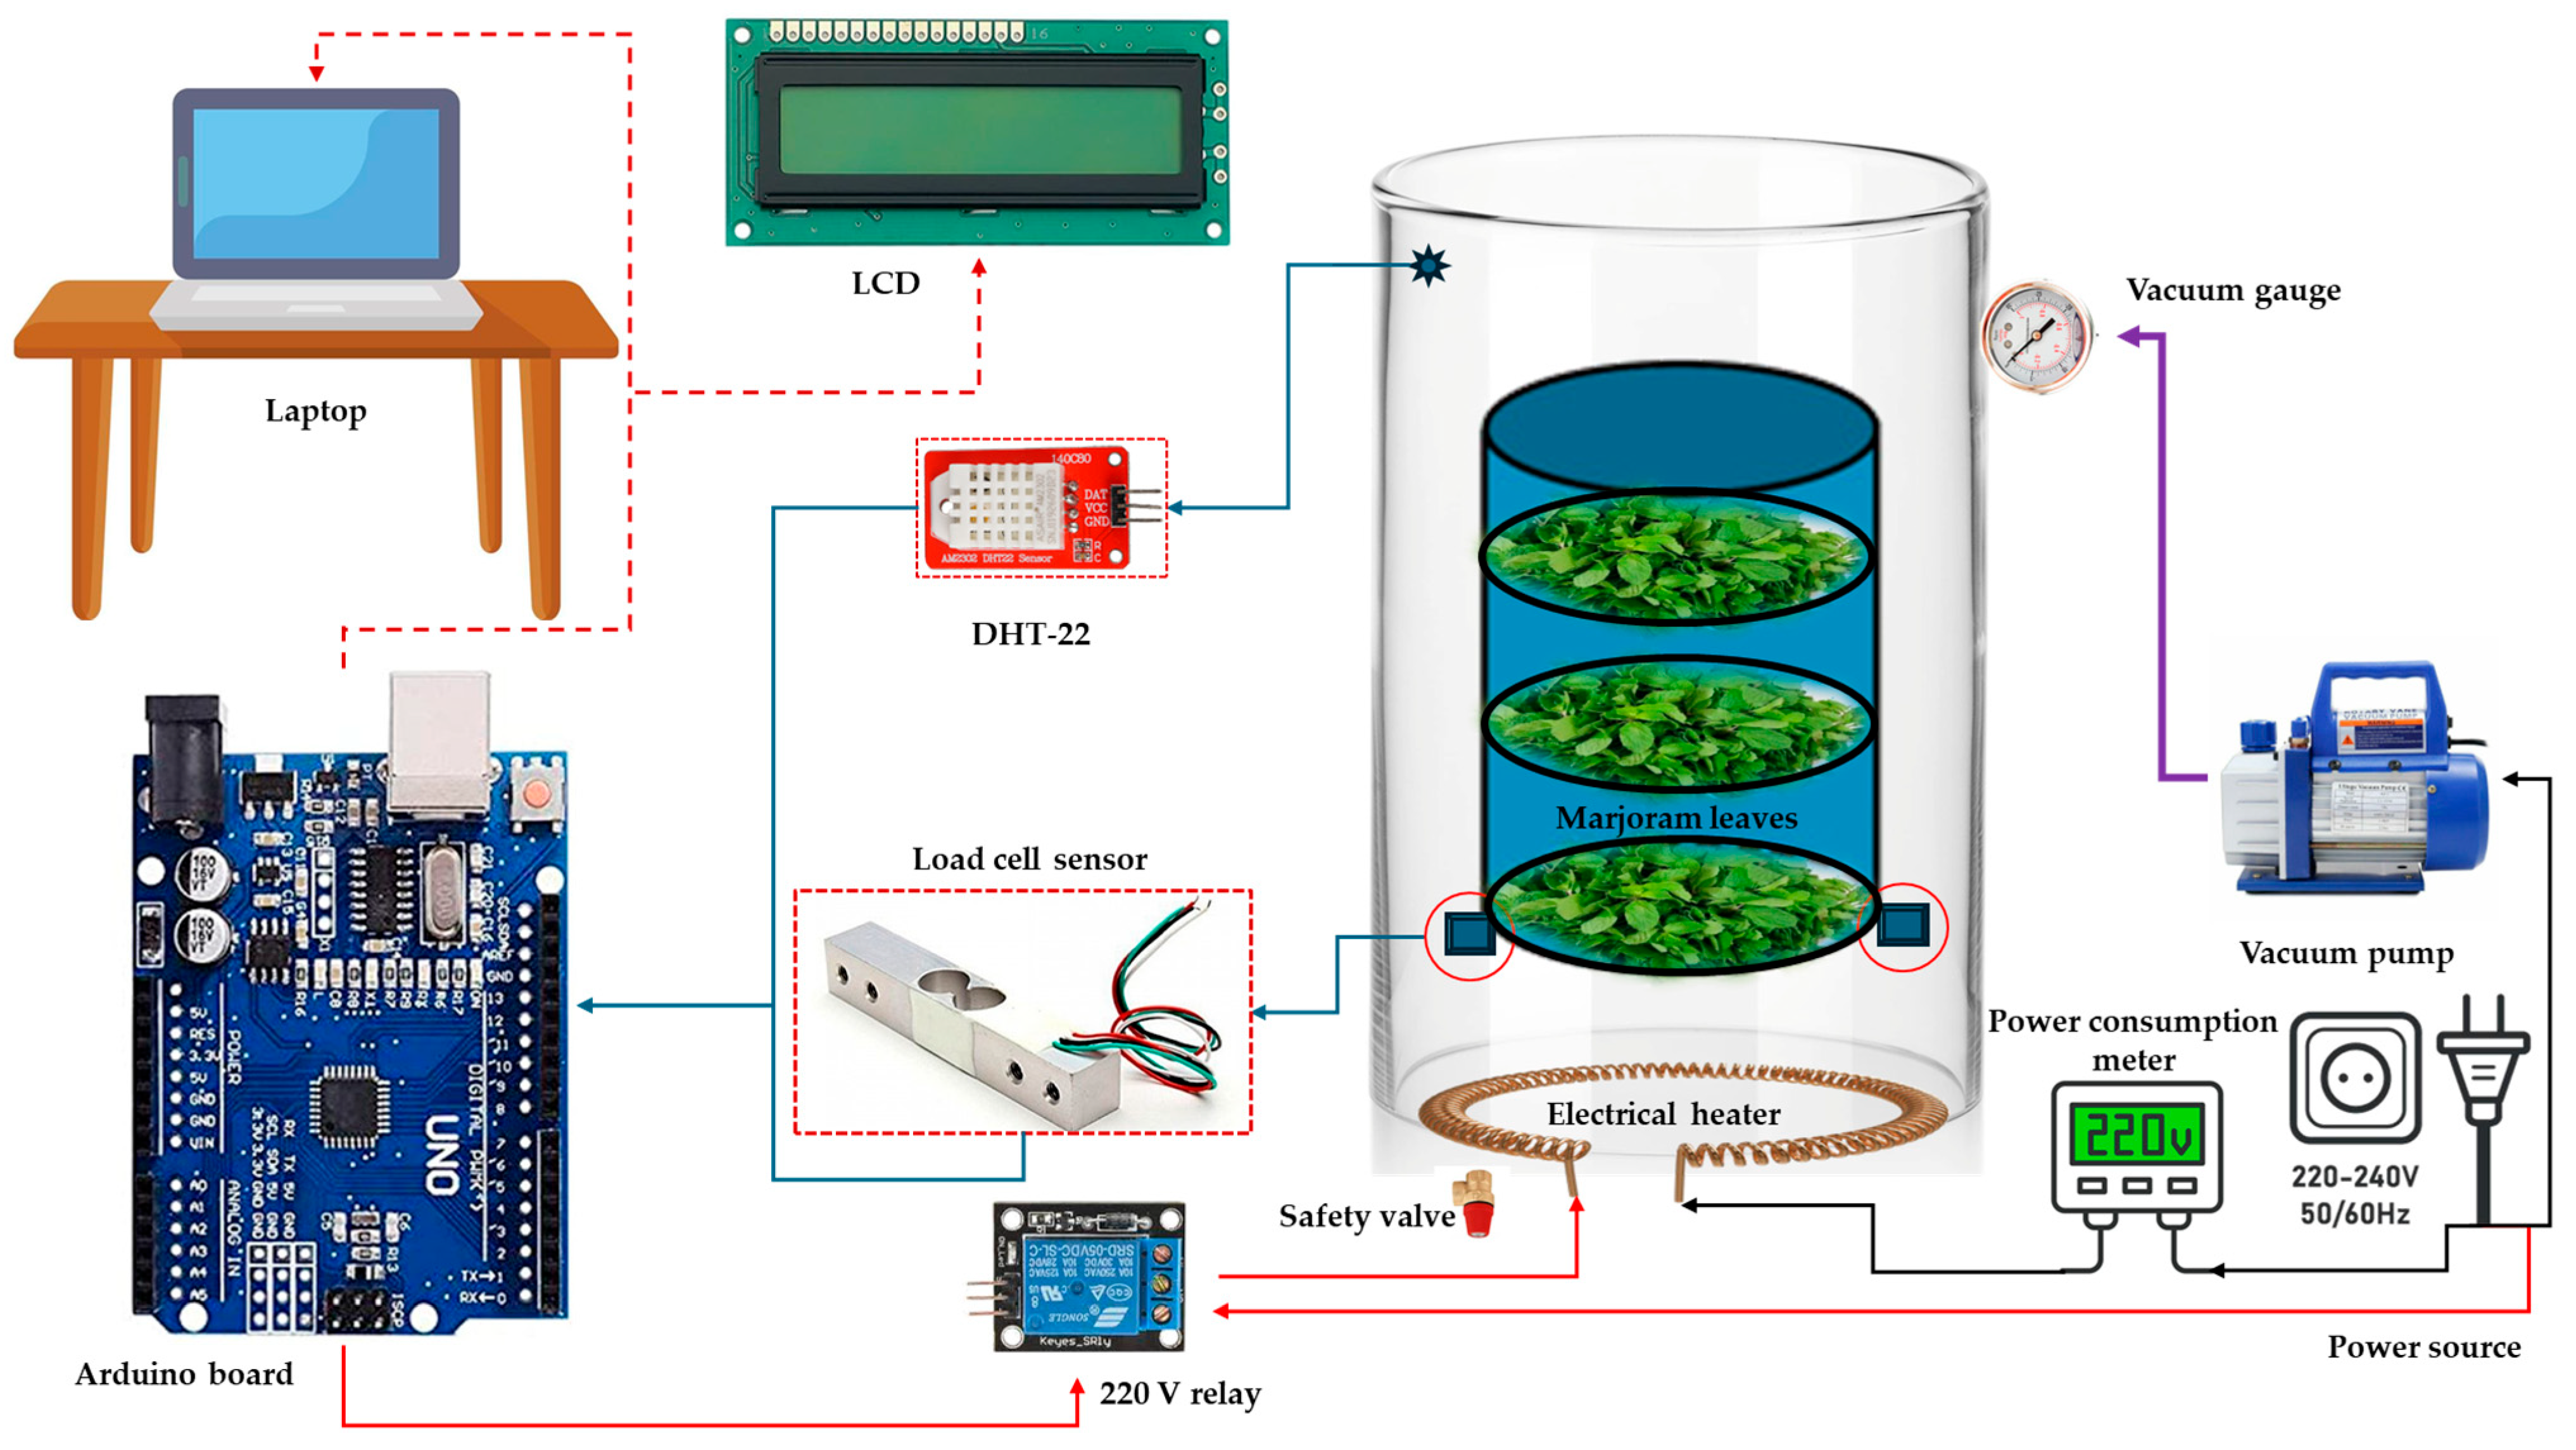
2.1. Experimental Setup
2.2. Description of the DVD
2.3. Evaluation Processes of the DVD
2.3.1. Drying Kinetics
Moisture Content (μ)
Drying Rate (DR)
Moisture Ratio (MR)
2.3.2. Drying Constant (k)
2.3.3. Moisture Diffusivity (Deff)
2.3.4. Activation Energy (AE)
2.3.5. Mathematical Modeling (MM)

| No. | Model Name | Model Equation * | Refs. |
|---|---|---|---|
| 1 | Aghbashlo | [60,61] | |
| 2 | Logarithmic (Asymptotic) | [62,63,64] | |
| 3 | Midilli | ||
| 4 | Modified Midilli I | [65,66] | |
| 5 | Modified Midilli II | [65] | |
| 6 | Modified Page | [62,63,64] | |
| 7 | Page | ||
| 8 | Wang-Sigh | ||
| 9 | Weibullian | [65,66] | |
| 10 | Weibullian I |
2.3.6. Thermodynamic Parameters
2.3.7. Economic Analysis
2.4. Uncertainty Analysis
3. Results and Discussion
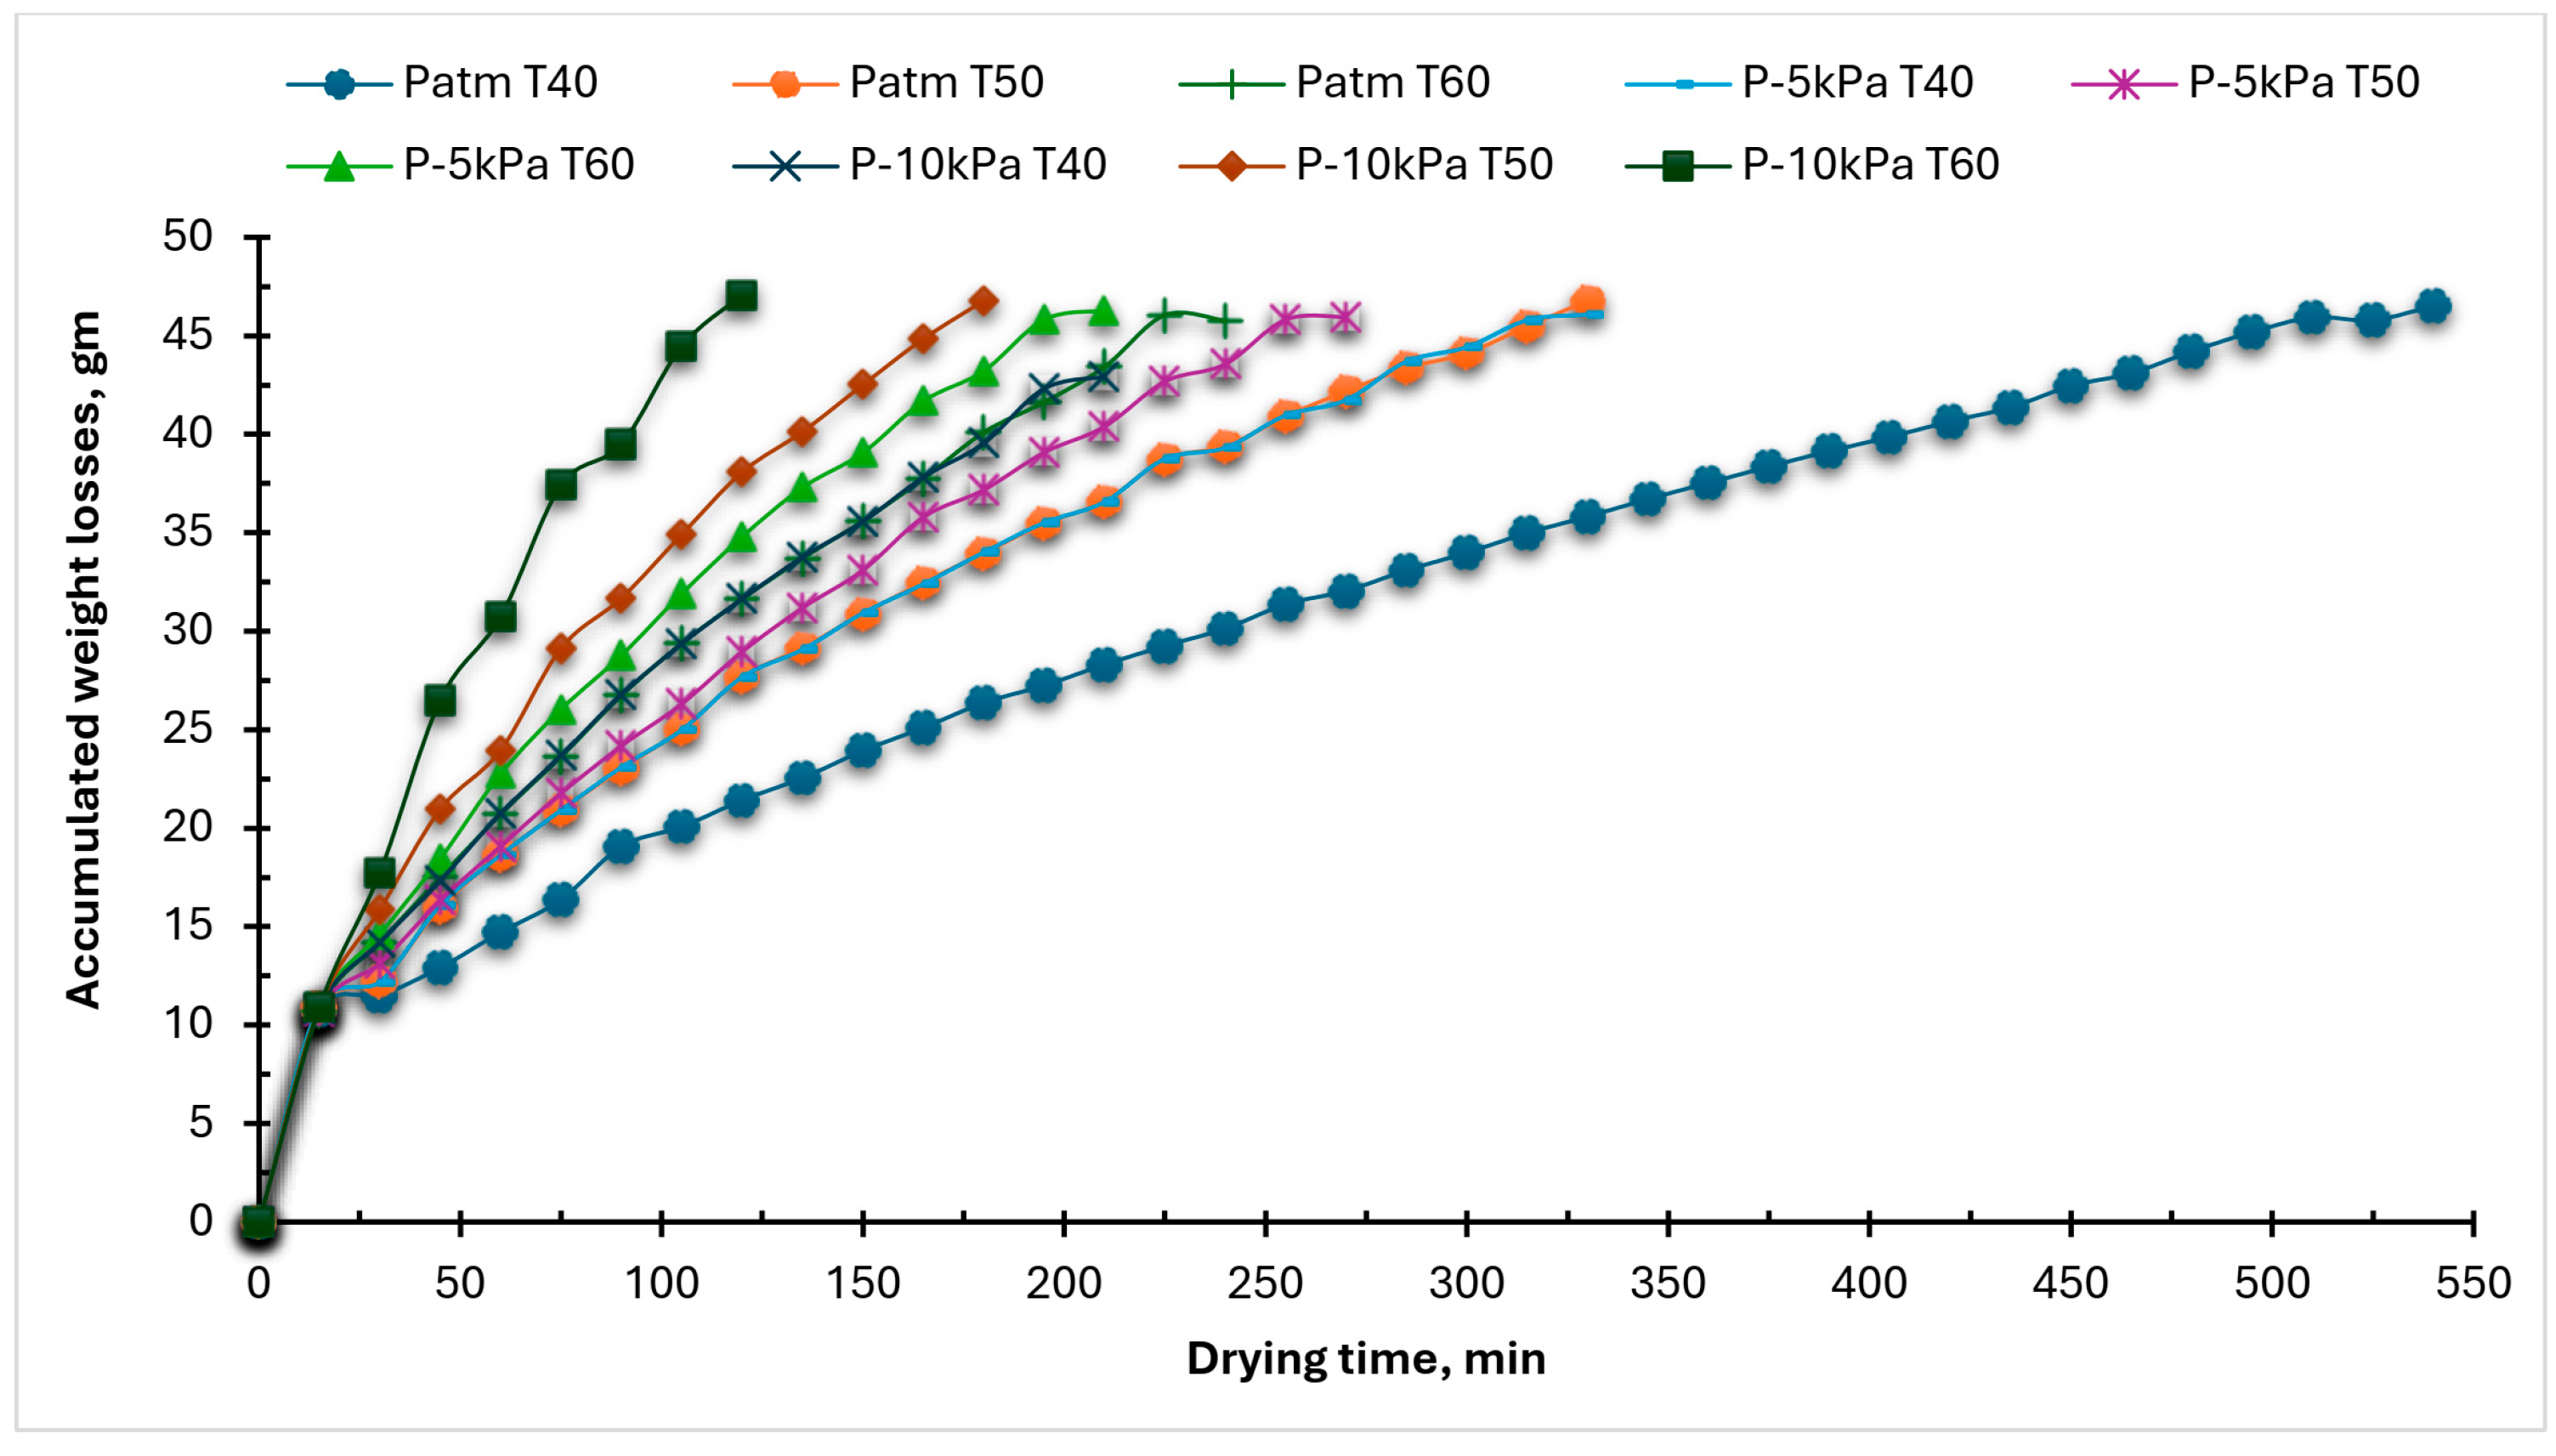
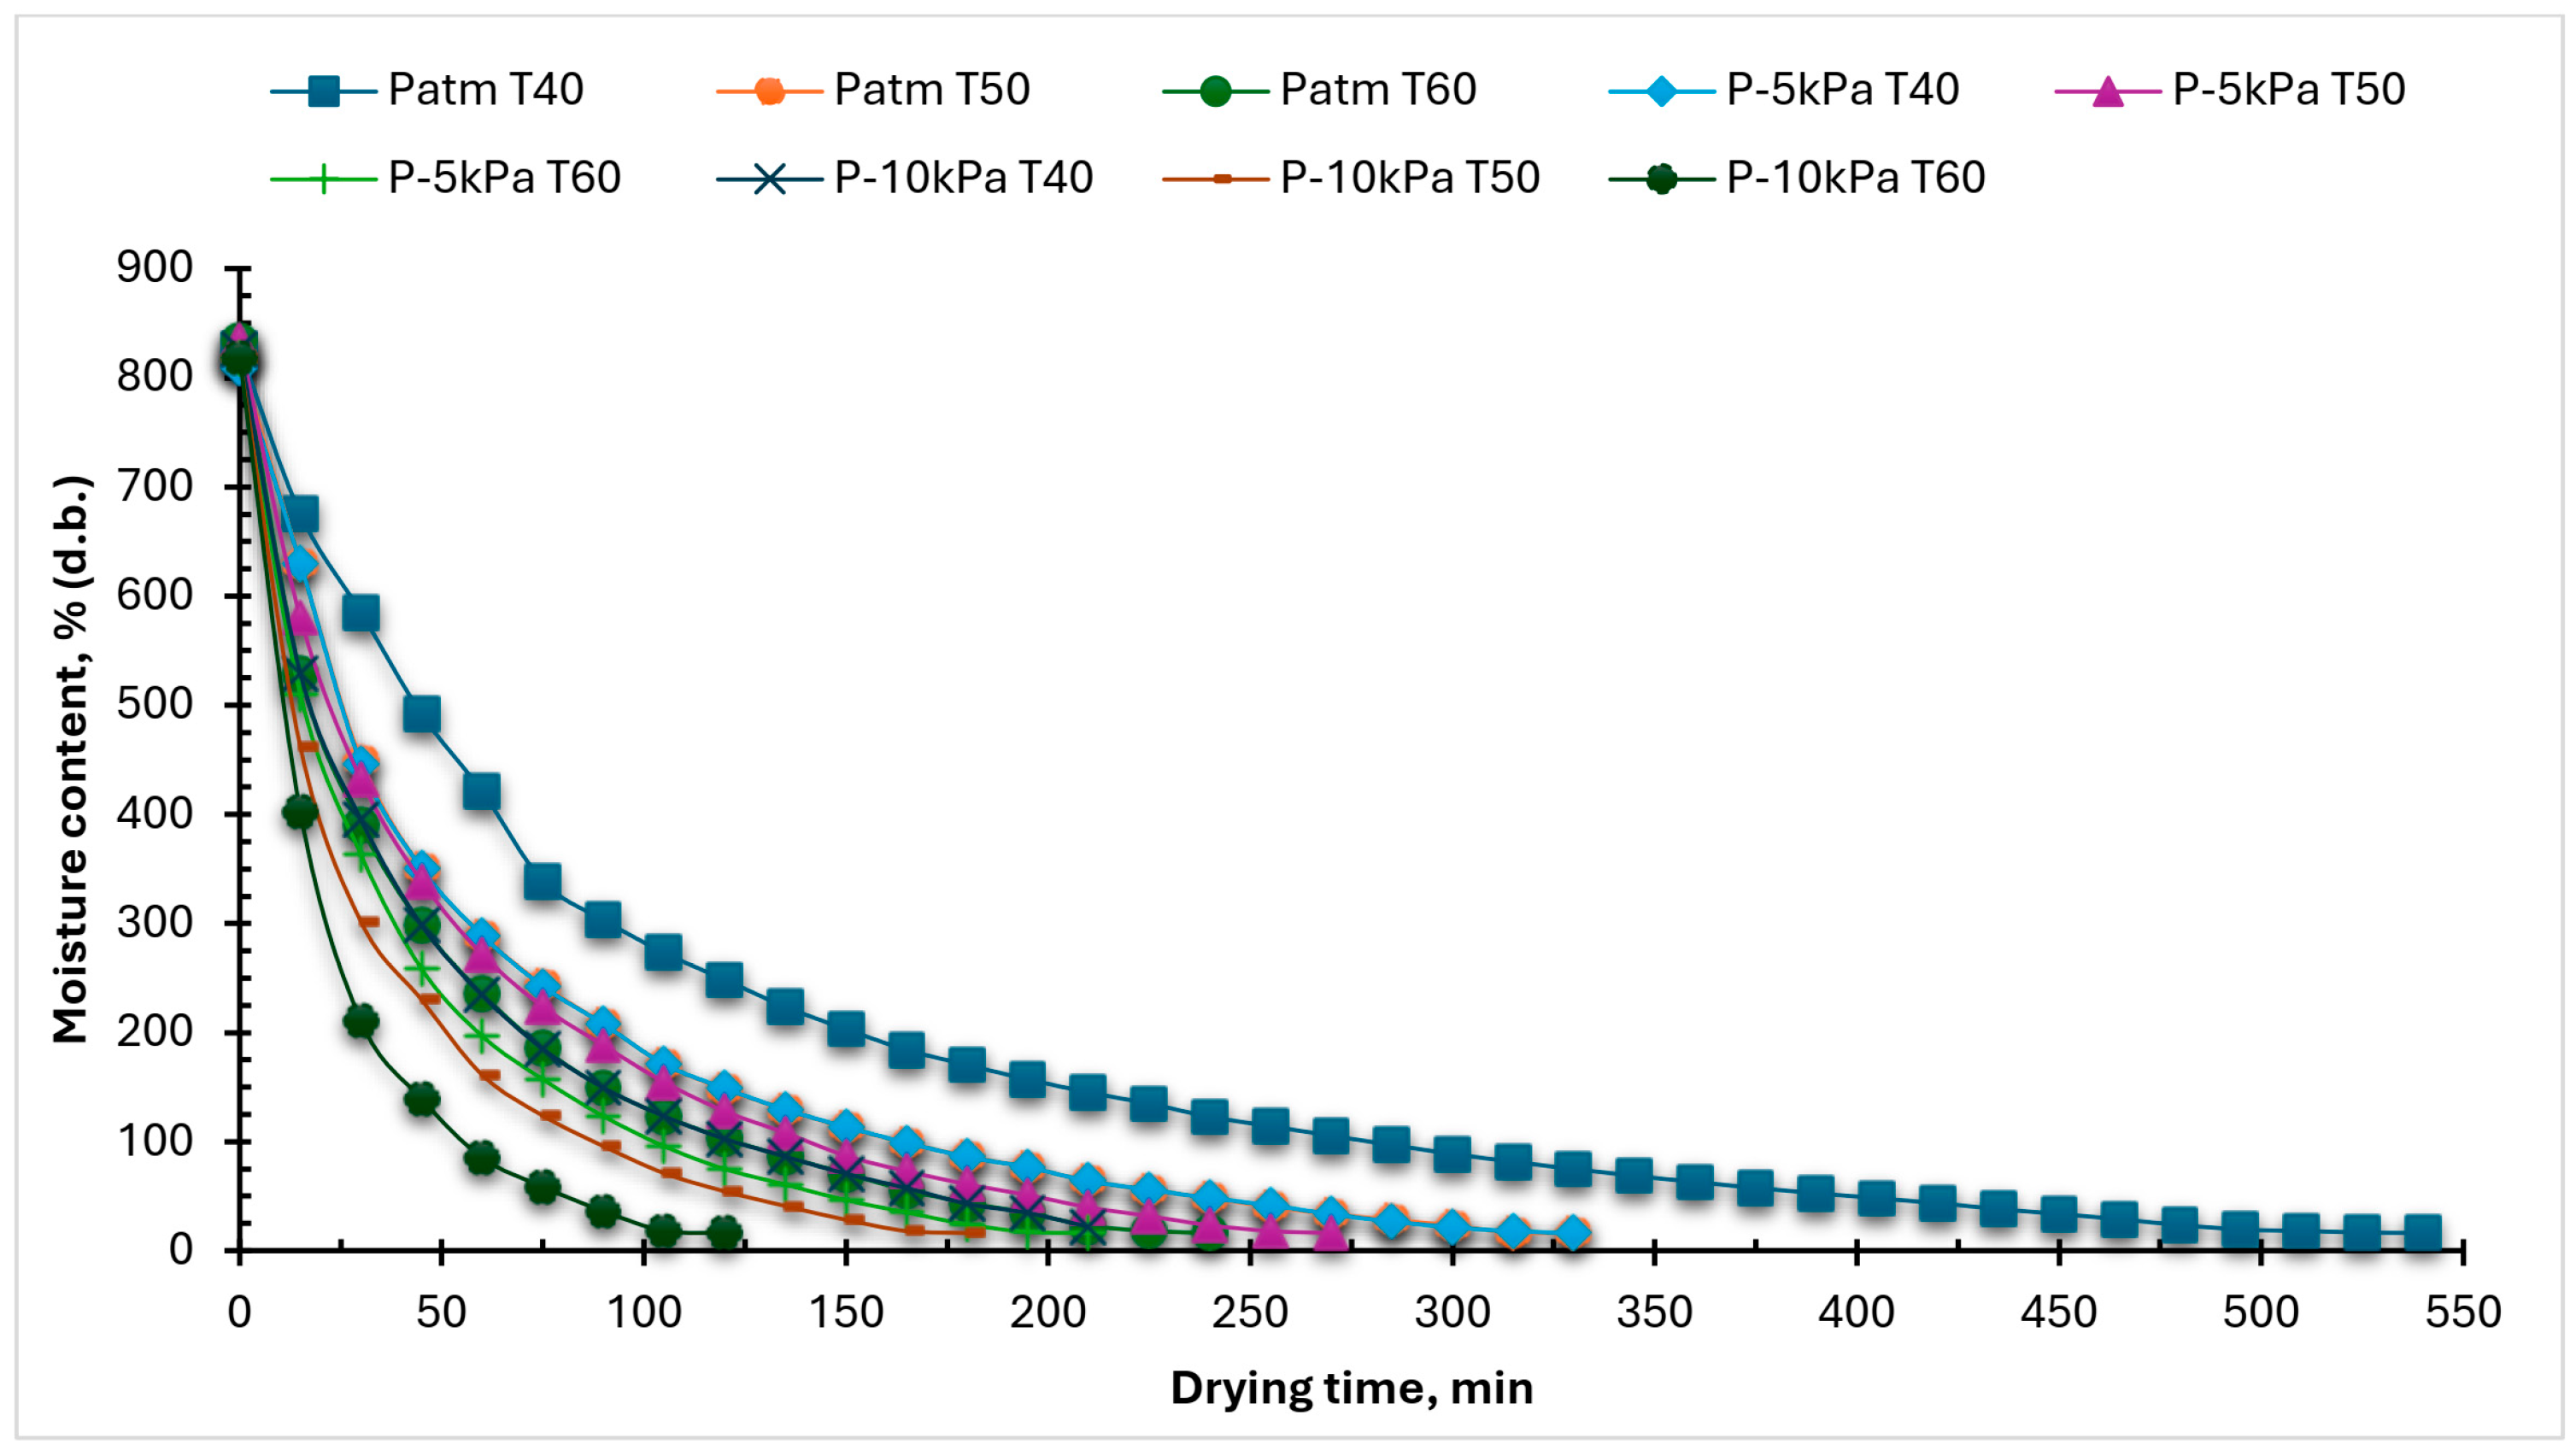
3.1. Accumulated Weight Loss and Moisture Content of Marjoram Leaves at Different Levels of OPs and DTs
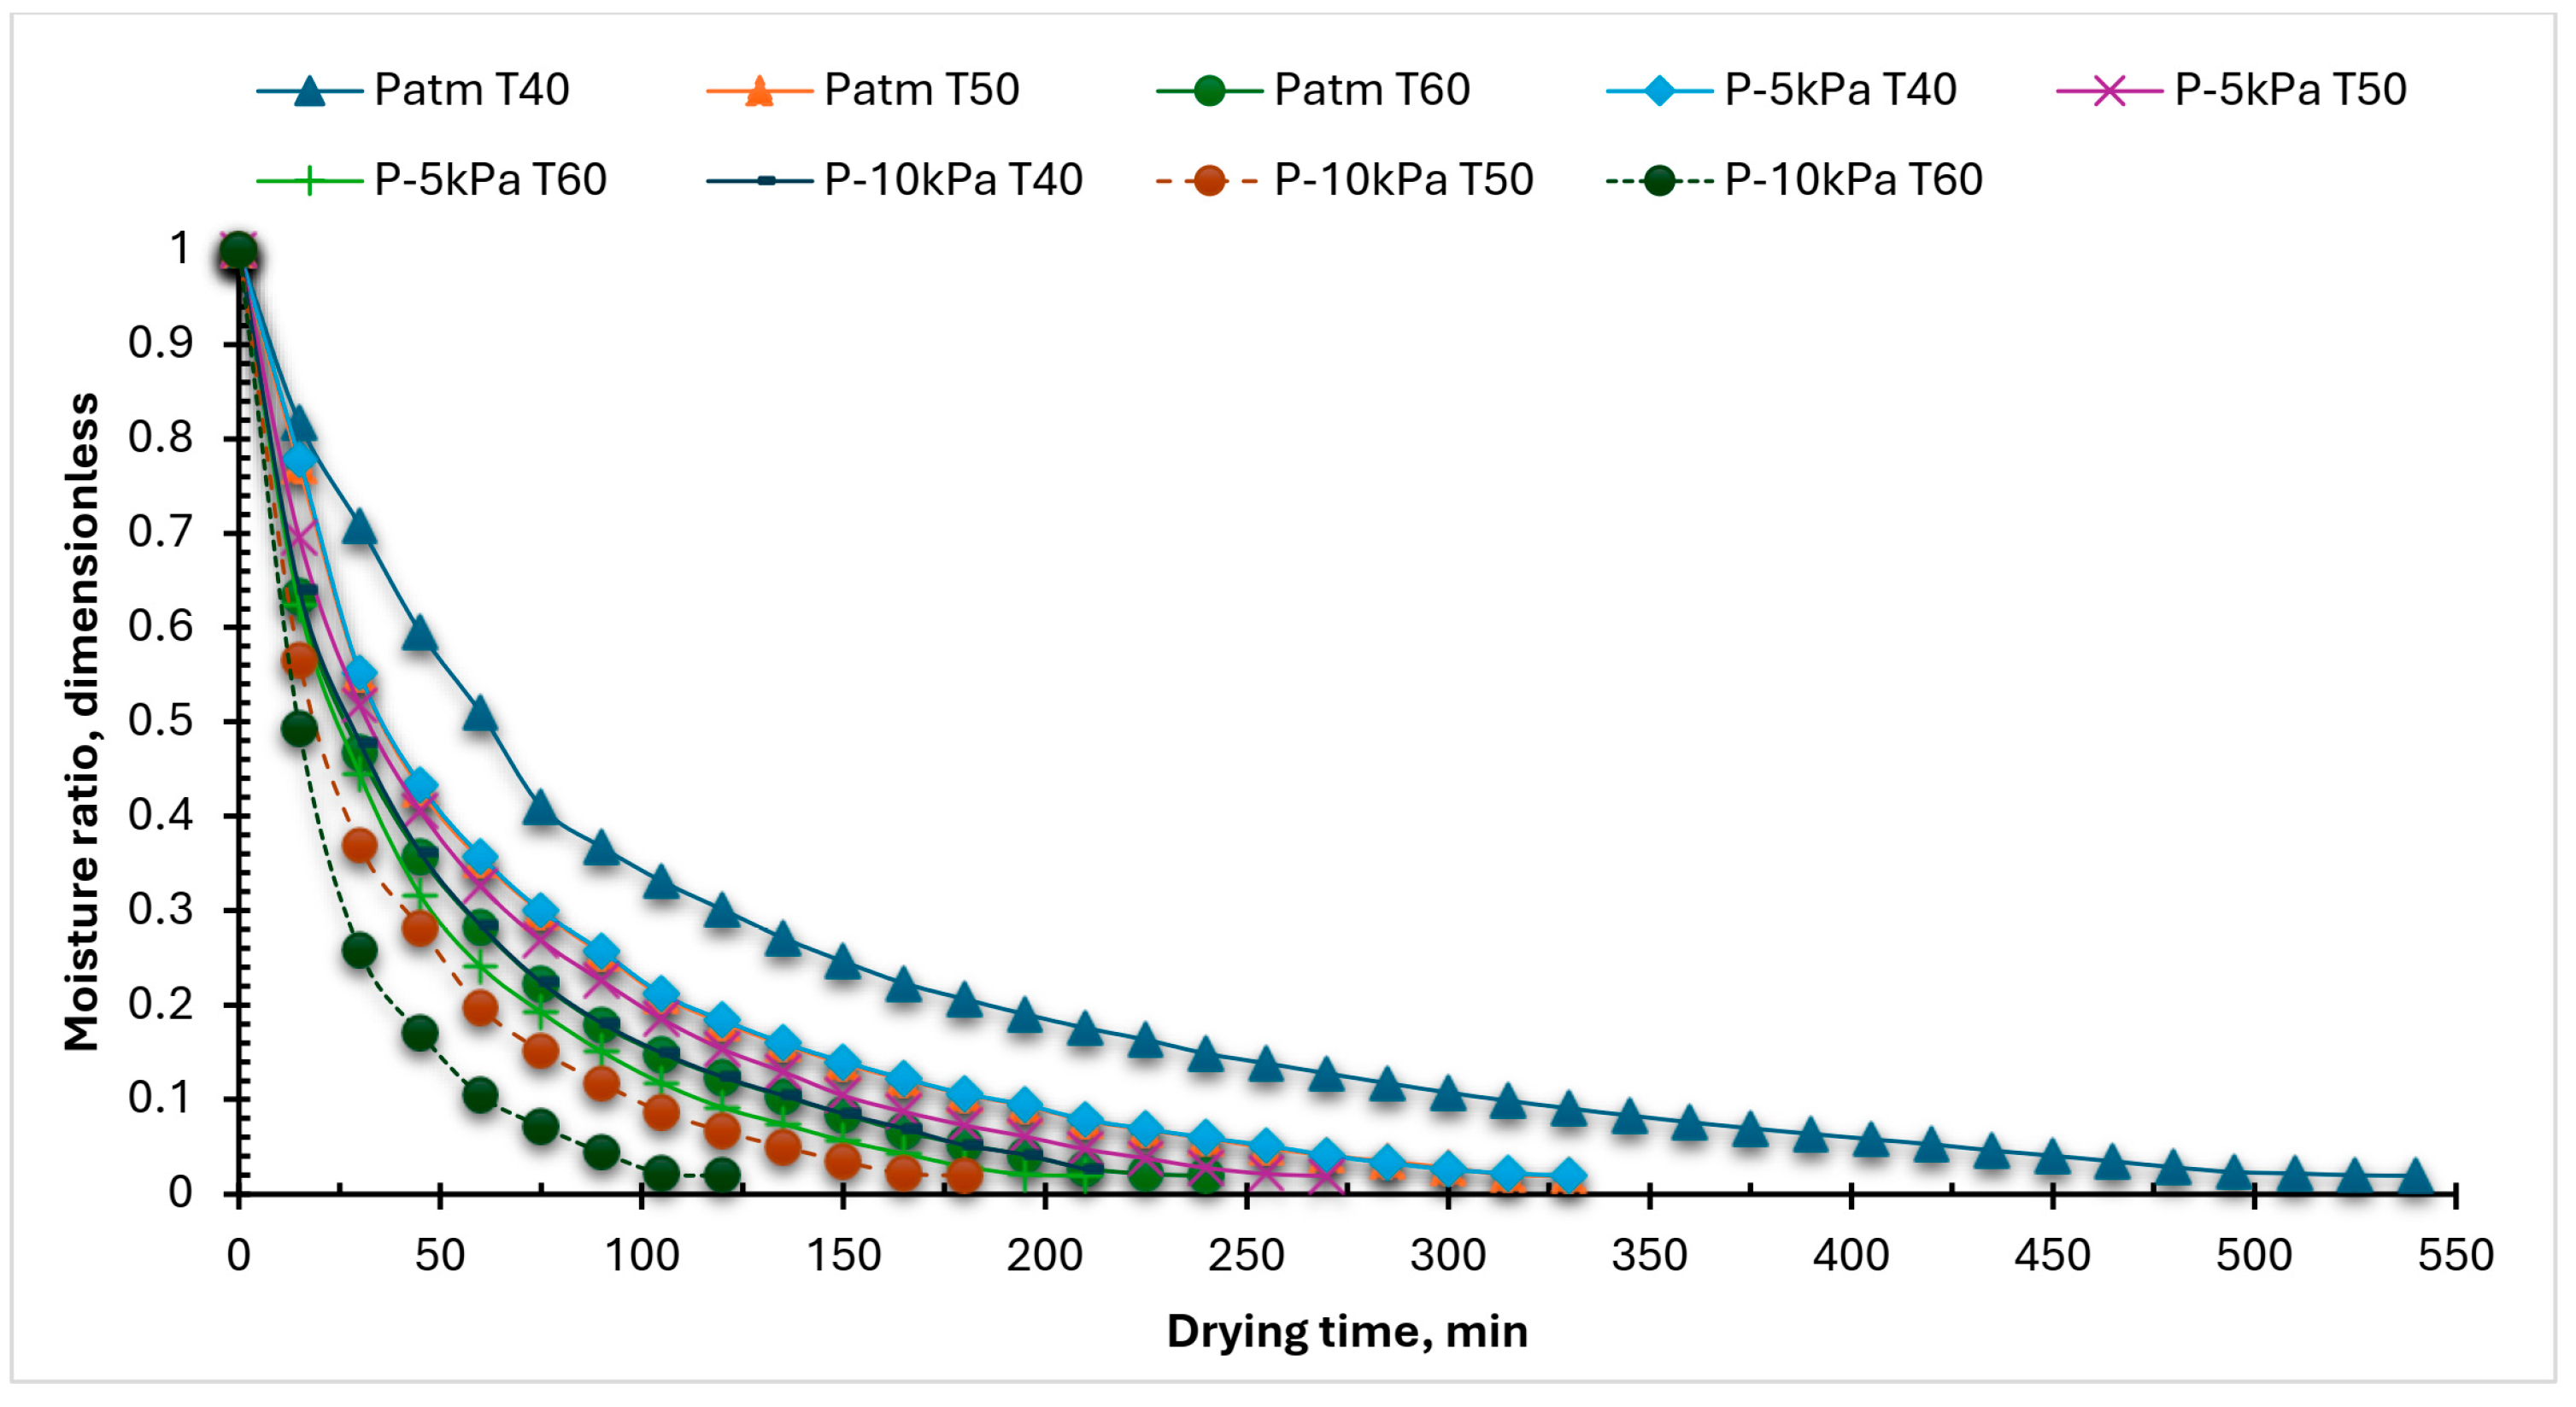
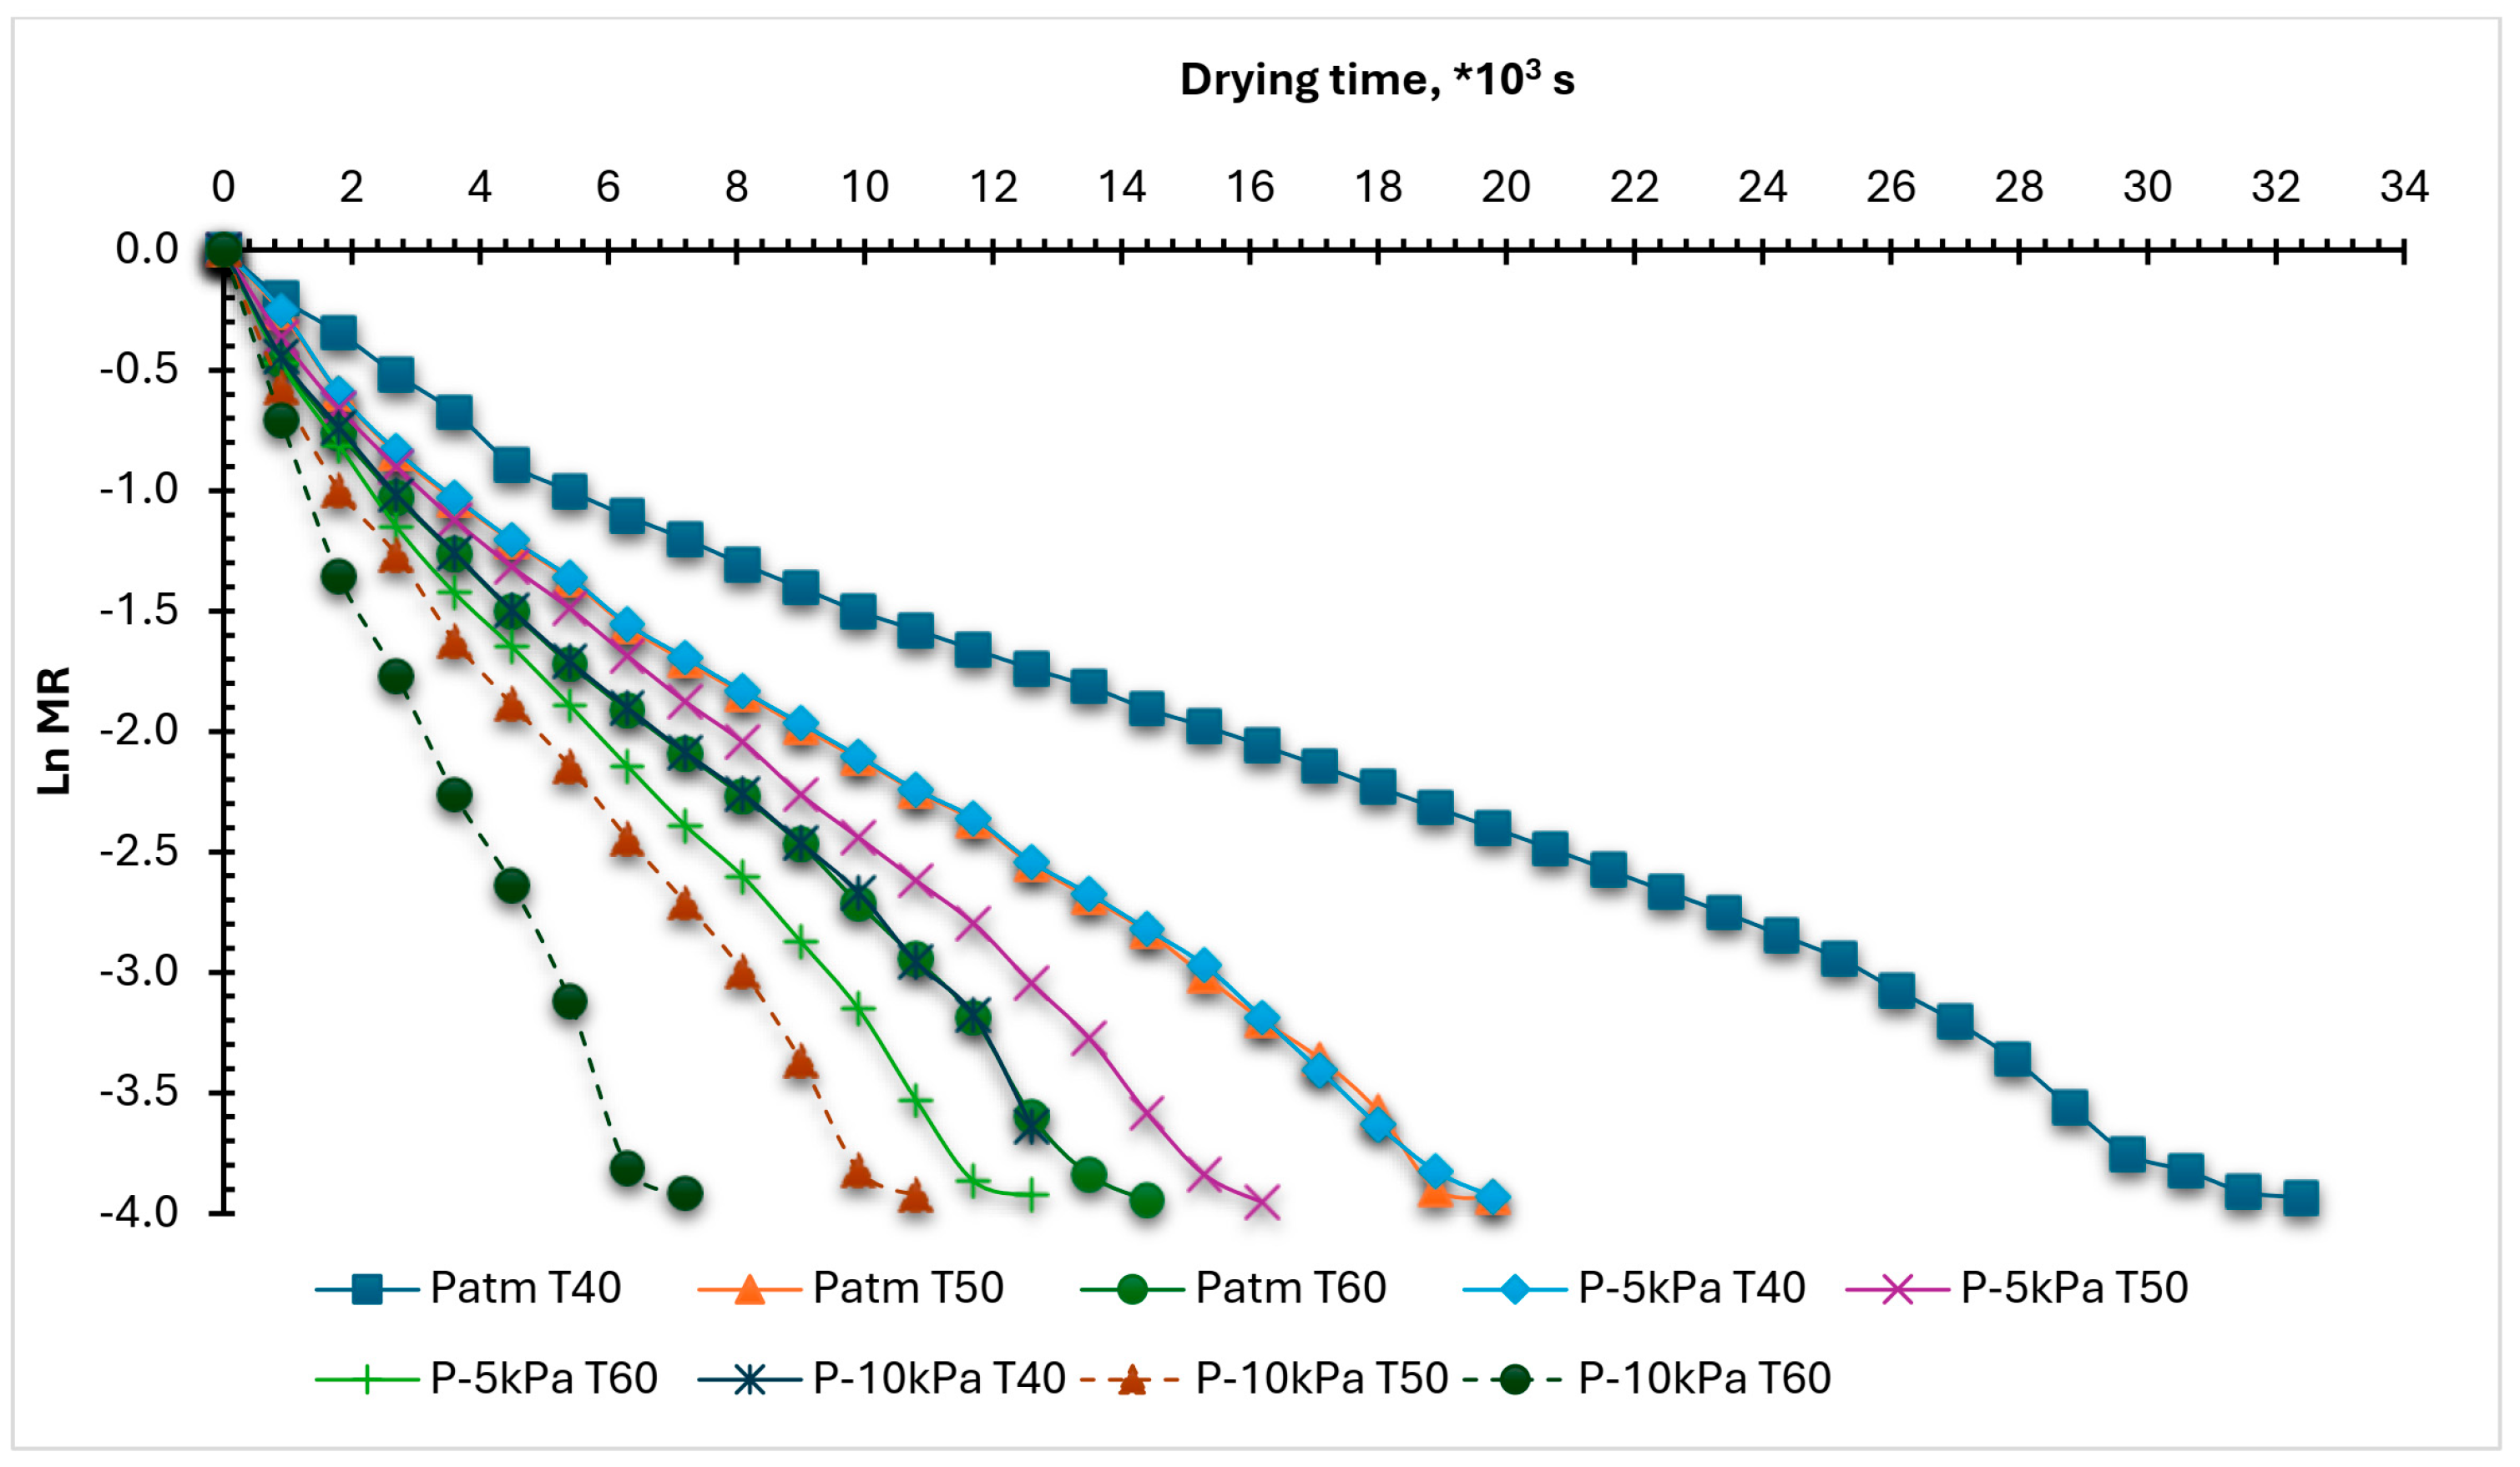
3.2. MR of Marjoram Leaves at Different Levels of OPs and DTs
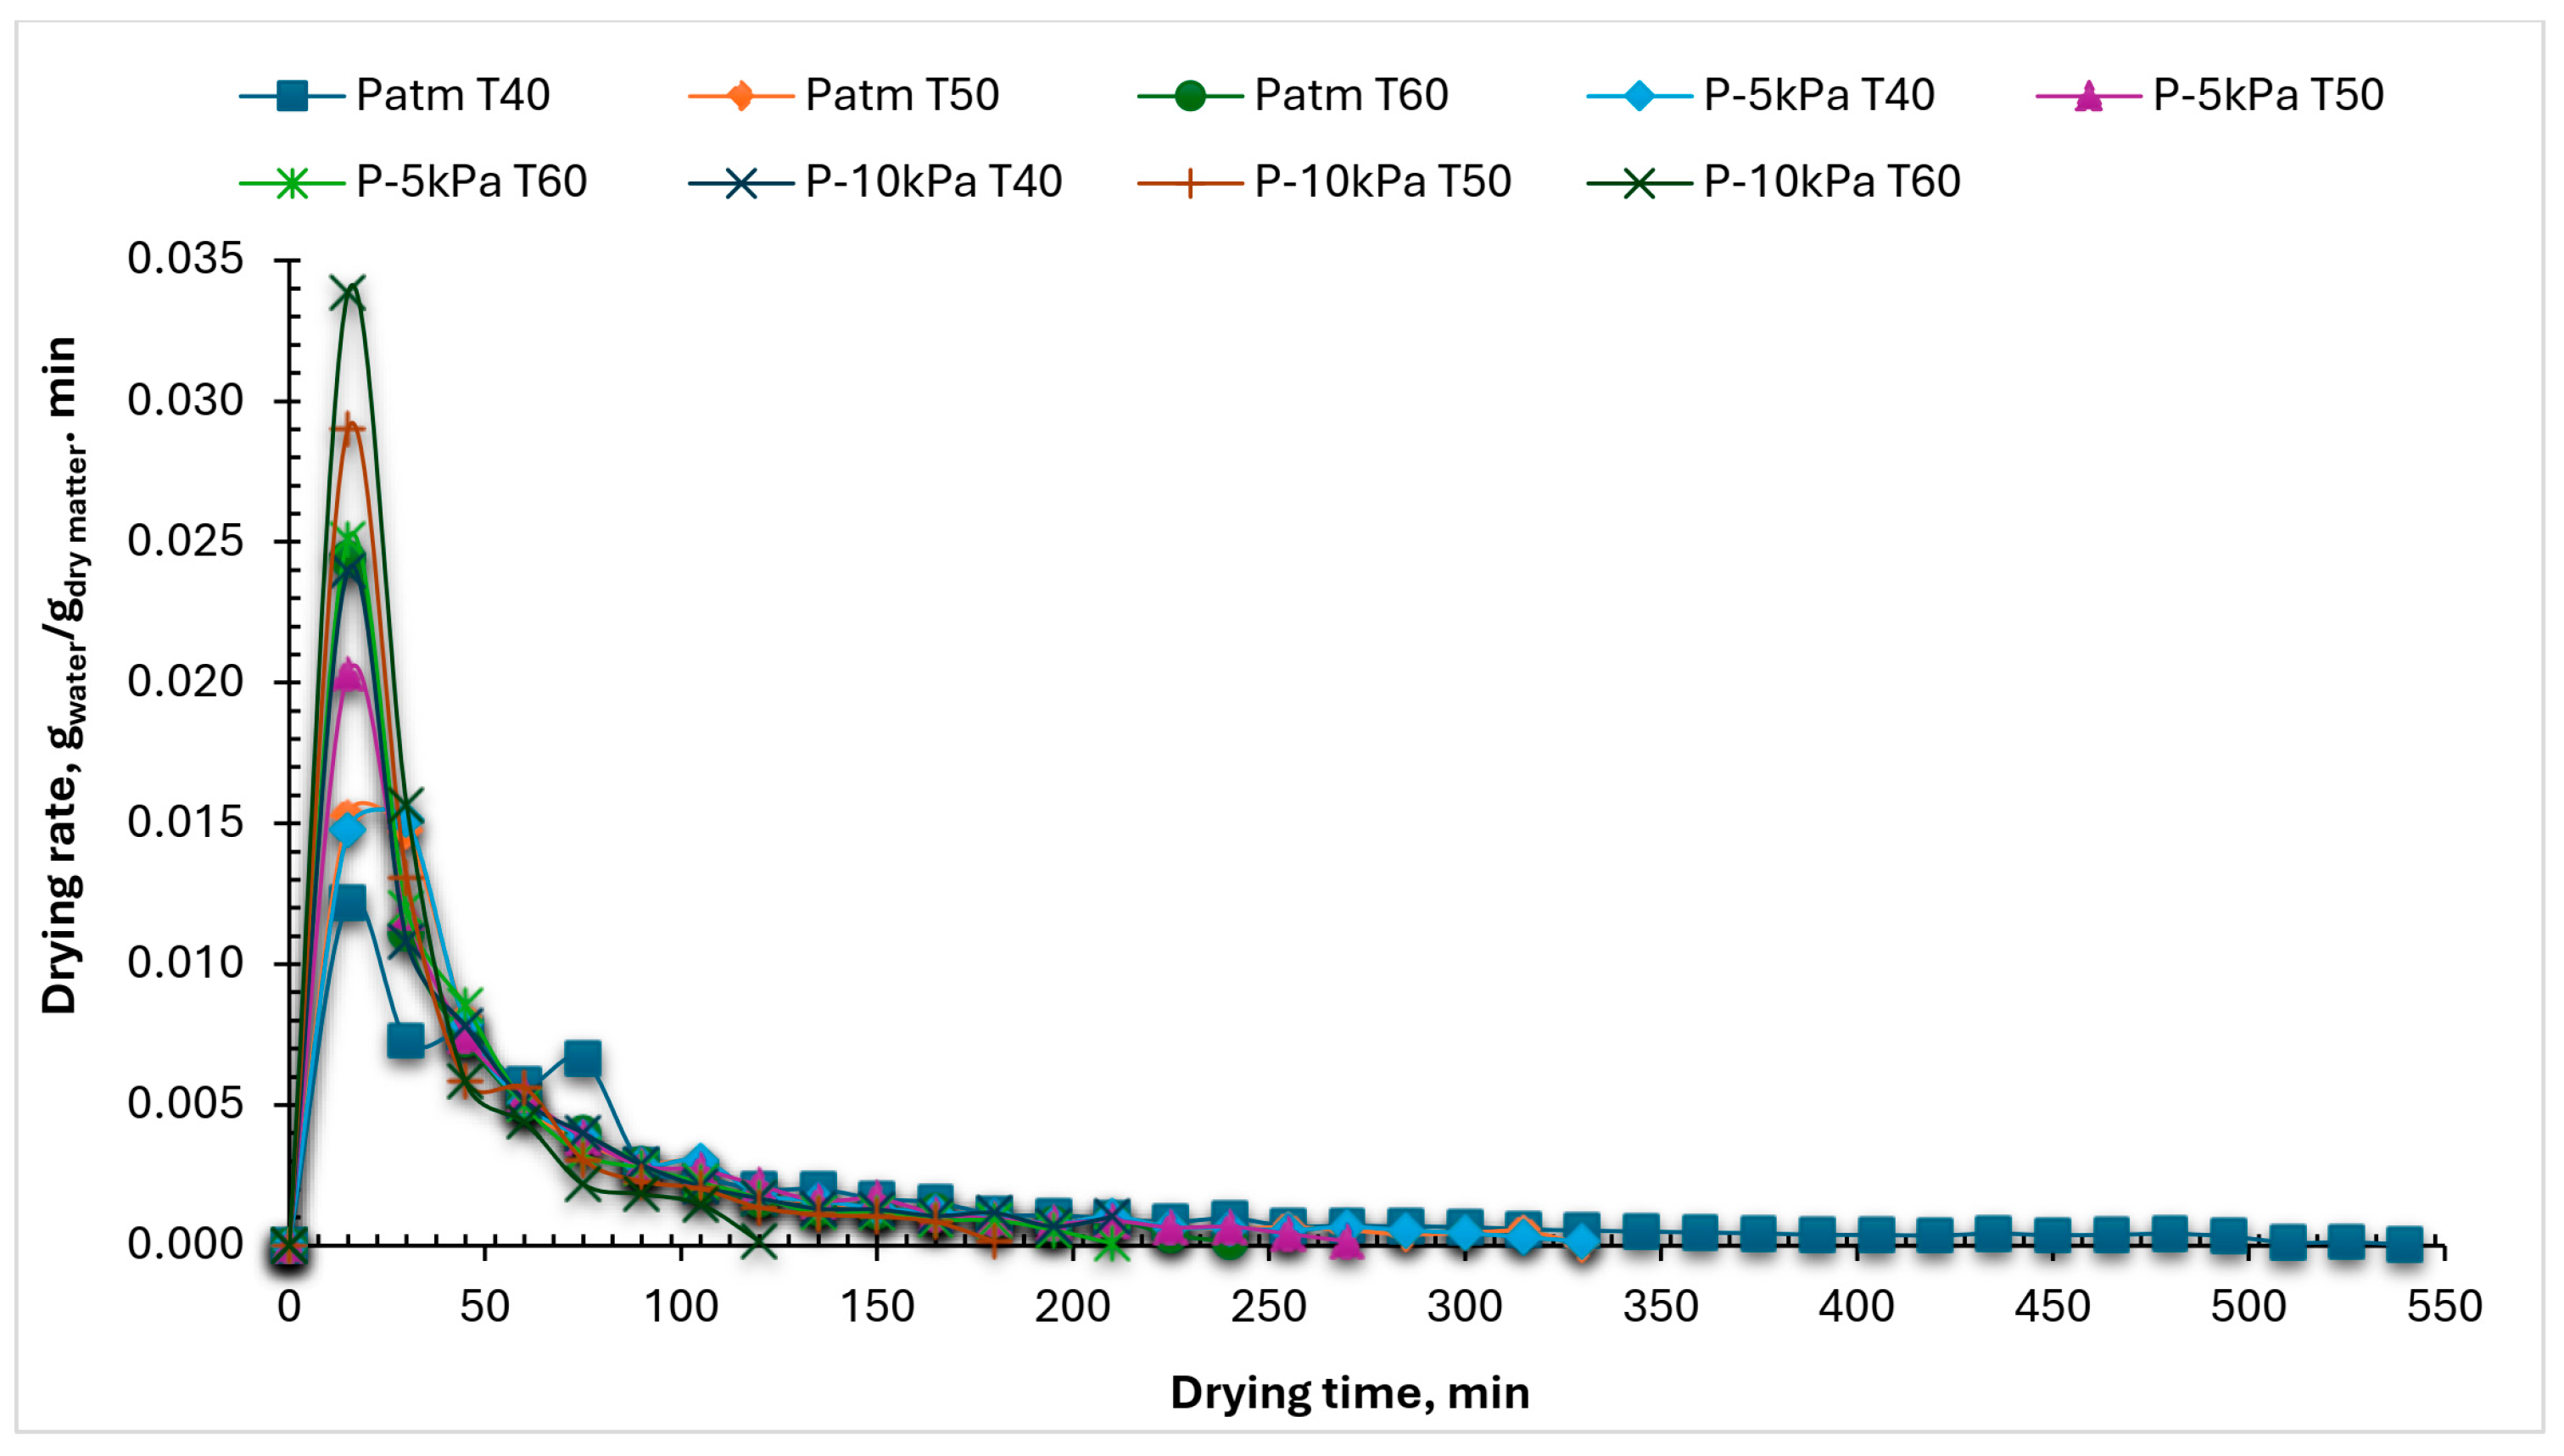
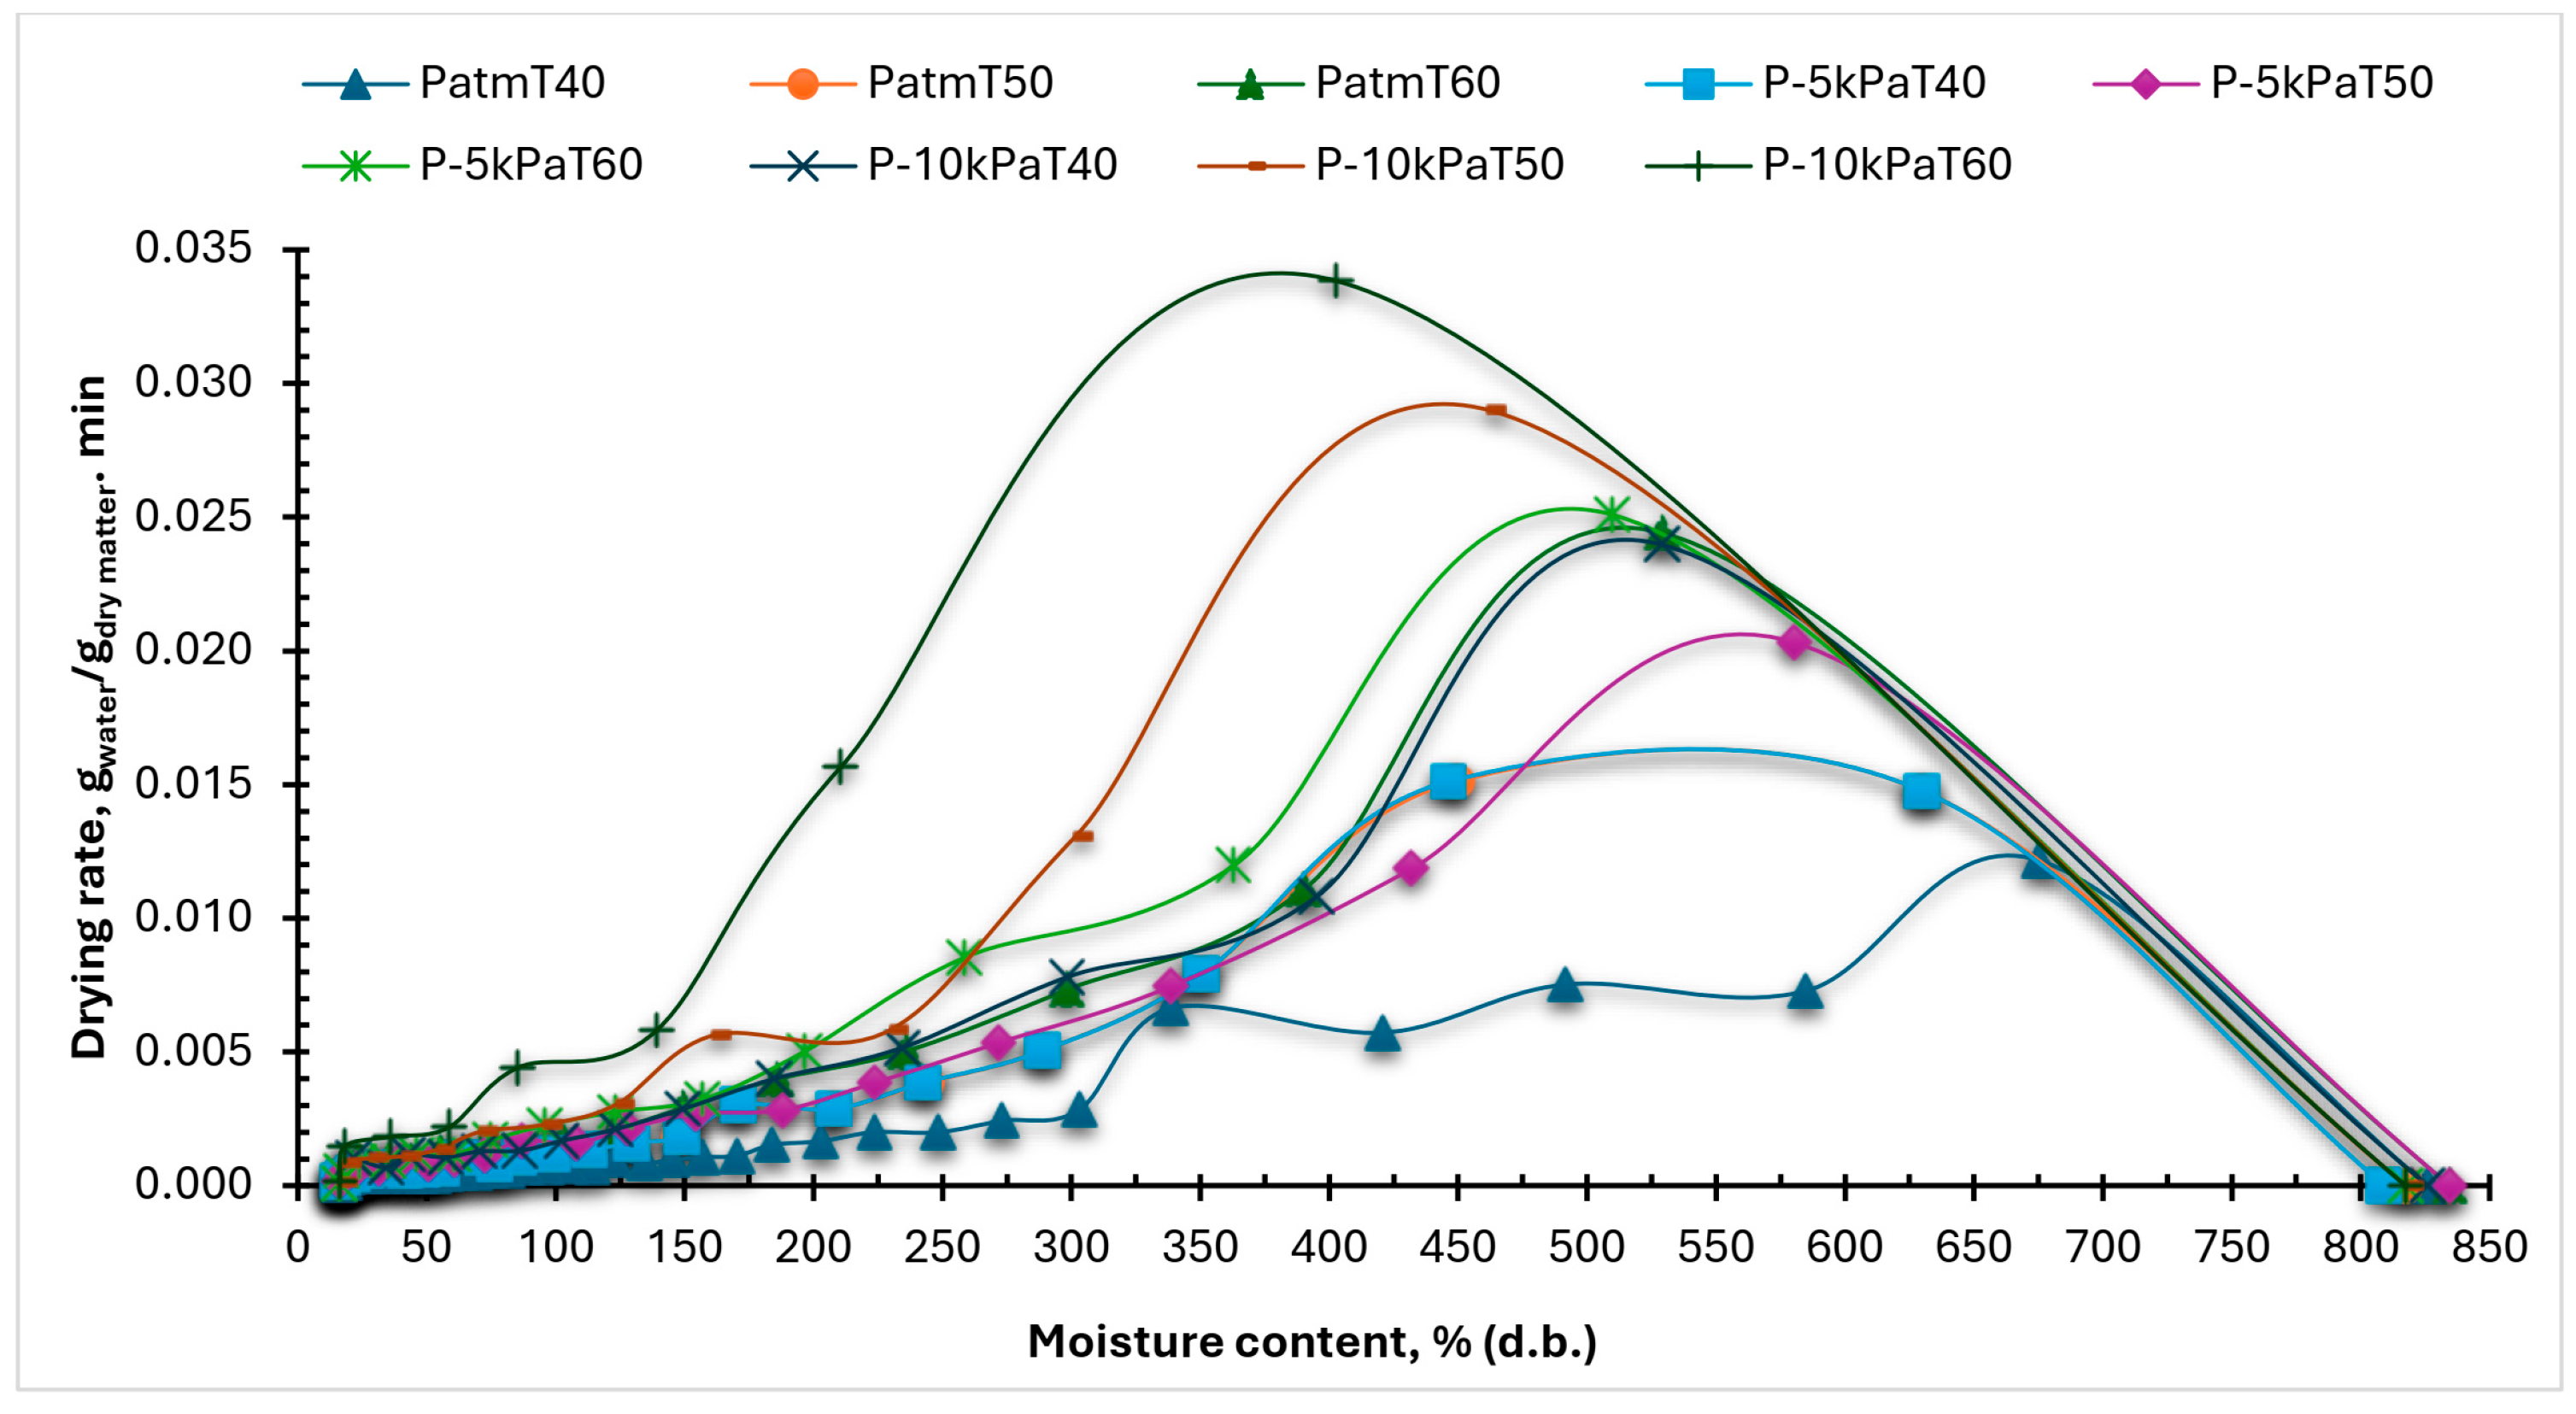
3.3. DR of Marjoram Leaves at Different Levels of OPs and DTs
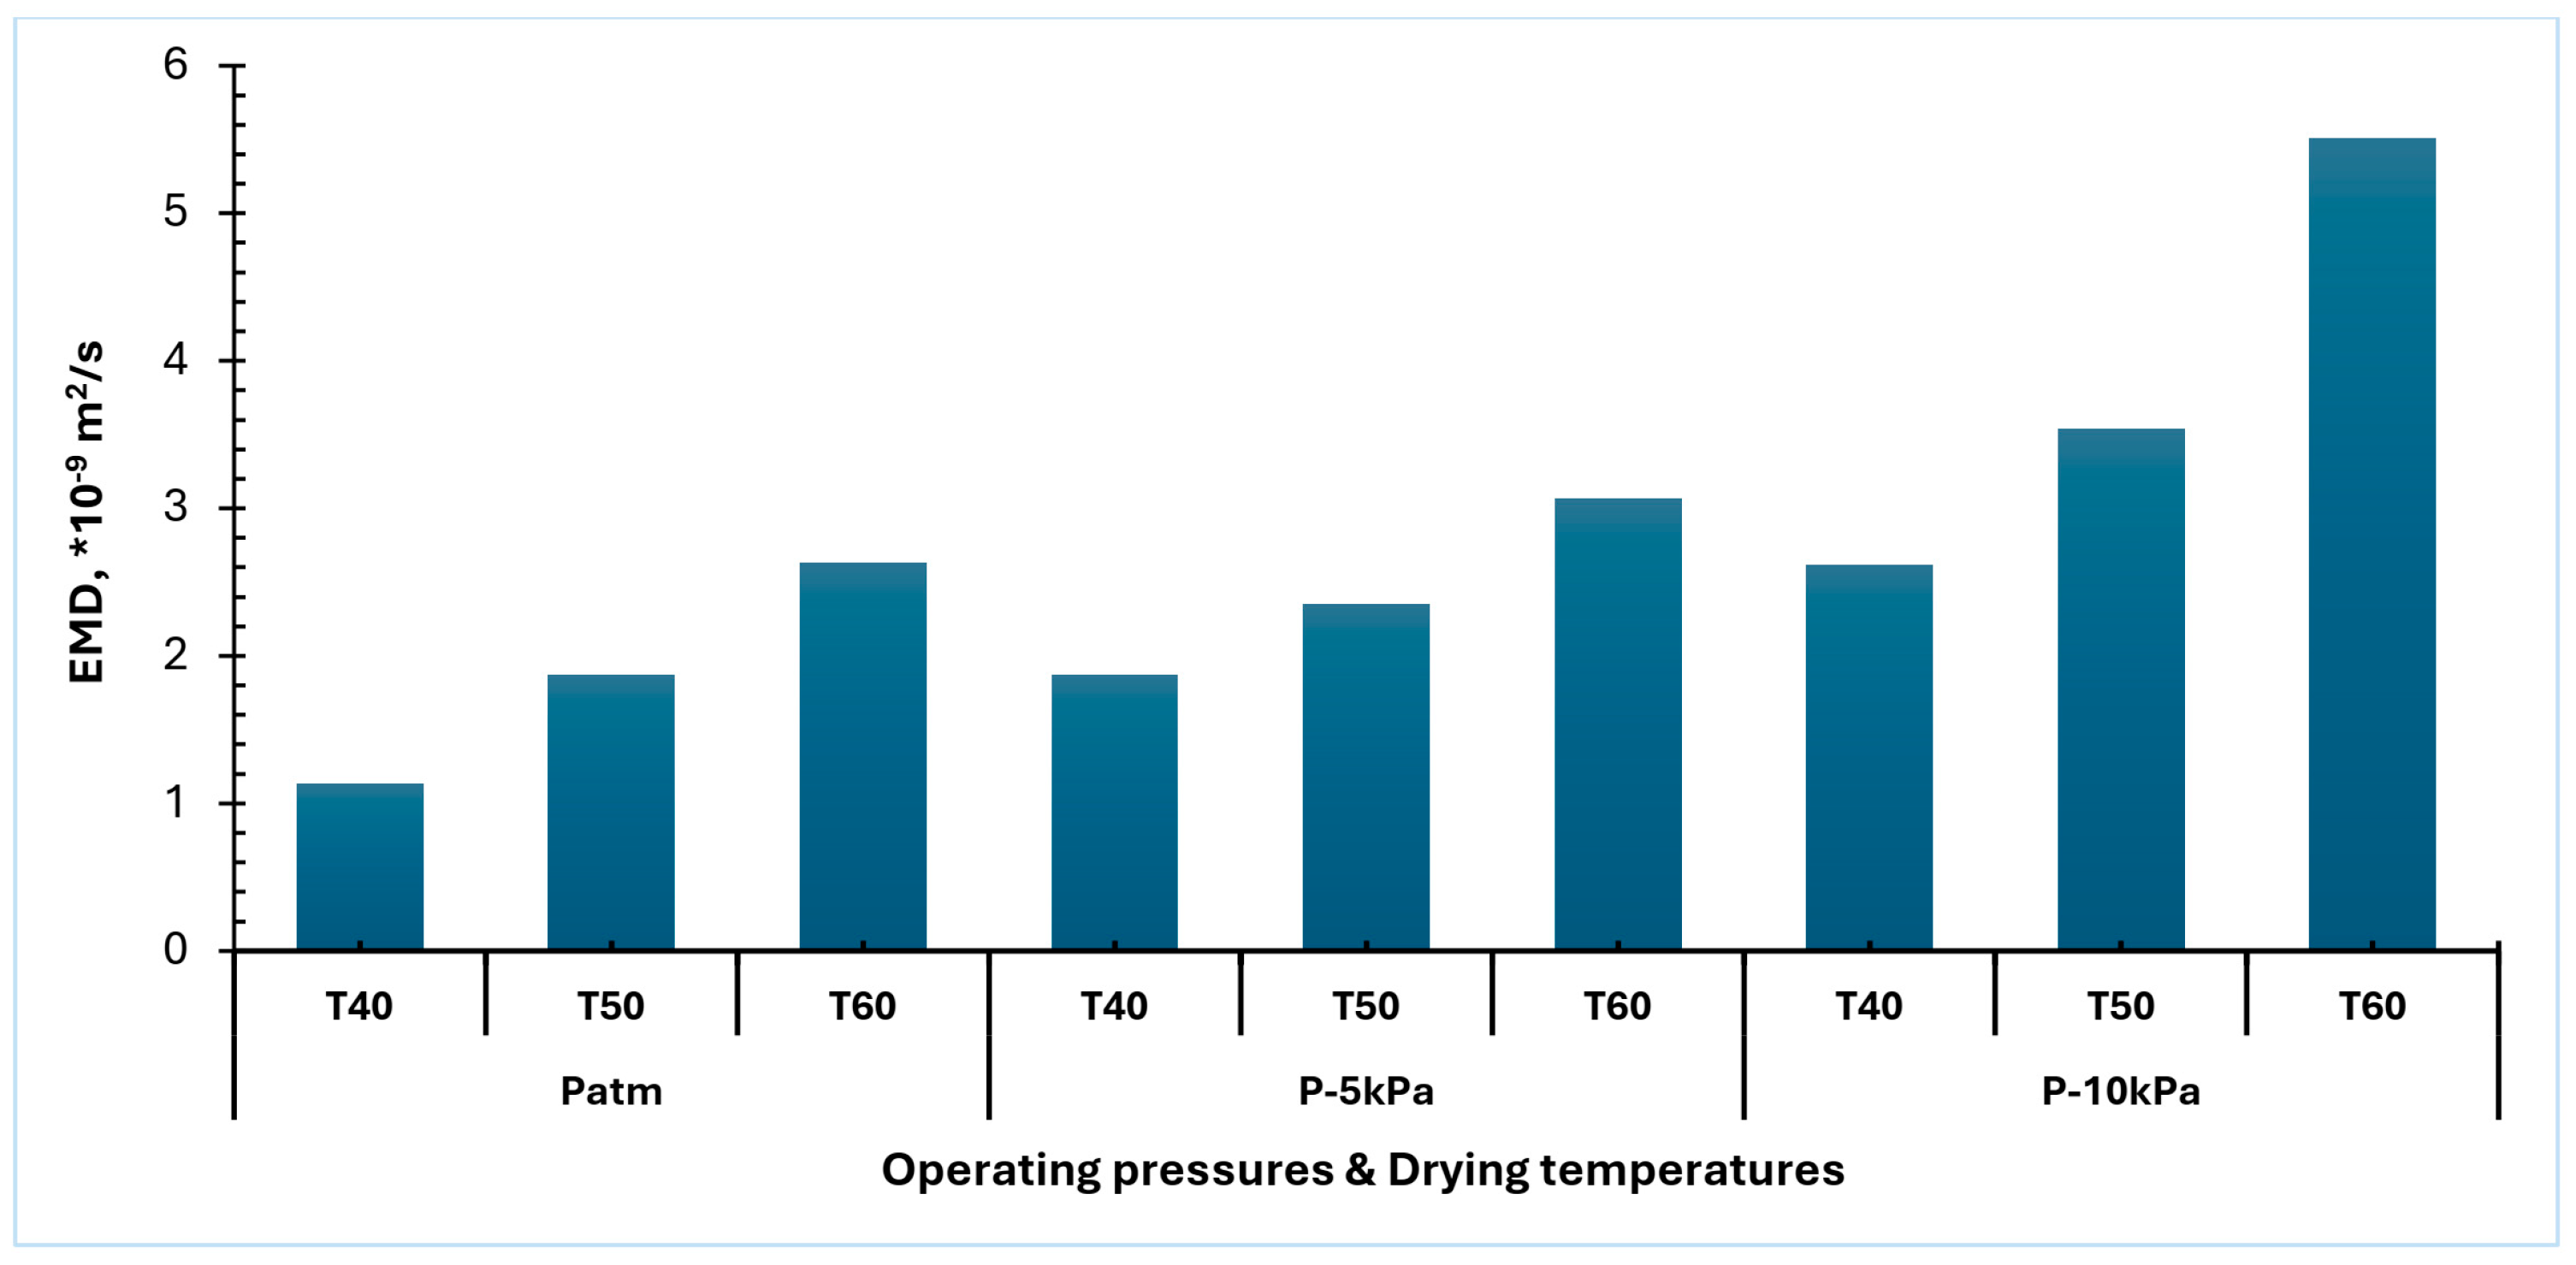
3.4. Moisture Diffusivity (Deff) of Marjoram Leaves at Different Levels of OPs and DTs
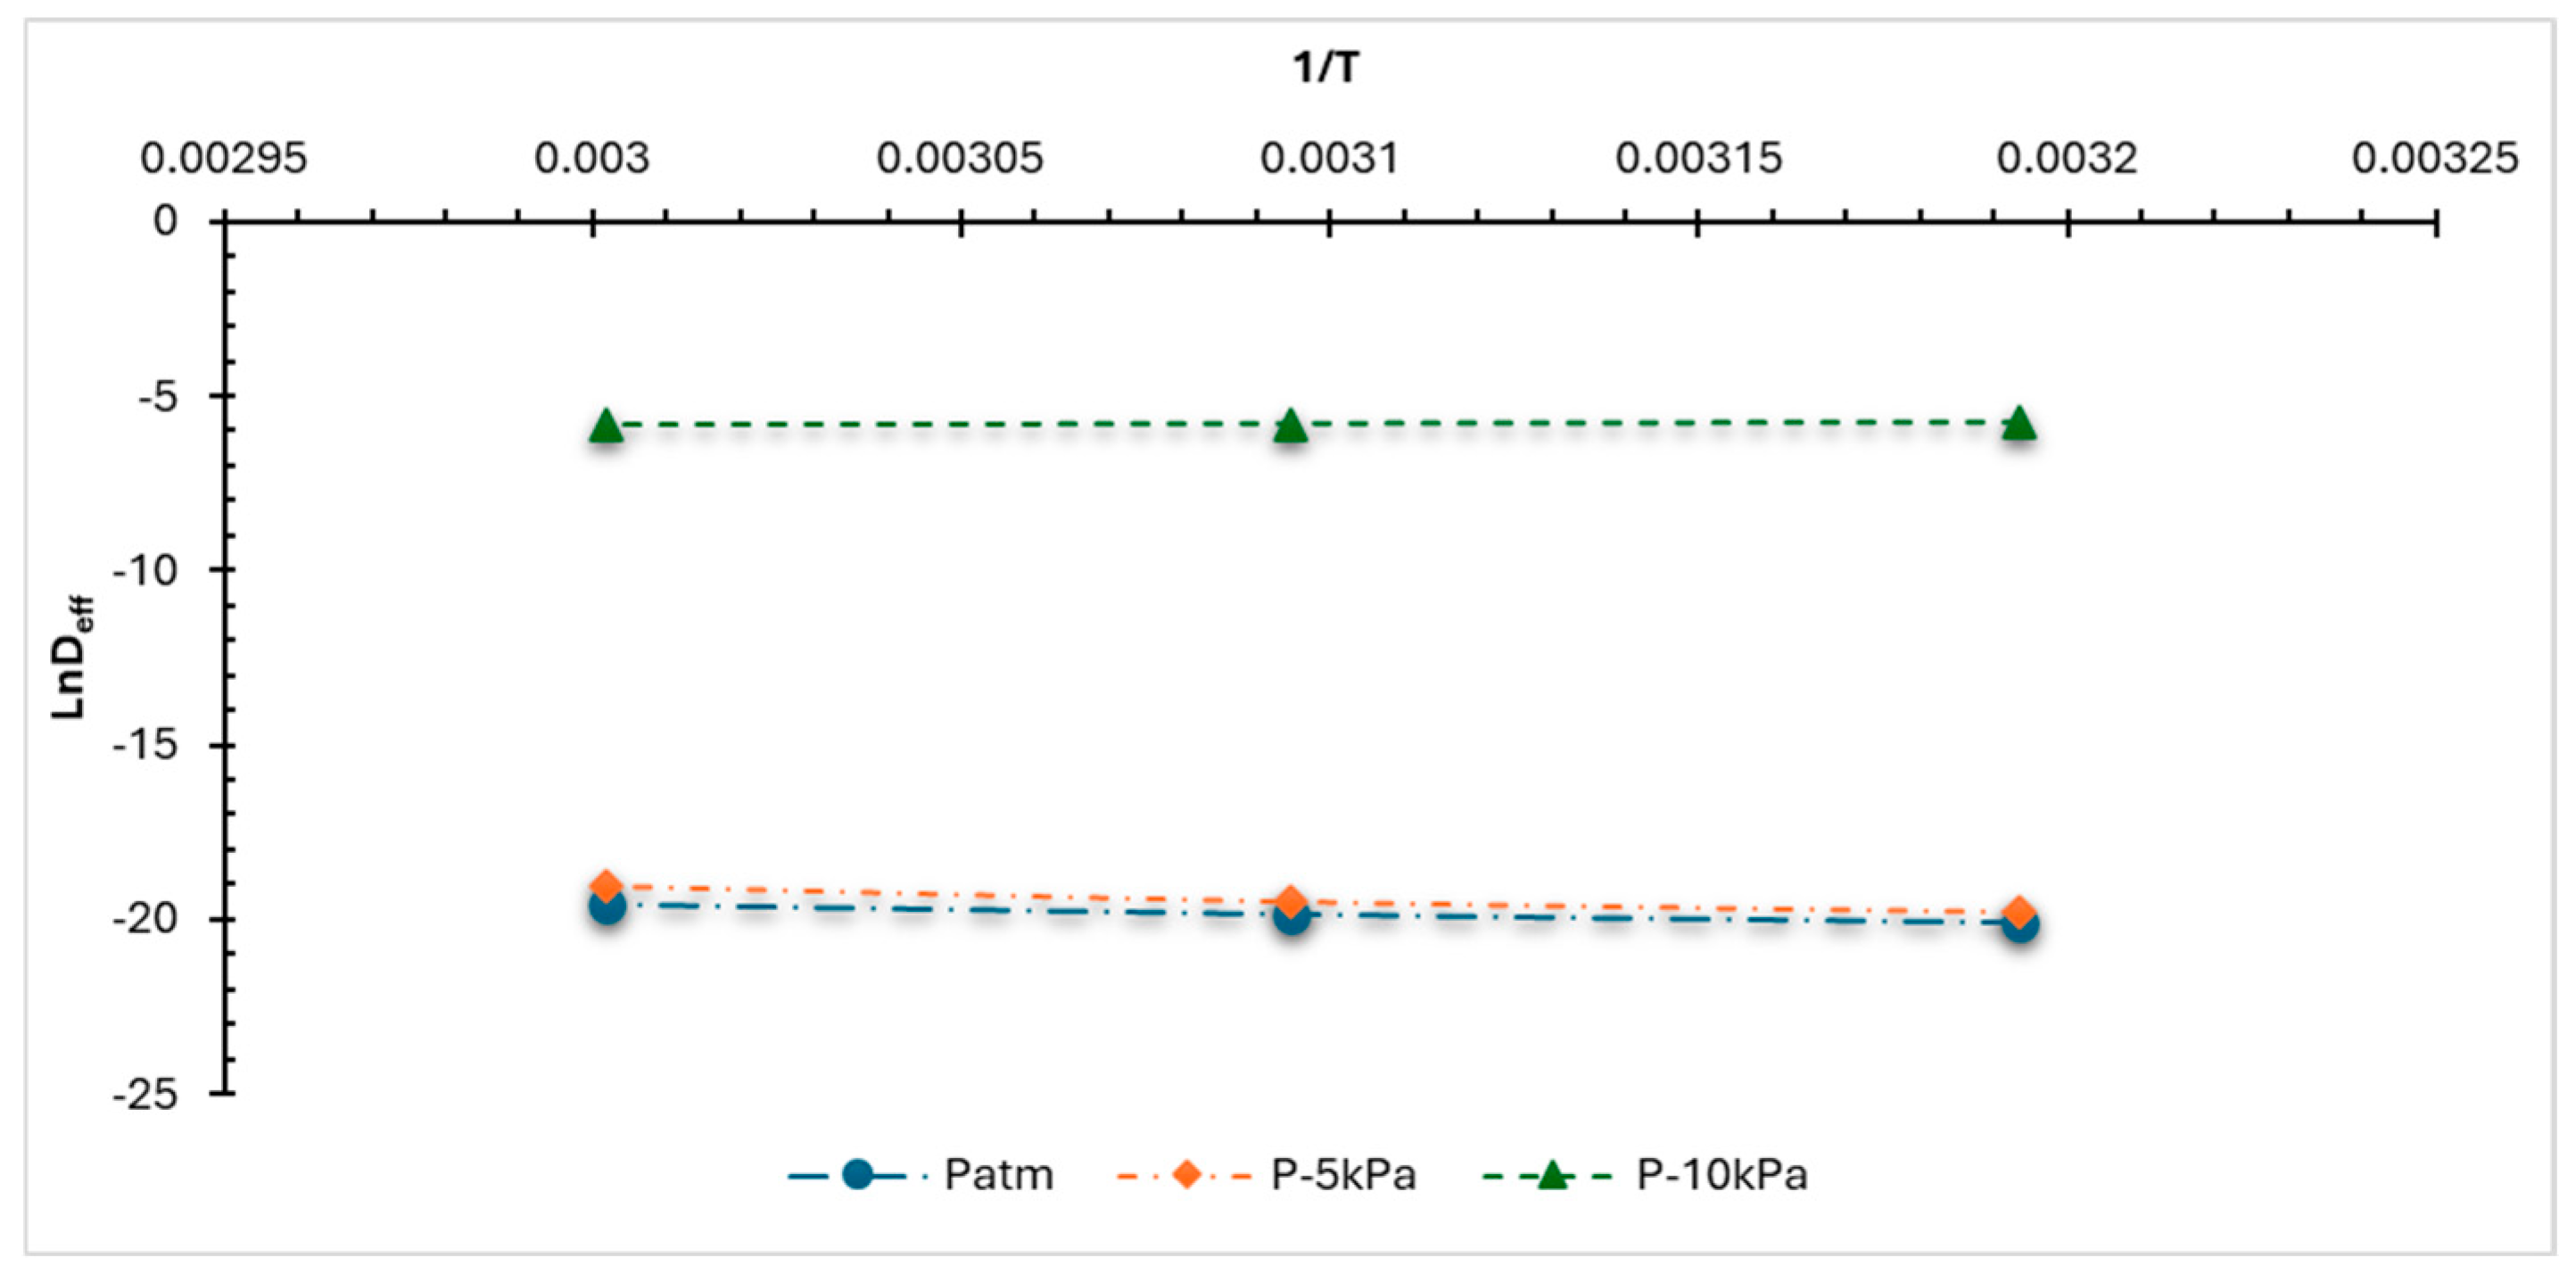
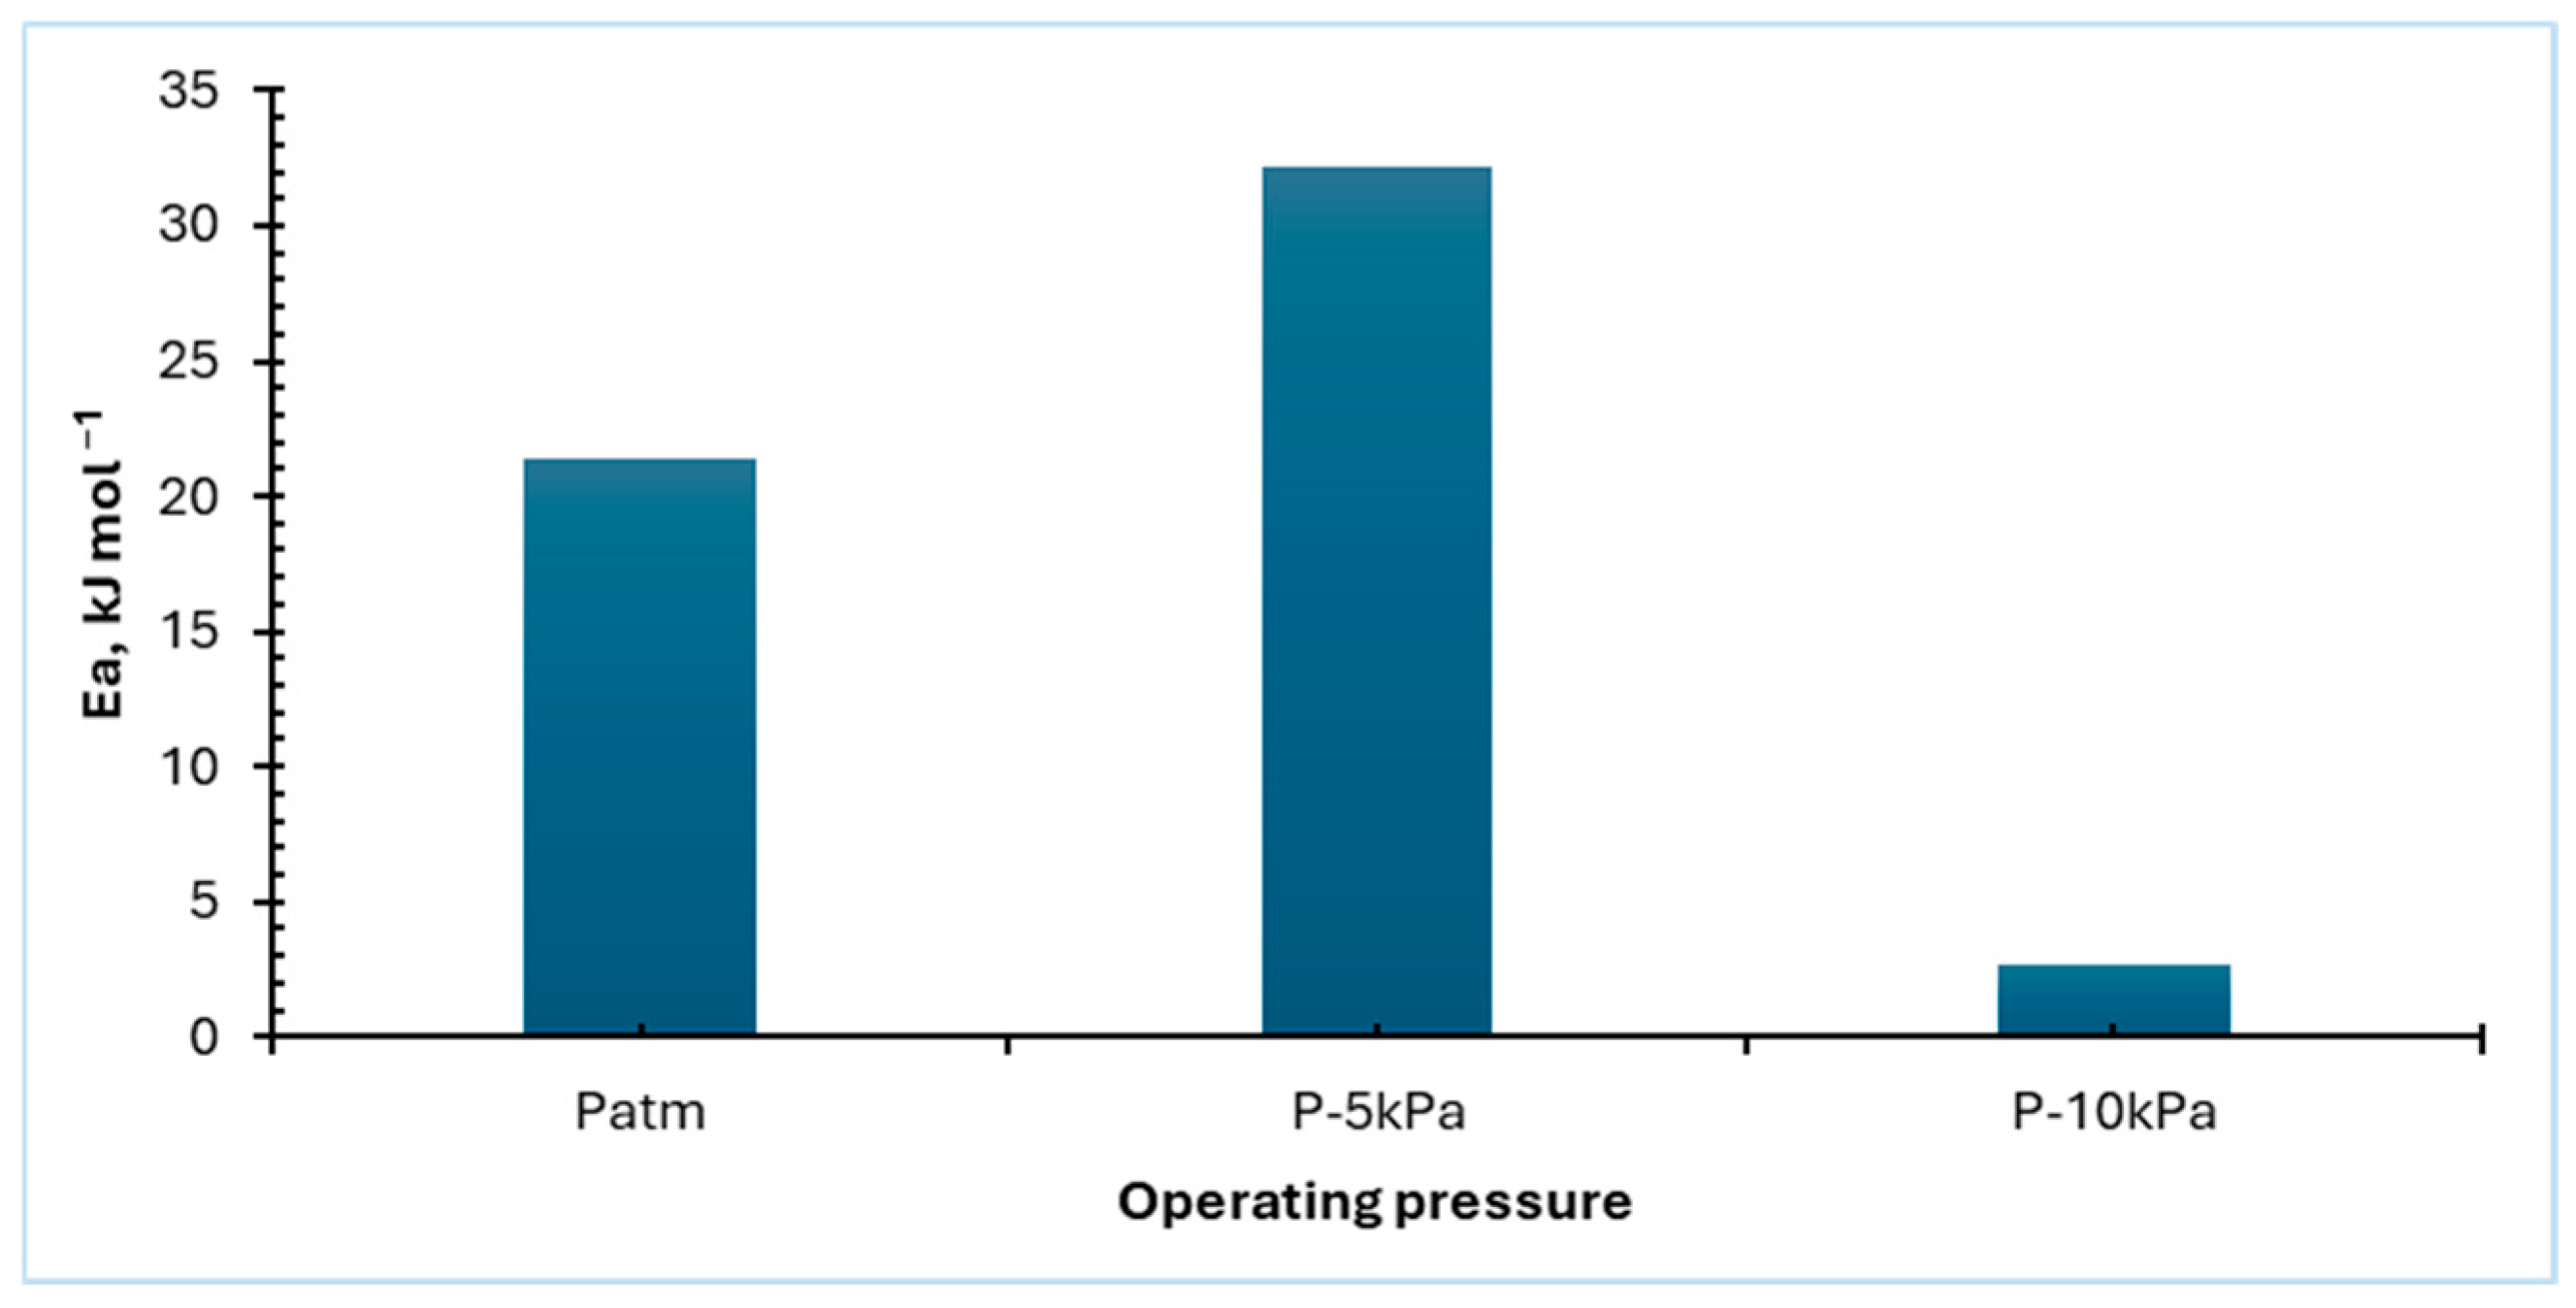
3.5. Activating Energy (AE) of Marjoram Leaves at Different Levels of OPs and DTs
3.6. Mathematical Modeling of Marjoram Leaves at Different Levels of OPs and DTs
3.7. Thermodynamic Properties of Marjoram Leaves at Different Levels of OPs and DTs
3.8. Economic Analysis
4. Conclusions
- ➢
- Drying marjoram leaves at a drying temperature (DT) of 60 °C, and an operating pressure (OP) of −10 kPa resulted in a decrease in drying time by approximately 77.78% and increased the drying rate to 0.034 gwater/gdry matter.min.
- ➢
- The moisture diffusivity (Deff) ranged between 1.13 × 10⁻⁹ and 5.51 × 10⁻⁹ m2/s, with the highest value observed at an OP of –10 kPa and a temperature difference (DT) of 60 °C.
- ➢
- The activation energy (AE) values were 21.33, 32.21, and 2.68 mol/K at OPs of atm, −5 kPa, and −10 kPa, respectively.
- ➢
- The modified Midilli (I) model was ideal, and it is the fittest mathematical model to describe the drying process of marjoram leaves using the DVD.
- ➢
- Among the thermodynamic parameters of marjoram leaves, it was observed that enthalpy values decrease with increasing DT and decreasing OP. Additionally, all tests showed negative entropy.
- ➢
- The economic analysis revealed that drying marjoram leaves at 10 kPa and 60 °C resulted in yearly cost savings of up to USD 2054.19 and reduced the investment payback period to approximately 0.139 years (about 2 months).
Author Contributions
Funding
Institutional Review Board Statement
Informed Consent Statement
Data Availability Statement
Acknowledgments
Conflicts of Interest
References
- Ramadan, G.; El-Beih, N.M.; Zahra, M.M. Egyptian Sweet Marjoram Leaves Protect against Genotoxicity, Immunosuppression and Other Complications Induced by Cyclophosphamide in Albino Rats. Br. J. Nutr. 2012, 108, 1059–1068. [Google Scholar] [CrossRef] [PubMed]
- Charles, D.J. Marjoram Sweet. In Antioxidant Properties of Spices, Herbs and Other Sources; Springer: New York, NY, USA, 2012; pp. 393–399. [Google Scholar]
- Bina, F.; Rahimi, R. Sweet Marjoram: A Review of Ethnopharmacology, Phytochemistry, and Biological Activities. J. Evid. Based Complement. Altern. Med. 2017, 22, 175–185. [Google Scholar] [CrossRef] [PubMed]
- Thamkaew, G.; Sjöholm, I.; Galindo, F.G. A Review of Drying Methods for Improving the Quality of Dried Herbs. Crit. Rev. Food Sci. Nutr. 2021, 61, 1763–1786. [Google Scholar] [CrossRef] [PubMed]
- Orphanides, A.; Goulas, V.; Gekas, V. Drying Technologies: Vehicle to High-Quality Herbs. Food Eng. Rev. 2016, 8, 164–180. [Google Scholar] [CrossRef]
- Elwakeel, A.E.; Villagran, E.; Rodriguez, J.; Aguilar, C.E.; Ahmed, A.F. Development, Thermodynamic Evaluation, and Economic Analysis of a PVT-Based Automated Indirect Solar Dryer for Date Fruits. Sustainability 2025, 17, 4571. [Google Scholar] [CrossRef]
- Ghanem, T.H.M.; Nsasrat, L.S.; Younis, O.S.; Metwally, K.A.; Salem, A.; Orban, Z.; Eid, M.H.; El-Mesery, H.S.; Eldin, A.Z.; Elmolakab, K.M.; et al. Thin-Layer Modeling, Drying Parameters, and Techno-Enviro-Economic Analysis of a Solar Dried Salted Tilapia Fish Fillets. Sci. Rep. 2025, 15, 5073. [Google Scholar] [CrossRef]
- Younis, O.S.; Oraiath, A.A.T.; Metwally, K.A.; Dessoky, E.S.; Mahmoud, S.F.; Rashed, M.N.; Tantawy, A.A.; Abdallah, S.E.; Eid, M.H.; Taha, M.F.; et al. Drying Characteristics, Environmental and Economic Analysis of a Solar Dryer with Evacuated Tube Solar Collector for Drying Nile Tilapia Slices. Sci. Rep. 2025, 15, 9822. [Google Scholar] [CrossRef]
- Sethupathy, P.; Anandharamakrishnan, C. Challenges and Opportunities. In Conductive Hydro Drying of Foods; Elsevier: Amsterdam, The Netherlands, 2025; pp. 445–471. [Google Scholar]
- Oliveira, S.M.; Brandao, T.R.S.; Silva, C.L.M. Influence of Drying Processes and Pretreatments on Nutritional and Bioactive Characteristics of Dried Vegetables: A Review. Food Eng. Rev. 2016, 8, 134–163. [Google Scholar] [CrossRef]
- Chua, L.Y.W.; Chong, C.H.; Chua, B.L.; Figiel, A. Influence of Drying Methods on the Antibacterial, Antioxidant and Essential Oil Volatile Composition of Herbs: A Review. Food Bioprocess Technol. 2019, 12, 450–476. [Google Scholar] [CrossRef]
- Mansour, N.E.; Metwally, K.A.; Tantawy, A.A.; Elbeltagi, A.; Salem, A.; Dewidar, A.Z.; Okasha, A.M.; Moustapha, M.E.; Elwakeel, A.E. Automated Vacuum Drying Kinetics, Thermodynamics, and Economic Analysis of Sage Leaves. Sci. Rep. 2025, 15, 18779. [Google Scholar] [CrossRef]
- El-Mesery, H.S.; Qenawy, M.; Li, J.; El-Sharkawy, M.; Du, D. Predictive modeling of garlic quality in hybrid infrared-convective drying using artificial neural networks. Food Bioprod. Process. 2024, 145, 226–238. [Google Scholar] [CrossRef]
- Chojnacka, K.; Mikula, K.; Izydorczyk, G.; Skrzypczak, D.; Witek-Krowiak, A.; Moustakas, K.; Ludwig, W.; Kułażyński, M. Improvements in Drying Technologies-Efficient Solutions for Cleaner Production with Higher Energy Efficiency and Reduced Emission. J. Clean. Prod. 2021, 320, 128706. [Google Scholar] [CrossRef]
- Jangam, S.V.; Karthikeyan, M.; Mujumdar, A.S. A Critical Assessment of Industrial Coal Drying Technologies: Role of Energy, Emissions, Risk and Sustainability. Dry. Technol. 2011, 29, 395–407. [Google Scholar] [CrossRef]
- Eissa, A.S.; Gameh, M.A.; Mostafa, M.B.; Elwakeel, A.E. Some Engineering Factors Affecting Utilization of Solar Energy in Drying Tomato Fruits. Aswan Univ. J. Environ. Stud. 2024, 5, 52–68. [Google Scholar] [CrossRef]
- Elwakeel, A.E.; Gameh, M.A.; Eissa, A.S.; Mostafa, M.B. Recent Advances in Solar Drying Technology for Tomato Fruits: A Comprehensive Review. Int. J. Appl. Energy Syst. 2024, 6, 37–44. [Google Scholar] [CrossRef]
- Elwakeel, A.E.; Gameh, M.A.; Oraiath, A.A.T.; Eissa, A.S.; Elsayed, S.; Elmessery, W.M.; Mostafa, M.B.; Alhag, S.K.; Al-Shuraym, L.A.; Moustapha, M.E. Development and Techno-Economic Analysis of a Tracked Indirect Forced Solar Dryer Integrated Photovoltaic System for Drying Tomatoes. Sustainability 2024, 16, 7008. [Google Scholar] [CrossRef]
- Elwakeel, A.E.; El-Mesery, H.S.; Elbeltagi, A.; Salem, A.; Sabry, A.; Saleh, D.I.; Moustapha, M.E.; Abu-Taha, H.L.; Elkot, W.F. Development, drying characteristics, and environmental analysis of a PV operated automatic solar dryer for drying date. Front. Sustain. Food Syst. 2025, 9, 1531601. [Google Scholar] [CrossRef]
- Abdel-Khalek, H.H. Effect of Gamma Irradiation on the Microbial, Chemical Quality and the Biological Activity of Some Spices and Herbs. Ph.D. Thesis, Cairo University, Giza, Egypt, 2008. [Google Scholar]
- Marcelino, S.; Hamdane, S.; Gaspar, P.D.; Paço, A. Sustainable Agricultural Practices for the Production of Medicinal and Aromatic Plants: Evidence and Recommendations. Sustainability 2023, 15, 14095. [Google Scholar] [CrossRef]
- Elmessery, W.M.; Habib, A.; Shams, M.Y.; Abd El-Hafeez, T.; El-Messery, T.M.; Elsayed, S.; Fodah, A.E.M.; Abdelwahab, T.A.M.; Ali, K.A.M.; Osman, Y.K.O.T.; et al. Deep Regression Analysis for Enhanced Thermal Control in Photovoltaic Energy Systems. Sci. Rep. 2024, 14, 30600. [Google Scholar] [CrossRef]
- Khater, E.S.G.; Bahnasawy, A.H.; Oraiath, A.A.T.; Alhag, S.K.; Al-Shuraym, L.A.; Moustapha, M.E.; Elwakeel, A.E.; Elbeltagi, A.; Salem, A.; Metwally, K.A.; et al. Assessment of a LPG Hybrid Solar Dryer Assisted with Smart Air Circulation System for Drying Basil Leaves. Sci. Rep. 2024, 14, 23922. [Google Scholar] [CrossRef]
- Rahman, M.S. Handbook of Food Preservation; CRC Press: Boca Raton, FL, USA, 2020; ISBN 1498740499. [Google Scholar]
- Elghazali, M.N.; Tawfeuk, H.Z.; Gomaa, R.A.; Tantawy, A.A. Effect of Dehydration Methods on Physicochemical Properties of Aswan Dry Dates. Assiut J. Agric. Sci. 2020, 51, 50–64. [Google Scholar] [CrossRef]
- Scaman, C.H.; Durance, T.D.; Drummond, L.; Sun, D.-W. Combined Microwave Vacuum Drying. In Emerging Technologies for Food Processing; Elsevier: Amsterdam, The Netherlands, 2014; pp. 427–445. [Google Scholar]
- Li, X.; Wang, Y.; Ma, X.; Li, M.; Kong, D.; Phavady, P.; Wang, Q.; Abdelkader, T.K. Chinese medicinal materials’ drying technologies advancements–Principles, energy performance, and influence on the bioactive components. Dry. Technol. 2024, 42, 1815–1845. [Google Scholar] [CrossRef]
- Radojčin, M.; Pavkov, I.; Bursać Kovačević, D.; Putnik, P.; Wiktor, A.; Stamenković, Z.; Kešelj, K.; Gere, A. Effect of Selected Drying Methods and Emerging Drying Intensification Technologies on the Quality of Dried Fruit: A Review. Processes 2021, 9, 132. [Google Scholar] [CrossRef]
- Sangeeta, S.; Sharma, D.; Ramniwas, S.; Mugabi, R.; Uddin, J.; Nayik, G.A. Revolutionizing Mushroom Processing: Innovative Techniques and Technologies. Food Chem. X 2024, 23, 101774. [Google Scholar] [CrossRef]
- Ghoshal, G. Emerging Food Processing Technologies. In Food Processing for Increased Quality and Consumption; Elsevier: Amsterdam, The Netherlands, 2018; pp. 29–65. [Google Scholar]
- Lamidi, R.O.; Jiang, L.; Pathare, P.B.; Wang, Y.; Roskilly, A.P. Recent Advances in Sustainable Drying of Agricultural Produce: A Review. Appl. Energy 2019, 233, 367–385. [Google Scholar] [CrossRef]
- Acar, C.; Dincer, I.; Mujumdar, A. A Comprehensive Review of Recent Advances in Renewable-Based Drying Technologies for a Sustainable Future. Dry. Technol. 2022, 40, 1029–1050. [Google Scholar] [CrossRef]
- AlJuhaimi, F.; Mohamed Ahmed, I.A.; Özcan, M.M.; Uslu, N.; Karrar, E. Effect of Drying Methods on the Antioxidant Capacity and Bioactive and Phenolic Constituents in the Aerial Parts of Marjoram (Origanum majorana L.) Grown Naturally in the Taurus Mountains in the Mediterranean Region. Processes 2024, 12, 2016. [Google Scholar] [CrossRef]
- Ganash, A.A. Theoretical and Experimental Studies of Dried Marjoram Leaves Extract as Green Inhibitor for Corrosion Protection of Steel Substrate in Acidic Solution. Chem. Eng. Commun. 2018, 205, 350–362. [Google Scholar] [CrossRef]
- Szwedziak, K.; Doleżal, P.; Dąbrowska-Molenda, M. Influence of Biological Preparations and Drying Method on the Content of Essential Oils in Basiland Marjoram®. Postępy Tech. Przetwórstwa Spożywczego 2022, 2, 19–25. [Google Scholar]
- Khater, E.-S.G.; Bahnasawy, A.H.; Abd El-All, M.H.; Mustafa, H.M.M.; Mousa, A.M. Effect of Drying System, Layer Thickness and Drying Temperature on the Drying Parameters, Product Quality, Energy Consumption and Cost of the Marjoram Leaves. Sci. Rep. 2024, 14, 4637. [Google Scholar] [CrossRef]
- Raghavan, B.; Rao, L.J.; Singh, M.; Abraham, K.O. Effect of Drying Methods on the Flavour Quality of Marjoram (Oreganum majorana L.). Food/Nahrung 1997, 41, 159–161. [Google Scholar] [CrossRef]
- Calín-Sánchez, Á.; Figiel, A.; Lech, K.; Szumny, A.; Martínez-Tomé, J.; Carbonell-Barrachina, Á.A. Dying Methods Affect the Aroma of Origanum majorana L. Analyzed by GC–MS and Descriptive Sensory Analysis. Ind. Crops Prod. 2015, 74, 218–227. [Google Scholar] [CrossRef]
- Elwakeel, A.E.; Oraiath, A.A.T.; Gameh, M.A.; Eissa, A.S.; Mahmoud, S.F.; Eid, M.H.; Moussa, A.; Mostafa, M.B.; Taha, M.F.; Abulmeaty, S.A.T.; et al. Quality Evaluation of Dried Tomato Fruit and Optimization of Drying Conditions Using a Modified Solar Dryer Integrated with an Automatic Solar Collector Tracker. Sci. Rep. 2025, 15, 7659. [Google Scholar] [CrossRef] [PubMed]
- Farag Taha, M.; Mao, H.; Zhang, Z.; Elmasry, G.; Awad, M.A.; Abdalla, A.; Mousa, S.; Elwakeel, A.E.; Elsherbiny, O. Emerging Technologies for Precision Crop Management Towards Agriculture 5.0: A Comprehensive Overview. Agriculture 2025, 15, 582. [Google Scholar] [CrossRef]
- AOAC. Official Methods of Analysis of AOAC; AOAC International: Washington, DC, USA, 2007. [Google Scholar]
- ES, M.; Hassan, M.A.; Abdallah, Y.S.; Metwally, K.A. Effect of Using a New Automatic Heating System Powered by Renewable Energy on Poultry Houses. Zagazig J. Agric. Res. 2023, 50, 81–92. [Google Scholar]
- Etim, P.J.; Eke, A.B.; Simonyan, K.J. Effect of Air Inlet Duct Features and Grater Thickness on Cooking Banana Drying Characteristics Using Active Indirect Mode Solar Dryer. Niger. J. Technol. 2019, 38, 1056–1063. [Google Scholar] [CrossRef]
- Elwakeel, A.E.; Eutyche, D.; Wapet, M.; Mahmoud, W.A.E.; Abdallah, S.E.; Mahmoud, M.M.; Ahmed, S.; Mehdi, E. Design and Implementation of a PV-Integrated Solar Dryer Based on Internet of Things and Date Fruit Quality Monitoring and Control. Int. J. Energy Res. 2023, 2023, 1–17. [Google Scholar] [CrossRef]
- El-Mesery, H.S.; Qenawy, M.; Ali, M.; Rostom, M.; Elbeltagi, A.; Salem, A.; Elwakeel, A.E. Optimization of Dried Garlic Physicochemical Properties Using a Self-Organizing Map and the Development of an Artificial Intelligence Prediction Model. Sci. Rep. 2025, 15, 3105. [Google Scholar] [CrossRef]
- Elwakeel, A.E.; Gameh, M.A.; Oraiath, A.A.T.; Elzein, I.M.; Eissa, A.S.; Mahmoud, M.M.; Mbadjoun Wapet, D.E.; Hussein, M.M.; Tantawy, A.A.; Mostafa, M.B. Drying Kinetics and Thermo-Environmental Analysis of a PV-Operated Tracking Indirect Solar Dryer for Tomato Slices. PLoS ONE 2024, 19, e0306281. [Google Scholar] [CrossRef]
- Rabha, D.K.; Muthukumar, P.; Somayaji, C. Experimental Investigation of Thin Layer Drying Kinetics of Ghost Chilli Pepper (Capsicum Chinense Jacq.) Dried in a Forced Convection Solar Tunnel Dryer. Renew. Energy 2017, 105, 583–589. [Google Scholar] [CrossRef]
- Doymaz, İ. Drying Characteristics and Kinetics of Okra. J. Food Eng. 2005, 69, 275–279. [Google Scholar] [CrossRef]
- Doymaz, İ.; İsmail, O. Drying Characteristics of Sweet Cherry. Food Bioprod. Process. 2011, 89, 31–38. [Google Scholar] [CrossRef]
- Ouahida, B. Drying Kinetics, Desorption Isotherms and Apparent Diffusivity of Sage Leaves. Defect Diffus. Forum 2021, 406, 173–181. [Google Scholar] [CrossRef]
- Kara, C.; Doymaz, İ. Effective Moisture Diffusivity Determination and Mathematical Modelling of Drying Curves of Apple Pomace. Heat Mass Transf. 2015, 51, 983–989. [Google Scholar] [CrossRef]
- Crank, J. The Mathematics Ofdiffusion; Oxford University Press: Oxford, UK, 1975. [Google Scholar]
- Coşkun, S.; Doymaz, İ.; Tunçkal, C.; Erdoğan, S. Investigation of Drying Kinetics of Tomato Slices Dried by Using a Closed Loop Heat Pump Dryer. Heat Mass Transf. 2017, 53, 1863–1871. [Google Scholar] [CrossRef]
- Badaoui, O.; Hanini, S.; Djebli, A.; Haddad, B.; Benhamou, A. Experimental and Modelling Study of Tomato Pomace Waste Drying in a New Solar Greenhouse: Evaluation of New Drying Models. Renew. Energy 2019, 133, 144–155. [Google Scholar] [CrossRef]
- Samimi-Akhijahani, H.; Arabhosseini, A. Accelerating Drying Process of Tomato Slices in a PV-Assisted Solar Dryer Using a Sun Tracking System. Renew. Energy 2018, 123, 428–438. [Google Scholar] [CrossRef]
- Tagnamas, Z.; Idlimam, A.; Lamharrar, A. Effect of Microwave Pretreatment on Truffle Solar Drying from an Energetic Perspective. Food Front. 2024, 5, 994–1003. [Google Scholar] [CrossRef]
- Midilli, A.; Kucuk, H. Mathematical Modeling of Thin Layer Drying of Pistachio by Using Solar Energy. Energy Convers. Manag. 2003, 44, 1111–1122. [Google Scholar] [CrossRef]
- Akpinar, E.K.; Bicer, Y. Mathematical Modeling and Experimental Study on Thin Layer Drying of Strawberry. Int. J. Food Eng. 2006, 2, 1–15. [Google Scholar] [CrossRef]
- Akpinar, E.K.; Bicer, Y.; Cetinkaya, F. Modelling of Thin Layer Drying of Parsley Leaves in a Convective Dryer and under Open Sun. J. Food Eng. 2006, 75, 308–315. [Google Scholar] [CrossRef]
- Öksüz, H.B.; Buzrul, S. DrYFiT: An Excel Freeware Tool to Describe Thin Layer Drying of Foods. J. Food Process Eng. 2024, 47, e14748. [Google Scholar] [CrossRef]
- Ertekin, C.; Firat, M.Z. A comprehensive review of thin-layer drying models used in agricultural products. Crit. Rev. Food Sci. Nutr. 2017, 57, 701–717. [Google Scholar] [CrossRef] [PubMed]
- Onwude, D.I.; Hashim, N.; Janius, R.B.; Nawi, N.M.; Abdan, K. Modeling the thin-layer drying of fruits and vegetables: A review. Compr. Rev. Food Sci. Food Saf. 2016, 15, 599–618. [Google Scholar] [CrossRef]
- Henderson, S.M. Progress in Developing the Thin Layer Drying Equation. Trans. ASAE 1974, 17, 1167–1168. [Google Scholar] [CrossRef]
- Inyang, U.E.; Oboh, I.O.; Etuk, B.R. Kinetic Models for Drying Techniques—Food Materials. Adv. Chem. Eng. Sci. 2018, 8, 27–48. [Google Scholar] [CrossRef]
- Buzrul, S. Reassessment of Thin-Layer Drying Models for Foods: A Critical Short Communication. Processes 2022, 10, 118. [Google Scholar] [CrossRef]
- Ghazanfari, A.; Emami, S.; Tabil, L.G.; Panigrahi, S. Thin-Layer Drying of Flax Fiber: II. Modeling Drying Process Using Semi-Theoretical and Empirical Models. Dry. Technol. 2006, 24, 1637–1642. [Google Scholar] [CrossRef]
- Wang, Z.; Sun, J.; Liao, X.; Chen, F.; Zhao, G.; Wu, J.; Hu, X. Mathematical Modeling on Hot Air Drying of Thin Layer Apple Pomace. Food Res. Int. 2007, 40, 39–46. [Google Scholar] [CrossRef]
- Ong, L.K.; Kurniawan, A.; Suwandi, A.C.; Lin, C.X.; Zhao, X.S.; Ismadji, S. Transesterification of Leather Tanning Waste to Biodiesel at Supercritical Condition: Kinetics and Thermodynamics Studies. J. Supercrit. Fluids 2013, 75, 11–20. [Google Scholar] [CrossRef]
- Choi, C.-S.; Kim, J.-W.; Jeong, C.-J.; Kim, H.; Yoo, K.-P. Transesterification Kinetics of Palm Olein Oil Using Supercritical Methanol. J. Supercrit. Fluids 2011, 58, 365–370. [Google Scholar] [CrossRef]
- Atheaya, D. Economics of Solar Drying. In Solar Drying Technology; Springer: Singapore, 2017. [Google Scholar] [CrossRef]
- Prakash, O.; Kumar, A. Solar Drying Technology: Concept, Design, Testing, Modeling, Economics, and Environment; Springer: Singapore, 2017; ISBN 9811038333. [Google Scholar]
- Kumar, M.; Sahdev, R.K.; Tiwari, S.; Manchanda, H.; Kumar, A. Enviro-Economical Feasibility of Groundnut Drying under Greenhouse and Indoor Forced Convection Hot Air Dryers. J. Stored Prod. Res. 2021, 93, 101848. [Google Scholar] [CrossRef]
- Elwakeel, A.E.; Tantawy, A.A.; Alsebiey, M.M.; Elliby, A.K. The date fruit drying systems: Acritical over review. Al-Azhar J. Agric. Eng. 2022, 3, 26–36. [Google Scholar] [CrossRef]
- Singh, P.; Gaur, M.K. Environmental and Economic Analysis of Novel Hybrid Active Greenhouse Solar Dryer with Evacuated Tube Solar Collector. Sustain. Energy Technol. Assess. 2021, 47, 101428. [Google Scholar] [CrossRef]
- Mohammed, I.A.; Al Dulaimi, M.A.K. An Economic Analysis of The Costs of Producing Tomato Under Greenhouse in Anbar Governorate For the Agricultural Season 2019–2020. In IOP Conference Series: Earth and Environmental Science, Proceedings of the Third Scientific and First International Conference of Desert Studies-2021 (ICDS-2021), Anbar, Iraq, 17–18 November 2021; IOP Publishing: Bristol, UK, 2021; Volume 904, p. 12061. [Google Scholar]
- Elwakeel, A.E.; Nasrat, L.S.; Badawy, M.E.; Elzein, I.M.; Mahmoud, M.M.; Kitmo; Hussein, M.M.; Hussein, H.S.; El-Messery, T.M.; Nyambe, C. Advanced Design and Engi-Economical Evaluation of an Automatic Sugarcane Seed Cutting Machine Based RGB Color Sensor. PLoS ONE 2024, 19, e0306584. [Google Scholar] [CrossRef]
- Müller, J.; Heindl, A. Drying of Medicinal Plants. In Medicinal and Aromatic Plants; Springer: Dordrecht, The Netherlands, 2006; pp. 237–252. ISBN 1402054491. [Google Scholar]
- Stéphane, F.F.Y.; Jules, B.K.J.; Batiha, G.E.-S.; Ali, I.; Bruno, L.N. Extraction of Bioactive Compounds from Medicinal Plants and Herbs. In Natural Medicinal Plants; IntechOpen: London, UK, 2022; p. 147. [Google Scholar]
- Doymaz, İ. Evaluation of Some Thin-Layer Drying Models of Persimmon Slices (Diospyros kaki L.). Energy Convers. Manag. 2012, 56, 199–205. [Google Scholar] [CrossRef]
- Kaleta, A.; Górnicki, K.; Winiczenko, R.; Chojnacka, A. Evaluation of Drying Models of Apple (Var. Ligol) Dried in a Fluidized Bed Dryer. Energy Convers. Manag. 2013, 67, 179–185. [Google Scholar] [CrossRef]
- Meziane, S. Drying Kinetics of Olive Pomace in a Fluidized Bed Dryer. Energy Convers. Manag. 2011, 52, 1644–1649. [Google Scholar] [CrossRef]
- Sengkhamparn, N.; Chanshotikul, N.; Assawajitpukdee, C.; Khamjae, T. Effects of Blanching and Drying on Fiber Rich Powder from Pitaya (Hylocereus undatus) Peel. Int. Food Res. J. 2013, 20, 1595. [Google Scholar]
- Deng, L.Z.; Pan, Z.L.; Mujumdar, A.S.; Zhao, J.H.; Zheng, Z.A.; Gao, Z.J.; Xiao, H.W. High-Humidity Hot Air Impingement Blanching (HHAIB) Enhances Drying Quality of Apricots by Inactivating the Enzymes, Reducing Drying Time and Altering Cellular Structure. Food Control 2019, 96, 104–111. [Google Scholar] [CrossRef]
- Kamal, M.M.; Ali, M.R.; Shishir, M.R.I.; Mondal, S.C. Thin-layer Drying Kinetics of Yam Slices, Physicochemical, and Functional Attributes of Yam Flour. J. Food Process Eng. 2020, 43, e13448. [Google Scholar] [CrossRef]
- Ambawat, S.; Sharma, A.; Saini, R.K. Mathematical Modeling of Thin Layer Drying Kinetics and Moisture Diffusivity Study of Pretreated Moringa Oleifera Leaves Using Fluidized Bed Dryer. Processes 2022, 10, 2464. [Google Scholar] [CrossRef]
- Elshehawy, S.M.; Mosad, G.A. Mathematical Modeling of Tilapia Fish Fillets Dried in Thin Layer. J. Soil Sci. Agric. Eng. 2022, 13, 359–364. [Google Scholar]
- Darvishi, H.; Azadbakht, M.; Rezaeiasl, A.; Farhang, A. Drying Characteristics of Sardine Fish Dried with Microwave Heating. J. Saudi Soc. Agric. Sci. 2013, 12, 121–127. [Google Scholar] [CrossRef]
- Metwally, K.A.; Oraiath, A.A.T.; Elzein, I.M.; El-Messery, T.M.; Nyambe, C.; Mahmoud, M.M.; Abdeen, M.A.; Telba, A.A.; Khaled, U.; Beroual, A. The Mathematical Modeling, Diffusivity, Energy, and Enviro-Economic Analysis (MD3E) of an Automatic Solar Dryer for Drying Date Fruits. Sustainability 2024, 16, 3506. [Google Scholar] [CrossRef]
- Minaei, S.; Beheshti, B. Determining the Effective Diffusivity Coefficient and Activation Energy in Thin-Layer Drying of Haj Kazemi Peach Slices and Modeling Drying Kinetics Using ANFIS. Int. J. Low-Carbon Technol. 2024, 19, 192–206. [Google Scholar]
- Zeng, Z.; Han, C.; Wang, Q.; Yuan, H.; Zhang, X.; Li, B. Analysis of Drying Characteristic, Effective Moisture Diffusivity and Energy, Exergy and Environment Performance Indicators during Thin Layer Drying of Tea in a Convective-Hot Air Dryer. Front. Sustain. Food Syst. 2024, 8, 1371696. [Google Scholar] [CrossRef]
- Mbegbu, N.N.; Nwajinka, C.O.; Amaefule, D.O. Thin Layer Drying Models and Characteristics of Scent Leaves (Ocimum gratissimum) and Lemon Basil Leaves (Ocimum africanum). Heliyon 2021, 7, e05945. [Google Scholar] [CrossRef]
- Mansour, N.E. Using Vacuum Drying System for Drying Some Leafy Medicinal Plants. Misr J. Agric. Eng. 2023, 40, 377–392. [Google Scholar] [CrossRef]
- Ahmed, T.H. Drying Some Medicinal and Aromatic Plants by Microwave. Misr J. Agric. Eng. 2018, 35, 953–974. [Google Scholar] [CrossRef]
- Doymaz, İ.; Karasu, S. Effect of Air Temperature on Drying Kinetics, Colour Changes and Total Phenolic Content of Sage Leaves (Salvia officinalis). Qual. Assur. Saf. Crops Foods 2018, 10, 269–276. [Google Scholar] [CrossRef]
- Jebri, M.; Desmorieux, H.; Maaloul, A.; Saadaoui, E.; Romdhane, M. Drying of Salvia Officinalis L. by Hot Air and Microwaves: Dynamic Desorption Isotherms, Drying Kinetics and Biochemical Quality. Heat Mass Transf. 2019, 55, 1143–1153. [Google Scholar] [CrossRef]
- Altay, K.; Hayaloglu, A.A.; Dirim, S.N. Determination of the Drying Kinetics and Energy Efficiency of Purple Basil (Ocimum basilicum L.) Leaves Using Different Drying Methods. Heat Mass Transf. 2019, 55, 2173–2184. [Google Scholar] [CrossRef]
- Shahi, N.C.; Singh, A.; Kate, A.E. Activation Energy Kinetics in Thin Layer Drying of Basil Leaves. Int. J. Sci. Res. 2014, 3, 1836–1840. [Google Scholar]
- Mabasso, G.A.; Cabral, J.C.O.; Barbosa, K.F.; Resende, O.; de Oliveira, D.E.C.; de Almeida, A.B. Drying Kinetics, Thermodynamic Properties and Physicochemical Characteristics of Rue Leaves. Sci. Rep. 2024, 14, 14526. [Google Scholar] [CrossRef]
- De Oliveira, G.H.H.; Corrêa, P.C.; Araujo, E.F.; Valente, D.S.M.; Botelho, F.M. Desorption Isotherms and Thermodynamic Properties of Sweet Corn Cultivars (Zea mays L.). Int. J. Food Sci. Technol. 2010, 45, 546–554. [Google Scholar] [CrossRef]
- de Morais, M.F.; Santos, J.R.O.d.; Santos, M.P.d.; Santos, D.d.C.; Costa, T.N.d.; Lima, J.B. Modeling and Thermodynamic Properties of ‘Bacaba’Pulp Drying. Rev. Bras. Eng. Agrícola Ambient. 2019, 23, 702–708. [Google Scholar] [CrossRef]
- Resende, O.; de Oliveira, D.E.C.; Costa, L.M.; Ferreira Júnior, W.N. Drying Kinetics of Baru Fruits (Dipteryx alata Vogel). Eng. Agrícola 2018, 38, 103–109. [Google Scholar] [CrossRef]
- Rodovalho, R.S.; da Silva, H.W.; Silva, I.L.; Rossetto, C.A.V. Cinética de Secagem Dos Grãos de Pimenta Bode. Glob. Sci. Technol. 2015, 8, 128–142. [Google Scholar] [CrossRef]
- Ferreira Junior, W.N.; Resende, O.; Pinheiro, G.K.I.; Silva, L.C.d.M.; Souza, D.G.; de Sousa, K.A. Modeling and Thermodynamic Properties of the Drying of Tamarind (Tamarindus indica L.) Seeds. Rev. Bras. Eng. Agrícola Ambient. 2020, 25, 37–43. [Google Scholar] [CrossRef]
- Moreira, R.; Chenlo, F.; Torres, M.D.; Vallejo, N. Thermodynamic Analysis of Experimental Sorption Isotherms of Loquat and Quince Fruits. J. Food Eng. 2008, 88, 514–521. [Google Scholar] [CrossRef]
- Elyas, R. Physical Property Estimation for Process Simulation. In Chemical Engineering Process Simulation; Elsevier: Amsterdam, The Netherlands, 2017; p. 51. [Google Scholar]
- Martins, E.A.S.; Lage, E.Z.; Goneli, A.L.D.; Hartmann Filho, C.P.; Lopes, J.G. Drying Kinetics of Serjania Marginata Casar Leaves/Cinetica de Secagem de Folhas de Timbo (Serjania marginata Casar). Rev. Bras. Eng. Agrícola Ambient. 2015, 19, 238–245. [Google Scholar] [CrossRef]
- Araujo, W.D.; Goneli, A.L.D.; Corrêa, P.C.; Hartmann Filho, C.P.; Martins, E.A.S. Modelagem Matemática Da Secagem Dos Frutos de Amendoim Em Camada Delgada. Rev. Ciência Agronômica 2017, 48, 448–457. [Google Scholar]

| Coefficient | atm | −5 kPa | −10 kPa | ||||||
|---|---|---|---|---|---|---|---|---|---|
| 40 °C | 50 °C | 60 °C | 40 °C | 50 °C | 60 °C | 40 °C | 50 °C | 60 °C | |
| A | 0.765 | 0.765 | 0.793 | 0.772 | 0.828 | 0.802 | 0.797 | 0.779 | 0.804 |
| Parameter | Nomenclature | Unit | Value |
|---|---|---|---|
| Interest rate | % | 3% | |
| Maintenance cost | USD/year | 3% of the annual capital cost | |
| Salvage value | % | 8% of the annual capital cost | |
| Operating life | τ | year | 20 years |
| Inflation rate | % | 2.5% | |
| Drying days per year | day | 350 | |
| Cost of fresh marjoram leaves | USD/kg | 1.0 | |
| Selling price of dried marjoram leaves | USD/kg | 5.0 |
| Coefficient | atm | −5 kPa | −10 kPa | ||||||
|---|---|---|---|---|---|---|---|---|---|
| 40 °C | 50 °C | 60 °C | 40 °C | 50 °C | 60 °C | 40 °C | 50 °C | 60 °C | |
| k, min−1 | 0.007 | 0.011 | 0.016 | 0.011 | 0.014 | 0.018 | 0.016 | 0.021 | 0.033 |
| R2 | 0.990 | 0.992 | 0.993 | 0.992 | 0.996 | 0.994 | 0.99 | 0.993 | 0.989 |
| Ref. | Drying System | Product | Deff, m2/s |
|---|---|---|---|
| [50] | Convection oven | sage leaves | 1.1 to 3.7 × 10⁻¹² |
| [93] | Microwave | sage leaves | 1.73 × 10⁻⁹ |
| [94] | Solar cabinet drier | sage leaves | 1.62 to 5.73 × 10⁻⁹ |
| [95] | Hot air convective drying | Marjoram leaves | 1.7 to 8.75 × 10⁻¹⁰ |
| [95] | Microwave drying | Marjoram leaves | 2.915 to 2.964 × 10⁻⁹ |
| [96] | Microwave | Purple basil | 0.162 to 7.09 × 10⁻⁸ |
| Current study | DVD | Marjoram leaves | 1.13 to 5.51 × 10⁻⁹ |
| Ref. | Drying System | Product | Drying Conditions | AE, kJ/mol |
|---|---|---|---|---|
| [97] | Sun and vacuum dryers | Basil leaves | 45, 55, and 65 °C | 38.54–20.32 |
| [91] | Oven drier | Basil leaves | 30–70 °C | 32.34 |
| [23] | Hybrid solar dryer | Basil leaves | 50, 55, and 60 °C | 1.945–15.37 |
| [95] | Hot air convective drying | Marjoram leaves | 50, 60, 70 and 80 °C | 1.055 |
| [95] | Microwave drying | Marjoram leaves | 4.85 | |
| [98] | Hot air convective drying | Rue leaves | 40, 50, 60 and 70 °C | 60.58 |
| Current study | DVD | Marjoram leaves | OP of −10kPa and 60 °C | 2.68 |
| MMs | Pressure | T, °C | Parameters | Models’ Constants Values | Goodness of Fit Indices | ||||
|---|---|---|---|---|---|---|---|---|---|
| Values | S.E. | p-Value | RMSE | R2 | R2adj. | ||||
| Aghbashlo | atm | 40 | k1 | 0.01252 | 0.00028 | 1.14 × 10⁻³² * | 0.01408 | 0.99656 | 0.99647 |
| k2 | 0.00205 | 0.00015 | 2.74 × 10⁻¹⁵ * | ||||||
| 50 | k1 | 0.02011 | 0.00053 | 8.82 × 10⁻²¹ * | 0.01331 | 0.99738 | 0.99726 | ||
| k2 | 0.00304 | 0.00029 | 1.09 × 10⁻⁹ * | ||||||
| 60 | k1 | 0.01086 | 0.00276 | 0.00134 * | 0.10870 | 0.84058 | 0.82996 | ||
| k2 | −0.00417 | 0.00197 | 0.05133 | ||||||
| −5 kPa | 40 | k1 | 0.01979 | 0.00055 | 1.98 × 10⁻²⁰ * | 0.01389 | 0.99717 | 0.99704 | |
| k2 | 0.00294 | 0.00030 | 3.10 × 10⁻⁹ * | ||||||
| 50 | k1 | 0.02269 | 0.00074 | 2.28 × 10⁻¹⁶ * | 0.01500 | 0.99692 | 0.99674 | ||
| k2 | 0.00320 | 0.00041 | 5.53 × 10⁻⁷ * | ||||||
| 60 | k1 | 0.03054 | 0.00097 | 1.18 × 10⁻¹³ * | 0.01282 | 0.99798 | 0.99783 | ||
| k2 | 0.00424 | 0.00054 | 2.52 × 10⁻⁶ * | ||||||
| −10 kPa | 40 | k1 | 0.02789 | 0.00104 | 9.45 × 10⁻¹³ * | 0.01531 | 0.99703 | 0.99680 | |
| k2 | 0.00466 | 0.00060 | 3.21 × 10⁻⁶ * | ||||||
| 50 | k1 | 0.01028 | 0.00434 | 0.03712 * | 0.16765 | 0.67538 | 0.64586 | ||
| k2 | −0.00556 | 0.00323 | 0.11372 | ||||||
| 60 | k1 | 0.05117 | 0.00139 | 2.83 × 10⁻⁹ * | 0.00811 | 0.99944 | 0.99936 | ||
| k2 | 0.00552 | 0.00076 | 0.00017 * | ||||||
| Logarithmic (Asymptotic) | atm | 40 | k | 0.01039 | 0.00040 | 3.89 × 10⁻²⁴ * | 0.02369 | 0.99056 | 0.99000 |
| a | 0.90502 | 0.01629 | 5.84 × 10⁻³⁵ * | ||||||
| c | 0.04675 | 0.00674 | 5.45 × 10⁻⁸ * | ||||||
| 50 | k | 0.01740 | 0.00078 | 1.30 × 10⁻¹⁵ * | 0.02341 | 0.99229 | 0.99152 | ||
| a | 0.92787 | 0.01920 | 3.45 × 10⁻²² * | ||||||
| c | 0.04477 | 0.00822 | 2.48 × 10⁻⁵ * | ||||||
| 60 | k | 0.02317 | 0.00141 | 1.54 × 10⁻¹⁰ * | 0.02773 | 0.99032 | 0.98893 | ||
| a | 0.91425 | 0.02482 | 2.44 × 10⁻¹⁵ * | ||||||
| c | 0.04259 | 0.01151 | 0.00238 * | ||||||
| −5 kPa | 40 | k | 0.01723 | 0.00078 | 1.43 × 10⁻¹⁵ * | 0.02356 | 0.99225 | 0.99148 | |
| a | 0.93012 | 0.01928 | 3.55 × 10⁻²² * | ||||||
| c | 0.04447 | 0.00833 | 3.19 × 10⁻⁵ * | ||||||
| 50 | k | 0.01914 | 0.00096 | 1.05 × 10⁻¹² * | 0.02380 | 0.99269 | 0.99178 | ||
| a | 0.92107 | 0.02028 | 2.43 × 10⁻¹⁸ * | ||||||
| c | 0.03734 | 0.00995 | 0.00174 * | ||||||
| 60 | k | 0.02632 | 0.00138 | 2.40 × 10⁻¹⁰ * | 0.02316 | 0.99392 | 0.99291 | ||
| a | 0.93307 | 0.02147 | 1.43 × 10⁻¹⁴ * | ||||||
| c | 0.03776 | 0.01024 | 0.00311 * | ||||||
| −10 kPa | 40 | k | 0.02383 | 0.00144 | 1.30 × 10⁻⁹ * | 0.02567 | 0.99229 | 0.99101 | |
| a | 0.91080 | 0.02345 | 5.48 × 10⁻¹⁴ * | ||||||
| c | 0.05359 | 0.01232 | 0.00094 * | ||||||
| 50 | k | 0.03247 | 0.00217 | 3.54 × 10⁻⁸ * | 0.02804 | 0.99174 | 0.99009 | ||
| a | 0.93049 | 0.02723 | 1.09 × 10⁻¹¹ * | ||||||
| c | 0.04240 | 0.01274 | 0.00763 * | ||||||
| 60 | k | 0.04682 | 0.00211 | 5.54 × 10⁻⁷ * | 0.01688 | 0.99793 | 0.99724 | ||
| a | 0.96304 | 0.01789 | 2.76 × 10⁻⁹ * | ||||||
| c | 0.03076 | 0.00939 | 0.01687 * | ||||||
| Midilli | atm | 40 | k | 0.03067 | 0.00345 | 2.82 × 10⁻¹⁰ * | 0.01398 | 0.99681 | 0.99652 |
| a | 1.01610 | 0.01344 | 1.44 × 10−38 * | ||||||
| b | 6.36 × 10⁻⁶ | 1.43 × 10⁻⁵ | 0.66019 | ||||||
| n | 0.76226 | 0.02257 | 3.57 × 10⁻²⁷ * | ||||||
| 50 | k | 0.03936 | 0.00521 | 3.84 × 10⁻⁷ * | 0.01528 | 0.99688 | 0.99639 | ||
| a | 1.01138 | 0.01505 | 4.64 × 10⁻²⁴ * | ||||||
| b | 2.33 × 10⁻⁵ | 3.04 × 10⁻⁵ | 0.45260 | ||||||
| n | 0.79242 | 0.03008 | 2.02 × 10⁻¹⁶ * | ||||||
| 60 | k | 0.06541 | 0.00196 | 5.42 × 10⁻¹⁴ * | 0.00333 | 0.99987 | 0.99984 | ||
| a | 1.00064 | 0.00331 | 2.14 × 10⁻²⁶ * | ||||||
| b | −6.56 × 10⁻⁵ | 1.25 × 10⁻⁵ | 0.00015 * | ||||||
| n | 0.72015 | 0.00752 | 6.58 × 10⁻²⁰ * | ||||||
| −5 kPa | 40 | k | 0.03818 | 0.00537 | 9.14 × 10⁻⁷ * | 0.01615 | 0.99654 | 0.99599 | |
| a | 1.01224 | 0.01589 | 1.29 × 10⁻²³ * | ||||||
| b | 2.41 × 10⁻⁵ | 3.22 × 10⁻⁵ | 0.46377 | ||||||
| n | 0.79770 | 0.03191 | 5.33 × 10⁻¹⁶ * | ||||||
| 50 | k | 0.04882 | 0.00220 | 6.94 × 10⁻¹³ * | 0.00497 | 0.99970 | 0.99964 | ||
| a | 1.00227 | 0.00492 | 3.11 × 10⁻²⁷ * | ||||||
| b | −5.04 × 10⁻⁵ | 1.54 × 10⁻⁵ | 0.00506 * | ||||||
| n | 0.75988 | 0.01081 | 2.59 × 10⁻²⁰ * | ||||||
| 60 | k | 0.05976 | 0.00279 | 2.54 × 10⁻¹⁰ * | 0.00492 | 0.99975 | 0.99968 | ||
| a | 1.00092 | 0.00490 | 4.81 × 10⁻²¹ * | ||||||
| b | −3.47 × 10⁻⁵ | 2.06 × 10⁻⁵ | 0.11987 | ||||||
| n | 0.76883 | 0.01209 | 1.80 × 10⁻¹⁵ * | ||||||
| −10 kPa | 40 | k | 0.06102 | 0.00260 | 9.67 × 10⁻¹¹ * | 0.00440 | 0.99979 | 0.99974 | |
| a | 1.00056 | 0.00438 | 1.42 × 10⁻²¹ * | ||||||
| b | −5.22 × 10⁻⁵ | 2.24 × 10⁻⁵ | 0.03947 * | ||||||
| n | 0.73534 | 0.01102 | 1.06 × 10⁻¹⁵ * | ||||||
| 50 | k | 0.08172 | 0.00472 | 3.25 × 10⁻⁸ * | 0.00591 | 0.99967 | 0.99956 | ||
| a | 1.00050 | 0.00590 | 4.38 × 10⁻¹⁷ * | ||||||
| b | −6.72 × 10⁻⁵ | 3.27 × 10⁻⁵ | 0.07026 | ||||||
| n | 0.72398 | 0.01586 | 5.80 × 10⁻¹² * | ||||||
| 60 | k | 0.07523 | 0.00922 | 0.00045 * | 0.01009 | 0.99938 | 0.99901 | ||
| a | 1.00065 | 0.01009 | 1.97 × 10⁻⁹ * | ||||||
| b | 3.88 × 10⁻⁵ | 8.42 × 10⁻⁵ | 0.66440 | ||||||
| n | 0.83701 | 0.03722 | 3.23 × 10⁻⁶ * | ||||||
| Modified Midilli I | atm | 40 | k | 0.02810 | 0.00241 | 1.98 × 10⁻¹³ * | 0.01409 | 0.99666 | 0.99646 |
| b | 9.65 × 10⁻⁶ | 1.40 × 10⁻⁵ | 0.49439 | ||||||
| n | 0.77757 | 0.01868 | 9.33 × 10⁻³¹ * | ||||||
| 50 | k | 0.03728 | 0.00407 | 1.37 × 10⁻⁸ * | 0.01513 | 0.99678 | 0.99646 | ||
| b | 2.63 × 10⁻⁵ | 2.96 × 10⁻⁵ | 0.38614 | ||||||
| n | 0.80265 | 0.02646 | 3.37 × 10⁻¹⁸ * | ||||||
| 60 | k | 0.06523 | 0.00167 | 1.07 × 10⁻¹⁵ * | 0.00321 | 0.99987 | 0.99985 | ||
| b | −6.53 × 10⁻⁵ | 1.19 × 10⁻⁵ | 8.33 × 10⁻⁵ * | ||||||
| n | 0.72069 | 0.00676 | 8.90 × 10⁻²² * | ||||||
| −5 kPa | 40 | k | 0.03600 | 0.00418 | 3.60 × 10⁻⁸ * | 0.01600 | 0.99643 | 0.99607 | |
| b | 2.72 × 10⁻⁵ | 3.13 × 10⁻⁵ | 0.39543 | ||||||
| n | 0.80879 | 0.02805 | 9.11 × 10⁻¹⁸ * | ||||||
| 50 | k | 0.04830 | 0.00181 | 1.09 × 10⁻¹⁴ * | 0.00484 | 0.99970 | 0.99966 | ||
| b | −4.95 × 10⁻⁵ | 1.48 × 10⁻⁵ | 0.00418 * | ||||||
| n | 0.76197 | 0.00954 | 3.04 × 10⁻²² * | ||||||
| 60 | k | 0.05953 | 0.00239 | 1.07 × 10⁻¹¹ * | 0.00471 | 0.99975 | 0.99971 | ||
| b | −3.43 × 10⁻⁵ | 1.96 × 10⁻⁵ | 0.10595 | ||||||
| n | 0.76963 | 0.01088 | 4.22 × 10⁻¹⁷ * | ||||||
| −10 kPa | 40 | k | 0.06086 | 0.00221 | 3.28 × 10⁻¹² * | 0.00421 | 0.99979 | 0.99976 | |
| b | −5.19 × 10⁻⁵ | 2.13 × 10⁻⁵ | 0.03123 * | ||||||
| n | 0.73585 | 0.00986 | 2.23 × 10⁻¹⁷ * | ||||||
| 50 | k | 0.08157 | 0.00416 | 2.59 × 10⁻⁹ * | 0.00561 | 0.99967 | 0.99960 | ||
| b | −6.69 × 10⁻⁵ | 3.10 × 10⁻⁵ | 0.05589 | ||||||
| n | 0.72437 | 0.01446 | 2.43 × 10⁻¹³ * | ||||||
| 60 | k | 0.07507 | 0.00808 | 8.80 × 10⁻⁵ * | 0.00922 | 0.99938 | 0.99918 | ||
| b | 3.91 × 10⁻⁵ | 7.68 × 10⁻⁵ | 0.62945 | ||||||
| n | 0.83750 | 0.03330 | 2.60 × 10⁻⁷ * | ||||||
| Modified Midilli II | atm | 40 | k | 0.02947 | 0.00343 | 6.36 × 10⁻¹⁰ * | 0.01384 | 0.99687 | 0.99659 |
| a | 1.00589 | 0.01752 | 1.19 × 10⁻³⁴ * | ||||||
| b | 0.00870 | 0.00857 | 0.31740 | ||||||
| n | 0.77400 | 0.02544 | 1.01 × 10⁻²⁵ * | ||||||
| 50 | k | 0.03800 | 0.00517 | 5.75 × 10⁻⁷ * | 0.01502 | 0.99699 | 0.99651 | ||
| a | 0.99769 | 0.01955 | 8.47 × 10⁻²² * | ||||||
| b | 0.01286 | 0.01056 | 0.23803 | ||||||
| n | 0.80595 | 0.03377 | 1.26 × 10⁻¹⁵ * | ||||||
| 60 | k | 0.06525 | 0.00211 | 1.47 × 10⁻¹³ * | 0.00363 | 0.99985 | 0.99981 | ||
| a | 1.02064 | 0.00618 | 5.50 × 10⁻²³ * | ||||||
| b | −0.01995 | 0.00459 | 0.00079 * | ||||||
| n | 0.71368 | 0.00944 | 1.41 × 10⁻¹⁸ * | ||||||
| −5 kPa | 40 | k | 0.03681 | 0.00533 | 1.38 × 10⁻⁶ * | 0.01589 | 0.99665 | 0.99612 | |
| a | 0.99812 | 0.02067 | 2.41 × 10⁻²¹ * | ||||||
| b | 0.01328 | 0.01114 | 0.24803 | ||||||
| n | 0.81166 | 0.03583 | 3.27 × 10⁻¹⁵ * | ||||||
| 50 | k | 0.04863 | 0.00230 | 1.40 × 10⁻¹² * | 0.00521 | 0.99967 | 0.99961 | ||
| a | 1.01847 | 0.00837 | 6.98 × 10⁻²⁴ * | ||||||
| b | −0.01622 | 0.00583 | 0.01396 * | ||||||
| n | 0.75558 | 0.01287 | 3.84 × 10⁻¹⁹ * | ||||||
| 60 | k | 0.05955 | 0.00289 | 3.89 × 10⁻¹⁰ * | 0.00505 | 0.99973 | 0.99966 | ||
| a | 1.00884 | 0.00792 | 8.68 × 10⁻¹⁹ * | ||||||
| b | −0.00796 | 0.00558 | 0.18177 | ||||||
| n | 0.76697 | 0.01422 | 1.10 × 10⁻¹⁴ * | ||||||
| −10 kPa | 40 | k | 0.06059 | 0.00266 | 1.30 × 10⁻¹⁰ * | 0.00460 | 0.99977 | 0.99971 | |
| a | 1.01437 | 0.00890 | 2.96 × 10⁻¹⁸ * | ||||||
| b | −0.01383 | 0.00708 | 0.07678 | ||||||
| n | 0.73255 | 0.01331 | 8.76 × 10⁻¹⁵ * | ||||||
| 50 | k | 0.08165 | 0.00480 | 3.80 × 10⁻⁸ * | 0.00603 | 0.99966 | 0.99954 | ||
| a | 1.01564 | 0.01058 | 7.32 × 10⁻¹⁵ * | ||||||
| b | −0.01513 | 0.00822 | 0.09880 | ||||||
| n | 0.71824 | 0.01879 | 2.86 × 10⁻¹¹ * | ||||||
| 60 | k | 0.07411 | 0.00944 | 0.0005 * | 0.00997 | 0.99940 | 0.99904 | ||
| a | 0.99376 | 0.01523 | 1.60 × 10⁻⁸ * | ||||||
| b | 0.00682 | 0.01107 | 0.56466 | ||||||
| n | 0.84506 | 0.04271 | 6.09 × 10⁻⁶ * | ||||||
| Modified Page | atm | 40 | k | 0.01006 | 0.00014 | 8.90 × 10−40 * | 0.01398 | 0.99661 | 0.99652 |
| n | 0.76840 | 0.01267 | 4.82 × 10−37 * | ||||||
| 50 | k | 0.01645 | 0.00031 | 6.78 × 10⁻²⁴ * | 0.01503 | 0.99666 | 0.99650 | ||
| n | 0.78635 | 0.01816 | 5.05 × 10⁻²² * | ||||||
| 60 | k | 0.02301 | 0.00020 | 1.72 × 10⁻²³ * | 0.00562 | 0.99957 | 0.99955 | ||
| n | 0.74939 | 0.00783 | 2.54 × 10⁻²² * | ||||||
| −5 kPa | 40 | k | 0.01625 | 0.00032 | 1.68 × 10⁻²³ * | 0.01589 | 0.99630 | 0.99612 | |
| n | 0.79189 | 0.01924 | 1.45 × 10⁻²¹ * | ||||||
| 50 | k | 0.01902 | 0.00016 | 2.56 × 10⁻²⁶ * | 0.00619 | 0.99947 | 0.99944 | ||
| n | 0.78615 | 0.00821 | 1.12 × 10⁻²⁴ * | ||||||
| 60 | k | 0.02576 | 0.00021 | 2.57 × 10⁻²¹ * | 0.00509 | 0.99968 | 0.99966 | ||
| n | 0.78384 | 0.00797 | 4.63 × 10⁻²⁰ * | ||||||
| −10 kPa | 40 | k | 0.02257 | 0.00017 | 1.08 × 10⁻²¹ * | 0.00499 | 0.99968 | 0.99966 | |
| n | 0.75523 | 0.00719 | 1.97 × 10⁻²⁰ * | ||||||
| 50 | k | 0.03175 | 0.00039 | 1.21 × 10⁻¹⁶ * | 0.00654 | 0.99951 | 0.99946 | ||
| n | 0.74856 | 0.01109 | 9.38 × 10⁻¹⁶ * | ||||||
| 60 | k | 0.04529 | 0.00087 | 2.48 × 10⁻¹⁰ * | 0.00871 | 0.99936 | 0.99927 | ||
| n | 0.82524 | 0.02145 | 2.08 × 10⁻⁹ * | ||||||
| Page | atm | 40 | k | 0.02918 | 0.00187 | 2.43 × 10⁻¹⁷ * | 0.01398 | 0.99661 | 0.99652 |
| n | 0.76840 | 0.01267 | 4.82 × 10−37 * | ||||||
| 50 | k | 0.03957 | 0.00327 | 6.38 × 10⁻¹¹ * | 0.01503 | 0.99666 | 0.99650 | ||
| n | 0.78635 | 0.01816 | 5.05 × 10⁻²² * | ||||||
| 60 | k | 0.05921 | 0.00198 | 8.70 × 10⁻¹⁵ * | 0.00562 | 0.99957 | 0.99955 | ||
| n | 0.74940 | 0.00783 | 2.54 × 10⁻²² * | ||||||
| −5 kPa | 40 | k | 0.03829 | 0.00336 | 1.89 × 10⁻¹⁰ * | 0.01589 | 0.99630 | 0.99612 | |
| n | 0.79189 | 0.01924 | 1.45 × 10⁻²¹ * | ||||||
| 50 | k | 0.04438 | 0.00160 | 1.42 × 10⁻¹⁵ * | 0.00619 | 0.99947 | 0.99944 | ||
| n | 0.78615 | 0.00821 | 1.12 × 10⁻²⁴ * | ||||||
| 60 | k | 0.05682 | 0.00187 | 1.83 × 10⁻¹³ * | 0.00509 | 0.99968 | 0.99966 | ||
| n | 0.78384 | 0.00797 | 4.63 × 10⁻²⁰ * | ||||||
| −10 kPa | 40 | k | 0.05709 | 0.00174 | 7.14 × 10⁻¹⁴ * | 0.00499 | 0.99968 | 0.99966 | |
| n | 0.75523 | 0.00719 | 1.97 × 10⁻²⁰ * | ||||||
| 50 | k | 0.07559 | 0.00334 | 1.39 × 10⁻¹⁰ * | 0.00654 | 0.99951 | 0.99946 | ||
| n | 0.74856 | 0.01109 | 9.38 × 10⁻¹⁶ * | ||||||
| 60 | k | 0.07778 | * | 3.60 × 10⁻⁶ * | 0.00871 | 0.99936 | 0.99927 | ||
| n | 0.82524 | 0.02145 | 2.08 × 10⁻⁹ * | ||||||
| Wang-Sigh | atm | 40 | b | −0.00542 | 0.00023 | 3.29 × 10⁻²³ * | 0.10854 | 0.79599 | 0.79017 |
| a | 7.17 × 10⁻⁶ | 5.36 × 10⁻⁷ | 2.56 × 10⁻¹⁵ * | ||||||
| 50 | b | −0.00887 | 0.00047 | 1.16 × 10⁻¹⁴ * | 0.10825 | 0.82697 | 0.81874 | ||
| a | 1.91 × 10⁻⁵ | 1.80 × 10⁻⁶ | 6.31 × 10⁻¹⁰ * | ||||||
| 60 | b | −0.01206 | 0.00077 | 1.00 × 10⁻¹⁰ * | 0.11102 | 0.83370 | 0.82262 | ||
| a | 3.54 × 10⁻⁵ | 4.01 × 10⁻⁶ | 2.49 × 10⁻⁷ * | ||||||
| −5 kPa | 40 | b | −0.00884 | 0.00046 | 9.80 × 10⁻¹⁵ * | 0.10697 | 0.83232 | 0.82433 | |
| a | 1.90 × 10⁻⁵ | 1.77 × 10⁻⁶ | 5.62 × 10⁻¹⁰ * | ||||||
| 50 | b | −0.01056 | 0.00059 | 1.79 × 10⁻¹² * | 0.10133 | 0.85925 | 0.85098 | ||
| a | 2.73 × 10⁻⁵ | 2.74 × 10⁻⁶ | 1.66 × 10⁻⁸ * | ||||||
| 60 | b | −0.01379 | 0.00090 | 1.02 × 10⁻⁹ * | 0.10686 | 0.85975 | 0.84896 | ||
| a | 4.61 × 10⁻⁵ | 5.33 × 10⁻⁶ | 9.41 × 10⁻⁷ * | ||||||
| −10 kPa | 40 | b | −0.01307 | 0.00083 | 7.89 × 10⁻¹⁰ * | 0.09918 | 0.87531 | 0.86572 | |
| a | 4.28 × 10⁻⁵ | 4.95 × 10⁻⁶ | 9.51 × 10⁻⁷ * | ||||||
| 50 | b | −0.01619 | 0.00121 | 3.66 × 10⁻⁸ * | 0.11488 | 0.84757 | 0.83371 | ||
| a | 6.33 × 10⁻⁵ | 8.32 × 10⁻⁶ | 1.05 × 10⁻⁵ * | ||||||
| 60 | b | −0.02413 | 0.00203 | 6.69 × 10⁻⁶ * | 0.10756 | 0.90214 | 0.88816 | ||
| a | 0.00014 | 2.06 × 10⁻⁵ | 0.00026 * | ||||||
| Weibullian | atm | 40 | β | 0.76840 | 0.01267 | 4.82 × 10−37 * | 0.01398 | 0.99661 | 0.99652 |
| α | 99.432 | 1.36805 | 8.90 × 10−40 * | ||||||
| 50 | β | 0.78635 | 0.01816 | 5.05 × 10⁻²² * | 0.01503 | 0.99666 | 0.99650 | ||
| α | 60.78 | 1.14099 | 6.78 × 10⁻²⁴ * | ||||||
| 60 | β | 0.74940 | 0.00783 | 2.54 × 10⁻²² * | 0.00562 | 0.99957 | 0.99955 | ||
| α | 43.465 | 0.37919 | 1.72 × 10⁻²³ * | ||||||
| −5 kPa | 40 | β | 0.79189 | 0.01924 | 1.45 × 10⁻²¹ * | 0.01589 | 0.99630 | 0.99612 | |
| α | 61.554 | 1.20705 | 1.68 × 10⁻²³ * | ||||||
| 50 | β | 0.78615 | 0.00821 | 1.12 × 10⁻²⁴ * | 0.00619 | 0.99947 | 0.99944 | ||
| α | 52.576 | 0.43929 | 2.56 × 10⁻²⁶ * | ||||||
| 60 | β | 0.78384 | 0.00797 | 4.63 × 10⁻²⁰ * | 0.00509 | 0.99968 | 0.99966 | ||
| α | 38.816 | 0.31574 | 2.57 × 10⁻²¹ * | ||||||
| −10 kPa | 40 | β | 0.75523 | 0.00719 | 1.97 × 10⁻²⁰ * | 0.00499 | 0.99968 | 0.99966 | |
| α | 44.304 | 0.33727 | 1.08 × 10⁻²¹ * | ||||||
| 50 | β | 0.74856 | 0.01109 | 9.38 × 10⁻¹⁶ * | 0.00654 | 0.99951 | 0.99946 | ||
| α | 31.494 | 0.38715 | 1.21 × 10⁻¹⁶ * | ||||||
| 60 | β | 0.82524 | 0.02145 | 2.08 × 10⁻⁹ * | 0.00871 | 0.99936 | 0.99927 | ||
| α | 22.08 | 0.42294 | 2.48 × 10⁻¹⁰ * | ||||||
| Weibullian I | atm | 40 | n | 0.76840 | 0.01267 | 4.82 × 10−37 * | 0.01398 | 0.99661 | 0.99652 |
| δ | 294.385 | 4.85876 | 4.94 × 10−37 * | ||||||
| 50 | n | 0.78635 | 0.01816 | 5.05 × 10⁻²² * | 0.01503 | 0.99666 | 0.99650 | ||
| δ | 175.54 | 3.95367 | 3.01 × 10⁻²² * | ||||||
| 60 | n | 0.74940 | 0.00783 | 2.54 × 10⁻²² * | 0.00562 | 0.99957 | 0.99955 | ||
| δ | 132.278 | 1.349 | 1.77 × 10⁻²² * | ||||||
| −5 kPa | 40 | n | 0.79189 | 0.01924 | 1.45 × 10⁻²¹ * | 0.01589 | 0.99630 | 0.99612 | |
| δ | 176.467 | 4.17165 | 8.22 × 10⁻²² * | ||||||
| 50 | n | 0.78615 | 0.00821 | 1.12 × 10⁻²⁴ * | 0.00619 | 0.99947 | 0.99944 | ||
| δ | 151.891 | 1.5382 | 6.70 × 10⁻²⁵ * | ||||||
| 60 | n | 0.78384 | 0.00797 | 4.63 × 10⁻²⁰ * | 0.00509 | 0.99968 | 0.99966 | ||
| δ | 112.489 | 1.083 | 2.29 × 10⁻²⁰ * | ||||||
| −10 kPa | 40 | n | 0.7552 | 0.0072 | 1.97 × 10⁻²⁰ * | 0.00499 | 0.99968 | 0.99966 | |
| δ | 133.675 | 1.2503 | 1.57 × 10⁻²⁰ * | ||||||
| 50 | n | 0.74856 | 0.01109 | 9.38 × 10⁻¹⁶ * | 0.00654 | 0.99951 | 0.99946 | ||
| δ | 95.967 | 1.33706 | 4.77 × 10⁻¹⁶ * | ||||||
| 60 | n | 0.82524 | 0.02145 | 2.08 × 10⁻⁹ * | 0.00871 | 0.99936 | 0.99927 | ||
| δ | 60.661 | 1.323 | 6.14 × 10⁻¹⁰ * | ||||||
| Temperature | Pressure | ΔH, kJ/mol | ΔS, KJ/mol.K | ΔG, kJ/mol |
|---|---|---|---|---|
| 40 °C | atm | 18.73 | −0.113 | 54.12 |
| −5 kPa | 29.61 | −0.150 | 76.72 | |
| −10 kPa | 0.08 | −0.156 | 48.85 | |
| 50 °C | atm | 18.64 | −0.113 | 55.18 |
| −5 kPa | 29.53 | −0.151 | 78.15 | |
| −10 kPa | −0.002 | −0.156 | 50.34 | |
| 60 °C | atm | 18.56 | −0.113 | 56.24 |
| −5 kPa | 29.44 | −0.151 | 79.59 | |
| −10 kPa | −0.09 | −0.156 | 51.83 |
| Economic Analysis | DT, °C and OP, kPa | ||||||||
|---|---|---|---|---|---|---|---|---|---|
| atm | −5 kPa | −10 kPa | |||||||
| 40 °C | 50 °C | 60 °C | 40 °C | 50 °C | 60 °C | 40 °C | 50 °C | 60 °C | |
| Mass of fresh marjoram leaves per patch, kg | 3 | 3 | 3 | 3 | 3 | 3 | 3 | 3 | 3 |
| Number of drying cycles per year | 388.89 | 636.36 | 875 | 636.36 | 777.78 | 1000 | 1000 | 1166.67 | 1750 |
| Mass of dried marjoram leaves annually, kg | 1166.7 | 1909.1 | 2625 | 1909.1 | 2333.3 | 3000 | 3000 | 3500 | 5250 |
| Drying cost per kg of fresh product, USD | 0.54 | 0.39 | 0.32 | 0.39 | 0.365 | 0.308 | 0.308 | 0.275 | 0.1977 |
| Cost of marjoram leaves per kg of dried product, USD | 1.63 | 1.48 | 1.41 | 1.48 | 1.46 | 1.40 | 1.42 | 1.37 | 1.29 |
| Saving after the first year, USD | 237.03 | 543.71 | 857.29 | 549.53 | 698.3 | 990.93 | 969.28 | 1219.88 | 2054.19 |
| Payback period, year | 1.167 | 0.520 | 0.332 | 0.514 | 0.406 | 0.287 | 0.294 | 0.234 | 0.139 |
Disclaimer/Publisher’s Note: The statements, opinions and data contained in all publications are solely those of the individual author(s) and contributor(s) and not of MDPI and/or the editor(s). MDPI and/or the editor(s) disclaim responsibility for any injury to people or property resulting from any ideas, methods, instructions or products referred to in the content. |
© 2025 by the authors. Licensee MDPI, Basel, Switzerland. This article is an open access article distributed under the terms and conditions of the Creative Commons Attribution (CC BY) license (https://creativecommons.org/licenses/by/4.0/).
Share and Cite
Mansour, N.E.; Villagran, E.; Rodriguez, J.; Akrami, M.; Flores-Velazquez, J.; Metwally, K.A.; Alhumedi, M.; Ahmed, A.F.; Elshawadfy Elwakeel, A. Effect of Drying Conditions on Kinetics, Modeling, and Thermodynamic Behavior of Marjoram Leaves in an IoT-Controlled Vacuum Dryer. Sustainability 2025, 17, 5980. https://doi.org/10.3390/su17135980
Mansour NE, Villagran E, Rodriguez J, Akrami M, Flores-Velazquez J, Metwally KA, Alhumedi M, Ahmed AF, Elshawadfy Elwakeel A. Effect of Drying Conditions on Kinetics, Modeling, and Thermodynamic Behavior of Marjoram Leaves in an IoT-Controlled Vacuum Dryer. Sustainability. 2025; 17(13):5980. https://doi.org/10.3390/su17135980
Chicago/Turabian StyleMansour, Nabil Eldesokey, Edwin Villagran, Jader Rodriguez, Mohammad Akrami, Jorge Flores-Velazquez, Khaled A. Metwally, M. Alhumedi, Atef Fathy Ahmed, and Abdallah Elshawadfy Elwakeel. 2025. "Effect of Drying Conditions on Kinetics, Modeling, and Thermodynamic Behavior of Marjoram Leaves in an IoT-Controlled Vacuum Dryer" Sustainability 17, no. 13: 5980. https://doi.org/10.3390/su17135980
APA StyleMansour, N. E., Villagran, E., Rodriguez, J., Akrami, M., Flores-Velazquez, J., Metwally, K. A., Alhumedi, M., Ahmed, A. F., & Elshawadfy Elwakeel, A. (2025). Effect of Drying Conditions on Kinetics, Modeling, and Thermodynamic Behavior of Marjoram Leaves in an IoT-Controlled Vacuum Dryer. Sustainability, 17(13), 5980. https://doi.org/10.3390/su17135980