Abstract
Green roofs are increasingly recognized as effective Nature-Based Solutions (NBS) for urban stormwater management, contributing to sustainable and climate-resilient cities. The Soil Conservation Service Curve Number (SCS-CN) model is commonly used to simulate their hydrological performance due to its simplicity and low data requirements. However, the standard assumption of a fixed initial abstraction ratio (Ia/S = 0.2), long debated in hydrology, has been largely overlooked in green roof applications. This study investigates the variability of Ia/S and its impact on runoff simulation accuracy for a green roof under a humid subtropical climate. Event-based analysis across multiple storms revealed Ia/S values ranging from 0.01 to 0.62, with a calibrated optimal value of 0.17. This variability is primarily driven by the physical and biological characteristics of the green roof rather than short-term rainfall conditions. Using the fixed ratio introduced consistent biases in runoff estimation, while intermediate ratios (0.17–0.22) provided higher accuracy, with the optimal ratio yielding a median Curve Number (CN) of 89 and high model performance (NSE = 0.95). Additionally, CN values followed a positively skewed Weibull distribution, highlighting the value of probabilistic modeling. Though limited to one green roof design, the findings underscore the importance of site-specific parameter calibration to improve predictive reliability. By enhancing model accuracy, this research supports better design, evaluation, and management of green roofs, reinforcing their contribution to integrated urban water systems and global sustainability goals.
1. Introduction
The intensification of climate change and the growing prevalence of impervious surfaces in urban areas are significantly disrupting the water cycle and aggravating environmental issues. Green–Blue Infrastructure has emerged as a promising response, offering multiple social and environmental co-benefits that enhance urban resilience [1]. Among Green–Blue Infrastructure strategies, green roofs are especially relevant due to their capacity to attenuate runoff from rooftops, which can represent 40–50% of a city’s impervious surface [2]. Their multilayered structure—including drainage, engineered substrate, and vegetation—provides critical hydrological functions such as stormwater retention and detention [3,4], while also delivering additional benefits such as thermal insulation, air quality improvement, diffuse pollution mitigation, and aesthetic enhancement [5,6].
As the adoption and incentivization of green roofs continues to expand, evaluating their hydrological performance at the watershed scale becomes increasingly critical [7]. However, most modeling approaches currently employed are computationally intensive and require high-resolution input data [7]. In contrast, the Soil Conservation Service Curve Number (SCS-CN) method remains widely used in GBI studies due to its simplicity, broad applicability, and ease of integration with more sophisticated modeling frameworks [8,9,10].
A fundamental assumption of the SCS-CN method is a fixed proportional relationship between initial abstraction (Ia), which includes interception, infiltration, surface storage, and depression storage, and maximum potential retention (S), commonly set at a ratio of 0.2. However, this default value was introduced without empirical justification, raising concerns regarding its generalized application [11]. Many researchers have questioned both the validity of the 0.2 ratio and the underlying assumption of a linear Ia–S relationship [12]. For instance, ref. [13] reported improved runoff predictions using a ratio of 0.05 in U.S. watersheds, while other studies have emphasized the importance of contextual factors such as climate, land use, and soil type in determining appropriate Initial Abstraction Ratio (Ia/S) [11,14].
Given the evidence that the Ia/S ratio is highly dependent on regional and site-specific conditions, using a fixed value may introduce significant bias, particularly when applied to heterogeneous or engineered surfaces such as green roofs. Despite this, the 0.2 ratio remains widely used in green roof modeling applications employing the SCS-CN method [15,16,17,18,19,20]. To date, the only study that explicitly assessed the Ia/S ratio for green roofs was conducted in a semi-arid context and proposed alternative values (0.05 and 0.5) for improved model accuracy [21]. This highlights a critical knowledge gap: no study has yet investigated the performance of the SCS-CN method or variability in Ia/S ratios for green roofs situated in humid subtropical climates, where frequent rainfall events, high atmospheric humidity, and elevated antecedent moisture can substantially alter runoff generation mechanisms.
Antecedent moisture conditions and substrate saturation are known to significantly influence the hydrological response of green roofs and, consequently, the estimation of the Ia/S ratio [22]. Wet substrates reduce storage capacity and lower Ia values, while dry or high-retention substrates can increase abstraction and delay runoff initiation [23]. These dynamics are shaped by various factors, including green roof age, maintenance practices, and vegetation cover, all of which affect infiltration rates and storage capacity over time [24,25]. To capture these temporal dynamics in modeling efforts, meteorological indices such as the Antecedent Dry Weather Period (ADWP) and the Antecedent Precipitation Index (API) are commonly employed as proxies for substrate moisture content [22,26,27]. These indices offer continuous, event-responsive estimations of antecedent wetness, providing a practical and often more accurate representation of moisture conditions in engineered systems like green roofs.
This study addresses this gap by empirically evaluating the initial abstraction ratio in an aged green roof located in a humid subtropical climate. Specifically, it investigates the impact of varying Ia/S ratios on runoff predictions using the SCS-CN method. Furthermore, it applies probabilistic analysis to curve number (CN) values to improve the representation of green roof hydrological behavior under real-world rainfall conditions. The results reveal that the optimal Ia/S ratio was 0.17, lower than the conventional 0.2 value, and that the ratio’s variability was more strongly influenced by green roof physical properties than by climatic variables. Maintaining the fixed ratio led to model bias—overestimating runoff for small events and underestimating it for larger ones.
These findings refine the application of the SCS-CN method to green roof hydrology by demonstrating the importance of using locally calibrated parameters—particularly the Ia/S ratio—to improve the accuracy of runoff predictions. This enhanced modeling approach holds significant implications for urban planning and stormwater management, as it supports more reliable evaluations of green roof performance under specific climatic and site conditions. Incorporating probabilistic CN values further strengthens the model’s capacity to represent hydrological responses across diverse rainfall scenarios, aiding the design of more resilient and cost-effective green infrastructure strategies for flood mitigation and climate adaptation.
2. Materials and Methods
2.1. Green Roof Pilot
The experimental site is located at the University of São Paulo, Brazil. The green roof was constructed in 2010 on a 14 m2 concrete slab, with a total vegetated area of 11.42 m2 and a 3% slope. Its layered composition (Figure 1) follows established standards [28] and was built to ensure proper waterproofing and durability. After curing, a fine mortar smoothing process was applied to correct surface irregularities, ensuring the effective adhesion of the Lwarflex asphalt waterproofing membrane (Lwart Química), which was installed by specialized labor. A leak test was conducted to identify and address any defects.
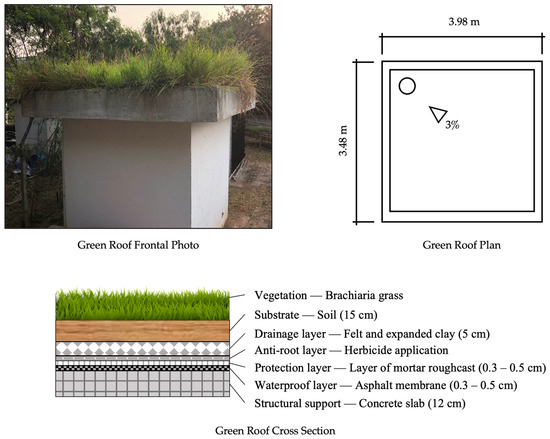
Figure 1.
Plan view of the green roof (GR), indicating its dimensions, slope, slope direction (represented by a triangle), and drainage outlet (represented by a circle). The schematic also displays the functional layers of the GR, including material composition and respective thicknesses (source: by the authors).
To enhance protection and prevent root intrusion, a fine mortar roughcast was applied as a mechanical barrier, followed by an herbicide treatment. A felt layer was then placed for additional mechanical protection, with a drainage layer of expanded clay positioned above it. Another felt layer was added to act as a filtration system, preventing substrate particle loss. The final layer consisted of a 15 cm-thick substrate composed of vegetable soil, later enriched with worm humus to improve soil quality. Further construction details and photographs can be found in [29].
The vegetation on the green roof consists of brachiaria, a species well-suited to subtropical climates, known for its strong resistance to dry periods and high temperatures. Its evapotranspiration rate can be significant, particularly during the rainy season when temperatures are elevated [30].
São Paulo experiences a humid subtropical climate (Cwa: hot summer, dry winter) according to the Köppen–Geiger classification [31]. Climatological normal data from 1990 to 2020 according to [32] indicate an average annual relative humidity of 73.6% and a total yearly precipitation of 1654 mm, distributed over approximately 139 rainy days. The city’s mean annual temperature is 20.4 °C, with an average minimum of 16.4 °C and a maximum of 26.1 °C. Additionally, the potential evapotranspiration rate is 1451.6 mm per year. Precipitation is predominantly concentrated in the summer months, while winter remains the driest season.
2.2. Data Collection
This study monitored 16 natural rainfall events during the rainy seasons between October and April of 2022, 2023, and 2024. To ensure analytical consistency, only events with measurable runoff were selected, with average rainfall depths ranging from 9.6 mm to 35 mm. This range aligns with the expected performance range of green roofs, which are typically designed to manage frequent, moderate rainfall events [33]. Events without runoff were excluded because the SCS-CN method requires a positive runoff response to estimate the initial abstraction ratio (Ia/S) and the potential maximum retention (S) [34]. Including zero-runoff events would result in undefined CN values and introduce mathematical inconsistencies in the calibration process. However, we acknowledge that this selection may introduce bias by overrepresenting higher rainfall events that surpass the retention capacity of the green roof. As a result, the calibrated Ia/S value may not fully capture the green roof’s behavior under low-intensity events, which are often entirely retained. Still, this limitation is consistent with other green roof studies, where events below approximately 10 mm often produce no runoff [35]. Similarly, ref. [36] found that events under 20 mm may not contribute significantly to runoff. Moreover, including a high proportion of low-rainfall events could distort the CN estimates, as the method performs poorly under very small precipitation depths [17]. Future work should explore strategies to better integrate zero-runoff dynamics into hydrological modeling of green roofs.
Meteorological data were obtained from a rain gauge located approximately 470 m from the experimental site, maintained by the São Paulo Flood Alert System (SAISP). Although this distance may not fully capture microclimatic variability, particularly during short-duration or low-intensity rainfall, the potential bias is limited. This is the closest available station, and it records data at five-minute intervals with a resolution of 0.2 mm. The use of nearby stations is a common and scientifically accepted practice for evaluating the hydrological performance of green roofs. Several studies have used stations located more than 400 m and even beyond 1 km from the monitoring sites while obtaining reliable results [37,38,39,40,41]. For instance, ref. [35] validated rainfall data using a station 1.5 km away, and Locatelli et al., 2014 [42] state that distances under one kilometer are generally acceptable for hydrological assessments. Moreover, since the analysis focused exclusively on events that produced runoff, the influence of unrepresented light rainfall on the calibration of Ia/S is minimized.
Table 1 summarizes the key characteristics of the monitored rainfall events, including rainfall depth, mean intensity, duration, ADWP, and antecedent precipitation over 1 and 7 days (API1 and API7, respectively).

Table 1.
Characteristics of the 16 monitored rainfall events, including total depth, duration, antecedent dry weather period (ADWP), and accumulated precipitation over the previous one (API1) and seven days (API7).
Green roof outflow was measured using a triangular-notch weir tank equipped with an ultrasonic distance sensor (US-025, generic module, manufactured in China). The weir discharge coefficient was calibrated in the laboratory to accurately represent the outflow discharge curve, particularly for low-flow conditions (<200 mL/s), considering site-specific characteristics. Ultrasonic sensor data were corrected for air temperature variations, and a robust non-parametric statistical analysis was applied to identify and remove outliers. Details of the data processing methodology are available in [43].
2.3. Soil Conservation Service Curve Number (SCS-CN)
The SCS-CN model [44,45] is a widely used hydrological model for estimating surface runoff. The model is based on a mass balance equation, as expressed in Equation (1):
where P is the rainfall depth (mm); F is the infiltration volume (mm); Q is the runoff depth (mm); and is the initial abstraction (mm). The model further assumes the following relationship in Equation (2):
where S denotes the maximum potential retention (mm). By combining Equations (1) and (2), Q can be expressed as in Equation (3), which is valid when P exceeds , otherwise, Q is equal to 0.
The initial abstraction ratio () is a parameter utilized to simplify the SCS-CN model, based on the linear relationship assumed between and S, as described in Equation (4). The value of is conventionally set at 0.2. By substituting Equation (4) into Equation (3), the parameter S, representing the potential maximum retention, can be determined using Equation (5). The relationship between the CN and S is then defined by Equation (6).
2.4. Initial Abstraction Ratio Calculation Methods
The initial abstraction is defined as the rainfall depth required to initiate runoff [17]. In this study, the initial abstraction was experimentally determined through direct monitoring. Abstraction losses encompass a variety of processes, including interception storage, surface storage in ponds and other temporary reservoirs, and infiltration to the subsurface and evapotranspiration [11]. To estimate the parameter S, representing the potential maximum retention, Equation (7), which is a rearranged form of Equation (3), was applied to each rainfall event:
The Least Squares Method (LSM) was applied to estimate the initial abstraction ratio by minimizing the difference between observed and estimated runoff depths. This approach optimizes to achieve the best fit between modeled and observed data. The objective function (Equation (8)) to be minimized is given by:
where P and R are the observed rainfall and runoff depths (mm) for event i, S is the potential maximum retention, and n is the number of events. The optimization was performed using the Solver tool in Microsoft Excel, ensuring an accurate estimation of the optimal ratio for runoff prediction.
For comparison purposes, the initial abstraction ratios of 0.05 and 0.50, as used by Liu et al., 2021 [21], were also evaluated, as this study is the only one that calibrated the initial abstraction ratio for green roofs.
2.5. Statistical Analyses
The Kolmogorov–Smirnov test was applied to evaluate the distribution of the ratio and CN values. This non-parametric test compares the sample’s distribution to a theoretical reference distribution (one-sample) or between two independent samples (two-sample). A p-value below 0.05 indicates a significant difference from the reference distribution. Additionally, regression analyses were conducted, including the coefficient of determination (R2), p-value for the t-test (evaluating the slope), and the F-test (assessing model significance). These statistical tests provided insights into the relationship between observed and predicted values, and the adequacy of the model as a whole. Performance indicators were used to assess the best ratio, including the Mean Absolute Error (MAE), Nash–Sutcliffe Efficiency (NSE), and Root Mean Squared Error (RMSE). The MAE measures the average absolute difference between observed and predicted values, with lower values indicating better accuracy. The NSE evaluates the model fit, where values closer to 1 suggest superior performance. The RMSE quantifies the average squared differences between predicted and observed values, with lower values indicating a better model fit. These indicators were employed to assess the overall model performance and to compare the effectiveness of different initial abstraction ratios.
3. Results and Discussion
3.1. Initial Abstraction Ratio
The Ia/S ratios exhibited substantial variability among the monitored events, reflecting the complex dynamics of runoff generation on green roofs (Table 2). After excluding non-runoff events and outliers (ratios > 1 or <0.01), the calculated Ia/S values ranged from 0.01 to 0.62, with a mean of 0.24 and a median of 0.20. The optimal ratio, obtained using the least-squares method, was determined as 0.17, indicating the best fit between modeled and observed runoff depths. A Kolmogorov–Smirnov test confirmed that the distribution of Ia/S values did not differ significantly from a normal distribution (p = 0.72), suggesting that the mean ratio is a reliable representative statistic.
Table 2.
Rainfall event characteristics, including observed initial abstraction, computed maximum potential retention, and the initial abstraction ratio (Ia/S).
When compared to other studies, the Ia/S values found here were noticeably lower. For instance, ref. [21] reported ratios ranging from 0.18 to 0.89 with a mean of 0.51 for a green roof in a semi-arid climate. Similarly, Ekwule and Agunwamba (2024) [46] identified an optimal ratio of 0.24, slightly higher than the standard value of 0.20 commonly adopted in the SCS method. These discrepancies underscore the increasing recognition that a fixed Ia/S ratio may not be universally applicable to green roof systems, particularly given the diversity of climatic conditions, structural configurations, and vegetative dynamics [47].
To investigate potential drivers of the observed variability in the Ia/S ratios, linear regression models were applied using several hydrometeorological indicators, including total rainfall depth, ADWP, and antecedent precipitation indices over 1-day and 7-day windows. However, all models exhibited low coefficients of determination (R2 < 0.05), indicating negligible explanatory power of these meteorological variables on Ia/S ratios variability. These results suggest that rainfall properties and short-term hydrological conditions are not the primary determinants of Ia/S ratios in the studied green roof system.
Instead, the variability appears to be more strongly influenced by physical and biological characteristics of the green roof, such as vegetation development and seasonal dynamics. This interpretation aligns with [21], who found no relationship between Ia/S and precipitation depth, and with [48], who observed seasonal variation in Ia/S values due to vegetation phenology in non-urbanized catchments. Vegetation cover has been consistently identified as a major determinant of Ia/S [49], not only because of its interception capacity but also due to its impact on infiltration dynamics. Vegetation roots may create preferential pathways that alter the soil structure and promote variable infiltration rates [50], while leaf area directly affects canopy interception losses, as shown by [51]. Furthermore, the seasonal growth pattern of dominant species such as Brachiaria Pereira-Flores et al., 2023) [30] contributes to temporal variability in abstraction behavior.
Although this study did not directly measure substrate moisture or evaluate different green roof designs, limitations that could influence Ia/S estimation, the observed variability, and comparisons with existing literature provide strong support for rejecting the use of a fixed abstraction ratio.
These findings demonstrate that the initial abstraction ratio in green roofs under a humid subtropical climate is not a static value but rather fluctuates significantly between events. This variability is more strongly linked to internal physical and biological system characteristics than to meteorological inputs. These results reinforce the importance of localized calibration and support the broader hypothesis that the hydrological performance of green roofs cannot be effectively represented by fixed parameters across varying climatic and structural conditions.
3.2. Influence of Ratio in Runoff Prediction
Assuming a fixed initial abstraction ratio, different values were evaluated for predicting runoff depth by comparing model estimates to observed data (Figure 2). A dashed line represents the graph bisector, indicating the ideal 1:1 relationship between observed and predicted runoff depths. Table 3 presents the results of the linear regression analysis for various initial abstraction ratios. For all ratios, both the t-test and the F-test indicated that the slope and the models are significant at the 5% level.
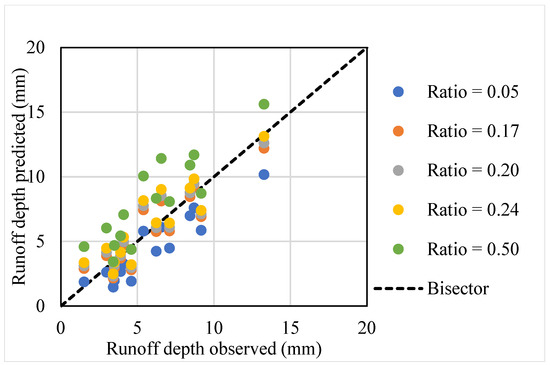
Figure 2.
Comparison graph between runoff depth observed vs. predicted for initial abstraction ratios of 0.05, 0.20, 0.22, and 0.50.
Table 3.
Linear regression analysis of observed vs. predicted runoff depths for different initial abstraction ratios. The table includes slope, intercept, and R2 values for each ratio, reflecting the model’s performance in predicting runoff depth at varying initial abstraction levels.
The results revealed that increasing the initial abstraction ratio generally leads to higher intercept values in the regression models, which indicates a tendency toward greater predicted runoff volumes and, consequently, lower modeled retention. This pattern occurs because, as the initial abstraction increases, a smaller portion of rainfall is initially held within the system before runoff generation begins. In practical terms, the model redistributes more precipitation into initial losses, reducing the simulated water retention capacity and accelerating the onset of runoff [52].
The configuration with the highest tested ratio (Ia/S = 0.50) produced a regression slope near unity but with a notably high intercept, suggesting that although the predicted values align closely with the ideal 1:1 line overall, the model consistently overestimates runoff, especially during small rainfall events. This overestimation stems from an excessive allocation of rainfall to initial abstraction, resulting in premature runoff production. In contrast, the lowest tested ratio (Ia/S = 0.05) yielded a sub-unitary slope and lower intercept, which reflects a systematic underestimation of runoff, particularly under high-intensity rainfall. Here, the model fails to capture the actual threshold for runoff initiation, leading to delayed responses and reduced predicted depths. Intermediate values (Ia/S = 0.17, 0.20, and 0.22) offered more accurate runoff estimates for moderate rainfall events, but even these configurations exhibited prediction biases, with overestimations under light rainfall and underestimations during intense precipitation.
These observed biases arise from the simplifying assumption of a fixed initial abstraction ratio, which fails to capture the non-linear and dynamic nature of the rainfall–runoff relationship. By imposing a constant Ia/S across events of varying magnitude and intensity, the model introduces structural errors into runoff prediction. This is evident in the consistent presence of sub-unitary regression slopes and positive intercepts, which signal that runoff is either systematically overpredicted or underpredicted depending on the rainfall regime [12,53]. The use of a single fixed value across hydrologically diverse conditions may therefore compromise the model’s generalizability and reliability. In practical terms, the selection of an appropriate Ia/S must account not only for statistical performance but also for the hydrological implications of its use, particularly in urban environments where stormwater infrastructure must be designed with a sufficient margin of safety. In such contexts, adopting a slightly conservative Ia/S that errs on the side of overestimation can help reduce the risks associated with underpredicting runoff during extreme events.
These findings emphasize the necessity of calibrating the initial abstraction ratio based on local hydrological conditions and the specific characteristics of the green infrastructure system under evaluation. In particular, the optimization of this parameter is vital for enhancing the reliability and performance of runoff models used in water conservation strategies. Future research should explore the implementation of adaptive or event-specific abstraction ratios that respond dynamically to varying rainfall patterns, thereby reducing model bias and improving the accuracy of SCS-CN-based runoff simulations for green roof applications.
3.3. Ratio Runoff Prediction Performance Analyses
To assess the predictive performance of different initial abstraction ratios for green roof runoff modeling, several fixed values were evaluated (Figure 3). These configurations were tested by comparing modeled runoff depths against observed data using three statistical metrics.
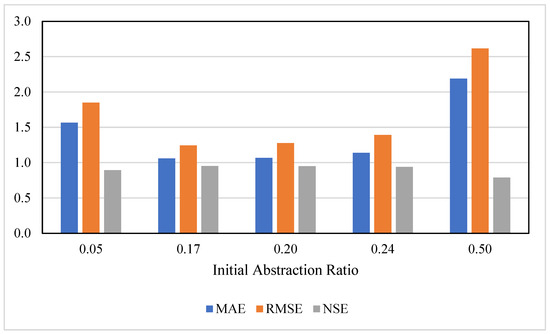
Figure 3.
Performance evaluation of different Ia/S in predicting runoff depth. The bar chart presents the Mean Absolute Error (MAE), Root Mean Square Error (RMSE), and Nash–Sutcliffe Efficiency (NSE) for Ia/S values.
The analysis revealed a distinct performance gradient tied to the selection of Ia/S. The ratio of 0.50 consistently yielded the weakest performance, with the highest MAE (2.19) and RMSE (2.61) and the lowest NSE (0.79), indicating significant overestimation of runoff. In contrast, the values of 0.17 and 0.20 demonstrated superior performance across all evaluation metrics, each reaching an NSE of 0.95 and relatively low error values (MAE = 1.06 and 1.07; RMSE = 1.24 and 1.28, respectively). The slightly better performance of Ia/S = 0.17 highlights its stability across a wider range of rainfall conditions. While the 0.05 ratio performed moderately (NSE = 0.89), it was less effective in capturing larger runoff events. The average ratio of 0.24 also produced acceptable results (NSE = 0.94), though with marginally higher dispersion.
These results align with findings from [54], who observed improved runoff predictions using Ia/S values lower than the conventional 0.20, and from [48], who reported that empirical calibrations of Ia/S in urban hydrology often result in values below 0.2. Moreover, the use of the Least Squares approach in determining the optimal abstraction ratio reinforces the reliability of the Ia/S = 0.17 value in this study. Similar methodological advantages of Least Squares in CN-based modeling were highlighted by [49], who found that Least Squares outperformed traditional and asymptotic fitting techniques in estimating parameters for runoff prediction.
Taken together, these findings identify Ia/S = 0.17 as the most suitable initial abstraction ratio for the green roof system under a humid subtropical climate, balancing low predictive error with strong model efficiency. This value appears well-calibrated to the specific hydrological behavior of the green roof, particularly under the conditions of moderate to intense rainfall, and provides a more robust alternative to the fixed values typically used in the literature. For practitioners and modelers, Ia/S = 0.17 offers a credible starting point for future runoff simulations in similar climates and green roof configurations.
3.4. Influence of Ratio in CN
Figure 4 illustrates the CN range calibrated for each event, varying the fixed initial abstraction ratio. Each ratio is represented by a boxplot of the CN values. The variability in CN values is significantly influenced by the initial abstraction ratio, with higher ratios yielding elevated values and exhibiting less variation (lower standard error—Table 4), whereas lower ratios show greater variability and lower CN values.
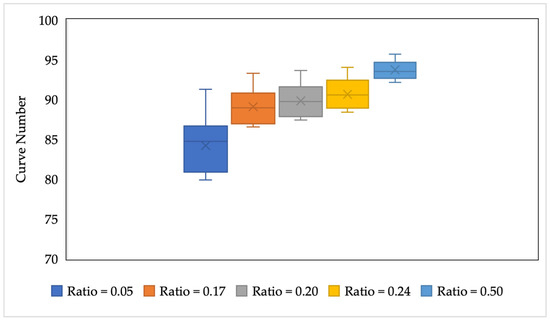
Figure 4.
Boxplot showing the distribution of Curve Number (CN) values for each assessed initial abstraction ratio, highlighting the variability and central tendency across different ratios.
Table 4.
Summary statistics for CN values at different ratios, including mean, median, standard deviation, 95% confidence intervals (lower and upper limits), and the skewness coefficient.
This pattern can be attributed to the redistribution of available storage between initial abstraction and potential maximum retention. As the initial abstraction ratio increases, a smaller proportion of the total storage capacity is allocated to S, leading to higher CN values and a reduction in retention capacity. Consequently, an increase in initial abstraction enhances the system’s ability to delay runoff initiation. These effects underscore the critical importance of selecting an appropriate initial abstraction ratio to ensure accurate hydrological modeling while effectively balancing retention and runoff dynamics. This relationship highlights the fundamental role of initial abstraction in governing runoff generation and retention capacity.
3.5. Probabilistic Patterns of CN
The selection of the most suitable distribution for modeling CN values was guided by the results of the Kolmogorov–Smirnov test, which assesses the goodness of fit based on p-values (Table 5). Among the tested distributions, the Weibull consistently exhibited the highest p-values for most initial abstraction ratios, particularly for 0.17, 0.20, and 0.24, indicating a strong fit. For ratio 0.05, the Normal and Gamma distributions also showed relatively high p-values, making them viable alternatives, while for ratio 0.50, the Weibull remained the most appropriate choice. Overall, these results suggest that the Weibull distribution best represents the variability of CN values across different initial abstraction ratios.
Table 5.
p-values from the Kolmogorov–Smirnov test for different probability distributions (Normal, Log-Normal, Exponential, Gamma, and Weibull) applied to CN values at various initial abstraction ratios.
The preference for the Weibull distribution is further substantiated by the observed skewness values, which indicate a moderately right-skewed distribution across the different ratios (Table 4). The skewness values range from 0.425 at ratio 0.05 to 0.027 at ratio 0.50, reflecting a gradual transition from more asymmetric distributions at lower ratios to near symmetry at higher ratios. This suggests that for lower initial abstraction ratios, CN values are more concentrated toward lower magnitudes, with a longer right tail where higher values occasionally occur. In contrast, at higher ratios, CN values are more symmetrically distributed around their central tendency.
This preference is further supported by the distribution’s ability to capture the observed skewness in the CN datasets (Table 5). The skewness values ranged from 0.425 at ratio 0.05 to 0.027 at ratio 0.50, indicating a shift from moderately right-skewed to nearly symmetric distributions. This trend implies that lower initial abstraction ratios tend to yield lower CN values with occasional higher extremes, while higher ratios are more centered around the mean. The Weibull distribution, which is known for its flexibility in modeling positively skewed data, captures this behavior effectively.
While the Weibull distribution does not have a theoretical basis directly derived from the SCS-CN method, its application is supported by its success in modeling other hydrologically relevant variables. For example, ref. [55] demonstrated the effectiveness of the Weibull distribution in representing hydraulic conductivity and soil water retention curves across a wide range of soil types and textures. These precedents show that Weibull functions are well suited to capture the natural variability and skewness often found in hydrological parameters.
Therefore, the use of the Weibull distribution in this context is justified on empirical grounds and aligned with its broader application in hydrology. By representing both typical and extreme CN values, the Weibull distribution offers a robust statistical framework for hydrological modeling. Its use enhances the stochastic generation of CN values in runoff simulations, contributing to more realistic and reliable assessments of hydrological response [53].
3.6. Limitations and Future Work
This study evaluated a single extensive green roof configuration. While realistic, this design constrains the generalizability of the findings to other green roof types or climatic regions. Numerous factors—such as substrate composition and depth, roof slope, vegetation type, and maintenance practices—can significantly influence hydrological behavior [27,35,56]. Moreover, even under identical macroclimatic conditions, microclimatic variations can produce divergent hydrological responses, limiting the transferability of results [57,58]. Another limitation is the relatively small dataset, which includes only 16 rainfall events, predominantly from the rainy season and under average precipitation conditions. While the findings on the sensitivity of the initial abstraction ratio and CN variability are robust, the limited range of conditions warrants caution in broader application.
Furthermore, the analysis focused exclusively on runoff volume, without addressing other critical hydrological benefits of green roofs, such as peak flow attenuation, time to peak, and hydrograph modification—metrics that are equally relevant for urban stormwater management. It is also important to emphasize that this study does not propose a universally calibrated Ia/S ratio. Instead, it underscores that using a default fixed value (e.g., Ia/S = 0.2) may lead to suboptimal performance, and that Ia/S calibration should be tailored to local climatic and structural conditions to enhance model reliability.
Future research should expand on this work by conducting multi-site studies under varied climatic regimes and with diverse green roof configurations to evaluate the impact of design variables on Ia/S calibration and runoff prediction using the SCS-CN method. Further efforts should incorporate a wider range of rainfall events, including extreme and dry-period storms, and assess additional performance metrics such as detention time, peak flow reduction, and hydrograph shape. Finally, applying and validating this approach at the watershed scale would help assess the cumulative effects of green roofs on urban hydrology, contributing to improved planning and stormwater modeling in data-scarce regions.
4. Conclusions
This study investigated the variability of the initial abstraction ratio (Ia/S) and its implications for runoff prediction in a green roof system under humid subtropical conditions. The Ia/S ratio varied significantly across monitored rainfall events, ranging from 0.01 to 0.62, with an average of 0.24 and an optimized value of 0.17 obtained through Least-Squares fitting. These findings reveal that using a single fixed ratio—as commonly assumed in the SCS-CN method—can misrepresent the hydrological response of green roofs, leading to the overprediction of low runoff volumes and underestimation during high-flow events.
The results emphasize the need for site-specific calibration of the initial abstraction ratio, particularly in climates and configurations where green roof performance is affected by seasonal vegetation dynamics and structural characteristics. The optimal Ia/S value of 0.17, reflecting the particular hydrological constraints of the monitored system, led to a CN median of 89. Model performance metrics for this configuration demonstrated high accuracy, with an MAE of 1.06 mm, an RMSE of 1.24 mm, and an NSE of 0.95.
In support of a more conservative design approach, we recommend that practitioners account for potentially higher runoff volumes in sizing and managing green roof systems—especially under extreme rainfall scenarios. Such an approach ensures sufficient hydraulic capacity and resilience in urban stormwater infrastructure.
Additionally, the study demonstrated the effectiveness of using the Weibull distribution to model the variability in CN values across different Ia/S scenarios. The distribution captured the right-skewed behavior of the data, particularly under conditions with higher runoff potential, and proved to be a valuable probabilistic tool for refining runoff simulations.
In conclusion, this research contributes to a deeper understanding of green roof hydrological behavior in subtropical climates, underscoring the importance of dynamic and localized modeling approaches. By integrating calibrated abstraction ratios and probabilistic methods such as the Weibull distribution, this study enhances the accuracy of runoff predictions. These findings support more reliable design, operation, and evaluation of green roofs and reinforce their role as effective components of urban stormwater management and climate-resilient city planning.
Author Contributions
Conceptualization, T.M.O.; methodology, T.M.O. and F.F.N.; validation, F.F.N.; investigation, T.M.O.; data curation, T.M.O.; writing—original draft, T.M.O.; writing—review and editing, F.F.N. and J.R.S.M.; visualization, T.M.O.; supervision, J.R.S.M. and B.C.C.L.; project administration, J.R.S.M.; funding acquisition, J.R.S.M. and B.C.C.L. All authors have read and agreed to the published version of the manuscript.
Funding
This research was funded by the University of Sao Paulo/FCTH, grant number Conv. #1014756, and the APC was funded by FCTH.
Institutional Review Board Statement
Not applicable.
Informed Consent Statement
Not applicable.
Data Availability Statement
The raw data supporting the conclusions of this article will be made available by the authors on request.
Acknowledgments
The authors gratefully acknowledge the research support provided by the Hydraulic Technological Center Foundation (FCTH) and the city of Sao Jose dos Campos.
Conflicts of Interest
The authors declare no conflicts of interest.
References
- Kuitert, L.; van Buuren, A. Delivering blue-green infrastructure: Innovation pathways for integrating multiple values. Front. Sustain. Cities 2022, 4, 885951. [Google Scholar] [CrossRef]
- Stovin, V.; Vesuviano, G.; Kasmin, H. The hydrological performance of a green roof test bed under UK climatic conditions. J. Hydrol. 2012, 414–415, 148–161. [Google Scholar] [CrossRef]
- Leite, F.R.; Antunes, M.L.P. Green roof recent designs to runoff control: A review of building materials and plant species used in studies. Ecol. Eng. 2023, 189, 106924. [Google Scholar] [CrossRef]
- Li, Y.; Liu, J. Green roofs in the humid subtropics: The role of environmental and design factors on stormwater retention and peak reduction. Sci. Total Environ. 2023, 858, 159710. [Google Scholar] [CrossRef]
- Osawa, T.M.; Cristina, M.; Pereira, S.; Chaves, B.; Leite, C.; Rodolfo, J.; Martins, S. Impact of an aged green roof on stormwater quality and first-flush dynamics. Buildings 2025, 15, 1763. [Google Scholar] [CrossRef]
- Manso, M.; Teotónio, I.; Silva, C.M.; Cruz, C.O. Green roof and green wall benefits and costs: A review of the quantitative evidence. Renew. Sustain. Energy Rev. 2021, 135, 110111. [Google Scholar] [CrossRef]
- Kumar, P.; Debele, S.E.; Sahani, J.; Rawat, N.; Marti-Cardona, B.; Alfieri, S.M.; Basu, B.; Basu, A.S.; Bowyer, P.; Charizopoulos, N.; et al. Nature-based solutions efficiency evaluation against natural hazards: Modelling methods, advantages and limitations. Sci. Total Environ. 2021, 784, 147058. [Google Scholar] [CrossRef]
- Rostamzadeh, S.; Malekmohammadi, B.; Mashhadimohammadzadehvazifeh, F.; Arsanjani, J.J. The Effects of low-impact development best management practices on reducing stormwater caused by land use changes in urban areas: A case study of Tehran City, Iran. Land 2025, 14, 28. [Google Scholar] [CrossRef]
- Wu, X.; Moustakas, S.; Bezak, N.; Radinja, M.; Alivio, M.B.; Mikoš, M.; Dohnal, M.; Bares, V.; Willems, P. Assessing the performance of blue-green solutions through a fine-scale water balance model for an urban area. Sci. Total Environ. 2024, 948, 174750. [Google Scholar] [CrossRef]
- Cho, Y.; Engel, B.A. Spatially distributed long-term hydrologic simulation using a continuous SCS CN method-based hybrid hydrologic model. Hydrol. Process. 2018, 32, 904–922. [Google Scholar] [CrossRef]
- Ponce, V.M.; Hawkins, R.H. Runoff curve number: Has it reached maturity? J. Hydrol. Eng. 1996, 1, 11–19. [Google Scholar] [CrossRef]
- Lee, K.K.F.; Ling, L.; Yusop, Z. The revised curve number rainfall–runoff methodology for an improved runoff prediction. Water 2023, 15, 491. [Google Scholar] [CrossRef]
- Woodward, D.E.; Hawkins, R.H.; Jiang, R.; Hjelmfelt, A.T., Jr.; Van Mullem, J.A.; Quan, Q.D. Runoff curve number method: Examination of the initial abstraction ratio. In Proceedings of the World Water & Environmental Resources Congress, Philadelphia, PA, USA, 23–26 June 2003. [Google Scholar]
- Mishra, S.K.; Sahu, R.K.; Eldho, T.I.; Jain, M.K. An improved Ia-S relation incorporating antecedent moisture in SCS-CN methodology. Water Resour. Manag. 2006, 20, 643–660. [Google Scholar] [CrossRef]
- Soulis, K.X.; Ntoulas, N.; Nektarios, P.A.; Kargas, G. Runoff reduction from extensive green roofs having different substrate depth and plant cover. Ecol. Eng. 2017, 102, 80–89. [Google Scholar] [CrossRef]
- Loiola, C.; Mary, W.; da Silva, L.P. Hydrological performance of modular-tray green roof systems for increasing the resilience of mega-cities to climate change. J. Hydrol. 2019, 573, 1057–1066. [Google Scholar] [CrossRef]
- Fassman-Beck, E.; Hunt, W.; Berghage, R.; Carpenter, D.; Kurtz, T.; Stovin, V.; Wadzuk, B. Curve number and runoff coefficients for extensive living roofs. J. Hydrol. Eng. 2016, 21, 1318. [Google Scholar] [CrossRef]
- Getter, K.L.; Rowe, D.B.; Andresen, J.A. Quantifying the effect of slope on extensive green roof stormwater retention. Ecol. Eng. 2007, 31, 225–231. [Google Scholar] [CrossRef]
- Carter, T.L.; Rasmussen, T.C. Hydrologic behavior of vegetated roofs. J. Am. Water Resour. Assoc. 2006, 42, 1261–1274. [Google Scholar] [CrossRef]
- Liu, W.; Feng, Q.; Chen, W.; Wei, W. Assessing the runoff retention of extensive green roofs using runoff coefficients and curve numbers and the impacts of substrate moisture. Hydrol. Res. 2020, 51, 635–647. [Google Scholar] [CrossRef]
- Liu, W.; Feng, Q.; Wang, R.; Chen, W. Effects of initial abstraction ratios in SCS-CN method on runoff prediction of green roofs in a semi-arid region. Urban For. Urban Green. 2021, 65, 127331. [Google Scholar] [CrossRef]
- Liu, W.; Zhang, X.; Feng, Q.; Engel, B.A.; Li, Z. Substrate moisture variations of extensive green roofs with different structural configurations in a semi-arid region: Observational data and dynamic simulation. J. Hydrol. 2023, 626, 130133. [Google Scholar] [CrossRef]
- Peng, Z.; Garner, B.; Stovin, V. Two green roof detention models applied in two green roof systems. J. Hydrol. Eng. 2022, 27, 2155. [Google Scholar] [CrossRef]
- Leite, B.C.C.; Gobatti, L.; Huttenlocher, I.G. Low-maintenance subtropical green roofs. Spontaneous vegetation and substrate depth. AGATHÓN—Int. J. Archit. Art Des. 2022, 11, 258–265. [Google Scholar]
- Speak, A.F.; Rothwell, J.J.; Lindley, S.J.; Smith, C.L. Rainwater runoff retention on an aged intensive green roof. Sci. Total Environ. 2013, 461–462, 28–38. [Google Scholar] [CrossRef] [PubMed]
- Pelorosso, R.; Petroselli, A.; Cappelli, F.; Noto, S.; Tauro, F.; Apollonio, C.; Grimaldi, S. Blue-green roofs as nature-based solutions for urban areas: Hydrological performance and climatic index analyses. Environ. Sci. Pollut. Res. Int. 2024, 31, 5973–5988. [Google Scholar] [CrossRef]
- Gobatti, L.; Leite, B.C.C. Unmanaged vegetated roofs hydrological performance in subtropical areas: An investigation in São Paulo, Brazil. Sci. Total Environ. 2023, 874, 162417. [Google Scholar] [CrossRef]
- Cascone, S. Green roof design: State of the art on technology and materials. Sustainability 2019, 11, 3020. [Google Scholar] [CrossRef]
- Ferraz, I.L. The Thermal Performance of Green Roof System in Comparison to the Traditional Ceramic Tile Roof System. Master’s Thesis, University of Sao Paulo, Sao Paulo, Brazil, 2012. [Google Scholar]
- Pereira-Flores, M.E.; Justino, F.; Rodrigues, J.M.; Boehringer, D.; Melo, A.A.M.; Cursi, A.G.; da Costa Pereira, V.; Pereira, O.G.; Ruiz-Vera, U.M. Seasonal climate impact on Brazilian pasture (Brachiaria brizantha cv Marandu): Growth rate, CO2 efflux, and irrigation strategies. Theor. Appl. Climatol. 2023, 151, 651–666. [Google Scholar] [CrossRef]
- Alvares, C.A.; Stape, J.L.; Sentelhas, P.C.; De Moraes Gonçalves, J.L.; Sparovek, G. Köppen’s climate classification map for Brazil. Meteorol. Z. 2013, 22, 711–728. [Google Scholar] [CrossRef]
- INMET Climatological Normals of Brazil 1991–2020. Available online: https://portal.inmet.gov.br/normais (accessed on 16 May 2025).
- Palla, A.; Gnecco, I. Hydrologic modeling of Low Impact Development systems at the urban catchment scale. J. Hydrol. 2015, 528, 361–368. [Google Scholar] [CrossRef]
- Wang, N.; Chu, X. A Modified SCS curve number method for temporally varying rainfall excess simulation. Water 2023, 15, 2374. [Google Scholar] [CrossRef]
- Liberalesso, T.; Tassi, R.; Ceconi, D.E.; Allasia, D.G.; Arboit, N.K.S. Effect of rice husk addition on the physicochemical and hydrological properties on green roof substrates under subtropical climate conditions. J. Clean. Prod. 2021, 315, 128133. [Google Scholar] [CrossRef]
- Pessoa, J.O.; Piccilli, D.G.A.; Persch, C.G.; Tassi, R.; Georgin, J.; Franco, D.S.P.; Yamil, Y.L. Identifying potential uses for green roof discharge based on its physical–chemical-microbiological quality. Environ. Sci. Pollut. Res. 2024, 31, 27221–27239. [Google Scholar] [CrossRef] [PubMed]
- Harper, G.E.; Limmer, M.A.; Showalter, W.E.; Burken, J.G. Nine-month evaluation of runoff quality and quantity from an experiential green roof in Missouri, USA. Ecol. Eng. 2015, 78, 127–133. [Google Scholar] [CrossRef]
- Zhang, Z.; Szota, C.; Fletcher, T.D.; Williams, N.S.G.; Farrell, C. Green roof storage capacity can be more important than evapotranspiration for retention performance. J. Environ. Manag. 2019, 232, 404–412. [Google Scholar] [CrossRef] [PubMed]
- Zhang, Q.; Miao, L.; Wang, X.; Liu, D.; Zhu, L.; Zhou, B.; Sun, J.; Liu, J. The capacity of greening roof to reduce stormwater runoff and pollution. Landsc. Urban Plan. 2015, 144, 142–150. [Google Scholar] [CrossRef]
- Silva, M.d.; Najjar, M.K.; Hammad, A.W.A.; Haddad, A.; Vazquez, E. Assessing the retention capacity of an experimental green roof prototype. Water 2020, 12, 90. [Google Scholar] [CrossRef]
- Houle, J.J.; Roseen, R.M.; Ballestero, T.P.; Puls, T.A.; Sherrard, J. Comparison of maintenance cost, labor demands, and system performance for LID and conventional stormwater management. J. Environ. Eng. 2013, 139, 932–938. [Google Scholar] [CrossRef]
- Locatelli, L.; Mark, O.; Mikkelsen, P.S.; Arnbjerg-Nielsen, K.; Jensen, M.B.; Binning, P.J. Modelling of green roof hydrological performance for urban drainage applications. J. Hydrol. 2014, 519, 3237–3248. [Google Scholar] [CrossRef]
- Osawa, T.M.; Pereira, M.C.S.; Martins, J.R.S. Error processing of water level data measurements by a low-cost ultrasonic sensor. In Proceedings of the 17th IWA Conference on Small Water and Wastewater Systems (SWWS) and 9th IWA Conference on Resource Oriented Sanitation (ROS), Paraná, Brazil, 10–14 November 2024; p. 4. [Google Scholar]
- SCS Hydrology, Soil Conservation Service. National Engineering Handbook; US Soil Conservation Service: Washington, DC, USA, 1956. [Google Scholar]
- Singh, P.K.; Yaduvanshi, B.K.; Patel, S.; Ray, S. SCS-CN Based quantification of potential of rooftop catchments and computation of ASRC for rainwater harvesting. Water Resour. Manag. 2013, 27, 2001–2012. [Google Scholar] [CrossRef]
- Ekwule, O.R.; Agunwamba, J.C. Application of the NRCS-curve number method in humid tropical basins of southeastern Nigeria: A statistical analysis. Environ. Syst. Res. 2024, 13, 52. [Google Scholar] [CrossRef]
- Do Valle Junior, L.C.G.; Rodrigues, D.B.B.; de Oliveira, P.T.S. Initial abstraction ratio and Curve Number estimation using rainfall and runoff data from a tropical watershed. Rev. Bras. Recur. Hidr. 2019, 24, 241920170199. [Google Scholar] [CrossRef]
- Krajewski, A.; Sikorska-Senoner, A.E.; Hejduk, A.; Hejduk, L. Variability of the initial abstraction ratio in an urban and an agroforested catchment. Water 2020, 12, 415. [Google Scholar] [CrossRef]
- Brandão, A.R.A.; Schwamback, D.; Ballarin, A.S.; Ramirez-Avila, J.J.; Vasconcelos Neto, J.G.; Oliveira, P.T.S. Toward a better understanding of curve number and initial abstraction ratio values from a large sample of watersheds perspective. J. Hydrol. 2025, 655, 132941. [Google Scholar] [CrossRef]
- Zhang, Z.; Szota, C.; Fletcher, T.D.; Williams, N.S.G.; Werdin, J.; Farrell, C. Influence of plant composition and water use strategies on green roof stormwater retention. Sci. Total Environ. 2018, 625, 775–781. [Google Scholar] [CrossRef]
- Wang, Q.; Guo, J. Rainfall interception loss as a function of leaf area index and rainfall by soybean. Theor. Appl. Climatol. 2024, 155, 289–297. [Google Scholar] [CrossRef]
- Santikari, V.P.; Murdoch, L.C. Accounting for spatiotemporal variations of curve number using variable initial abstraction and antecedent moisture. Water Resour. Manag. 2019, 33, 641–656. [Google Scholar] [CrossRef]
- You, L.; Tung, Y.K.; Yoo, C. Probabilistic assessment of hydrologic retention performance of green roof considering aleatory and epistemic uncertainties. Hydrol. Res. 2020, 51, 1377–1396. [Google Scholar] [CrossRef]
- Ajmal, M.; Moon, G.w.; Ahn, J.h.; Kim, T.w. Investigation of SCS-CN and its inspired modified models for runoff estimation in South Korean watersheds. J. Hydro-Environ. Res. 2015, 9, 592–603. [Google Scholar] [CrossRef]
- Shan, J.; Yang, Z.; Kuang, X.; Li, L.; Liu, J. Comparison of seven weibull distribution models for predicting relative hydraulic conductivity. Water Resour. Res. 2022, 58, e2021WR030683. [Google Scholar] [CrossRef]
- Castro, A.S.; Goldenfum, J.A.; da Silveira, A.L.; DallAgnol, A.L.B.; Loebens, L.; Demarco, C.F.; Leandro, D.; Nadaleti, W.C.; Quadro, M.S. The analysis of green roof’s runoff volumes and its water quality in an experimental study in Porto Alegre, Southern Brazil. Environ. Sci. Pollut. Res. 2020, 27, 9520–9534. [Google Scholar] [CrossRef] [PubMed]
- Jabeen, K.; Grossi, G.; Turco, M.; Dada, A.; Palermo, S.A.; Pirouz, B.; Piro, P.; Gnecco, I.; Palla, A. Continuous simulations for predicting green roof hydrologic performance for future climate scenarios. Hydrology 2025, 12, 41. [Google Scholar] [CrossRef]
- Liu, W.; Engel, B.A.; Feng, Q.; Li, R. Simulating annual runoff retention performance of extensive green roofs: A comparison of four climatic regions in China. J. Hydrol. 2022, 610, 127871. [Google Scholar] [CrossRef]
Disclaimer/Publisher’s Note: The statements, opinions and data contained in all publications are solely those of the individual author(s) and contributor(s) and not of MDPI and/or the editor(s). MDPI and/or the editor(s) disclaim responsibility for any injury to people or property resulting from any ideas, methods, instructions or products referred to in the content. |
© 2025 by the authors. Licensee MDPI, Basel, Switzerland. This article is an open access article distributed under the terms and conditions of the Creative Commons Attribution (CC BY) license (https://creativecommons.org/licenses/by/4.0/).