Article

Spatiotemporal Distribution of Atmospheric Particulate Matters and Correlations Among Them in Different Functional Areas of a Typical Mining City in Northwestern China

1
Institute of Soil and Water Conservation Science, Shanxi Agricultural University, Taiyuan 030013, China
2
School of Soil and Water Conservation, Beijing Forestry University, Beijing 100083, China
*
Author to whom correspondence should be addressed.
Sustainability 2025, 17(13), 5945; https://doi.org/10.3390/su17135945
Submission received: 30 May 2025 / Revised: 19 June 2025 / Accepted: 21 June 2025 / Published: 27 June 2025

Abstract

Identifying the coupling effect mechanisms of particulate matter (PM) in different functional areas on the atmospheric environment will help to carry out graded precision prevention and control measures against pollution within mining cities. This study monitored the pollution of three different functional areas in Wuhai, a typical mining city in Inner Mongolia. PM1, PM2.5, PM10, and TSP were sampled and analyzed for chemical fractions both in the daytime and at night in spring, summer, autumn, and winter. The results showed that the average daily concentrations of PM were generally higher in the mining area than in the urban and sandy areas in different seasons. The results of the Kerriging analysis showed that the urban area was affected the most when specific ranges of high PM concentrations were detected in the mining area and specific ranges of low PM concentrations were detected in the sandy area. PMF results indicated that the source of pollutants in different functional areas and seasons were dust, industrial and traffic emissions, combustion, and sea salt. The contributions of dust in PM with different particle sizes in the mining and sandy areas were as high as 49–72%, while all the pollutant sources accounted for a large proportion of pollution in the urban area. In addition, dust was the largest source of pollution in summer and winter, and the contribution of combustion sources to pollution was higher in winter. Health risks associated with Cr were higher in the sandy area, and non-carcinogenic risks associated with Mn were higher in the mining area during spring and summer, while there was a greater impact on human health in the urban area during autumn and winter. The results of this study revealed the coupling effect mechanisms of different functional areas on the local atmospheric environment and contribute to the development of regional atmospheric defense and control policies.

1. Introduction

Despite the gradual rise in clean energy and new energy, traditional fossil fuels such as coal remain the main sources of human energy [1,2]. Northwestern China is an important region for coal extraction, and numerous open-pit coal mines are present across the territory. Over the years, industrial production and transport have rapidly developed in the region, and the large-scale, high-intensity coal mining activities have destroyed the surface vegetation. A combination of various factors in the area, i.e., dry climate, scarce precipitation, strong evaporation, and severe wind erosion, contributes to the generation of a large amount of particulate matter (PM) during the mineral extraction process, which affects the atmosphere in the local and surrounding urban areas. Coal dust contains a substantial amount of harmful elements, including Pb, Cr, Cd, Ni, Cu, Co, and Zn [3], and an increase in the concentration of PM leads to intensification in the toxicity of dust [4]. As a result, mining cities in the northwestern region are exposed to more intense anthropogenic disturbances and are usually more polluted. Specifically, some heavy metals and metallic elements adsorbed in the atmospheric PM can cause various diseases, including cancer [5,6,7,8]. Due to the obvious differences in the type and intensity of anthropogenic disturbances between mineral extraction areas and urban residential areas within mining cities, dust suppression measures will vary from area to area. Therefore, it is necessary to implement sub-regional and graded precision measures to prevent and control pollution within each city.
Studies have shown that PM levels are closely related to the urban environment, depending on the land use, built environment, and development pattern [9,10,11]. In coal mining areas, the main dust sources are operations such as blasting, mining, transport, loading, and unloading [12], whereas, in residential areas, dust sources are more complex and are associated with both natural and anthropogenic emissions. The latter include industrial and traffic emissions, biomass burning, coal combustion, etc., and they are usually considered more hazardous. Thus, air pollution characteristics vary in different functional areas within cities, and these differences are mainly reflected in the spatiotemporal distribution of PM concentrations, chemical composition, and pollutant sources. Exploring the characteristics of PM in different functional areas could assist in developing graded prevention and control measures in local sub-regions. The implementation of these measures can be further supported by comparing the magnitude of pollution among regions and at different times within the same region. Moreover, the coupling effects of particles can occur between regions under the influence of meteorological conditions, affecting the spatiotemporal distribution of PM and the intensity of pollution in specific areas. Therefore, the identification of the above coupling effects can support and improve the combined application of prevention and control measures in different local functional areas at the sub-regional scale. At present, research on air quality is mostly conducted from the perspective of meteorology and ecology, focusing on pollution processes and pollutant composition. Research on the spatial and temporal distribution of pollutants, source analysis, and impact on human health has advanced, but most studies focus on megacities [6,7,13,14], and more heavily polluted cities (such as mining cities) have not been sufficiently investigated [15,16]. Moreover, current research has mostly concentrated on pollution moving between regions over long distances in revealing the coupled effects of inter-regional pollutants [17,18]. However, the interaction of pollutants within a small region and the coupling mechanism of PM between different functional areas over short distances have not been elucidated, especially in areas characterized by complex geographical environments.
This study monitored the pollution of three different functional areas (i.e., urban, mining, and sandy areas) in Wuhai, a typical mining city in Inner Mongolia. Particulate matters, i.e., PM1 (atmospheric dynamic equivalent diameter ≤ 1 μm), PM2.5 (atmospheric dynamic equivalent diameter ≤ 2.5 μm), PM10 (atmospheric dynamic equivalent diameter ≤ 2.5 μm), and TSP (total suspended particulate), were sampled both in the daytime and at night in spring, summer, autumn, and winter, and their chemical fractions were analyzed. The objectives were to (1) compare the spatiotemporal distribution of pollutant particles in the atmosphere and their chemical components in different functional areas; (2) study the spatiotemporal correlation among different functional areas affected by air pollution; and (3) quantitatively analyze the contribution of each pollution source to atmospheric pollutants in different functional areas and seasons. The results of this study reveal the coupling effect mechanisms of different functional areas on the local atmospheric environment and provide a theoretical basis for the development of graded precision prevention and control measures against pollution within mining cities.

2. Data Sources and Methods

2.1. Study Area

Wuhai (106.82° E, 39.67° N) is a resource-based city developed by coal in the western part of the Inner Mongolia Autonomous Region. There are 9 industrial parks and more than 1000 enterprises located in and around Wuhai, with a large volume of pollutant emissions. The city’s topography is high in the east and west, low in the middle, high in the south, and low in the north, with an average altitude of 1150 m. Two narrow and low valleys are formed between Zhuozi Mountain, Gander Mountain, and Wuhu Mountain, forming a topographic pattern of ‘three mountains and two valleys’ in Wuhai City (Figure 1). It is located in a warm temperate zone, which is a continental monsoon climate area. The temperature range is −28.9 to 40.2 °C; the annual average temperature is 10.1 °C. The average annual precipitation is 159.8 mm, and the annual average evaporation is 3289 mm. Westerly and northwesterly winds are prevalent in the region. Meteorological conditions during the monitoring period for all seasons are shown in Figure S1.

2.2. Sample Collection

The selection of monitoring points was guided by the availability of electricity and the stability of the terrain for a short period of time without disruption, while combining elements such as population density, human activities, and geomorphological features. A total of 8 points were selected for sampling in an urban area, mining area, and sandy area in Wuhai City. The specific distribution is shown in Figure 1. Detailed information regarding sampling locations and production activities is presented in Table 1. Four atmospheric integrated samplers (YR-6120 for PM1 and PM2.5, KC-6120 for PM10, and TH-150D II for TSP) were operated simultaneously at a flow rate of 100 L·min−1 to collect PM1, PM2.5, PM10, and TSP, respectively. The sampling membrane used 90 mm diameter quartz filters. Before and after sampling, the filter was weighed after being equilibrated in a desiccator for 24 h. Air samples were collected during winter (December 2020–February 2021), spring (March–May 2021), summer (June–August 2021), and autumn (September–November 2021). Samples were collected twice per day in the daytime (08:00 to 19:00 local time) and nighttime (19:00 to 08:00 local time), respectively. PM1, PM2.5, PM10, and TSP were collected as 307, 304, 299, and 298 samples, respectively.

2.3. Chemical Analysis

During the sampling period, inductively coupled plasma optical emission spectrometry (ICP-OES, Model 5100, Agilent, Santa Clara, CA, USA) was used to measure the heavy metal contents in PM1, PM2.5, PM10, and TSP, including Al, Ba, Fe, Mg, Sr, Ti, Zn, Cr, Cu, Mn, Pb, and Sn. Ion chromatography (ICS-900, Thermo, Waltham, MA, USA) was used to measure the water-soluble ions, including Ca2+, Mg2+, Na+, K+, F, Cl, NO3, and SO42−. The specific detection methods refer to HJ 777-2015 [19], HJ 800-2016 [20], and HJ 799-2016 [21], including detection limits, method accuracy, and other contents.

2.4. Source Identification Methods

2.4.1. Positive Matrix Factorization

Positive matrix factorization (PMF) is a receptor model based on factor analysis. It has been widely applied in the source apportionment analyses of persistent toxic substances in atmospheric aerosols, soils, and sediments [22,23]. In this experiment, we used the PMF model to apportion the pollution sources of 11 metal elements and 7 water-soluble ions in particulate matter. The specific sources of the different chemical components are shown in Table S1. The detailed principles of the PMF model are described in Supplementary S1 [24,25].

2.4.2. Air Mass Dispersion Analysis

The backward trajectory calculations generated by the HYSPLIT4 model can reveal the potential sources of atmospheric particulate matter under the assumption that pollutants are transported along with air masses. In this study, Wuhai City was selected as the receptor point of the backward trajectory. MeteoInfo software (http://www.meteothink.org/), based on the HYSPLIT4 model developed by the Chinese Academy of Meteorological Sciences [26], was used to simulate the daily backward trajectory of air masses in Wuhai City every six hours from 0:00 each day. The trajectory was extended backward for 72 h for the simulation periods in winter (December 2020–February 2021), spring (March–May 2021), summer (June–August 2021), and autumn (September–November 2021). The simulated altitude was 500 m, which represents the effect of pollutant transport above the inversion layer and optimizes the simulated effect [27,28]. GDAS meteorological data with a spatial resolution of 1° × 1° was provided by the U.S. National Center for Environmental Prediction.

2.5. Risk Assessment

To identify the effects of toxic metallic elements on human health, this study evaluated carcinogenic risk (CR) and non-carcinogenic risk (HQ). The detailed calculations of CR and HQ are described in Supplementary S2 [24,25].

3. Results

3.1. Distribution of PM Concentrations in Different Functional Areas

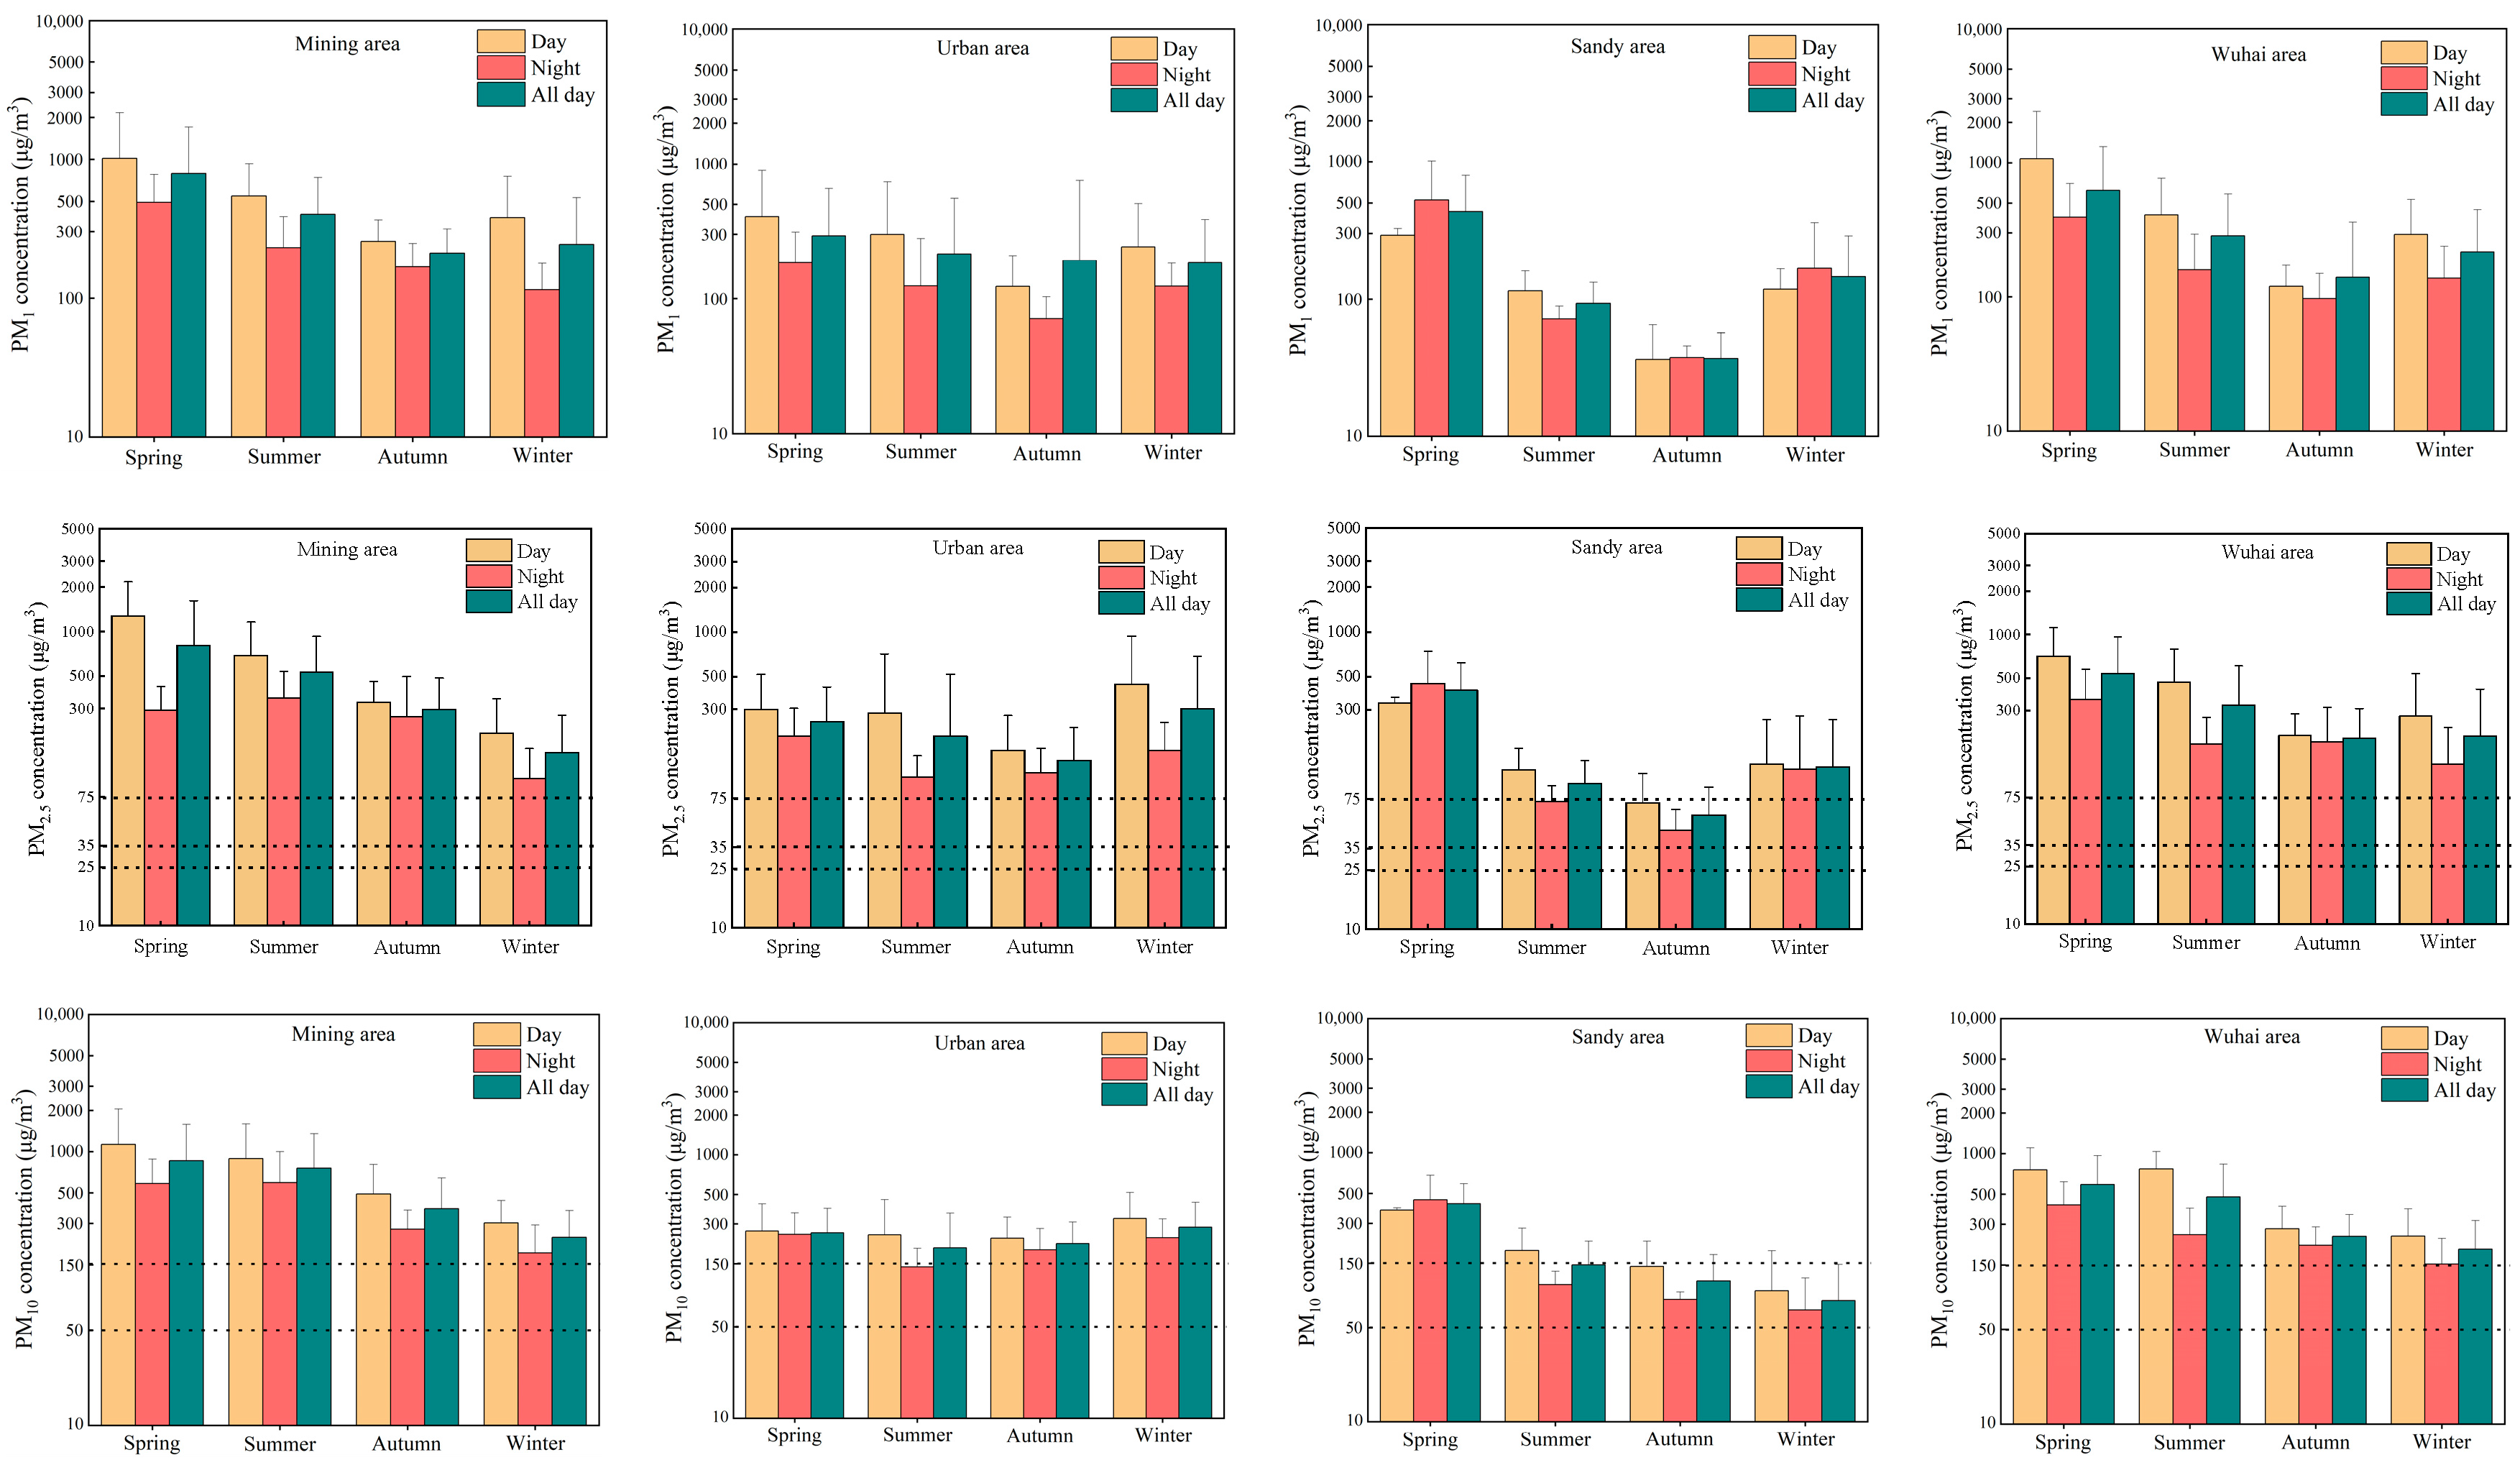
In the whole Wuhai area, the average daily concentrations of PM were higher in spring and summer than in autumn and winter (Figure 2). Specifically, PM2.5 and PM10 concentrations were well above the World Health Organization (WHO) standard (25 and 50 µg m−3 for PM2.5 and PM10, respectively; 24 h average) [29] and were 2.5–4.3 and 1.3–3.9 times higher than the Level II limit values set by the standard for the Daily Average Concentration Limit (DACL) of China (GB3095-2012) (75 and 150 µg m−3 for PM2.5 and PM10, respectively; 24 h average) [30], respectively. The TSP concentration was 1.2–3.3 times higher than the DACL (China) (300 µg m−3; 24 h average) in spring and summer and lower than this limit in autumn and winter. Similar patterns were observed for PM concentrations in the urban and mining areas, while values in the sandy area were generally higher in spring and winter than in summer and autumn. At the same time, PM concentrations in the whole Wuhai area and in its different functional areas were lower at night than during the day.
In addition, the distribution of PM concentrations varied among the three functional areas. The average daily concentrations of all PMs across seasons showed a general pattern, i.e., mining area > urban area > sandy area, except for PM1, PM2.5, PM10, and TSP in spring (mining area > sandy area > urban area) and PM2.5 and PM10 in winter (urban area > mining area > sandy area). The daily average concentrations of PM2.5, PM10, and TSP in the mining area were 2.0–10.7, 1.6–5.7, and 1.5–4.4 times higher than the DACL (China), respectively, in all seasons. Similarly, in the urban area, these concentrations were 1.8–4.1, 1.3–1.9, and 1.1–1.3 times higher than the DACL (China), respectively, in all seasons. In contrast, in the sandy area, the values were below the national secondary standard in summer and autumn.

3.2. Distribution of the Chemical Composition of PM in Different Functional Areas

3.2.1. Elemental Distribution

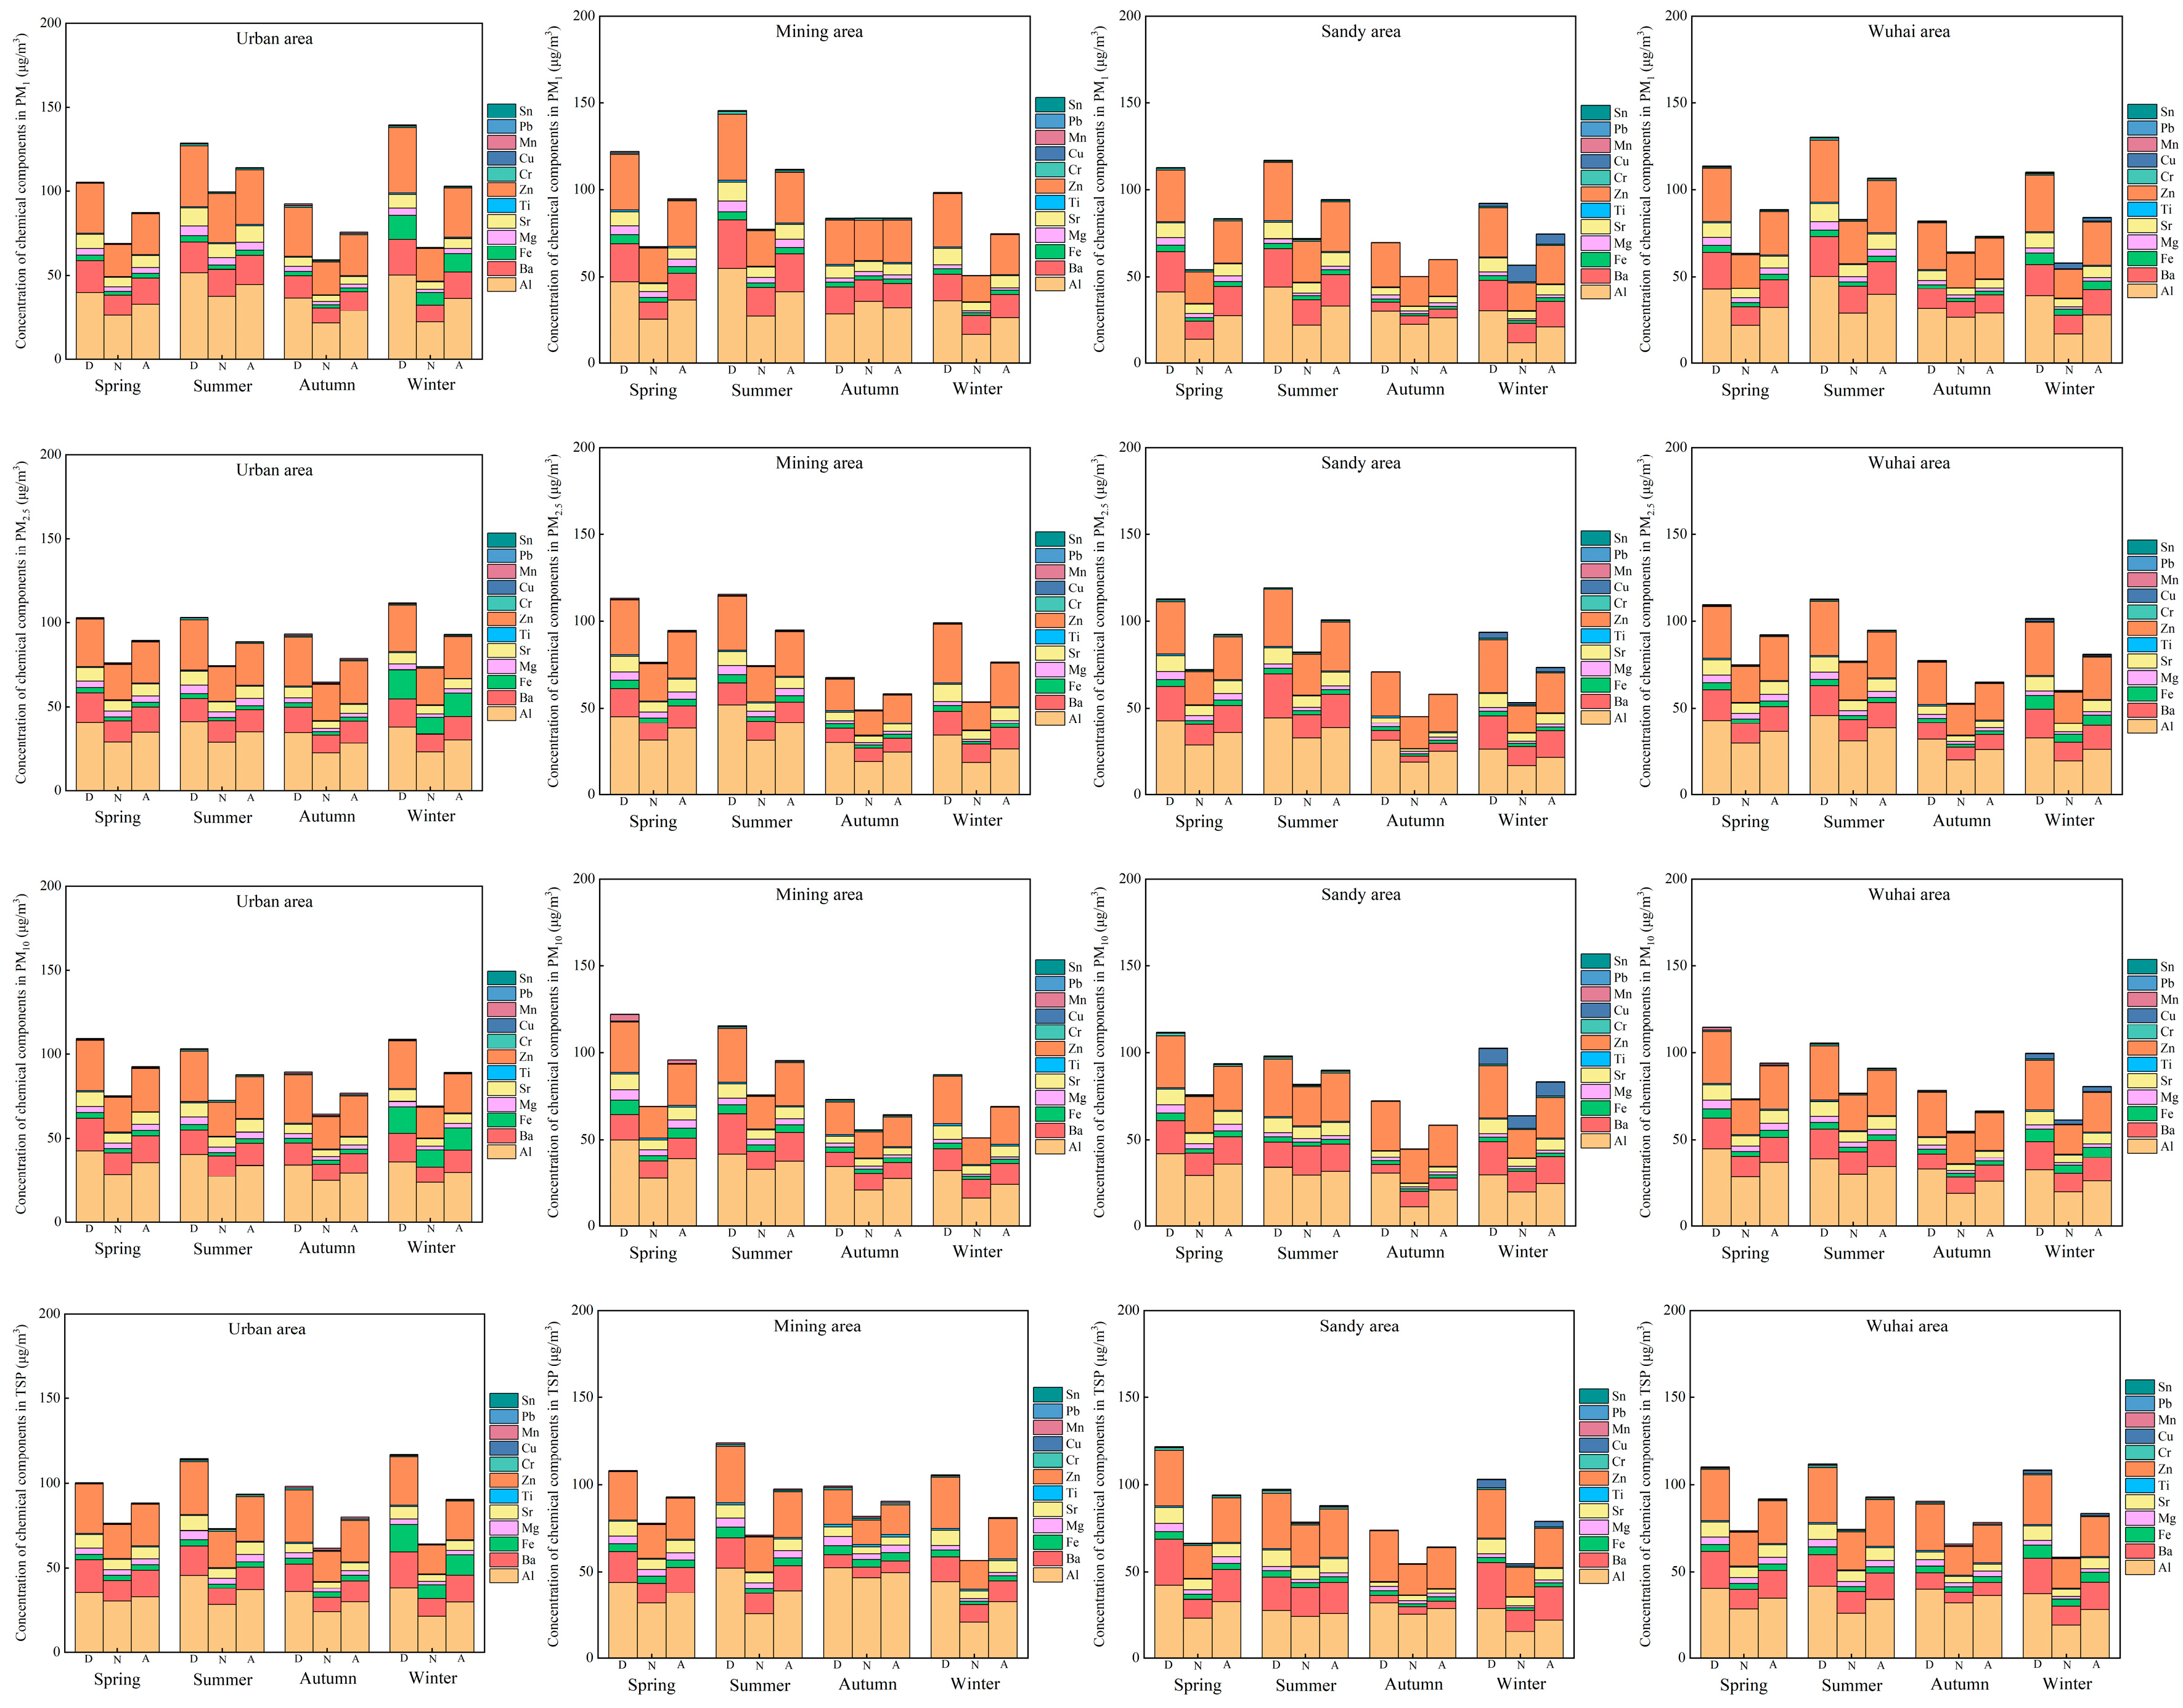
The main elements in the atmospheric PM detected in the different functional areas of Wuhai were Al, Ba, and Zn, which accounted for about 80% of the total elements, followed by Fe, Mg, and Sr, which accounted for about 15% of the total elements, and Ti, Cr, Cu, Mn, Pb, and Sn generally account for minor proportions (Figure S2). The concentrations of these elements in Wuhai and in three functional areas varied in time (Figure 3). The daily mean concentrations in PM1, PM2.5, PM10, and TSP were generally higher in spring and summer than in autumn and winter, and the concentrations of all the elements were generally lower at night than during the day. Those of Al, Ba, and Zn in different functional areas varied slightly, suggesting that these pollutants may be derived from similar sources. However, the distribution of some elements varied spatially: Fe and Cu concentrations were significantly higher in the urban and sandy areas, respectively, than in other areas during winter.

3.2.2. Distribution of Water-Soluble Ions

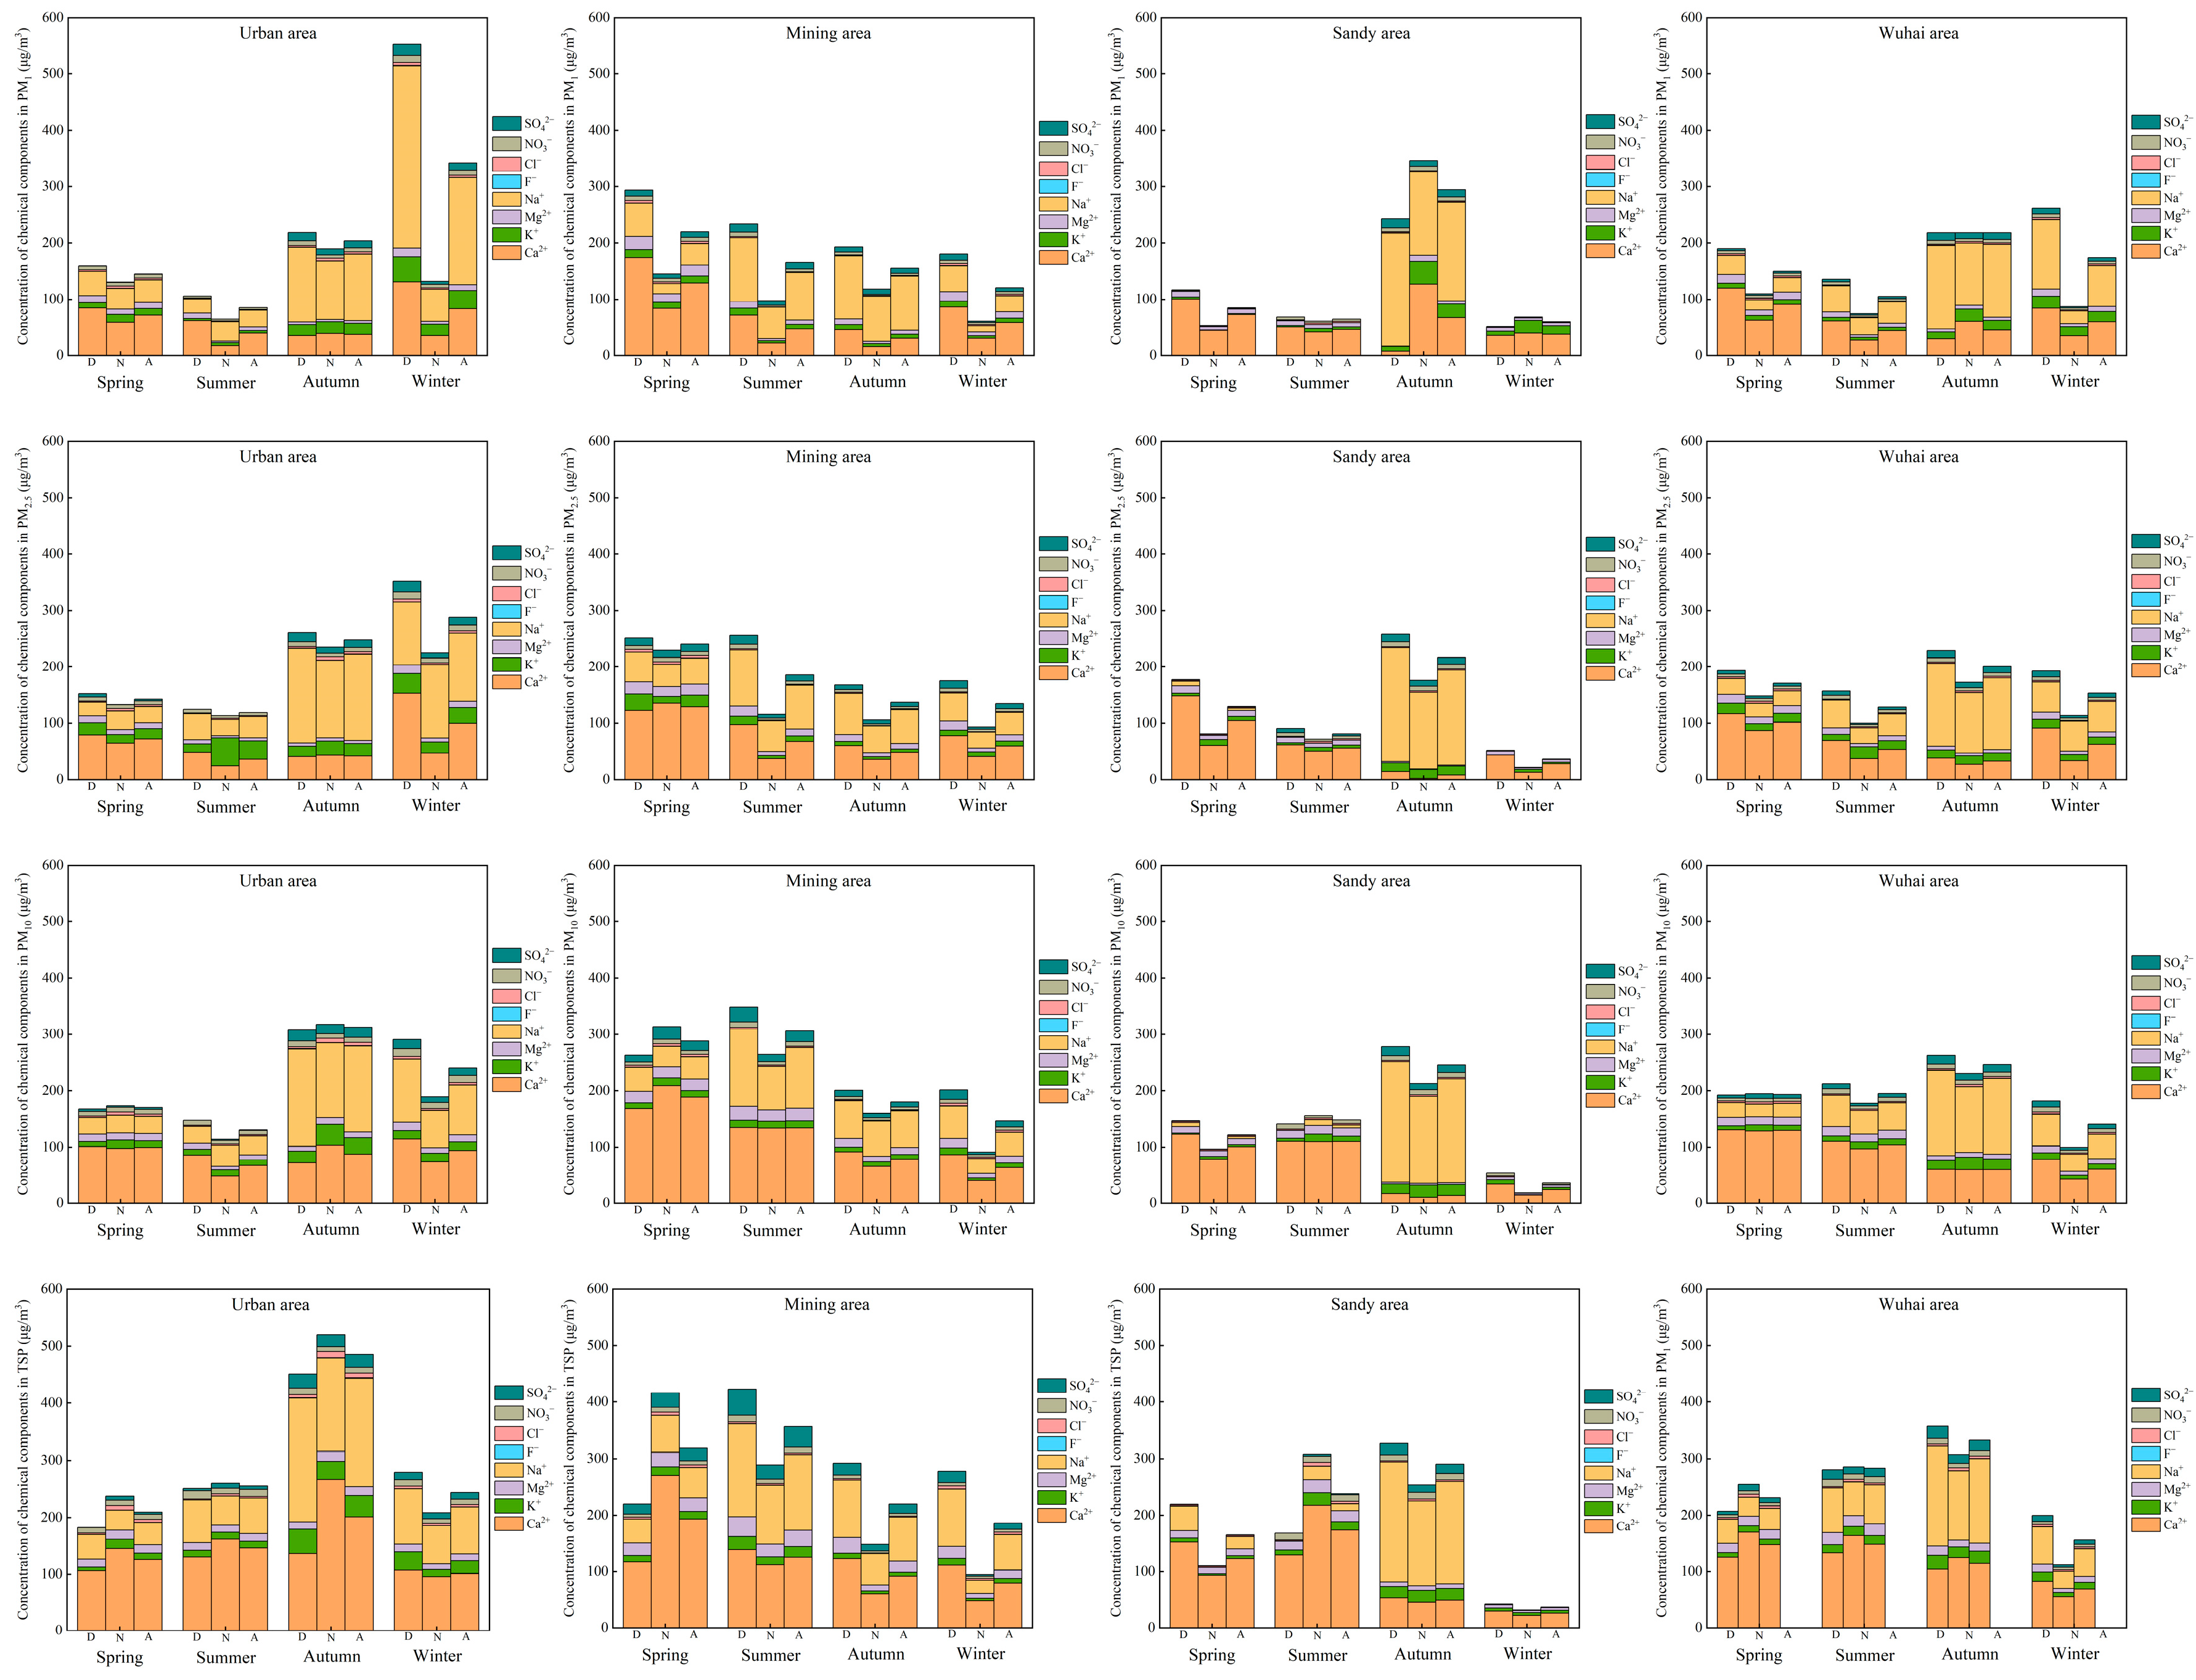
The main water-soluble ions in the atmospheric PM in the different functional areas were Ca2+ and Na+ (Figure S3). The highest concentrations of these two ions were detected in spring and autumn, respectively (the latter being lowest in spring) (Figure 4). The concentrations of water-soluble ions were generally lower at night than during the day and also showed a specific spatial distribution. Generally, the pattern for the Ca2+ concentrations in PM with different particle sizes was mining area > sandy area > urban area in spring and summer, and urban area > mining area > sandy area in winter. The spatial distribution of the Ca2+ concentrations in PM with different particle sizes varied considerably in autumn. Specifically, the Ca2+ concentrations in PM1 in the sandy area were about twice as high as those in the urban and mining areas. However, the concentrations of PM2.5, PM10, and TSP in the urban and mining areas were about 2–6 times higher than those in the sandy area. Generally, the Na+ concentrations in spring and summer were higher in the mining area than in the urban and sandy areas (in this order), with values in the latter reaching almost zero. In autumn, the Na+ concentrations were significantly higher in the sandy area than in the other two areas. However, in winter, the values were again minimal in the sandy area, and they were higher in the urban area than in the mining area. In terms of other ions, the K+ concentrations were significantly higher in the urban and sandy areas than in the mining area, and in coarse PM (PM10 and TSP), the concentration of SO42− was slightly higher in the mining area than in the urban and sandy areas.

3.3. Spatiotemporal Correlation and Effect of PM Concentrations

3.3.1. Correlation Among PM Concentrations in Different Functional Areas

Correlation analysis revealed that the interactions between the fine PM concentrations (PM1 and PM2.5) in different functional areas were prevalent and varied seasonally (Figure S4). PM pollution in the mining area was significantly correlated with that in the urban and sandy areas in spring and autumn, respectively. Significant correlations were also found among pollution levels in the mining, urban, and sandy areas in both summer and winter.

3.3.2. Correlation Between PM Concentrations During the Day and at Night

Correlation analysis showed a significant positive correlation between daytime and nighttime PM concentrations, with the latter increasing as the former did (Figure S5). At the same time, significant diurnal concentration correlations were prevalent in PM1, PM2.5, and PM10 (but not TSP). In addition, there was a correlation between particle sizes, indicating similar variations in the concentration of differently sized PMs and pollutant sources.

3.3.3. Effects of PM Concentrations in Different Functional Areas

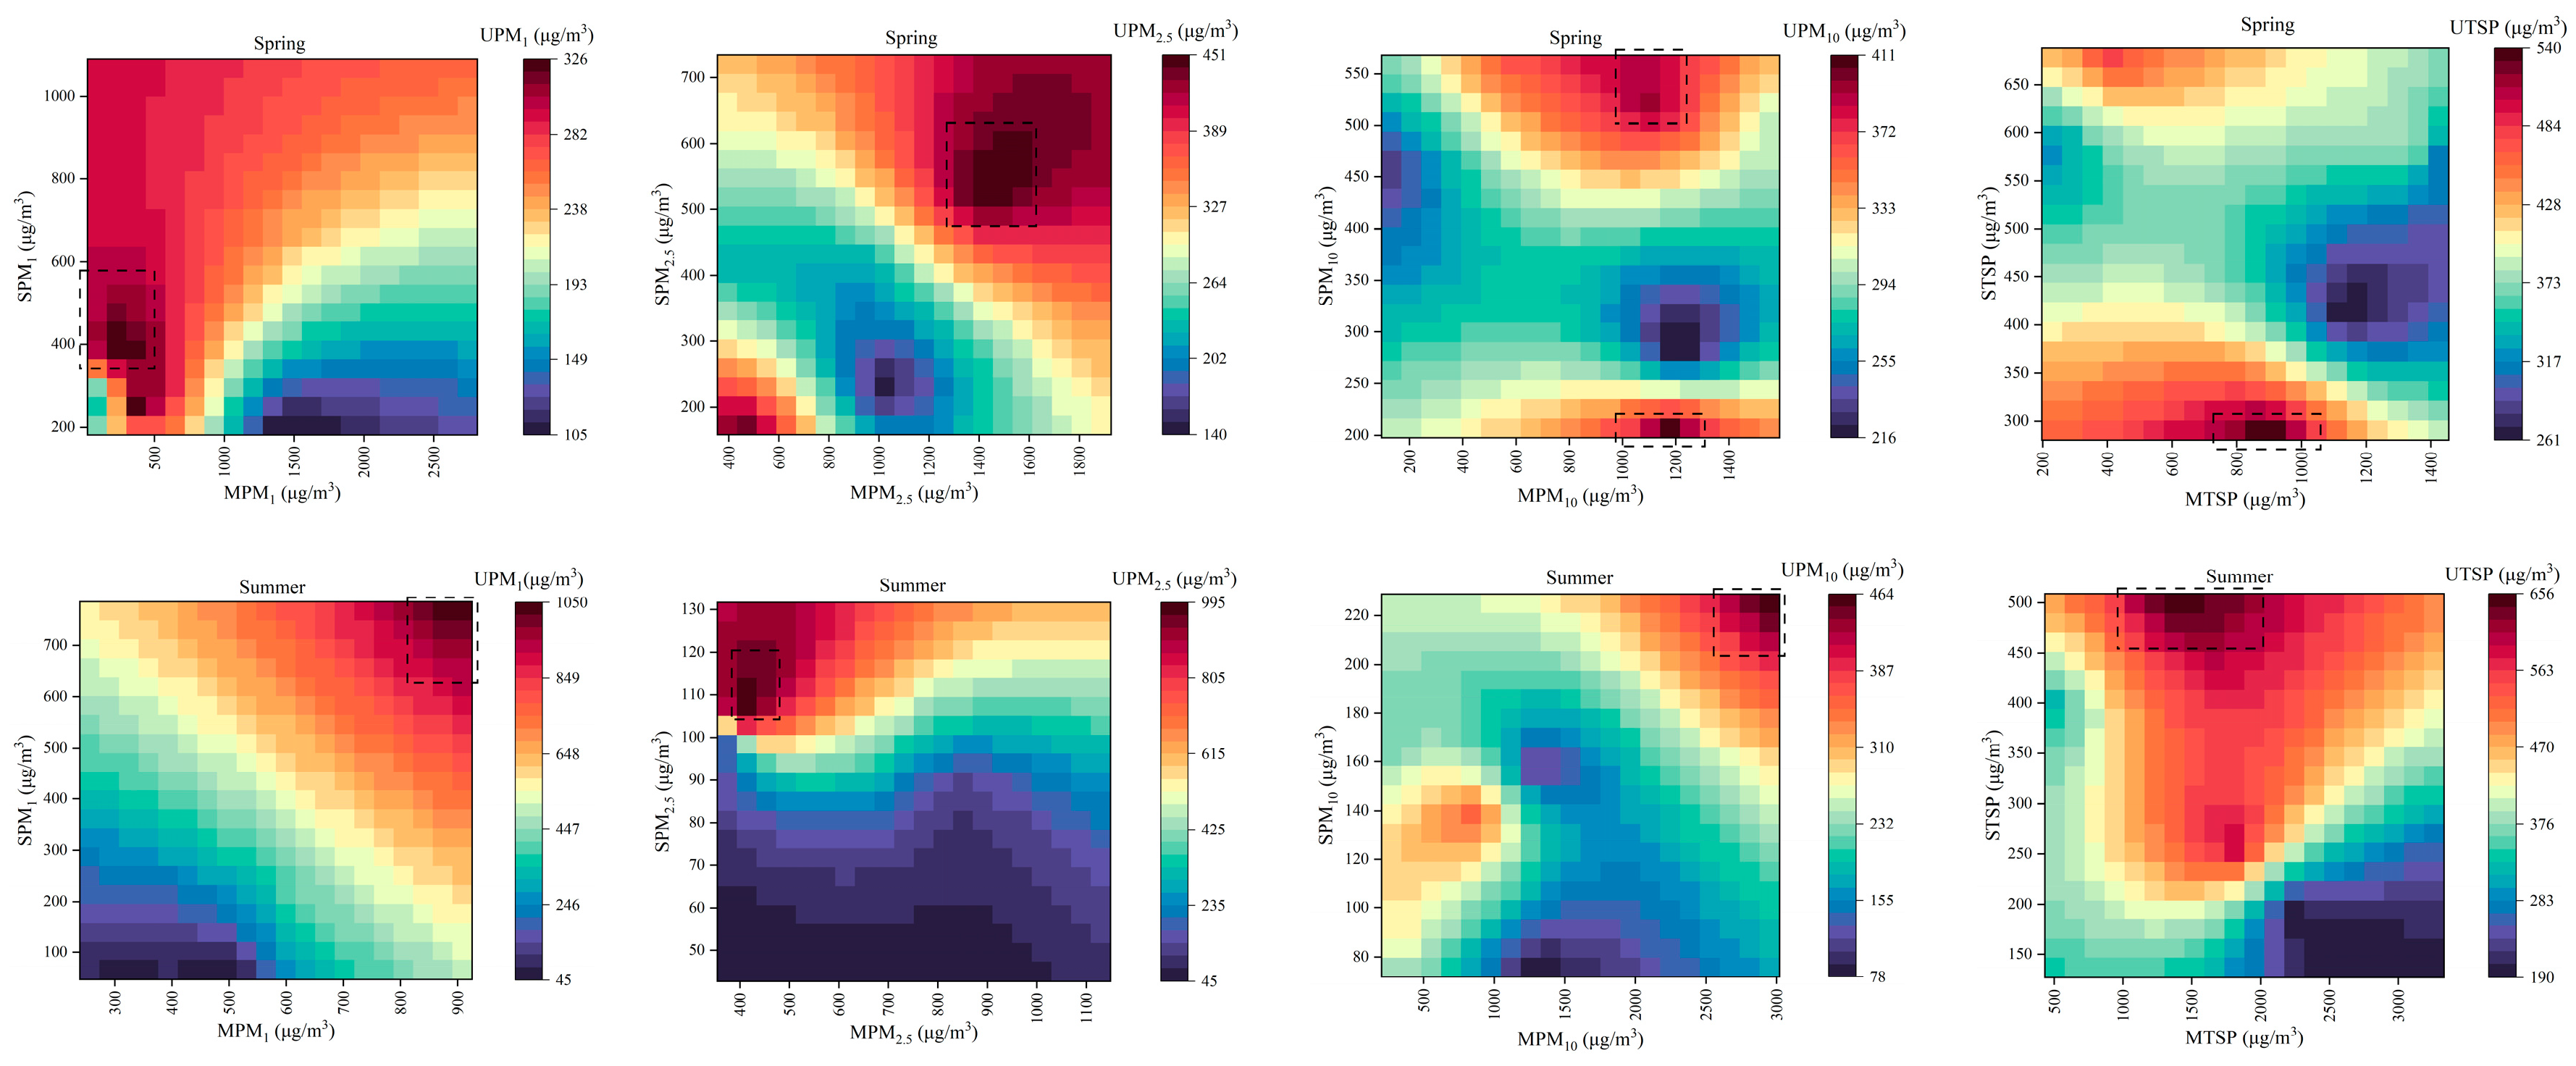
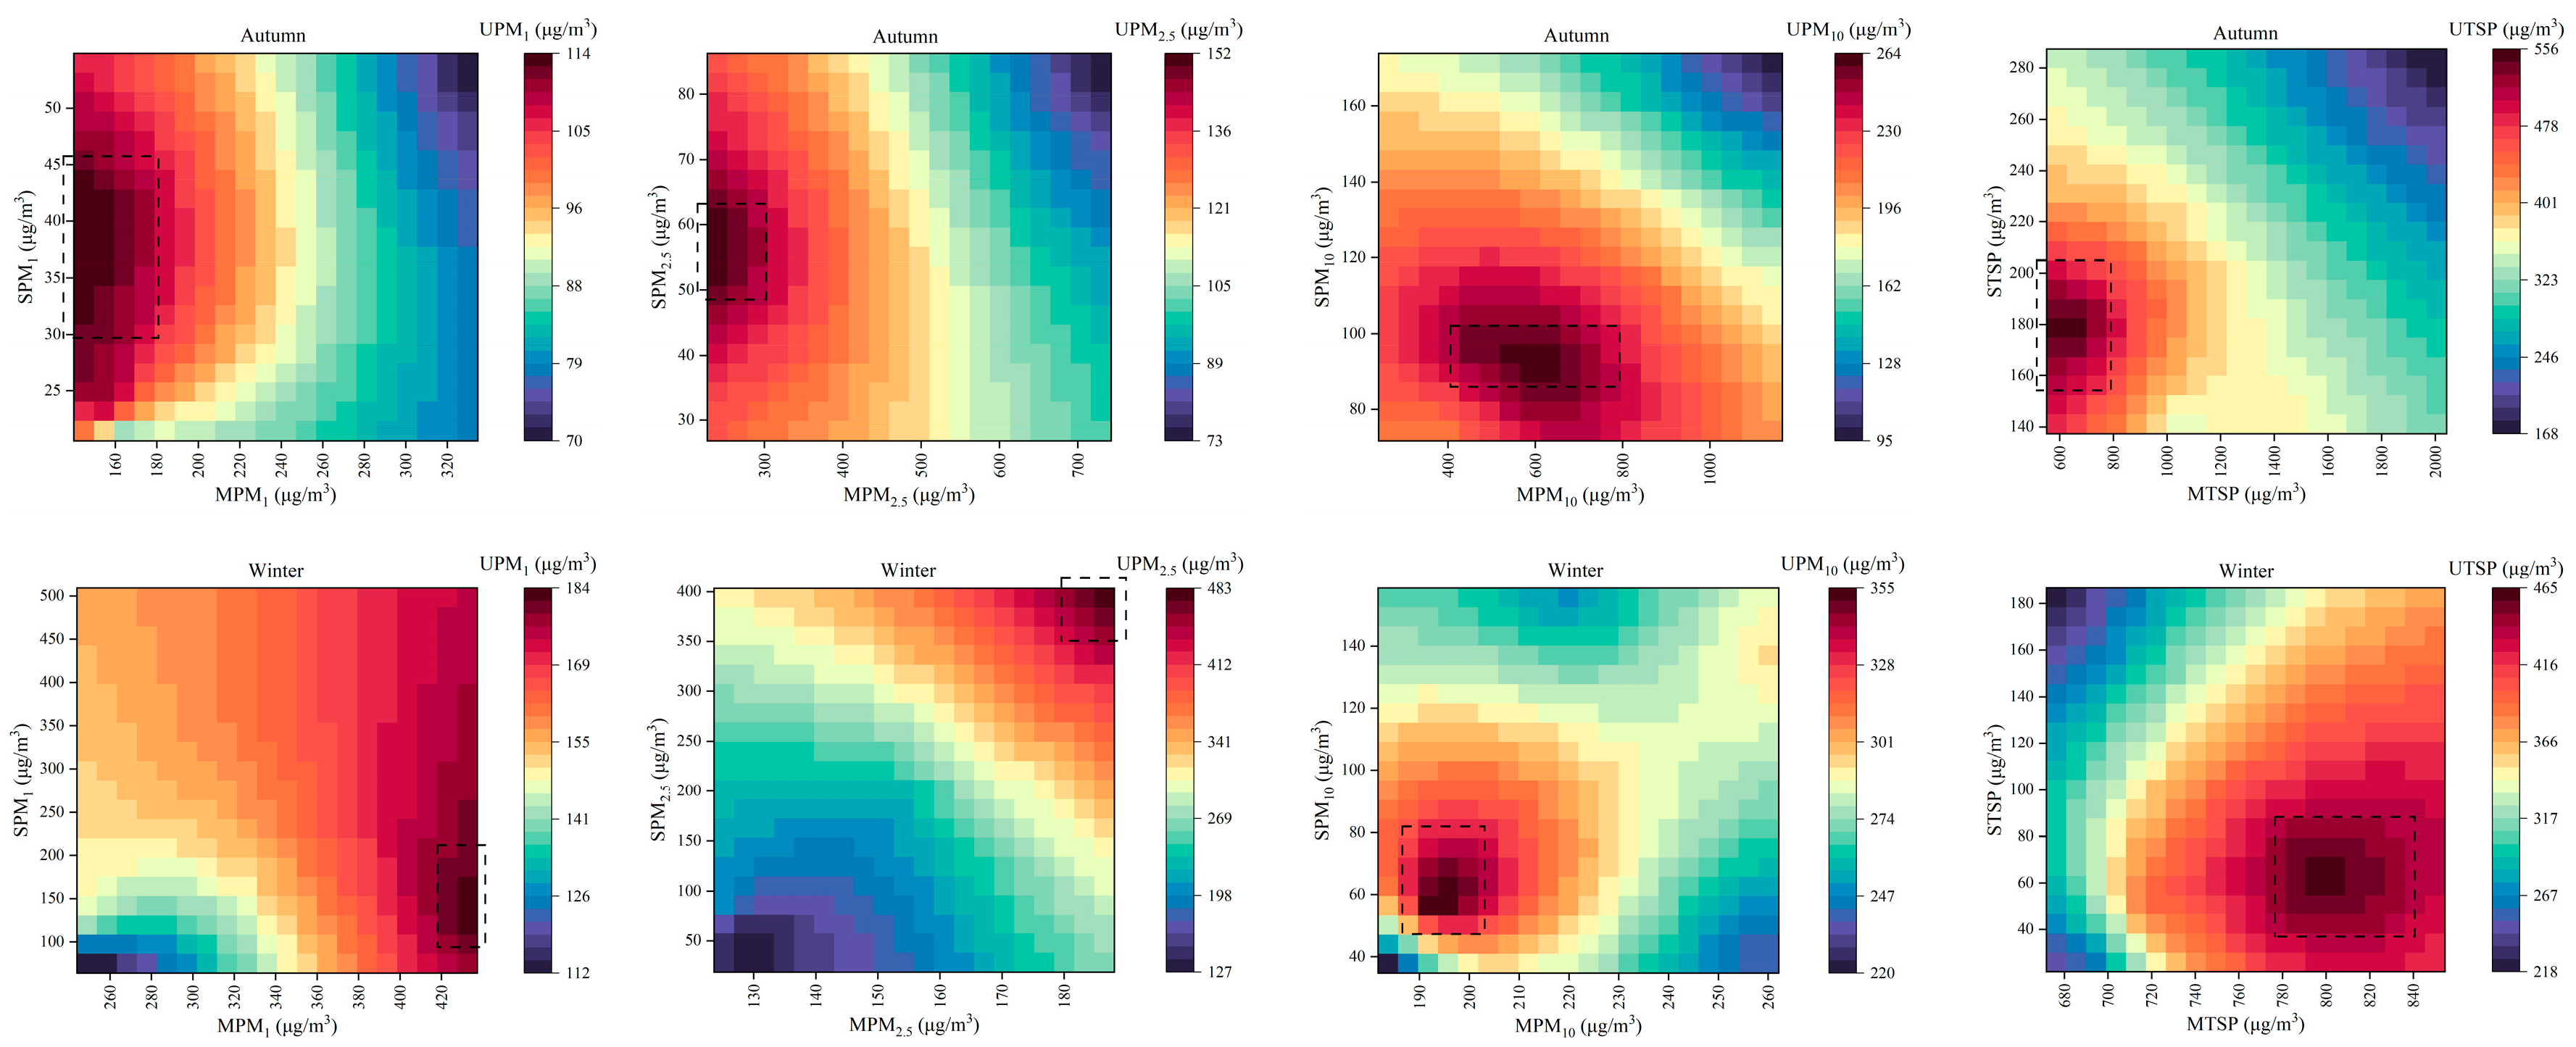
Kriging analysis was used to investigate the impact of variable PM concentrations in the mining and sandy areas on urban air quality. The heatmap in Figure 5 showed that PM concentrations in urban areas did not simply increase or decrease as those in the mining and sandy areas did, except for the obvious increasing trend observed for PM1 in summer and PM2.5 in winter. Instead, it seemed there was a threshold range (shown in the box in Figure 5) within which urban concentrations were the highest. Table S4 showed the specific seasonal concentrations of PM in the mining and sandy areas associated with a greater impact on the urban area. In general, this area was affected the most when specific ranges of high PM concentrations were detected in the mining area (i.e., 140–500, 225–1600, 190–3000, and 600–2000 µg m−3 for PM1, PM2.5, PM10, and TSP, respectively) and specific ranges of low PM concentrations were detected in the sandy area (i.e., 30–600, 50–600, 45–550, and 40–500 µg m−3 for PM1, PM2.5, PM10, and TSP, respectively). These results indicated that, compared to the sandy area, the mining area had a greater impact on air quality in the urban area. At the same time, the difference in the threshold range for PM1 concentrations between the mining and sandy areas was small compared with the values for other particle sizes, suggesting that the above-mentioned pattern was more apparent in PM2.5, PM10, and TSP, which consist of larger particles. Moreover, concentration ranges were higher in spring and summer than in autumn and winter, suggesting that the impact of PM on the urban area might be greater in the former two seasons.

3.4. Analysis of Pollutant Sources

3.4.1. Source Apportionment Using PMF

In this study, five main pollutant sources with the most interpretable profiles and minimal Q values were identified. The source profiles and percentage contributions of each chemical component obtained from the PMF model are shown in Figures S6 and S7. In general, five factors (numbered 1–5) contained high proportions of the following pollutants: (1) Ca2+ and Mg2+, which are associated with dust sources; (2) Cr, Pb, and Sn, which usually derive from industrial emissions; (3) Cu, which is considered a traffic emission; (4) K+, Cl, NO3, and SO42−, which derive from combustion sources such as biomass burning, fossil fuel burning (oil and coal), and vehicle exhaust emissions; and (5) Na+ combined with a high proportion of Cr, Mn, Zn, K+, and NO3 in some cases; thus, it is considered to be a mixed source dominated by sea salt.
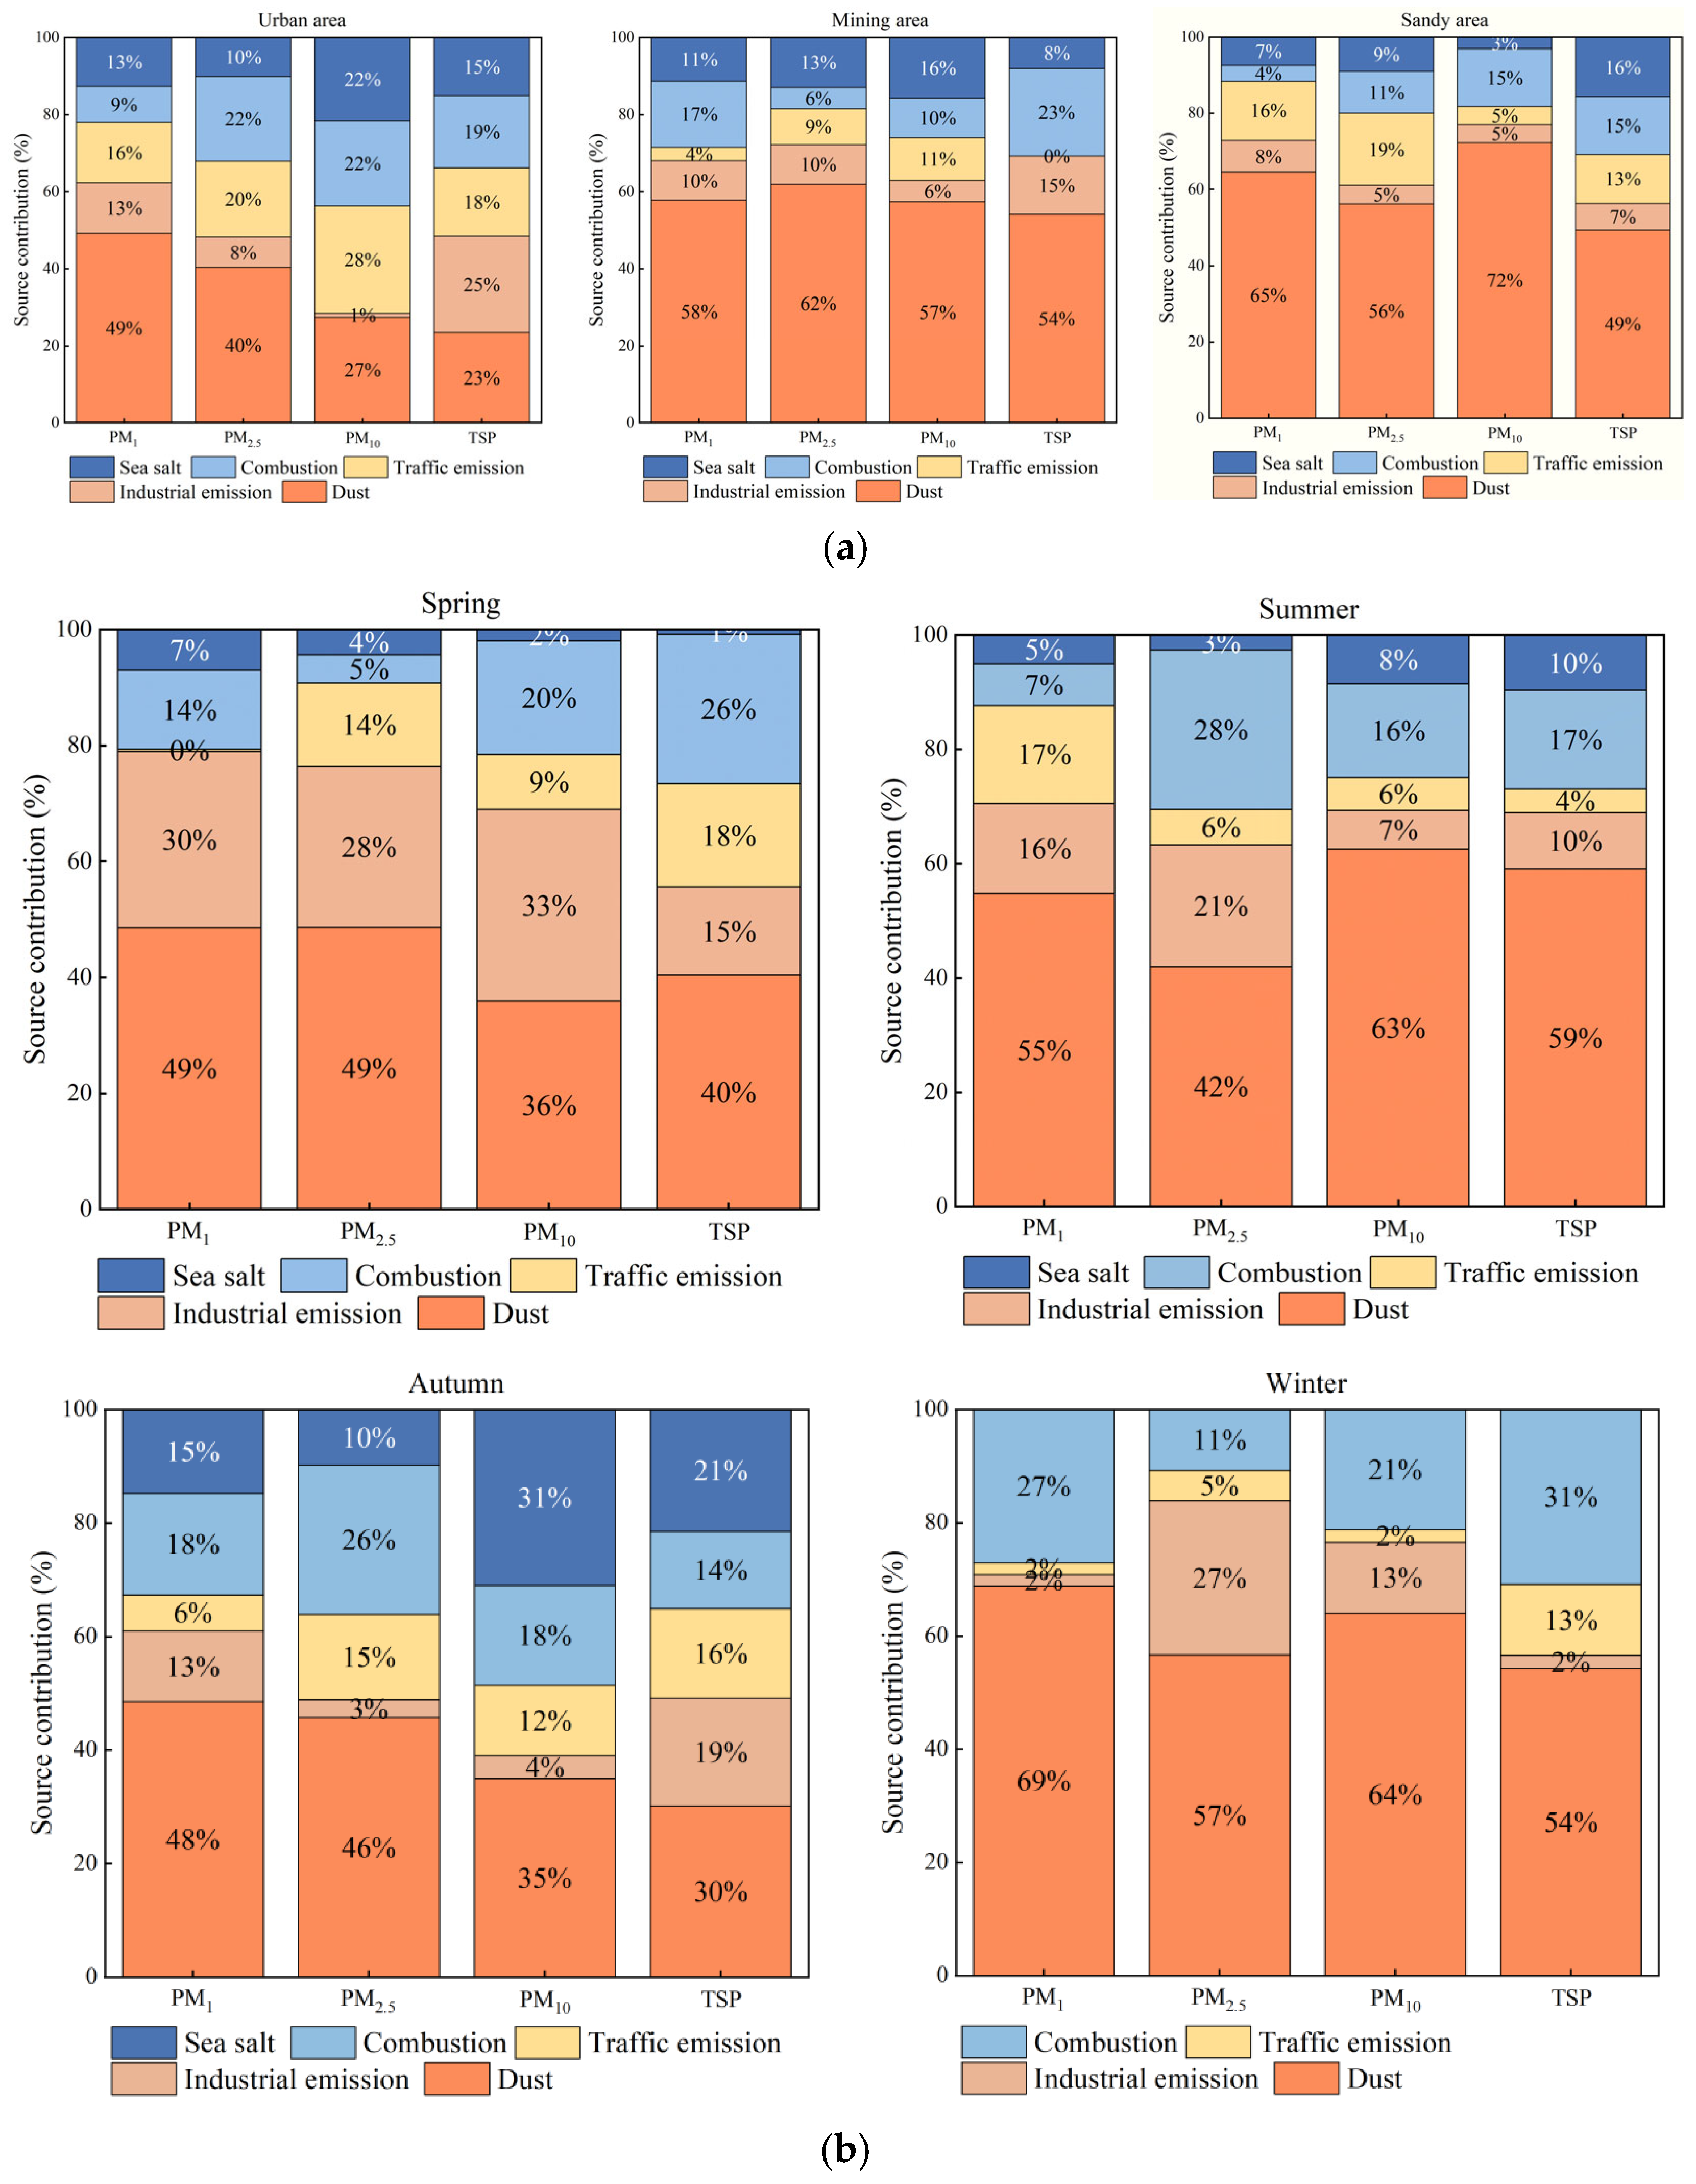
The source analysis results for different functional areas showed that the sources of pollutants were dust, industrial and traffic emissions, combustion, and sea salt, with the contribution of dust to the mining and sandy areas exceeding 50%, which was considerably higher than that to the urban area (Figure 6a). All the pollutant sources accounted for a large proportion of pollution in the urban area, particularly in terms of PM10 and TSP, with dust accounting for 27% and 23% of these pollutants, respectively, and the other sources contributing with comparable proportions, except for industrial emissions which accounted for only 1% of PM10.
These pollutant sources were also the same across seasons, except for sea salt, which was not detected in winter (Figure 6b). In general, the contribution of dust was above 50% in summer and winter, which was higher than that in spring and autumn. Industrial emissions accounted for a greater proportion in spring. The contribution from traffic emissions was generally higher in spring and autumn than in summer and winter. Combustion sources contributed equally in all seasons, but the values were slightly higher in winter, while the contribution of sea salt was significantly higher in autumn than in the other seasons.

3.4.2. Backward Trajectories Cluster

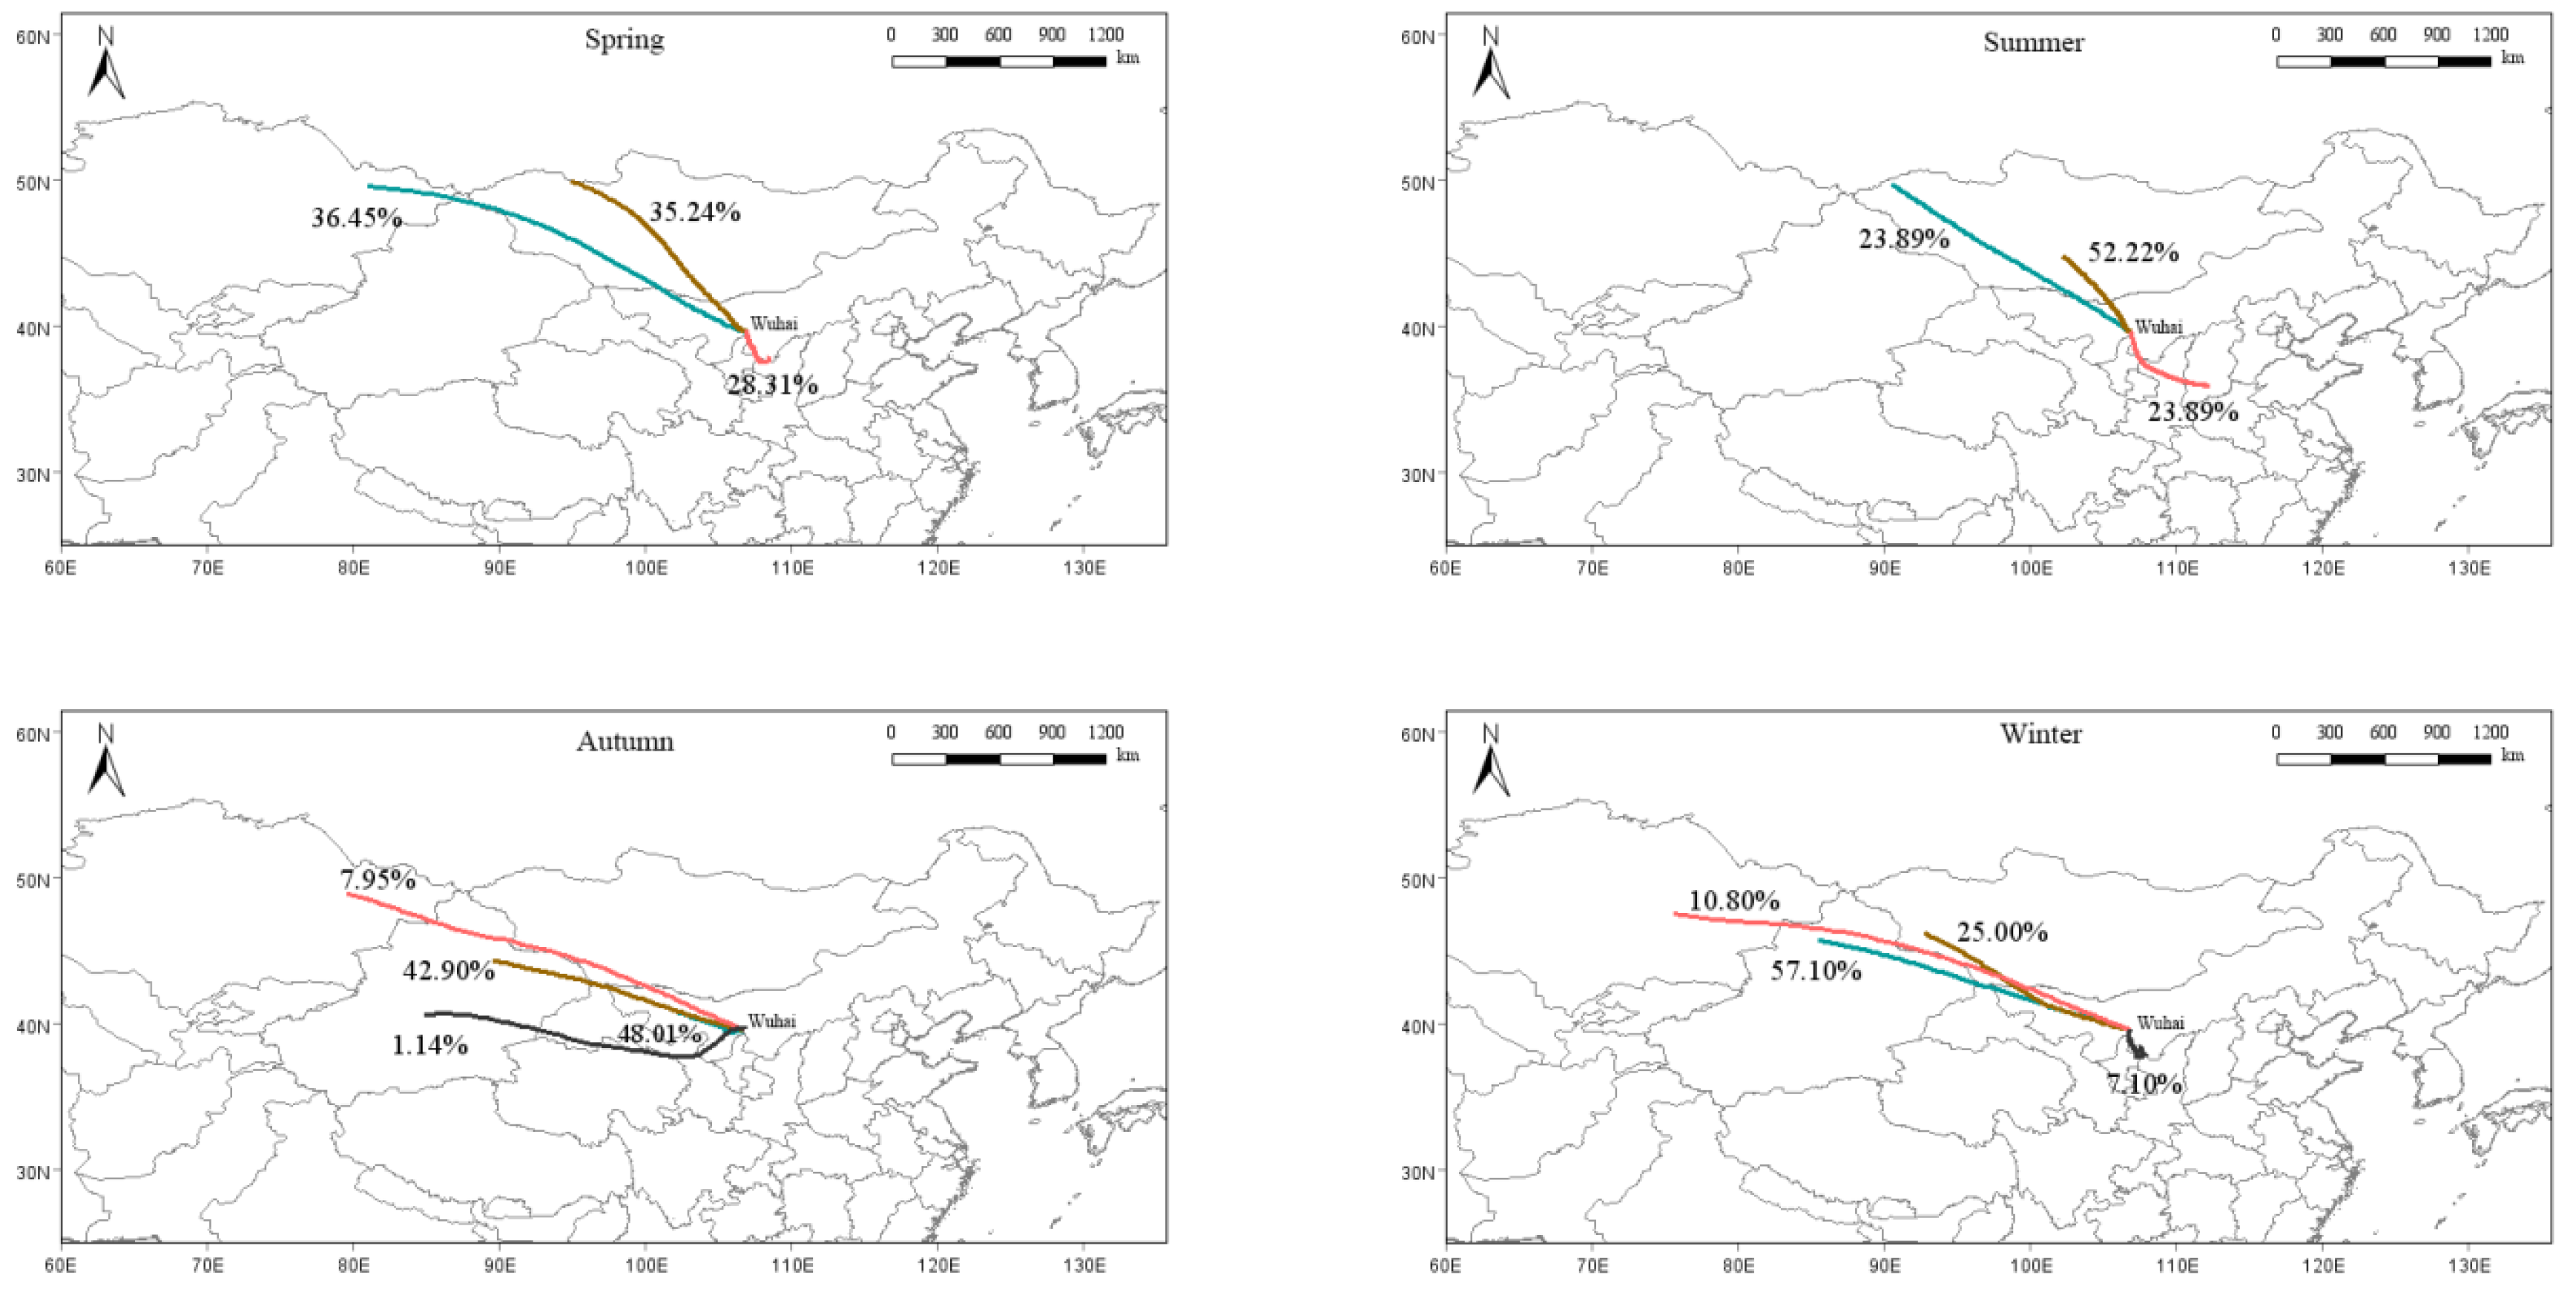
The results indicated that two airflows were dominated by long-distance transport, moving rapidly from eastern Kazakhstan (36.45%) and northwestern Mongolia (35.24%) in spring, passing through western Mongolia and western Inner Mongolia before reaching Wuhai (Figure 7). Another airflow (28.31%) originated from the border region of northern Shaanxi and Inner Mongolia, characterized by short-distance transport with a slower-moving air mass. In summer, the transport directions of airflows were similar to those in spring, but the overall transport distances were shorter. One of the longer airflows came from northwestern Mongolia (23.89%), and the other two airflows were primarily short-distance and originated from southern Mongolia (53.22%) and southern Shanxi (23.89%). In autumn, airflows mainly arrived from the northwest, with three trajectories dominated by long-distance transport from eastern Xinjiang (42.90%), southern Xinjiang (1.14%), and eastern Kazakhstan (7.95%). Another trajectory originating from western Inner Mongolia had the shortest transport distance with the highest trajectory proportion (48.01%). In winter, three airflow trajectories resembled those in autumn, with long-distance transport from the northwest, including northern Xinjiang (57.10%), western Mongolia (25.00%), and eastern Kazakhstan (10.80%). Another small portion of airflow came from the border between northern Shaanxi and Inner Mongolia (7.10%), dominated by short-distance transport.

3.5. Health Risk Assessment

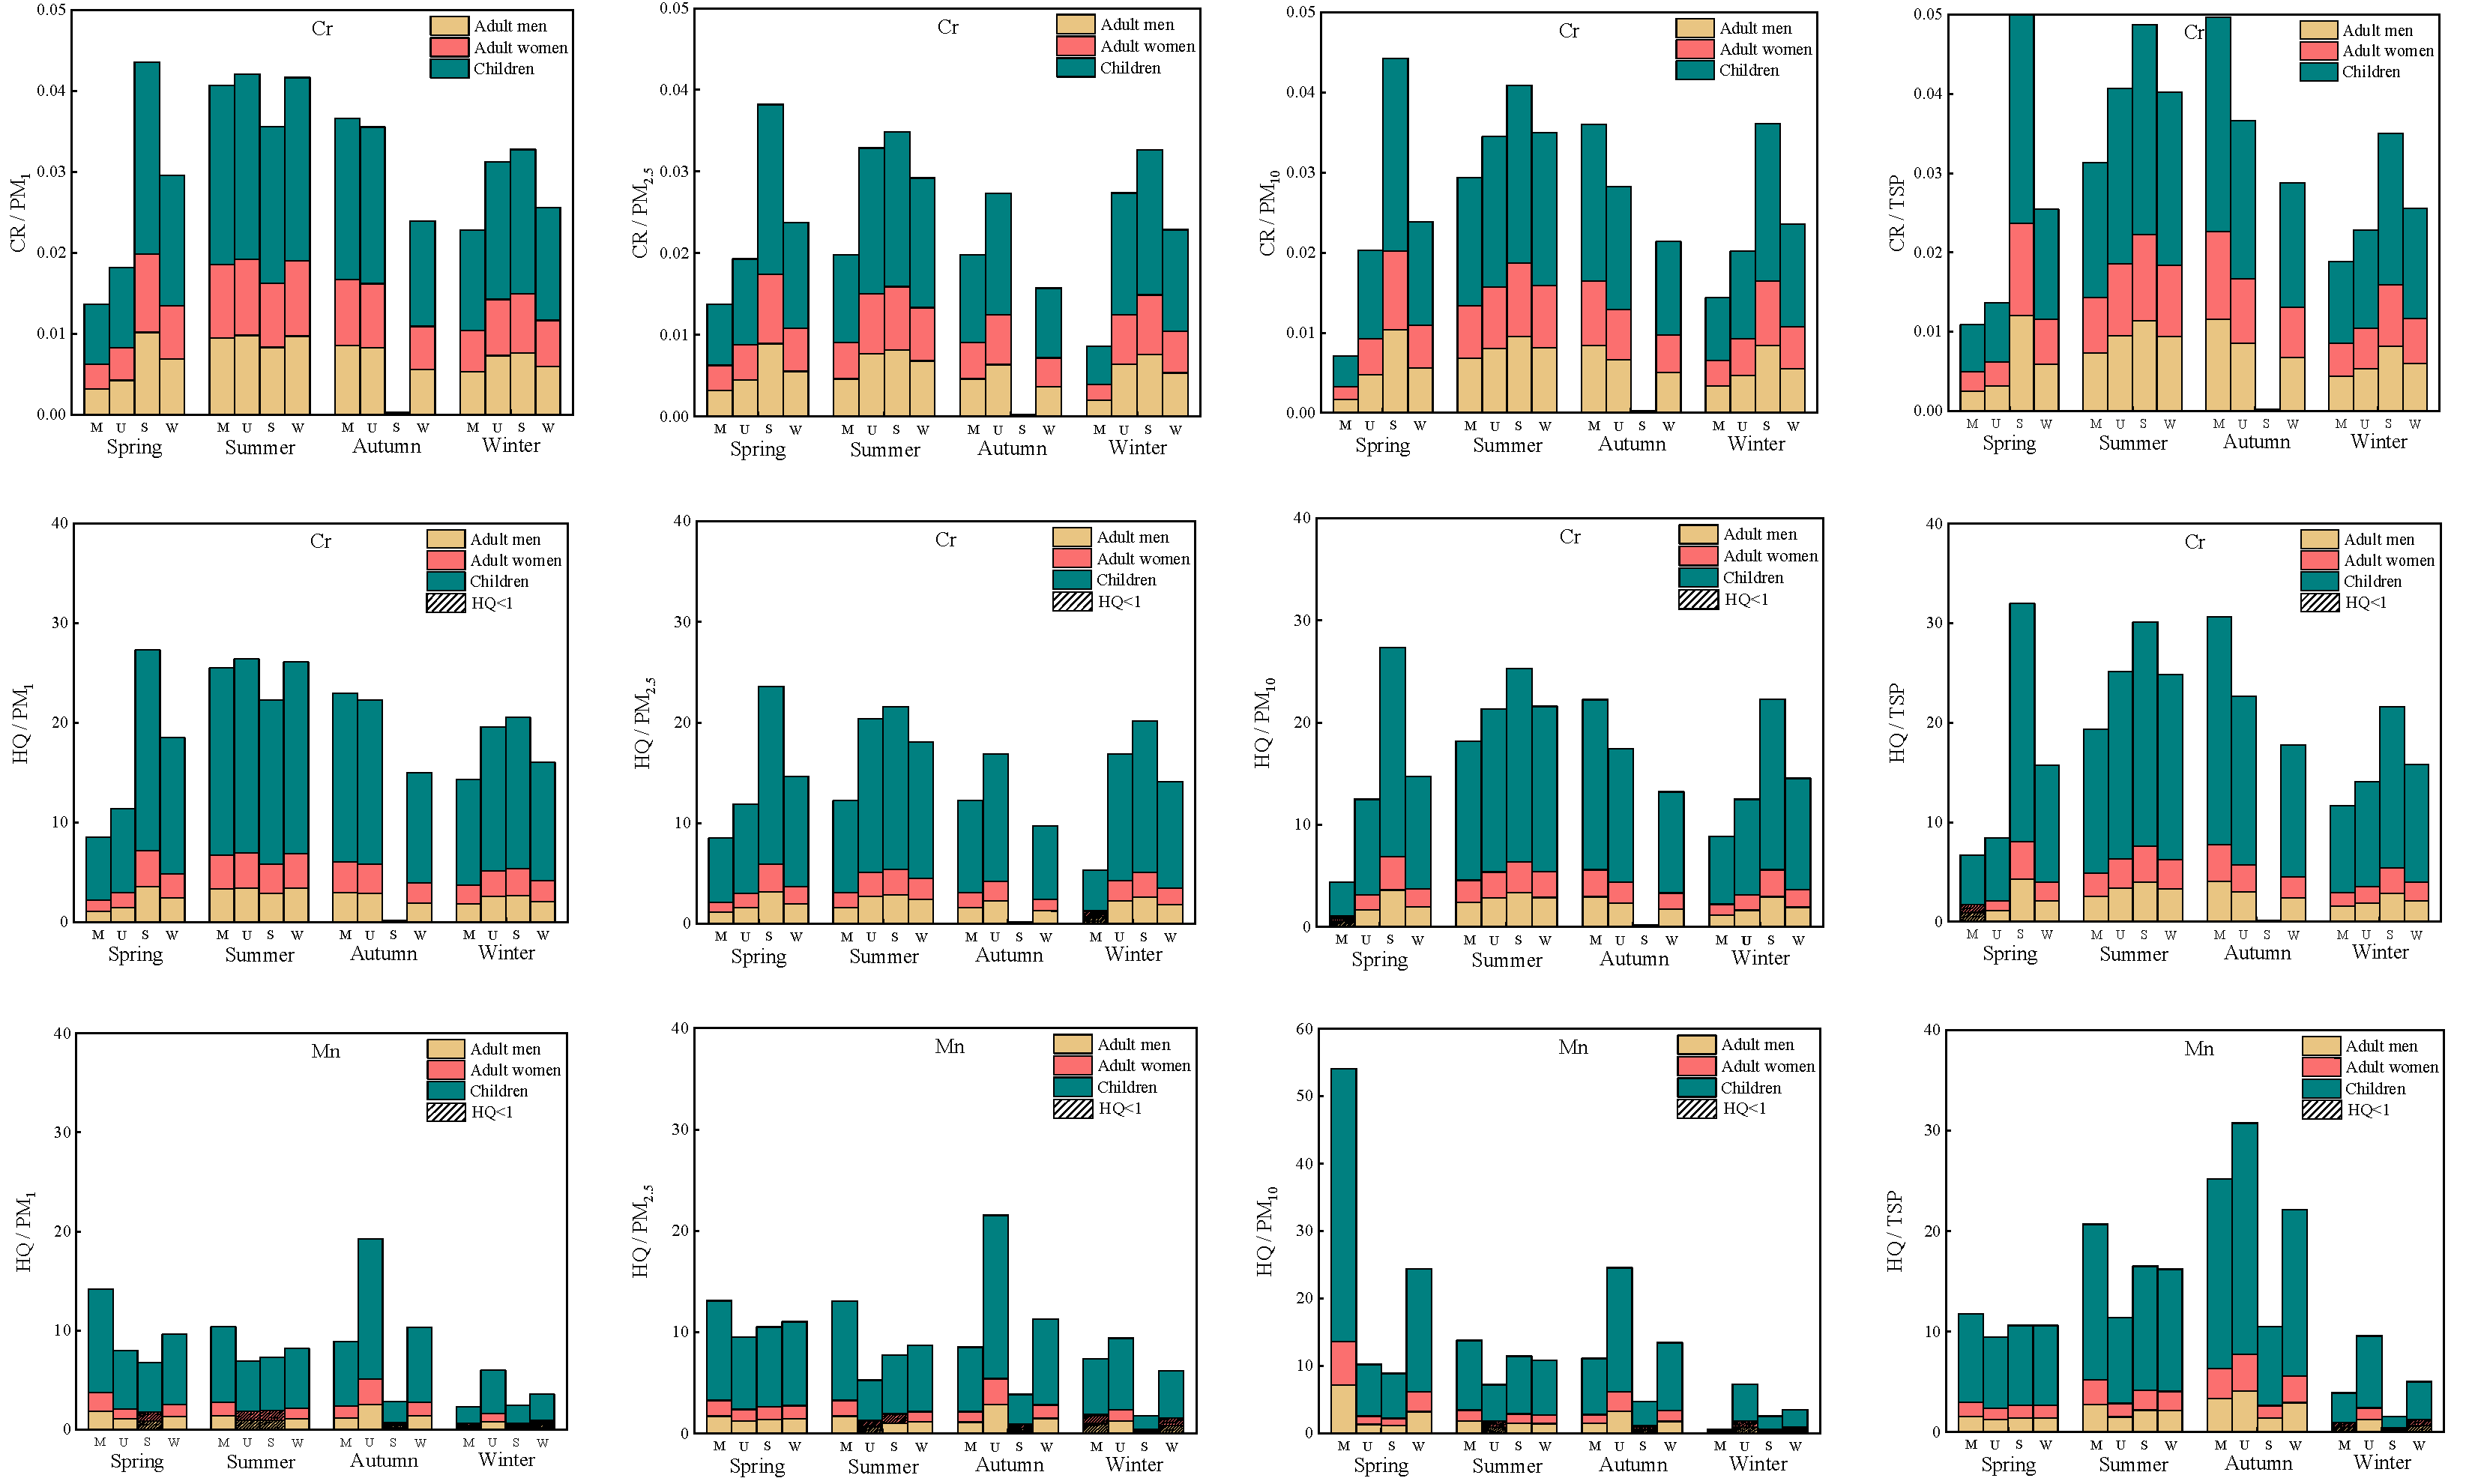
It is found that only Cr and Mn are harmful to human health through our previous research [21,22] and the analysis of the calculation results in the present study, so only these two elements are reflected in this article. The health risks posed by toxic elements to humans are shown in Figure 8. In general, in Wuhai, the carcinogenic risk associated with Cr varied in different sections of the population, being higher for children and lower for adult men and women (in this order). Specifically, the risk for children was 2.32 and 2.44 times higher than that for adult men and adult women, respectively. The non-carcinogenic risks associated with both Cr and Mn were also higher in children and lower in adult men and women; however, Mn only affected children in winter. The non-carcinogenic risk associated with Cr and Mn contained in PM1 was 5.61 times higher for children than for adult men and women, and this was similarly observed for the same pollutants in PM2.5, PM10, and TSP (the risk for children was 5.61 and 6.30 times higher than that for adult men and women, respectively). Moreover, the pattern of carcinogenic and non-carcinogenic risks for Cr in PM with different particle sizes was consistent: PM1 > TSP > PM10 > PM2.5 in spring, summer, and winter, and TSP > PM1 > PM10 > PM2.5 in autumn. The carcinogenic risk associated with Mn in PM with different particle sizes in spring showed a pattern of PM10 > PM2.5 > TSP > PM1, while it was TSP > PM10 > PM2.5 > PM1 in summer and autumn, and PM2.5 > TSP > PM1 > PM10 in winter.
The carcinogenic risk associated with toxic elements in Wuhai showed a seasonal pattern. For Cr contained in PM1, PM2.5, and PM10, the pattern was summer > spring > winter > autumn, and for Cr in TSP, it was summer > autumn > winter > spring. The carcinogenic and non-carcinogenic risks associated with Cr in Wuhai had similar seasonal patterns. The non-carcinogenic risk associated with Mn contained in PM with different particle sizes showed the following patterns: autumn > spring > summer > winter for PM1 and PM2.5, spring > autumn > summer > winter for PM10, and autumn > summer > spring > winter for TSP.
The carcinogenic risk also varied across regions. In spring, summer, and winter, the risk associated with Cr contained in PM with different particle sizes was 1.05–3.79 and 1.39–6.24 times higher in the sandy area than in the urban and mining areas, respectively. Specifically, for Cr in PM1, PM10, and TSP, the risk in autumn in the mining area was 1.03–1.36 and 135.44–186.83 times higher than that in the urban and sandy areas, respectively. For Cr in PM2.5, the risk in the urban area was 1.38 and 102.86 times higher than that in the mining and sandy areas, respectively. The non-carcinogenic and carcinogenic risks associated with Cr presented the same regional variability. In spring and summer, the non-carcinogenic risk associated with Mn contained in PM with different particle sizes was 1.24–5.27 and 1.11–6.09 times higher in the mining area than in the urban and sandy areas, respectively. In autumn and winter, the risk associated with Mn in the urban area was 1.22–11.48 and 2.48–6.85 times higher than that in the mining and sandy areas, respectively.

4. Discussion

4.1. Spatiotemporal Distribution of Atmospheric PM and Its Components

In general, PM concentrations in Wuhai were higher in spring and summer than in autumn and winter. This is due to the high winds and low humidity typical of the spring season, which can easily lift ground dust and disperse it into the atmosphere. It has been shown that PM2.5 readily absorbs moisture and grows in volume, and its concentration eventually increases when the air is relatively humid in summer [31,32]. The present study detected a correlation between different particle sizes; therefore, the concentration of PM1, PM10, and TSP may also increase with the change in PM2.5 in summer. Due to the reduced human activities at night, particle concentrations at this time were lower than those during the day. Correspondingly, the daily average concentrations of Al, Ba, and Zn in PM1, PM2.5, PM10, and TSP were generally higher in spring and summer than in autumn and winter, and both the element and water-soluble ion concentrations were lower at night due to the temporal patterns of the PM concentrations above.
The average daily concentrations of PM differed among functional areas and were generally higher in the mining area than in the urban and sandy areas (in this order) in different seasons. This is because the intense opencast mining activity in Wuhai has damaged the land surface, turning it into a source of dust when the wind is sufficiently strong. Studies have shown that dust can be airborne when wind speeds are above 3–4 m/s in hot and dry climate zones, as well as in grassland areas without vegetation during dry seasons. In other areas, dust is lifted from the ground when wind speeds are above 6–7 m/s [33]. Furthermore, opencast coal mines can produce large amounts of PM during blasting, transportation, loading, and unloading, further aggravating air pollution in the area. It has been shown that particulate matter at different distances from coal mines exhibits high toxicity, which is related to metals adsorbed on the surface of the particulate matter [4]. In the present study, PM concentrations were higher in the urban area due to the high population density and traffic flow, and because the prevailing wind direction was NNE in the Wuhai area during the monitoring period, and the urban area was downwind of the mining area. The sandy area was the least polluted because it is separated from the city by the Yellow River and fewer human activities take place in the area. The proportions of Al, Ba, and Zn in the total elements did not vary significantly among regions, suggesting that different functional areas may have similar sources of pollutants. Notably, Fe content in PM was higher in the urban area than in the mining and sandy areas in winter because heating is turned on in this season, and the PM emitted from residential coal burning is rich in Fe particles [34]. In contrast, the concentrations of Ca2+ and Na+ differed among regions, which was related to pollutant emissions between different functional areas.

4.2. Spatiotemporal Correlation of Atmospheric Pollutants

This study identified a correlation between the daytime and nighttime concentrations of PM, with the latter increasing as the former did. Therefore, a range of dust suppression measures during the daytime can also be effective in reducing PM concentrations at night. The correlation analysis showed that the interactions between different functional areas were more complex in summer and winter, which may be due to the greater contribution of dust as the dominant source of pollution in urban, mining, and sandy areas in these seasons. In addition, PM concentrations in the urban area were influenced by pollution in both the mining and sandy areas. The results of the Kerriging analysis further showed that the impact of pollution in these two areas on urban PM did not increase constantly with the increasing concentrations, but there may be an influence threshold (Figure 5). This phenomenon may be related to meteorological conditions and topography. It has been shown that radiative inversions often occur in opencast coal mines, particularly in northwestern China. The cloud cover in the study area is limited, and ground-level radiation is not easily retained, which results in a rapid drop in ground and bottom air temperatures, while the upper air temperature decreases more slowly. Warm and cold inversion phenomena occur when the bottom temperature drops to a certain extent. In these conditions, the air structure is stable and convection does not occur easily; therefore, pollutants cannot diffuse out effectively, and they accumulate in a small area at increasing concentrations, eventually forming serious air pollution. On the eastern side of the Yellow River in Wuhai, the Gander Mountain and Zhuozi Mountain are lined up along a north-to-south direction, enclosing the closely located mining area and creating a geographical setting that resembles a large mine pit to some extent. PM may spill over when concentrations in the mining area rise above a certain level, resulting in an increase in the inversion layer range and, consequently, in the diffusion of particles in the urban area. This also explains why high PM concentrations in the mining area have an impact on the urban area. The sandy area is located to the west of the city, across the Yellow River. As a great distance separates this area from the urban and mining areas, high concentrations of pollutants only accumulate locally and are not easily dispersed when inversions occur. Therefore, the urban area may only be affected when PM is in the lower concentration range in the sandy area. Furthermore, this study showed that the interactions between fine particles (PM1 and PM2.5) in different regions were predominant, suggesting that these pollutants can be transported over longer distances due to their smaller masses and that interactions between regions are more obvious.

4.3. Sources and Effects of Atmospheric Pollutants

The main chemical components of atmospheric PM in Wuhai were Al, Ba, Zn, Ca2+, and Na+. Al mainly derives from soil dust, construction, and traffic and is a product of the differentiation of the Earth’s crust and soil [35,36]. Ba is found in the brakes, bearings, tires, and brake pads of cars and is easily released into the air through wear and tear [37,38]. Zn is a common product of human activities, such as industrial manufacturing and fuel combustion [39,40,41]. Na+ is the main component of sea salt, while both Ca2+ and Na+ are found in crustal sources, such as construction and road dust [42]. The PMF results also indicated that the pollutants in different functional areas mainly originated from dust, industrial and traffic emissions, combustion, and sea salt. Although Wuhai is an inland city, the Yellow River flows through it from north to south; therefore, sea salt traces can be detected in the area. Pollutants in the PM of different particle sizes exhibited similar sources, attributable to comparable emission patterns from local pollution sources, albeit with varying contribution ratios. However, the results revealed seasonal differences, particularly an increased contribution from combustion sources during winter. The contributions of dust in PM with different particle sizes in the mining and sandy areas were as high as 49–72%, considerably higher than those in other industrial areas in northern China, e.g., 16–42%, 14%, and 42.2% for PM2.5 in Hebei [43], Zhengzhou [44], and Ningdong [45], respectively, and 24.8% and 29.9% for PM2.5 and PM10 in Lanzhou [46], respectively. These high proportions are due to the fact that opencast coal mines strip the soil during mining and blasting operations. Also, in the mining area examined, vegetation cover is low and the pavements are covered by ground gravel, sand, earth, and coal dust. Although water sprinklers are installed to suppress dust, the effect is limited and heavy trucks continuously raise ground dust during transport; therefore, the contribution of dust to pollution is extremely high in the mining area. The sandy area presents a relatively high proportion of natural resources due to the lower anthropogenic pressure. Moreover, the drier climate generally observed in the sandy area is associated with higher dust concentrations in the atmosphere. Although dust was identified as a major source of pollution in the urban area, other sources accounted for a significant proportion of PM1, PM2.5, PM10, and TSP. This is due to the complexity of human activities in the urban area, which span from the industrial to the commercial and agricultural sectors. For example, the contribution of traffic emissions and combustion in the urban area was generally higher than that in the mining and sandy areas. Furthermore, the sources of pollutants varied from season to season due to both weather conditions and human activity. Dust was the largest source of pollution in summer and winter, possibly because the soils are drier and the average wind speed increases in summer, promoting the circulation of PM, while in winter, pollutant dilution and dispersion are impeded by the Mongolian Siberian high pressure, which is dominated by sinking air currents and is prone to inversions [47]. In addition, the contribution of combustion sources to pollution was higher in winter due to the activation of central heating systems, with sharp increases in the amount of coal burned. The backward trajectory analysis revealed that airflows reaching Wuhai predominantly originated from the northwest throughout all seasons, except for partial short-distance transport from the southeast during spring and summer. It mainly included eastern Kazakhstan, eastern and northern Xinjiang, as well as western and southern Mongolia. Compared to spring and summer, the trajectories generally shifted southward, with longer transport distances in autumn and winter. The northwesterly airflows traversed China’s four major deserts in sequence: the Gurbantünggüt Desert, Badain Jaran Desert, Tengger Desert, and Ulan Buh Desert. Additionally, these source regions hosted extensive mining activities, which generated substantial pollutants during production. Coupled with the arid and low-precipitation climate, particulate pollutants in these areas are easily entrained by northwesterly airflows and transport to Wuhai, adversely affecting local air quality.
Some studies have shown that children face higher non-carcinogenic risks than adults because their detoxification and excretory systems are not fully matured, resulting in a lower metabolism and detoxification capacity [48,49]. However, adults typically exhibit higher exposure values than children when facing carcinogenic risks [50,51] due to physiological differences [52]. The results of the risk assessment showed that children were exposed to more carcinogenic risks associated with Cr and non-carcinogenic risks associated with Cr and Mn than adults, which is consistent with our previous studies [24,25]. Studies have shown that abundant toxic substances generated during combustion processes primarily cause acute bronchitis as the main pathogenic factor and lung cancer as the leading fatal outcome. Lin et al. [53] conducted particulate matter sampling and analysis in a typical coal-burning city during winter, revealing that Cr poses higher carcinogenic risks to adults and greater non-carcinogenic risks to children. However, in the present study, both Cr and Mn elements exhibited elevated health risks for children during winter. The effects of these two elements on human health varied depending on particle size, and the pattern of variation was not uniform. In general, harmful substances are more likely to be adsorbed into the human body due to the large specific surface area of small particles [54,55]. However, this study showed that coarse PM (PM10 and TSP) may pose a greater risk to human health, possibly because of the sources of pollutants in Wuhai and their mode of emission. The greatest risk was observed during the summer months, when the concentrations of elemental Cr in PM with different particle sizes are the highest. Unlike elemental Cr, Mn was generally associated with a higher non-carcinogenic risk in spring and autumn and with a minimal risk in winter. This is because Mn is mainly derived from soil, and with the dry climate and higher wind speeds in spring and autumn, its concentration in the atmosphere increases, while the low temperatures in winter allow the formation of permafrost, impeding the release of soil particles. In addition, the health risks associated with Cr were higher in the sandy area where the PM concentrations were the lowest. In contrast, as the highest concentration of PM in the mining area, the health risk from Mn was not always the highest, with its higher risk values in spring and summer and a greater impact on human health in the urban area during autumn and winter. Therefore, further investigations should focus on the distribution of particle sizes and the spatiotemporal patterns of toxic metals in different areas within regions and not only at the urban level [15].
In summary, it is recommended to focus on the prevention and control of dust pollution in the mining and sandy areas examined, especially in summer and winter. It is also worth considering how to sustainably carry out human activities in the urban area and optimize industrial emissions. Prevention and control measures must target different operational aspects in the mining area. For example, in addition to the use of conventional water sprinklers, spraying technology can be adopted to remove dust on transport roads and minimize the waste of water in the arid desert areas of northwestern China. Dust suppression nets can be set up in coal yards and dumps. To minimize the dust produced during blasting, the detonation method can be improved and chemical dust removal techniques can be adopted after blasting. In sandy areas, dust can be reduced by setting up sand barriers and cultivating psammophytes. By implementing the above measures, dust pollution in the urban area can be controlled to a certain extent. Moreover, Cr and Mn pollution should be prevented in summer and in spring/autumn, respectively, with a particular focus on Cr in the sandy area and on Mn in the mining and urban areas.

4.4. Limitations

The concentrations of organic carbon (OC) and elemental carbon (EC) in PM could not be determined due to objective reasons such as experimental conditions. However, considering that OC and EC are generally characterization factors for coal combustion sources, mobile sources, and biomass combustion sources, which can also be identified by relevant elements and water-soluble ions, the absence of OC and EC data has little impact on the source resolution results to some extent. Nevertheless, OC and EC are indeed important components of PM. The accuracy of the source analysis results will be improved if OC and EC can be used as identifying components in future studies.

5. Conclusions

In Wuhai, the concentrations of PM were higher in spring and summer than in autumn and winter, and the concentration of PM at night was lower than during the day. The daily average concentrations of PM were generally higher in the mining area than in the urban and sandy areas in different seasons. The results of the Kerriging analysis showed that the urban area was affected the most when specific ranges of high PM concentrations were detected in the mining area and specific ranges of low PM concentrations were detected in the sandy area. The sources of pollutants in different functional areas and seasons were dust, industrial and traffic emissions, combustion, and sea salt. Dust was the main source in different functional areas, while all the pollutant sources accounted for a large proportion of pollution in the urban area. In addition, the contribution of dust was greater in summer and winter, and the contribution of combustion sources increased in winter. The inter-regional airflows affecting the study area predominantly originated from the northwest. The results of the risk assessment showed that Cr and Mn pollution should be prevented in summer and in spring/autumn, respectively, with a particular focus on Cr in the sandy area and on Mn in the mining and urban areas.

Supplementary Materials

The following supporting information can be downloaded at: https://www.mdpi.com/article/10.3390/su17135945/s1. Figure S1. Meteorological conditions during the monitoring period. Figure S2. Elemental contributions of PM in different functional areas during spring, summer, autumn, and winter. Figure S3. Water-soluble ion contributions of PM in different functional areas during spring, summer, autumn, and winter. Figure S4. Correlation between PM concentrations in different functional areas (U: urban area; M: mining area; S: sandy area). Figure S5. Correlation between PM concentrations during the day and at night (D: day; N: night). Figure S6. Profiles of four sources identified from the PMF model for PM1, PM2.5, PM10, and TSP in different functional areas. Figure S7. Profiles of four sources identified from the PMF model for PM1, PM2.5, PM10, and TSP in different seasons. Table S1. Emission sources of different chemical components in PM. Table S2. The meaning and value of each parameter in the exposure formula. Table S3. Values of SF and RfD for related elements. Table S4 Concentrations in mining and sandy areas corresponding to high concentrations in the urban area (μg/m3). References [56,57,58,59,60,61,62,63,64,65,66,67] are cited in Supplementary Materials.

Author Contributions

Conceptualization, Y.L. and R.W.; Methodology, C.Z.; Software, J.G.; Validation, R.W.; Formal analysis, Y.L.; Investigation, Y.L.; Resources, Y.L. and M.W.; Writing—original draft, Y.L.; Writing—review & editing, Y.L. and R.W.; Visualization, Y.L.; Supervision, R.W. and T.Z.; Funding acquisition, Y.L., R.W. and T.Z. All authors have read and agreed to the published version of the manuscript.

Funding

This work was supported by the Shanxi Agricultural University “Introducing Talents Research Initiation Project” Program (2023BQ130), National Key Research and Development Plan Project of China (2017YFC0504403), Science and Technology Innovation Program for Higher Education Institutions in Shanxi Province (2024L064), and Shanxi Water Conservancy Technology Research and Promotion Project (2025GM35). We thank our colleagues for their help with the experiments.

Institutional Review Board Statement

Not applicable.

Informed Consent Statement

Not applicable.

Data Availability Statement

Parts of the data generated or analyzed during this study are included in the Supplementary Information file. Additional datasets used and/or analyzed during the current study are available from the corresponding author on reasonable request.

Conflicts of Interest

The authors declare no conflict of interest.

References

  1. Li, Q.C.; Wu, J.J.; Qiang, L.; Wang, F.L.; Cheng, Y.F. Sediment instability caused by gas production from hydrate-bearing sediment in northern south China sea by horizontal wellbore: Sensitivity analysis. Nat. Resour. Res. 2025, 34, 1667–1699. [Google Scholar]
  2. Sharma, S.; Agrawal, V.; McGrath, S.; Hakala, J.A.; Lopano, C.; Goodman, A. Geochemical controls on CO2 interactions with deep subsurface shales: Implications for geologic carbon sequestration. Environ. Sci. Process. Impacts 2021, 23, 1278–1300. [Google Scholar] [CrossRef] [PubMed]
  3. Ishtiaq, M.; Jehan, N.; Khan, S.A.; Muhammad, S.; Saddique, U.; Iftikhar, B.; Zahidullah. Potential harmful elements in coal dust and human health risk assessment near the mining areas in Cherat, Pakistan. Environ. Sci. Pollut. Res. 2018, 25, 14666–14673. [Google Scholar] [CrossRef] [PubMed]
  4. Leshukov, T.; Legoshchin, K.; Yakovenko, O.; Bach, S.; Russakov, D.; Dimakova, D.; Vdovina, E.; Baranova, E.; Avdeev, K.; Kolpina, E.; et al. Fractional composition and toxicity coal-rock of PM10-PM0.1 dust near an opencast coal mining area and coal-fired power station. Sustainability 2023, 14, 16594. [Google Scholar] [CrossRef]
  5. Abbas, I.; Verdin, A.; Escande, F.; Saint-Georges, F.; Cazier, F.; Mulliez, P.; Courcot, D.; Shirali, P.; Gosset, P.; Garçon, G. In vitro short-term exposure to air pollution PM2.5-0.3 induced cell cycle alterations and genetic instability in a human lung cell coculture mode. Environ. Res. 2016, 147, 146–158. [Google Scholar] [CrossRef]
  6. Chang, Y.H.; Huang, K.; Xie, M.J.; Deng, C.R.; Zou, Z.; Liu, S.D.; Zhang, Y.L. First long-term and near real-time measurement of trace elements in China’s urban atmosphere: Temporal variability, source apportionment and precipitation effect. Atmos. Chem. Phys. 2018, 18, 11793–11812. [Google Scholar] [CrossRef]
  7. Cui, Y.; Ji, D.S.; He, J.; Kong, S.F.; Wang, Y.S. In situ continuous observation of hourly elements in PM2.5 in urban Beijing, China: Occurrence levels, temporal variation, potential source regions and health risks. Atmos. Environ. 2020, 222, 117164. [Google Scholar] [CrossRef]
  8. Sulaymon, I.D.; Mei, X.D.; Yang, S.J.; Chen, S.; Zhang, Y.; Hopke, P.K.; Schauer, J.J.; Zhang, Y.X. PM2.5 in Abuja, Nigeria: Chemical characterization, source apportionment, temporal variations, transport pathways and the health risks assessment. Atmos. Res. 2020, 237, 104833. [Google Scholar] [CrossRef]
  9. Frank, L.D. Land use and transportation interaction implications on public health and quality of life. J. Plan. Educ. Res. 2000, 20, 6–22. [Google Scholar] [CrossRef]
  10. Frank, L.D.; Sallis, J.F.; Conway, T.L.; Chapman, J.E.; Saelens, B.E.; Bachman, W. Many pathways from land use to health: Associations between neighborhood walkability and active transportation, body mass index, and air quality. J. Am. Plann. Assoc. 2006, 72, 75–87. [Google Scholar] [CrossRef]
  11. Kang, J.E.; Yoon, D.K.; Bae, H.J. Evaluating the effect of compact urban form on air quality in Korea. Environ. Plan. B-Urban 2019, 46, 179–200. [Google Scholar] [CrossRef]
  12. Sahu, S.P.; Patra, A.K.; Kolluru, S.S.R. Spatial and temporal variation of respirable particles around a surface coal mine in India. Atmos. Pollut. Res. 2018, 9, 662–679. [Google Scholar] [CrossRef]
  13. Huang, R.J.; Cheng, R.; Jing, M.; Yang, L.; Li, Y.J.; Chen, Q.; Chen, Y.; Yan, J.; Lin, C.S.; Wu, Y.F.; et al. Source-specific health risk analysis on particulate trace elements: Coal combustion and traffic emission as major contributors in wintertime Beijing. Environ. Sci. Technol. 2018, 52, 10967–10974. [Google Scholar] [CrossRef]
  14. Wang, H.B.; Qiao, B.Q.; Zhang, L.M.; Yang, F.M.; Jiang, X. Characteristics and sources of trace elements in PM2.5 in two megacities in Sichuan basin of southwest China. Environ. Pollut. 2018, 242, 1577–1586. [Google Scholar] [CrossRef]
  15. Hao, Y.F.; Luo, B.; Simayi, M.; Zhang, W.; Jiang, Y.; He, J.M.; Xie, S.D. Spatiotemporal patterns of PM2.5 elemental composition over China and associated health risks. Environ. Pollut. 2020, 265, 114910. [Google Scholar] [CrossRef]
  16. Zhang, H.F.; Wang, Z.H.; Zhang, W.Z. Exploring spatiotemporal patterns of PM2.5 in China based on ground-level observations for 190 cities. Environ. Pollut. 2016, 216, 559–567. [Google Scholar] [CrossRef]
  17. Shen, L.J.; Liu, J.; Zhao, T.L.; Xu, X.D.; Han, H.; Wang, H.L.; Shu, Z.Z. Atmospheric transport drives regional interactions of ozone pollution in China. Sci. Total. Environ. 2022, 830, 154634. [Google Scholar] [CrossRef]
  18. Wang, J.F.; Ge, X.L.; Sonya, C.; Ye, J.H.; Lei, Y.L.; Chen, M.D.; Zhang, Q. Influence of regional emission controls on the chemical composition, sources, and size distributions of submicron aerosols: Insights from the 2014 Nanjing Youth Olympic Games. Sci. Total. Environ. 2022, 807, 150869. [Google Scholar] [CrossRef]
  19. HJ 777-2015; Ambient Air and Waste Gas from Stationary Sources Emission-Determination of Metal Elements in Ambient Particle Matter-Inductively Coupled Plasma Optical Emission Spectrometry. Chinese Research Academy Environmental Sciences: Beijing, China, 2015.
  20. HJ 800-2016; Ambient Air-Determination of the Water Soluble Cations (Li+, Na+, NH4+, K+, Ca2+, Mg2+) from Atmospheric Particlesion Chromatography. Chinese Research Academy Environmental Sciences: Beijing, China, 2016.
  21. HJ 799-2016; Ambient Air-Determination of the Water Soluble Anions (F, Cl, Br, NO2, NO3, PO43−, SO32−, SO42−) from Atmospheric Particles Ion Chromatography. Chinese Research Academy Environmental Sciences: Beijing, China, 2016.
  22. Li, Q.Q.; Gong, D.C.; Wang, H.; Wang Yu Han, S.J.; Wu, G.C.; Deng, S.; Yu, P.F.; Wang, W.L.; Wang, B.G. Rapid increase in atmospheric glyoxal and methylglyoxal concentrations in Lhasa, Tibetan Plateau: Potential sources and implications. Sci. Total Environ. 2022, 824, 153782. [Google Scholar] [CrossRef]
  23. Ma, J.; Shen, Z.J.; Zhang, P.P.; Liu, P.; Liu, J.Z.; Sun, J.; Wang, L.L. Pollution characteristics and source apportionment of heavy metals in farmland soils around the gangue heap of coal mine based on APCS-MLR and PMF receptor model. Environ. Sci. 2023, 44, 2192–2203. [Google Scholar]
  24. Liu, Y.; Wang, R.S.; Zhao, T.N.; Zhang, Y.; Wang, J.H.; Wu, H.X.; Hu, P. Source apportionment and health risk due to PM10 and TSP at the surface workings of an underground coal mine in the arid desert region of Northwestern China. Sci. Total. Environ. 2022, 803, 149901. [Google Scholar] [CrossRef] [PubMed]
  25. Liu, Y.; Zhao, T.N.; Wang, R.S.; Ai, X.F.; Wang, M.W.; Sun, T.; Jiang, Q.N. Coupling effects of sandstorm and dust from coal bases on the atmospheric environment of Northwest China. Atmosphere 2022, 13, 1629. [Google Scholar] [CrossRef]
  26. Wang, Y.Q. MeteoInfo: GIS software for meteorological data visualization and analysis. Meteorol. Appl. 2012, 21, 360–368. [Google Scholar] [CrossRef]
  27. Lee, S.; Ashbaugh, L. The impact of trajectory starting heights on the MURA trajectory source apportionment (TSA) method. Atmos. Environ. 2007, 41, 7022–7036. [Google Scholar] [CrossRef]
  28. Sapkota, A.; Symons, J.M.; Kleissl, J.; Wang, L.; Parlange, M.B.; Ondov, J.; Breysse, P.N.; Diette, G.B.; Eggleston, P.A.; Buckley, T.J. Impact of the 2002 Canadian forest fires on particulate matter air quality in Baltimore City. Environ. Sci. Technol. 2005, 39, 24–32. [Google Scholar] [CrossRef]
  29. WHO (World Health Organization). 2005. Available online: https://iris.who.int/bitstream/handle/10665/69477/WHO_SDE_PHE_OEH_06.02_chi.pdf?sequence=3&isAllowed=y (accessed on 20 June 2025).
  30. GB 3095-2012; Ambient Air Quality Standards. Chinese Research Academy Environmental Sciences: Beijing, China, 2012.
  31. Luo, H.; Zhou, W.; Jiskani, I.M.; Wang, Z. Analyzing characteristics of particulate matter pollution in open-pit coal mines: Implications for green mining. Energies 2021, 14, 2680. [Google Scholar] [CrossRef]
  32. Wang, Z.; Zhou, W.; Jiskani, I.M.; Luo, H.; Ao, Z.; Mvula, E.M. Annual dust pollution characteristics and its prevention and control for environmental protection in surface mines. Sci. Total. Environ. 2022, 825, 153949. [Google Scholar] [CrossRef]
  33. Tang, W.J. Study on Dust Distribution and Diffusion Mechanism in Open Pit Coal Mine. Ph.D. Thesis, China University of Mining and Technology, Xuzhou, China, 2018. [Google Scholar]
  34. Zhang, Y.X.; Lu, C.Y.; Zhang, J.; Wang, X.F.; Li, W.J. Emission characteristics and individual particle analysis of metals in fine particles emitted from residential coal burning. China Environ. Sci. 2018, 38, 3273–3279. [Google Scholar]
  35. Kuo, S.C.; Hsieh, L.Y.; Tsai, C.H.; Tsai, Y.I. Characterization of PM2.5 fugitive metal in the workplaces and the surrounding environment of a secondary aluminum smelter. Atmos. Environ. 2007, 41, 6884–6900. [Google Scholar] [CrossRef]
  36. Li, S.L. Characteristics and Source Analysis of Dust Pollution in Jinan City. Master’s Thesis, Shandong Jianzhu University, Jinan, China, 2019. [Google Scholar]
  37. Amato, F.; Viana, M.; Richard, A.; Furger, M.; Prévôt, A.S.H.; Nava, S.; Lucarelli, F.; Bukowiecki, N.; Alastuey, A.; Reche, C.; et al. Size and time-resolved roadside enrichment of atmospheric particulate pollutants. Atmos. Chem. Phys. 2011, 11, 2917–2931. [Google Scholar] [CrossRef]
  38. Grigoratos, T.; Martini, G. Brake wear particle emissions: A review. Environ. Sci. Pollut. Res. 2015, 22, 2491–2504. [Google Scholar] [CrossRef] [PubMed]
  39. Altıntas, Y.; Kaygısız, Y.; Öztürk, E.; Aksöz, S.; Keşlioğlu, K.; Maraşlı, N. The measurements of electrical and thermal conductivity variations with temperature and phonon component of the thermal conductivity in Sn-Cd-Sb, Sn-In-Cu, Sn-Ag-Bi and Sn-Bi-Zn alloys. Int. J. Therm. Sci. 2016, 100, 1–9. [Google Scholar] [CrossRef]
  40. Bozkurt, Z.; Gaga, E.O.; Taşpınar, F.; Arı, A.; Pekey, B.; Pekey, H.; Dögeroglu, T.; Üzmez, Ö.Ö. Atmospheric ambient trace element concentrations of PM10 at urban and sub-urban sites: Source apportionment and health risk estimation. Environ. Monit. Assess. 2018, 190, 168. [Google Scholar] [CrossRef] [PubMed]
  41. Ledoux, F.; Kfoury, A.; Delmaire, G.; Roussel, G.; Zein, A.E.; Courcot, D. Contributions of local and regional anthropogenic sources of metals in PM2.5 at an urban site in northern France. Chemosphere 2017, 181, 713–724. [Google Scholar] [CrossRef]
  42. Xue, G.Q.; Zhu, B.; Wang, H.L. Size distributions and source apportionment of soluble ions in aerosol in Nanjing. Environ. Sci. 2014, 35, 1633–1643. [Google Scholar]
  43. Li, X.; Yan, C.Q.; Wang, C.Y.; Ma, J.J.; Li, W.X.; Liu, J.Y.; Liu, Y. PM2.5-bound elements in Hebei province, China: Pollution levels, source apportionment and health risks. Sci. Total Environ. 2022, 806, 150440. [Google Scholar] [CrossRef]
  44. Jiang, N.; Li, Q.; Su, F.C.; Wang, Q.; Yu, X.; Kang, P.R.; Zhang, R.Q.; Tang, X.Y. Chemical characteristics and source apportionment of PM2.5 between heavily polluted days and other days in Zhengzhou, China. J. Environ. Sci. 2018, 66, 188–198. [Google Scholar] [CrossRef]
  45. Liang, X.X.; Huang, T.; Lin, S.Y.; Wang, J.X.; Mo, J.Y.; Gao, H.; Wang, Z.X.; Li, J.X.; Lian, L.L.; Ma, J.M. Chemical composition and source apportionment of PM1 and PM2.5 in a national coal chemical industrial base of the golden energy triangle, Northwest China. Sci. Total Environ. 2019, 659, 188–199. [Google Scholar] [CrossRef]
  46. Qiu, X.H.; Duan, L.; Gao, J.; Wang, S.L.; Chai, F.H.; Hu, J.; Zhang, J.Q.; Yun, Y.R. Chemical composition and source apportionment of PM10 and PM2.5 in different functional areas of Lanzhou, China. J. Environ. Sci. 2016, 40, 75–83. [Google Scholar] [CrossRef]
  47. Xiao, S.; Wang, Q.Y.; Cao, J.J.; Huang, R.J.; Chen, W.D.; Han, Y.M.; Xu, H.M.; Liu, S.X.; Zhou, Y.Q.; Wang, P.; et al. Long-term trends in visibility and impacts of aerosol composition on visibility impairment in Baoji, China. Atmos. Res. 2014, 149, 88–95. [Google Scholar] [CrossRef]
  48. Kawichai, S.; Bootdee, S.; Sillapapiromsuk, S.; Janta, R. Epidemiological study on health risk assessment of exposure to PM2.5-bound toxic metals in the industrial metropolitan of Rayong, Thailand. Sustainability 2022, 14, 15368. [Google Scholar] [CrossRef]
  49. Yadav, N.; Bajar, S.; Gupta, S.; Vijayan, N.; Sharma, S.K. Evaluating health risks of PM2.5-bound heavy elements in Faridabad, Haryana (India): An industrial perspective. Environ. Monit. Assess. 2024, 196, 1185. [Google Scholar] [CrossRef] [PubMed]
  50. Zhang, F.; Shen, Y.; Xu, B.; Shen, J.; Jin, L.; Yao, L.; Kuang, B.Y.; Xu, Z.N.; Pei, X.Y.; Tang, Q.; et al. Characteristics, sources, and health risks of PM2.5-bound trace metals in northern Zhejiang Province: The effects of meteorological variables based on machine learning. J. Clean. Prod. 2024, 451, 142089. [Google Scholar] [CrossRef]
  51. Zhang, F.; Wan, M.; Pang, X.L.; Yao, L.; Fu, Y.; Jiang, W.J.; Zhu, J.N.; Zhang, C.W. Chemical characterization, source identifcation, and health risk assessment of atmospheric fine particulate matter in winter in Hangzhou Bay. Sustainability 2022, 14, 12175. [Google Scholar] [CrossRef]
  52. Sirinara, P.; Chuersuwan, N.; Pongkiatkul, P.; Chanpiwat, P.; Jiamjaras-rangsi, W. Quantifying the noncarcinogenic and carcinogenic risks resulting from the inhalation of PM2.5-bound metals: A multicity analysis and implications for public health. Ecotoxicol. Environ. Saf. 2024, 286, 117198. [Google Scholar] [CrossRef]
  53. Lin, Y.C.; Zhang, Y.L.; Song, W.H.; Yang, X.Y.; Fan, M.Y. Specific sources of health risks caused by size-resolved PM-bound metals in a typical coal-burning city of Northern China during the winter haze event. Sci. Total Environ. 2020, 734, 138651. [Google Scholar] [CrossRef]
  54. Guo, G.; Zhang, D.; Wang, Y. Characteristics of heavy metals in size-fractionated atmospheric particulate matters and associated health risk assessment based on the respiratory deposition. Environ. Geochem. Health 2021, 43, 285–299. [Google Scholar] [CrossRef]
  55. Penttinen, P.; Timonen, K.L.; Tiittanen, P.; Mirme, A.; Ruuskanen, J.; Pekkanen, J. Ultrafine particles in urban air and respiratory health among adult asthmatics. Eur. Respir. J. 2001, 17, 428–435. [Google Scholar] [CrossRef]
  56. Zhang, X.; Chen, W.; Ma, C.; Zhan, S. Modeling particulate matter emissions during mineral loading process under weak wind simulation. Sci. Total Environ. 2013, 449, 168–173. [Google Scholar] [CrossRef]
  57. Zhang, R.J.; Jing, J.; Tao, J.; Hsu, S.C.; Wang, G.; Cao, J. Chemical characterization and source apportionment of PM2.5 in Beijing: Seasonal perspective. Atmos. Chem. Phys. 2013, 13, 7053–7074. [Google Scholar] [CrossRef]
  58. Lin, Y.C.; Tsai, C.J.; Wu, Y.C.; Zhang, R.; Chi, K.H.; Huang, Y.T.; Lin, S.H.; Hsu, S.C. Characteristics of trace metals in traffic-derived particles in Hsuehshan Tunnel, Taiwan: Size distribution, potential source, and fingerprinting metal ratio. Atmos. Chem. Phys. 2015, 15, 4117–4130. [Google Scholar] [CrossRef]
  59. Minguillon, M.C.; Monfort, E.; Escrig, A.; Celades, I.; Guerra, L.; Busani, G.; Sterni, A.; Querol, X. Air quality comparison between two European ceramic tile clusters. Atmos. Environ. 2013, 74, 311–319. [Google Scholar] [CrossRef]
  60. Kong, S.; Han, B.; Bai, Z.; Chen, L.; Shi, J.; Xu, Z. Receptor modeling of PM2.5, PM10 and TSP in different seasons and long-range transport analysis at a coastal site of Tianjin, China. Sci. Total Environ. 2010, 408, 4681–4694. [Google Scholar] [CrossRef]
  61. Wang, Y.; Zhuang, G.; Sun, Y.; An, Z. The variation of characteristics and formation mechanisms of aerosols in dust, haze, and clear days in Beijing. Atmos. Environ. 2006, 40, 6579–6591. [Google Scholar] [CrossRef]
  62. Guo, W.; Zhang, Z.Y.; Zhang, N.J.; Luo, L.; Xiao, H.Y.; Xiao, H.W. Chemical characterization and source analysis of water-soluble inorganic ions in PM2.5 from a plateau city of Kunming at different seasons. Atmos. Res. 2020, 234, 104687. [Google Scholar] [CrossRef]
  63. Zhao, J.P.; Zhang, F.W.; Xu, Y.; Chen, J. Characterization of water-soluble inorganic ions in size-segregated aerosols in coastal city, Xiamen. Atmos. Res. 2011, 99, 546–562. [Google Scholar] [CrossRef]
  64. Mcculloch, A.; Aucott, M.L.; Benkovitz, C.M.; Graedel, T.E.; Kleiman, G.; Midgley, P.M.; Li, Y.F. Global emissions of hydrogen chloride and chloromethane from coal combustion, incineration and industrial activities: Reactive Chlor ine Emissions Inventory. J. Geophys. Res. 1999, 104, 8391. [Google Scholar] [CrossRef]
  65. Eliani, E.; Nicola, M.; Jonathan, G.; Tara, K.B.; Zoe, K.S.; Iain, J.B. Measurement of diesel combustion-related air pollution downwind of an experimental unconventional natural gas operations site. Atmos. Environ. 2018, 189, 30–40. [Google Scholar]
  66. He, R.D.; Zhang, Y.S.; Chen, Y.Y.; Jin, M.J.; Han, S.J.; Zhao, J.S.; Zhang, R.Q.; Yan, Q.S. Heavy metal pollution characteristics and ecological and health risk assessment of atmospheric PM2.5 in a living area of Zhengzhou City. J. Environ. Sci. 2019, 40, 4774–4782. [Google Scholar]
  67. DB11/T 656-2009; Environmental Site Assessment Guideline. Beijing Municipal Bureau of Quality and Technical Supervision: Beijing, China, 2009.
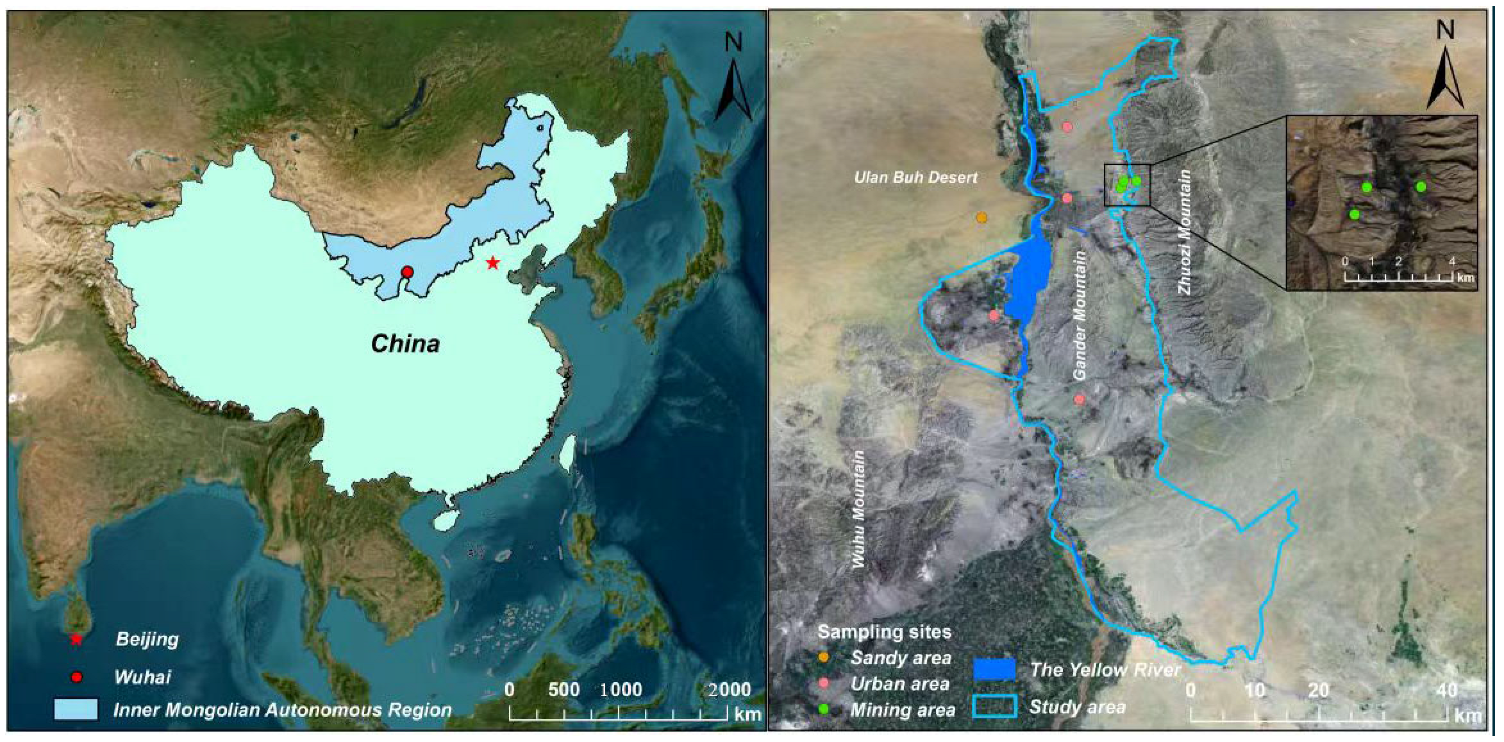
Figure 1. Map of study area and sampling sites.
Sustainability 17 05945 g001
Figure 2. Seasonal and diurnal variations in PM concentrations in different functional areas. Note: Dotted lines represent PM concentration limits of the WHO and China.
Sustainability 17 05945 g002aSustainability 17 05945 g002b
Figure 3. Diagram of the accumulation of elemental concentrations in different functional areas (D: day; N: night; A: all day).
Sustainability 17 05945 g003
Figure 4. Diagram of the accumulation of water-soluble ion concentrations in different functional areas (D: day; N: night; A: all day).
Sustainability 17 05945 g004
Figure 5. Effects of PM concentrations in different functional areas (U: urban area; M: mining area; S: sandy area). Note: Black box represent a threshold range within which urban concentrations were the highest.
Sustainability 17 05945 g005aSustainability 17 05945 g005b
Figure 6. Contributions of different sources to PM1, PM2.5, PM10, and TSP based on the PMF model in (a) different functional areas and (b) different seasons.
Sustainability 17 05945 g006
Figure 7. Analytical results of 72 h backward trajectories cluster of air mass in different seasons in Wuhai. Note: Different color lines represent different air mass movement paths.
Sustainability 17 05945 g007
Figure 8. Health risk assessment of toxic metal elements in atmospheric particulates to different populations in different functional areas (M: mining area; U: urban area; S: sandy area; W: Wuhai area).
Sustainability 17 05945 g008
Table 1. Details of production activities in different functional areas.
Sampling PointsLongitudeLatitudeProduction ActivitiesPavement ConditionDistance to Mining Area
Mining area106.9139.71Mining activities such as blasting, excavation, loading and unloading, transportation, etc.Gravel–sand–dirt–coal–dust pavement
106.8939.71
106.8939.70
Urban area106.8139.69Predominantly human residential activity with high traffic volume.Concrete hardened pavement6.95 km
106.7139.5225.18 km
106.8339.4132.69 km
106.8139.7912.13 km
Sandy area106.6939.66Sparse residential population and low traffic volume.Concrete hardened pavement17.7 km
Disclaimer/Publisher’s Note: The statements, opinions and data contained in all publications are solely those of the individual author(s) and contributor(s) and not of MDPI and/or the editor(s). MDPI and/or the editor(s) disclaim responsibility for any injury to people or property resulting from any ideas, methods, instructions or products referred to in the content.