Abstract
Environmental regulation has become a central policy tool for reconciling the tensions between ecological sustainability and industrial development. Although most existing studies focus on its impact on green innovation or firm behavioral change, attention to how environmental regulation affects the structural resilience of manufacturing systems under external shocks remains limited. This paper constructs a balanced panel dataset covering 287 prefecture-level cities in mainland China from 2006 to 2021 to quantify the impact of environmental regulation intensity on the resilience of manufacturing development. Manufacturing resilience is assessed through a comprehensive indicator system, including the dimensions of adaptive capacity, recovery potential, and industrial continuity. The empirical results show that environmental regulation has a significant inhibitory effect on manufacturing resilience, and this effect is supported in a number of robustness analyses using instrumental variable estimation and lagged structural tests. Mechanism analysis suggests that, despite the overall negative effect, environmental regulations can indirectly enhance resilience performance by promoting industrial autonomy and digital transformation under certain conditions. Heterogeneity analysis further reveals that the negative effect is more pronounced in regions with higher regulatory intensity, in non-self-employed firms, in industries not subject to U.S. sanctions, and in eastern China. These findings suggest that the dynamic needs of the industrial system should be taken into account in the formulation of environmental policies, and that digital capacity building and autonomy upgrading should be the key paths to mitigate regulatory shocks.
1. Introduction
Against the backdrop of intensifying global climate change pressures and the rapid advancement of China’s “dual-carbon” strategy, environmental regulation has emerged as a central force reshaping the pattern of industrial development with unprecedented intensity. For traditional manufacturing sectors—typically characterized by high energy consumption and carbon emissions—green regulations represent both an external driver of sustainable transformation and an institutional constraint that increases operational burdens. While stringent environmental policies are generally effective in enhancing ecological performance and improving green total factor productivity, their impact on the systemic resilience of the manufacturing industry remains a matter of academic debate. On the one hand, environmental regulation can enhance firms’ adaptive capacity in uncertain environments by promoting the adoption of green technologies and optimizing organizational structures. On the other hand, rising compliance costs and regulatory uncertainty may undermine manufacturing competitiveness and resource allocation efficiency, weakening the sector’s ability to respond effectively to external shocks. As China deepens its strategy of high-quality industrial development, understanding this dynamic tension between environmental regulation and manufacturing resilience has become essential for evaluating policy effectiveness and formulating adaptive transformation paths.
In the context of China’s ongoing green transformation of its manufacturing sector, the relationship between environmental regulation and manufacturing development has drawn considerable attention in both academic and policy domains. However, due to notable regional disparities in economic development, industrial structures, and implementation capacity, the intensity of environmental regulation varies significantly across space. This spatial heterogeneity may exert far-reaching effects on the dynamic stability and resilience of local manufacturing systems [1].
From a theoretical standpoint, several competing frameworks explain the impact of environmental regulation. The “Pollution Haven” Hypothesis posits that stringent regulation may prompt high-pollution and high-emission enterprises to relocate to regions with looser standards, thereby exporting environmental externalities and compromising the receiving regions’ industrial quality. In contrast, Porter’s Hypothesis suggests that moderate regulation can stimulate innovation and achieve win–win outcomes by improving resource use efficiency and reducing long-term compliance costs. Meanwhile, factor endowment theory emphasizes the role of capital, labor, and natural resource endowments in shaping how regions respond to regulation. Well-capitalized regions with solid industrial foundations can often leverage economies of scale and technological accumulation to facilitate green upgrading and improve resilience under environmental constraints. By contrast, resource-dependent or capital-scarce regions may face more substantial challenges in adapting to such policies, limiting their capacity to build industrial resilience [2,3].
Against the backdrop of rapidly advancing green transformation policies, how manufacturing systems can maintain structural resilience under regulatory shocks has become an urgent question of both theoretical and practical importance. While existing studies have primarily examined the effects of environmental regulation on green innovation, productivity, or pollution reduction, few have systematically explored its structural impact on manufacturing resilience. This study addresses this gap by adopting a three-stage analytical framework—incorporating policy shocks, mediating mechanisms, and resilience outcomes—and by constructing a multi-dimensional measurement system covering adaptive capacity, recovery potential, and industrial continuity. Furthermore, we innovatively introduce “industrial autonomy” and “digital transformation” as dual mediating pathways to interpret the indirect effects of regulation. Using a long-panel dataset of 287 prefecture-level cities, we also reveal significant heterogeneity across regions, industries, and firm types, offering empirically grounded insights for differentiated policy design. These features collectively shape the motivation and advantages of this research.
Despite this rich theoretical landscape, systematic research on regional manufacturing resilience remains limited. There is a lack of scientifically unified and dynamic measurement systems capable of capturing the manufacturing sector’s adaptability, recovery potential, and restructuring ability in the face of policy shocks or external disruptions. Moreover, few studies investigate the internal mechanisms through which environmental regulation shapes resilience—particularly in terms of how emerging trends such as industrial autonomy and digital transformation might mediate this relationship. As a result, there is an urgent need to construct a robust theoretical framework and empirical strategy to capture the multi-path effects of environmental policy on industrial resilience [4,5,6].
2. Literature Review and Research Gap
Existing research on environmental regulation and industrial development has primarily focused on impacts at the firm level, emphasizing outcomes such as innovation performance, productivity improvement, and environmental efficiency. However, relatively little attention has been paid to whether environmental regulation strengthens or undermines the systemic resilience of the manufacturing sector, particularly its ability to maintain structural stability, recover from external shocks, and adapt to long-term transformations. This research gap is especially critical under the current context of global supply chain reorganization, heightened geopolitical tensions, regional policy competition, and increasing demands for technological security.
At the regional level, environmental regulation exhibits strong spatial heterogeneity due to disparities in economic development, industrial structures, and institutional enforcement capacity across cities [4,5,6,7]. While a few studies have examined how policy intensity influences firm behavior, most rely on narrow and indirect indicators—such as environmental fines, investment in green infrastructure, or government attention to environmental issues—to quantify regulatory strength [8,9,10]. These one-dimensional proxies often fail to reflect actual implementation intensity and policy effectiveness, limiting the accuracy and credibility of empirical conclusions. Moreover, much of the existing work is based on limited firm-level datasets (e.g., large-scale enterprises or listed firms), which introduce selection bias and restrict the generalizability of findings to broader manufacturing systems.
From a methodological perspective, few studies have established robust, multidimensional indicator systems to measure manufacturing resilience in a comprehensive and scalable manner. Most resilience assessments fail to integrate dimensions such as adaptive capacity, structural recovery, and the continuity of industrial development. Furthermore, even fewer studies identify the internal mechanisms through which environmental regulations influence resilience. In particular, the roles of industrial autonomy and digital transformation have not been sufficiently investigated as mediators between regulation and resilience [11,12,13].
Some existing frameworks, such as the Pollution Haven Hypothesis, suggest that stringent regulation may prompt high-pollution and high-emission enterprises to relocate to regions with looser standards, thereby exporting environmental externalities and compromising the receiving regions’ industrial quality. In contrast, Porter’s Hypothesis argues that moderate regulation can spur innovation and efficiency gains, achieving a win–win outcome by enhancing competitiveness while improving environmental outcomes. Meanwhile, factor endowment theory emphasizes the role of capital, labor, and resource conditions in shaping regional responsiveness. However, these theories are often tested without clear causal identification and rarely consider regional heterogeneity in depth.
To address the above gaps, this study contributes to the literature in four key aspects:
- (1)
- Macro-regional perspective: This paper constructs a balanced panel dataset covering 287 prefecture-level cities in mainland China from 2006 to 2021, enabling the assessment of manufacturing resilience at the regional level. By focusing on prefectural-scale systemic performance, this study provides new empirical evidence for understanding the spatial transmission of green policy impacts.
- (2)
- Multidimensional measurement of resilience: We propose a comprehensive indicator system for manufacturing resilience, capturing structural stability, adaptive capacity, and developmental continuity. Using entropy-weighting methods, we ensure the objective assignment of weights across dimensions, thereby enhancing the scientific measurement of resilience in the context of green economy transformation.
- (3)
- This study adopts a two-stage least squares (2SLS) model using CO2 treatment rate as an instrumental variable to address potential endogeneity between regulation intensity and resilience outcomes. It further identifies two key mechanism pathways—industrial autonomy and digital transformation—as intermediaries that can mitigate the negative effects of environmental regulation and enhance resilience performance.
- (4)
- The analysis distinguishes regulatory effects across four dimensions—policy intensity, firm ownership type, industry attributes, and regional location. This multi-dimensional heterogeneity analysis reveals the conditions under which environmental regulations are effective, offering tailored policy implications for differentiated governance strategies.
The subsequent content of this article follows the following framework: Section 2 builds a theoretical analysis framework and puts forward research hypotheses around the role of environmental regulation and manufacturing resilience; Section 3 introduces the data sources, variable construction methods, and econometric modeling used in this study; Section 4 carries out the empirical analyses and reports the results of the baseline regressions, the robustness test, and the endogeneity treatment method; Section 5 explores in depth the role of environmental regulations in influencing the resilience of the manufacturing industry through industrial autonomy and digital transformation and further analyzes heterogeneity in terms of policy intensity, enterprise attributes, industry characteristics, and regional differences; Section 6 summarizes the findings of this study and puts forward targeted policy recommendations in light of the empirical results.
3. Theoretical Analysis and Research Hypotheses
Environmental regulation, as a government-led means of social regulation, aims to control the discharge behavior of the manufacturing industry through the formulation of standardized pollution standards, the levying of sewage charges, the imposition of administrative penalties, and other measures, so as to achieve the goal of environmental governance. Local governments usually adopt stricter law enforcement means in accordance with the requirements of environmental protection performance assessment and pay close attention to the environmental situation.
3.1. Basic Theory
As a government-led institutional tool, environmental regulation plays an important role in promoting green development and controlling pollution emissions. With the continuous promotion of ecological civilization construction and the accelerated implementation of the “dual-carbon” goal, the environmental compliance pressure faced by manufacturing enterprises has risen significantly. The impact of environmental regulation on the development of manufacturing industry is no longer limited to the traditional dimension of environmental performance evaluation but more deeply embedded in the process of industrial structural adjustment, technological path selection, and the construction of system resilience. Therefore, how environmental regulation works on the resilience of the manufacturing industry, which is a systemic and dynamic dimension of industrial capacity, has become an important matter that needs to be explored in depth.
Theoretically, the pathways through which environmental regulation affects the resilience of the manufacturing sector can be categorized into three main types of mechanisms:
First is the compliance cost inhibition path: environmental regulations to improve enterprises’ pollution control, technological transformation, and institutional implementation of expenditure, especially for high-energy-consumption, high-pollution enterprises, will lead to resource allocation efficiency and liquidity pressure and thus weaken the adaptive elasticity of enterprises and the structural stability of the industrial system.
Second is the innovation incentive path: under appropriate regulation and reasonable policy design, environmental regulation can enhance enterprises’ green technology investment and management process optimization through the “push mechanism”, enhance added product value and eco-efficiency, realize innovation compensation, and reshape enterprises’ competitive advantages, thus enhancing the long-term development resilience of the manufacturing system.
Thirdly is the path of capacity reconstruction: under the background of high regulatory intensity, manufacturing enterprises, in order to adapt to policy requirements, need to take the initiative to build new organizational capacity and dynamic response mechanisms, such as promoting the autonomy of the core link, key resource substitution, digital process reengineering, etc., in order to form a stronger system flexibility and synergistic response ability and improve the dynamic recovery level and adaptive flexibility of the overall system.
Based on the above analysis, this paper constructs a theoretical framework for analyzing the impact of environmental regulation on the resilience of manufacturing development (see Figure 1). The framework covers the direct-action path of environmental regulation and two intermediary mechanism paths, revealing the potential mitigation mechanism of regulation’s impact on resilience from the perspectives of “improving the level of industrial autonomy and control” and “deepening the digital transformation”, respectively. At the same time, this paper further considers the moderating effects of differences in regulatory intensity, enterprise attributes, and regional structure on the above mechanism paths, thus forming an overall logical chain of “environmental regulation–mechanism transmission–resilience performance”.
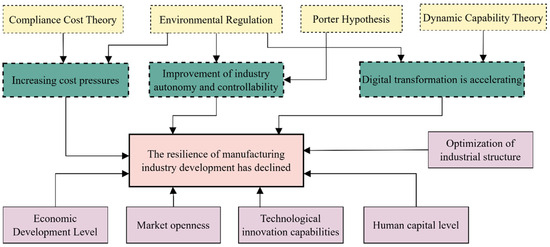
Figure 1.
Framework diagram of the mechanism of action of environmental regulations affecting the resilience of manufacturing development.
It is worth noting that although some studies suggest that environmental regulation may increase firms’ compliance costs and institutional burdens in the short term, potentially inhibiting manufacturing resilience, this study does not assume a simple transformation of the impact from negative to positive. Rather, we highlight that, alongside its direct (possibly negative) effect, environmental regulation also induces positive indirect effects through capability restructuring mechanisms—specifically, improvements in industrial autonomy and digital transformation. These mechanisms reflect firms’ dynamic response and structural adaptation under institutional constraints, which are conceptually distinct from moderating effects. Therefore, this study maintains the mediation model as the appropriate framework and ensures consistency between theoretical assumptions and empirical identification.
As an exogenous institutional constraint, environmental regulation has multiple impacts on the operational efficiency and dynamic adaptive capacity of the manufacturing system, and its direction of action and mechanism path have not yet formed a consistent conclusion at the theoretical level. Starting from the existing research, this paper mainly constructs the analytical framework based on the following three types of theories.
3.1.1. Compliance Cost Theory
Compliance cost theory suggests that environmental regulations in the implementation process force enterprises to increase pollution control expenditures, production process transformation inputs, and compliance system operating costs, especially in the context of higher regulatory intensity and shorter treatment cycles, more likely to cause enterprises to increase the pressure on cash flow, the efficiency of capital allocation, and, ultimately, the compression of redundant resources and buffer capacity, weakening the ability to cope with external shocks and the ability to systematically recover. This “cost squeeze” path may weaken the resilience of the manufacturing system at the structural level. The modeling can be simplified as follows:
where denotes the level of manufacturing resilience of the region in the year , denotes the intensity of environmental regulation, and is a set of control variables (e.g., industrial structure, capital intensity, etc.). If , it indicates that environmental regulation inhibits the development of resilience through the cost mechanism.
3.1.2. Porter’s Hypothesis
From an incentive-based perspective, Porter’s Hypothesis posits that moderate environmental regulation can serve as a “push mechanism” that stimulates green technological innovation and optimizes organizational processes. Under appropriately designed institutional arrangements, firms may enhance energy efficiency, adjust production structures, and develop green products—thereby reducing per-unit compliance costs and boosting competitiveness. This leads to an “innovation compensation” effect, where firms offset regulatory burdens through improved efficiency and new capabilities for sustainable development.
However, the practical application of “moderate regulation” is often hindered by ambiguous thresholds and heterogeneous enforcement across regions. In some contexts, such regulation may impose sufficient compliance costs to burden firms but not strong enough incentives to stimulate meaningful innovation. This asymmetry creates a structural imbalance where cost pressures outweigh innovation triggers. Moreover, many firms—especially small and medium-sized enterprises—face constraints such as path dependency, financing difficulties, and organizational inertia. These barriers contribute to innovation inertia, where firms are unable to respond quickly or effectively to policy stimuli.
As a result, in the absence of complementary support mechanisms or accumulated innovation capacity, moderate environmental regulation may fall short of its intended effect and fail to trigger systemic transformation. This suggests that the positive feedback loop envisioned in Porter’s Hypothesis is conditional, and its effectiveness depends on the precision of policy design and the absorptive capacity of regulated firms.
Accordingly, this mechanism is modeled as a mediating pathway:
where denotes the technological innovation capability of a region or industry, and if , it indicates that environmental regulation indirectly enhances manufacturing resilience by stimulating innovation pathways.
3.1.3. Dynamic Capabilities Theory
The theory of dynamic capabilities provides a robust framework for understanding how manufacturing systems adapt and evolve under institutional pressures such as environmental regulation. According to this theory, an organization’s long-term survival and evolutionary capacity depend on its ability to sense, seize, and transform resources in response to environmental complexity and uncertainty.
In the context of intensifying environmental regulation, manufacturing systems with strong dynamic capabilities can enhance their resilience through a three-stage adaptive cycle:
Sensing: This involves the timely recognition of regulatory signals and market shifts—such as carbon neutrality targets, tightening emission standards, or resource constraints—and initiates an appropriate early response.
Seizing: Upon sensing the pressure, systems must rapidly reconfigure internal and external resources by introducing green technologies, optimizing organizational structures, and reallocating financial capital to seize transformation opportunities.
Transforming: Finally, systems undergo structural evolution by reengineering value chains, upgrading production models, substituting core capabilities, and rebuilding cooperative ecosystems. This ensures institutional compliance and fosters autonomous recovery capacity.
This evolutionary process is time-dependent and inherently dynamic. Its effectiveness is realized not instantaneously but through long-term accumulation and cross-cycle adaptation. High dynamic capabilities enable manufacturing systems to complete a feedback loop of elastic recovery–structural transition–resilience enhancement.
Therefore, dynamic capabilities go beyond static resource allocation; they reflect a system’s strategic ability to self-adjust, accumulate learning, and evolve in high-pressure policy environments. In the context of environmental regulation, dynamic capabilities function through mechanisms such as technology substitution, value chain reconfiguration, and organizational flexibility, thereby enhancing system-level adaptability, multi-path recovery, and structural resilience.
3.2. The Cost Disincentive Effect of Environmental Regulation and Manufacturing Resilience
Within the neoclassical framework of environmental economics, environmental pollution is widely recognized as a typical negative externality, leading to inefficient resource allocation and social welfare losses. Environmental regulation seeks to internalize these external costs through institutional intervention [14], aiming to reconcile environmental protection with economic development. However, from the perspective of manufacturing resilience, such regulations may exert negative effects on system stability and adaptability via various cost-based mechanisms.
On one hand, the Pollution Haven Hypothesis suggests that stringent environmental regulations significantly raise the operating costs of pollution- and energy-intensive firms, prompting them to relocate to regions with more lenient standards [15]. This type of industrial outmigration often causes the temporary hollowing-out of manufacturing capacity in high-regulation areas. In the absence of technological substitution or high-end industrial support, this weakens both structural stability and organizational resilience.
On the other hand, the innovation crowding-out effect implies that increasing regulatory pressure reduces firms’ long-term investments in innovation, capacity upgrading, and organizational renewal. This manifests in three primary ways:
Restricted Entry: Higher regulatory thresholds discourage new market entrants, reduce entrepreneurial activity, and constrain industrial renewal;
Distorted Resource Allocation: Firms under financial stress prioritize compliance spending over strategic investments in R&D, digitalization, and workforce development;
Increased Exit Risk: Facing strict local enforcement, some firms respond by downscaling, altering operations, or exiting the market, thereby reducing the diversity and continuity of the industrial ecosystem [16].
Under the combined effect of these cost-related mechanisms, manufacturing systems may suffer reduced adaptability, weakened recovery capacity, and impaired resilience in response to policy shocks or external disturbances.
Accordingly, we propose the following hypothesis:
H1:
Environmental regulation has a significant dampening effect on manufacturing resilience.
3.3. Mediating Paths of Environmental Regulation to Promote Industrial Autonomy and Control
As a compulsory institutional mechanism, environmental regulation not only constrains firms’ production behavior but also reshapes industrial structure through resource reallocation and regulatory guidance. Under the dual-carbon policy and the ongoing push for green development, environmental regulation is increasingly functioning as a strategic driver of technological upgrading and structural transformation in manufacturing [17].
Enterprises facing dual pressures—external policy mandates and internal transformation needs—tend to strengthen their control over core production processes, overcome technological bottlenecks, and improve system autonomy to support long-term resilience.
On one hand, stricter environmental standards force firms to reallocate R&D investments toward clean energy, green processes, and smart manufacturing technologies. As firms gain control over key components, materials, and algorithms, their exposure to external risks such as supply chain disruptions or technological embargoes is significantly reduced, enhancing structural resilience and recovery capacity.
On the other hand, under the guidance of local industrial policy, manufacturers improve localization capabilities in raw materials, equipment, and process platforms, thus reinforcing the self-sufficiency of the regional industrial system. High levels of autonomy allow manufacturing networks to coordinate resources more effectively, respond flexibly to external shocks, and substitute critical inputs when necessary.
From the perspective of dynamic capabilities, industrial autonomy is not merely a static condition but reflects the system’s ability to evolve and adapt in response to institutional pressures. Through ongoing technological substitution, organizational restructuring, and learning accumulation, firms can develop mechanisms for endogenous adaptation, risk hedging, and strategic flexibility.
Therefore, industrial autonomy is conceptualized as a key mediating variable linking environmental regulation and manufacturing resilience, serving as both a capacity-enhancing and transformation-enabling mechanism.
Accordingly, we propose the following hypothesis:
H2:
Environmental regulation can indirectly enhance manufacturing resilience by improving industrial autonomy.
3.4. Mitigation Mechanisms for Environmental Regulation-Driven Digital Transformation
As digital technologies increasingly drive industrial transformation and sustainable development, environmental regulations have evolved from mere compliance requirements into external pressures that accelerate enterprise digitalization. In the context of “dual-control” energy targets, carbon intensity reductions, and increasingly strict pollutant emission standards, traditional manufacturing firms are under growing pressure from cost burdens and resource allocation constraints. In this context, digital transformation offers a strategic pathway to improve efficiency, reduce environmental risks, and strengthen systemic resilience.
On the one hand, environmental regulation enhances firms’ internal demand for accurate monitoring, intelligent scheduling, and energy efficiency optimization. This incentivizes the deployment of digital infrastructures such as the Industrial Internet, Internet of Things (IoT), and edge computing, enabling real-time data acquisition and the dynamic control of emissions throughout the production process. Through the integration of smart sensors, energy management systems, and green energy platforms, firms can optimize energy use, enhance unit-level efficiency, and reduce environmental exposure in high-pollution segments—thereby reducing marginal compliance costs and improving policy responsiveness.
On the other hand, digital transformation is not merely a technological upgrade but a reconstruction of organizational capabilities. By integrating data flows across key nodes—design, production, logistics, and sales—firms can rapidly adapt to regulatory changes, restructure product lines, restore supply chain flexibility, and refine market strategies. Particularly in high-regulation environments, digitally advanced firms often exhibit greater strategic agility and adaptive resilience, enabling them to achieve synergy between green production and flexible operations via data-driven decision-making systems.
In summary, digital transformation functions as a buffering and transformation mechanism between environmental regulation and manufacturing resilience, enabling the transition from passive compliance to proactive adaptation.
Accordingly, we propose the following hypothesis:
H3:
Environmental regulation can indirectly enhance manufacturing resilience by promoting digital transformation.
In the context of deepening global production fragmentation, many subsectors of China’s manufacturing are highly embedded in global value chains (GVCs). Their structural resilience is shaped not only by domestic regulatory pressures but also by international environmental standards, cross-border compliance requirements, and trade barriers. For export-oriented firms or those situated in mid-to-high-end processing links, environmental regulation may affect partner trust, input sourcing compliance, and order stability—thereby reshaping their adaptive pathways and resilience performance. GVC embeddedness thus functions as both a moderating variable and a potential source of two-way interaction with regulation. Future studies may incorporate indicators such as export concentration or foreign capital dependence to systematically explore the cross-border transmission of regulatory impacts.
3.5. Formulation of Research Hypotheses
Based on the aforementioned theoretical analysis, the mechanism of environmental regulation on the development of manufacturing industry resilience has a dual character: on the one hand, it may inhibit the resilience, adaptability, and structural stability of the manufacturing industry system by increasing the cost of compliance, exacerbating the constraints of resource allocation and structural exit risk. On the other hand, under the effect of moderate regulation and policy incentives, environmental regulation may also indirectly enhance the self-organization ability and dynamic recovery ability of the manufacturing system under the complex external environment by promoting technological innovation, enhancing the control of the industrial chain and promoting the digital transformation and other mechanism paths.
Synthesizing the above analysis, this paper proposes the following three core research hypotheses to be tested:
H1:
Environmental regulations have a significant dampening effect on manufacturing resilience.
H2:
Environmental regulation can indirectly enhance the resilience of manufacturing development by improving the level of industrial autonomy and control.
H3:
Environmental regulation can indirectly enhance the development resilience of the manufacturing sector by promoting its digital transformation.
The above assumptions constitute the theoretical basis for the subsequent empirical identification, mechanism testing, and heterogeneity analysis of this paper. Under this framework, this paper adopts a regional-level manufacturing resilience evaluation index system, combines environmental regulation intensity indicators with multi-source control variables to construct a panel data model, systematically identifies the direct impact of environmental regulation and the intermediary transmission mechanism, and further explores heterogeneity under different institutional environments, enterprise attributes, and regional conditions.
It is worth noting that the relationship between environmental regulation and manufacturing resilience may not follow a strictly linear pattern. At low levels of regulatory intensity, firms may lack sufficient pressure or incentives to undertake structural adaptation. Conversely, excessive regulation may impose heavy compliance burdens that undermine adaptive capacity. Only within a moderate range might regulation stimulate green transformation and enhance resilience—suggesting a potential inverted U-shaped or threshold effect.
4. Data Sources, Variable Setting, and Modeling
4.1. Data Sources
To assess the impact of environmental regulation on manufacturing resilience, this study constructs a balanced panel dataset comprising 287 prefecture-level cities in China over the period 2006–2021. The data combine firm-level information, macroeconomic indicators, patent statistics, and environmental governance metrics, ensuring comprehensive coverage across time and regions.
Firm-level data were obtained from the Tianyancha Professional Edition database, which integrates records from the National Enterprise Credit Information Publicity System and includes over 81.6 million enterprises. It provides fields such as registration date, industry code, and status updates, allowing for the dynamic tracing of manufacturing activity [18]. Invalid entries were removed, and manufacturing-specific samples were aggregated by year and city.
Green innovation indicators were derived from the State Intellectual Property Office (SIPO) and filtered using the Green Technology Classification Catalogue issued by WIPO [19].
Environmental regulation intensity was assessed using three dimensions: (1) Policy Attention: the frequency of environment-related keywords in municipal government work reports, extracted via a Python script and validated manually [20]; (2) Policy Enforcement: the number of environmental legal judgments and administrative penalties sourced from the China Judgement Online and Peking University Faber databases [21]; (3) Pollution Outcomes: emission data for industrial wastewater, sulfur dioxide, dust, and carbon dioxide from regional statistical yearbooks [22].
Macroeconomic variables were collected from CSMAR, Wind, the China Statistical Yearbook, the China City Statistical Yearbook, the China Environmental Statistical Yearbook, and the National Development Zone Report. Linear interpolation was applied to fill missing values where necessary, and cities with excessive data gaps were excluded.
The final dataset consists of 4574 valid observations, forming a robust empirical foundation for this study.
It should be pointed out that the 2006–2021 data window used in this study reflects the typical stage of green transformation of China’s manufacturing industry from the end of the 13th Five-Year Plan to the beginning of the 14th Five-Year Plan. We tried to obtain data for 2022–2023, but because enterprise-level registration information, environmental law enforcement cases, and pollutant emission data have not been fully disclosed in most provinces and cities, and there are changes in statistical caliber, it is not yet possible to build a balanced panel with the same caliber. Therefore, in order to ensure data quality and consistency, this article does not include the latest data. We will continue to expand this research with recent data after the dataset is completed in the future.
4.2. Variable Settings
4.2.1. Explanatory Variables
The data used to construct the manufacturing resilience indicators in this study were primarily obtained from the professional version of Tianyancha, a commercial database that compiles registration records from the National Enterprise Credit Information Publicity System. This dataset includes comprehensive firm-level information from 2006, such as registration dates, status (active, canceled, revoked, etc.), registered capital, enterprise type, and industry classification codes. We filtered manufacturing firms based on industry codes and aggregated the data at the prefecture, city, and year level to generate three key indicators: the number of manufacturing firms, total registered capital, and the proportion of non-individual enterprises. To ensure data reliability, we excluded abnormal records, such as those with de-registered dates earlier than registration, unidentifiable addresses, or invalid operational statuses.
The core explanatory variable in this study is manufacturing resilience at the prefecture-level, which captures the ability of regional manufacturing systems to recover from external shocks, adapt structurally, and maintain sustainable development. Drawing on the definition of Carlos et al., manufacturing resilience refers to a system’s capacity to restore output, reorganize resources, and optimize industrial structure in response to major disruptions [23].
To quantify resilience systematically, we construct a composite indicator based on three enterprise-level dimensions:
The number of registered manufacturing firms (log-transformed), reflecting sectoral vitality and regenerative potential;
Cumulative registered capital in manufacturing, indicating economic scale and resource endowment;
The proportion of non-individual enterprises, such as limited-liability or joint-stock firms, representing organizational maturity and institutional adaptability [24].
Following [25], we apply the entropy weighting method to assign objective weights to each indicator based on their variation and introduce regional GDP as a normalization factor to enhance comparability across cities with different economic baselines. The resulting index (denoted as Y) reflects a region’s capacity for resistance, recovery, and structural robustness.
For robustness analysis, we also construct an alternative proxy variable—the number of newly registered manufacturing firms (log-transformed)—to validate the consistency of the resilience indicator in capturing system activity and renewal capacity. This multi-source composite approach ensures that the resilience measure is stable, objective, and interpretable for policy analysis.
The specific steps are as follows.
Step 1: Construct an initial data matrix.
Step 2: Perform a dimensionless process:
Step 3: Calculate the entropy value:
Step 4: Calculate the weights:
Step 5: Calculate the manufacturing development resilience indicator based on the weights of
In this formula, represents the composite manufacturing resilience score for region j, is the normalized score of the region j for the indicator iii, and denotes the weight of the indicator j, derived using the entropy method. This weighted summation allows us to aggregate multi-dimensional resilience indicators into a single index with enhanced discriminative power. The weight reflects the degree of variability in each indicator: the greater the dispersion is (i.e., the lower the entropy is), the higher the information content is, and thus the larger the assigned weight is—ensuring the final composite index is more responsive to meaningful differences across regions.
In order to make up for the limitations of the manufacturing resilience index in the static dimension, this paper further introduces the “annual volatility of the number of newly registered manufacturing enterprises” as a supplementary measurement indicator. This indicator is used to characterize the volatility, dynamic adjustment ability, and potential resilience of the local manufacturing system in the short term by calculating the standard deviation of the number of newly registered manufacturing enterprises in each prefecture-level city relative to its five-year sliding average. This method focuses on the dynamic entry behavior of enterprises, helps capture changes in institutional sensitivity and economic activity, and enhances the explanatory power of the dynamic resilience of the manufacturing system.
4.2.2. Explanatory Variable: Intensity of Regional Environmental Regulation
This study adopts the environmental regulation intensity at the prefecture-city level as the core explanatory variable, representing the degree of institutional constraint under green development mandates. The existing literature typically measures regulatory intensity through five main approaches: pollutant emissions and abatement metrics; pollution control investment per unit of industrial output; the frequency and severity of environmental laws and enforcement actions; pro-environmental rhetoric in planning documents; and media- or public opinion-based proxies. While valuable, these methods often reflect a single dimension and overlook the full dynamic cycle of policy implementation, potentially introducing bias or measurement error.
In order to overcome the above limitations, this paper constructs a multidimensional comprehensive evaluation system of regional environmental regulation intensity from the three stages of ex/ante-planning, post-implementation, and post-results, as shown in Table 1.

Table 1.
Multi-dimensional comprehensive evaluation index system of environmental regulation.
From both institutional logic and the prior literature, the three-dimensional measurement system adopted in this study—comprising policy text intensity, the number of enforcement cases, and pollution reduction outcomes—corresponds to different stages of regulatory impact: governmental intention, enforcement strength, and policy effectiveness. The inclusion of textual signals captures local governments’ institutional preference and commitment to environmental governance [26]. Judicial enforcement cases reflect the de facto constraints and stringency during policy execution. Finally, pollutant emissions represent the realized governance results. This tri-dimensional system offers a more nuanced and comprehensive reflection of regulatory intensity than conventional single-indicator approaches.
To avoid the measurement bias caused by “single-dimensional indicators”, this paper attempts to adopt a multi-dimensional combination in the design of the environmental regulation indicator system, starting from the three stages of policy formulation (intention), system implementation (behavior), and governance results (effects), to construct a dynamic closed-loop indicator system. These three types of indicators complement each other and can comprehensively characterize the implementation intensity of local environmental policies from institutional advocacy and regulatory intensity to actual emission levels. Although each indicator itself still has a tendency to be simplified, its comprehensive use has enhanced the identification validity and observability of the policy process to a certain extent.
(1) Ex/ante-planning dimension: This involved collecting and text mining the frequency of key words and phrases related to environmental protection in the government work reports of each prefecture-level city, to quantify the intensity of local governments’ attention to environmental governance in their annual policy objectives.
To ensure the validity of the textual policy attention indicator, we manually reviewed the extracted keyword sentences to eliminate irrelevant mentions lacking regulatory significance. Although a theoretical distinction exists between policies and regulations, in the Chinese context, municipal government work reports serve as key official documents outlining annual policy priorities, including environmental governance. These texts often shape budget allocation, target setting, and administrative focus. Therefore, using policy texts as a proxy for regulatory intent is institutionally relevant and has been widely adopted in prior empirical studies.
Several recent empirical studies have adopted local government work reports as effective proxies for measuring policy intent in the domains of environmental governance and regional development. For example, Huang and Chen used keyword frequencies in work reports to assess local governments’ attention to the “dual-carbon” strategy [27]; Zhang et al. analyzed the transmission mechanism of green finance policies using text-based measures [28]; and Cheng and Li applied keyword extraction from policy documents to capture local emphasis on ecological civilization construction [29]. These studies provide solid empirical support for our approach of using textual frequency from work reports as a proxy for environmental regulatory intent.
(2) In-transit dimension: Statistics on the number of environmental protection-related administrative penalty cases and environmental justice cases in each region were collected, reflecting the intensity of the system implemented by the local authorities in the process of policy implementation.
To construct the composite manufacturing resilience index, this study employed the entropy weighting method to assign objective weights to each sub-indicator. The procedure involves several steps: first, range standardization is applied to normalize the raw data; second, information entropy is calculated for each indicator to reflect its dispersion across observations; third, the degree of divergence (or redundancy) is derived to determine the weight of each indicator; finally, a weighted aggregation generates the overall resilience score. The advantage of this method lies in its ability to allocate weights based on the inherent variability of indicators, thereby minimizing subjective bias. In practical terms, indicators with lower entropy (i.e., greater variability across units) are assigned higher weights, reflecting their stronger explanatory power in differentiating manufacturing resilience levels.
It is important to note that the number of environmental judicial rulings does not directly represent the “intensity” of enforcement but rather reflects the “observability” of regulatory actions. This indicator captures how frequently environmental regulations result in documented legal cases, but it does not account for compliant firms that generate no litigation, which could still reflect effective enforcement. It should be made clear that the observability of judicial decisions mainly reflects some situations where “violations are identified and handled by the system” and cannot represent the overall enforcement intensity or compliance status. This study uses it as a dimension to measure the visibility of environmental regulations but does not believe that this indicator can replace or cover all law enforcement activities. It is logically distinguished from the three dimensions of text word frequency and pollutant emissions and provides multi-angle measurements of institutional strength from three aspects: expression of policy intent, results of enforcement behavior, and governance effectiveness. However, in fact, this indicator cannot capture groups of companies that have not been filed but have complied, and its representative limitations need to be further overcome in future research. This approach follows existing research [30], but we explicitly state the conceptual boundaries of this metric to avoid overstating its explanatory power regarding enforcement effectiveness.
It is important to note that a structural time lag may exist between regulatory intent and actual enforcement. The environmental governance priorities stated in government work reports may not be immediately translated into concrete administrative actions or legal cases within the same year. This study does not assume a direct linear causal relationship between policy texts and judicial rulings; rather, the three components are treated as complementary proxies that jointly represent different dimensions of regulatory intensity. To mitigate potential time mismatches across indicators, we further incorporate lagged variables in the robustness analysis, as discussed in Section 5.2.
(3) Post facto dimension: Four pollution indicators, including industrial wastewater emissions per unit, industrial sulfur dioxide emissions, smoke (dust) emissions, and carbon dioxide emissions, are selected to measure the actual effectiveness of the treatment and the level of environmental quality.
It is important to clarify that the four pollution indicators selected in this study—namely, industrial wastewater, sulfur dioxide, smoke (dust), and carbon dioxide emissions—are all explicitly targeted in China’s national environmental regulatory framework. These include key legislative and policy documents such as the Air Pollution Prevention and Control Law, the Water Pollution Prevention and Control Law, and the Guidelines for the Construction of Carbon Peak and Carbon Neutrality Standard Systems. These pollutants have been long included in government-led performance evaluations, emission cap programs, and regional governance targets. Hence, using them as post-regulation indicators of environmental enforcement effectiveness is not only policy-aligned but also theoretically grounded. Their inclusion in the composite index provides a credible basis for assessing the realized impact of regulatory implementation on industrial development and resilience.
For the post-pollution indicators, CO2 emissions were not obtained from direct official city-level data, which is currently unavailable. Instead, we adopted an indirect estimation method based on the approach proposed in relevant studies from the China Emission Accounts and Datasets (CEADs) and urban carbon accounting research. This method uses city-level data on energy consumption (coal, oil, natural gas, and electricity) and industrial structure to calculate CO2 emissions through standard emission factor techniques, ensuring consistency and comparability across cities.
As for the data on environmental penalty cases, we extracted case records from the China Judgement Online and Peking University Law Database. We conducted keyword-based searches for terms such as “environmental administrative penalty” and “pollution control,” and we applied natural language processing to extract judgment dates, case counts, and city-level location identifiers, which were then aggregated to form a proxy indicator for environmental enforcement intensity.
All indicators were normalized and directionally harmonized, with entropy weights assigned to construct an annual composite index of environmental regulation (EnvReg) across all prefecture-level cities from 2006 to 2021. To ensure robustness, we also adopted the method from [31] to build alternative regulation measures based on industrial pollutant discharge intensity and environmental investment ratios, which were later used for robustness checks and comparative analysis.
Step 1: For the positive indicator and the negative indicator , normalize the data:
Step 2: Calculate the entropy value of each indicator:
where k = , and is the weight of the normalized data.
Step 3: Use the entropy weighting formula:
Step 4: Calculate a comprehensive multidimensional evaluation score for environmental regulation:
where is the comprehensive evaluation score of environmental regulation of the ith region in a certain year, is the weight of the indicator, and is the normalized value of the indicator.
4.2.3. Mediating Variables
To identify the indirect effects of environmental regulation through the pathway of capability reconstruction, this study introduces two key mediating variables: the level of industrial autonomy and control and the degree of digital transformation in the manufacturing sector.
The first mediating variable, industrial autonomy, measures the manufacturing system’s foundational capacity in controlling core technologies, substituting key inputs, and pursuing independent innovation. In the context of green transformation, this capacity enables firms to withstand supply chain disruptions and institutional shocks. Following [32], we use the share of invention patent applications in the local manufacturing sector relative to the national total—sourced from the State Intellectual Property Office (SIPO)—as a proxy for technological control and autonomy. This indicator reflects the region’s innovation leadership and its capacity for structural reconfiguration under regulatory pressure.
The second mediating variable, digital transformation, captures firms’ ability to enhance productivity, optimize resource use, and comply with environmental policies through digital technologies [33]. Following prior studies, we extract the proportion of patents in digital-related technologies—such as big data, cloud computing, IoT, and smart manufacturing—filed by the manufacturing sector in each city. A higher share reflects stronger digital capabilities, enabling firms to implement smart responses and flexible production, thereby boosting system resilience.
In order to further identify the path effect of environmental regulation affecting the resilience of manufacturing development through the mediation mechanism, this paper adopts a stepwise regression model to estimate the two types of mediating variables (the level of industrial autonomy and control and the degree of digital transformation), supplemented by the Sobel test and Bootstrap method for the significance and robustness analysis. The mediating effect model is set as follows:
where denotes the resilience of manufacturing development, is the intensity of environmental regulation, denotes the mediating variable (i.e., autonomy or degree of digital transformation), and is the set of control variables.
If are satisfied, it indicates that the mediating effect is significant and environmental regulation can indirectly affect the level of manufacturing toughness through the mediating variable. The Sobel test and Bootstrap sampling method are further used to estimate the significance and confidence interval of the indirect effect to ensure the robustness and statistical explanatory power of the estimation results [34].
4.2.4. Control Variables
To mitigate omitted variable bias and enhance the reliability of model estimation, we incorporate ten control variables that capture key external factors potentially influencing manufacturing resilience. These variables cover dimensions such as economic development, resource allocation efficiency, industrial structure, and institutional context:
- (1)
- Economic Development (EconDev): The log of per capita GDP, reflecting overall economic strength;
- (2)
- Openness to the Outside World (OpenDegree): The ratio of total imports and exports to GDP, indicating international dependence and allocation efficiency;
- (3)
- Government Intervention (Government): The ratio of general public budget expenditure to GDP, representing the extent of fiscal participation in economic activities;
- (4)
- Technological Innovation Capacity (Tech): The log of regional R&D investment, measuring support for industrial upgrading;
- (5)
- Urban Economic Density (Density): The ratio of GDP to administrative land area, capturing spatial efficiency and industrial agglomeration;
- (6)
- Human Capital Level (Human): The ratio of undergraduate and vocational college admissions to the total population, indicating labor force quality and intellectual capital;
- (7)
- Fiscal Investment Intensity (Fiscal): The log of fixed asset investment relative to government expenditure, reflecting long-term public investment willingness;
- (8)
- Industrial Structure Optimization (FDI): The ratio of actual foreign capital utilization to GDP, representing structural upgrading through external capital;
- (9)
- Level of Industrialization (Industrials): The ratio of industrial value added to GDP, indicating the dominance of manufacturing in the regional economy;
- (10)
- Market Openness (MROpen): The log of actual foreign capital utilization, measuring market connectivity and factor mobility.
The inclusion of these control variables helps isolate the true effect of environmental regulation on manufacturing resilience by reducing confounding due to regional heterogeneity and developmental or institutional variation.
To address potential endogeneity, this study employs the “CO2 treatment rate” as an instrumental variable for environmental regulation intensity. This variable is defined as the proportion of industrial CO2 emissions that are treated through clean energy substitution, carbon capture and storage (CCS), or other green technologies. It serves as a proxy for a region’s green governance capacity and technical foundation for carbon mitigation, which is plausibly correlated with regulatory intensity but not directly with manufacturing resilience, thereby meeting the relevance and exclusion conditions for a valid instrument. The data were compiled from the National Development and Reform Commission’s carbon emission datasets, China Energy Statistical Yearbook, and the Clean Production Statistical Bulletin [35].
4.3. Model Construction
In order to empirically test the impact of environmental regulation on the resilience of manufacturing development and its transmission mechanism, this paper constructs a multi-level econometric model system including the benchmark effect model and the mediating effect model and introduces the city fixed effect and time fixed effect to control the unobservable heterogeneity factors.
First, to test the direct effect of environmental regulation on manufacturing resilience (Hypothesis H1), the following benchmark regression model is set up:
where denotes the manufacturing development resilience indicator of the prefecture-level city in the year , denotes the intensity of environmental regulation, is the matrix of control variables, and denote the area fixed effect and time fixed effect, respectively, and is the random disturbance term. If the estimation result of is significant, it verifies that environmental regulation has the direct effect of negatively inhibiting the resilience of manufacturing industry.
Secondly, in order to identify the mediating path mechanism of environmental regulation affecting the resilience of the manufacturing industry, this paper introduces two types of mediating variables: one is the level of industrial autonomy and control (denoted as ), and the other is the degree of digital transformation (denoted as ). We construct the following three-stage mediating effect model:
where denotes the above two types of mediating variables (can be regressed separately), and other symbols have the same meaning as above. If are satisfied at the same time, it indicates that the mediating effect is significant, and environmental regulation can indirectly affect the toughness level of manufacturing industry through the mediating mechanism.
To address potential endogeneity concerns—such as reverse causality or omitted variable bias—between environmental regulation and resilience, we further apply two-stage least squares (2SLS) estimation to enhance causal inference and ensure theoretical alignment with Section 3.
Specifically, we use regional CO2 treatment rates as an instrumental variable. This metric reflects the administrative pressure to meet upper-level emission targets, making it strongly correlated with environmental regulation intensity. However, it is largely determined by macro-level energy structure and thus unlikely to directly affect manufacturing resilience, satisfying the exclusion restriction. This instrumental design aligns closely with our theoretical framework of “institutional constraint–capability restructuring–system response”.
In sum, the baseline estimation uses panel fixed-effects models, while 2SLS regressions provide a robustness check against endogeneity. This methodological design strengthens the internal validity and theoretical consistency of our empirical analysis.
To ensure consistency between the theoretical mechanism and empirical identification strategy, this paper explicitly adopts a mediation effect model to examine how environmental regulation indirectly affects manufacturing resilience through two key mediating variables: the level of industrial autonomy and the degree of digital transformation. Unlike a moderation model, which tests interaction effects, the mediation model focuses on uncovering the transmission mechanism between the independent and dependent variables.
Following the classical approach proposed by Baron and Kenny (1986) [36], we employ a three-step regression method to test for mediation effects, complemented by the Sobel test and Bootstrap resampling to assess the statistical significance and confidence intervals of the indirect pathways. It is important to emphasize that we do not include interaction terms or moderation effects in our model. Therefore, there is no actual confusion between mediation and moderation models in the design. Any prior ambiguities in terminology have been corrected in this revision to ensure methodological precision and theoretical coherence.
4.4. Descriptive Statistics of Variables
Before carrying out the empirical analysis, this paper first conducted descriptive statistical analysis of the main variables to understand the distribution characteristics of the sample data, the degree of dispersion, and the value intervals between the variables, which provided the basis for the subsequent modeling. Table 2 shows the basic statistics such as sample capacity, mean, standard deviation, the minimum and maximum values of the explained variables, explanatory variables, mediating variables, and control variables.
Table 2.
Descriptive statistical results of variables.
From the point of view of the explanatory variables, the mean value of the manufacturing development toughness (Resilience) is 3.671, and the standard deviation is 0.741, indicating that there is a certain degree of regional differences in the toughness performance of the sample as a whole, with the minimum value of 0 and the maximum value of 8.807. This indicates that some prefectural-level cities have significantly higher structural stability and resilience, while others face weaker adaptive capacity and industrial resilience, reflecting the unevenness of China’s regional manufacturing resilience development.
In terms of explanatory variables, the mean value of environmental regulation intensity (EnvReg) is 0.631, and the standard deviation is 0.574, with a wide range of values (the minimum value is 0, and the maximum value is 20.334), which indicates that there are significant differences in the level of environmental regulation among prefectural-level cities in China. Further decomposition of the three dimensions can be seen: ex/ante-regulatory attention (EnvReg1) has a mean value of 0.520, indicating that most regional governments in the work report expressed a medium level of environmental protection concerns; post-regulation (EnvReg2) shows large fluctuation (standard deviation of 4.808), indicating that the environmental law enforcement efforts in the inter-regional area are strongly imbalanced; post-regulation (EnvReg3) has a mean value of 0.627, indicating that the level of environmental regulations between prefecture-level cities is significantly different and indicating that most cities have achieved certain governance effects in controlling pollutant emissions, but there are also some areas where the emission level is still high.
As for the mediating variables, the mean value of the level of industrial autonomy and control (Rica) is 0.291, and the maximum value reaches 4.521, indicating that some cities are outstanding in manufacturing core technological innovation and autonomy and control; the mean value of the degree of digital transformation (digital) is 1.121, the standard deviation is 1.273, and the maximum value is close to 10, reflecting the fact that some cities already possess stronger digital foundations and smart manufacturing capabilities, but there is still more room for improvement overall.
Among the control variables, the mean value of the economic development level (EconDev) is 10.488, showing a better concentration trend; scientific and technological innovation capacity (Tech) and market openness (MROpen) also show structural differences among regions. The volatility of variables such as urban economic density (Density), human capital (Human), and financial investment strength (Fiscal) further illustrates the heterogeneous characteristics of China’s cities in terms of economic structure, resource endowment, and development mode.
Overall, the core variables have good numerical identification and dispersion, which provides strong support for the significance of the coefficients and mechanism identification in the subsequent regression analysis. At the same time, the distribution of different variables also confirms the different characteristics of China’s regional manufacturing development in terms of resilience level and environmental policy implementation.
5. Empirical Analysis
5.1. Baseline Regression Analysis
Table 3 reports the results of the benchmark regression assessing the impact of environmental regulation on the resilience of manufacturing development. Four dimensions of regulation are examined: ex/ante-policy attention, ex/ante-enforcement intensity, post-pollution control outcomes, and overall regulatory intensity.
Table 3.
Benchmark regression analysis.
Across all model specifications, environmental regulation is significantly negatively associated with manufacturing resilience at the 1% level. This finding robustly supports Hypothesis H1 and suggests that, under the current policy framework, environmental regulation imposes systemic constraints on manufacturing development across the entire regulatory process.
In particular, the coefficients for ex/ante-regulation—proxied by the frequency of environmental discourse in local government reports—are significantly negative, indicating that stronger policy signaling may increase firms’ compliance costs and institutional uncertainty. Similarly, ex/ante-enforcement intensity, measured by the frequency of environmental penalties, negatively affects resilience due to the immediate financial and operational burden placed on firms.
Post-regulation, reflected by actual pollutant emission levels, is also negatively correlated with resilience. This implies that firms reallocating resources to meet end-of-pipe compliance requirements may compromise investments in flexibility and long-term adaptability.
Regarding control variables, we observe that both economic development level and market openness exert significant negative effects on resilience. This may reflect resource depletion, pollution accumulation, and increased exposure to global volatility and environmental trade barriers.
The rightmost column reports the weights of each indicator, derived from the entropy method. These weights reflect the relative importance of each variable in constructing the composite resilience index. A higher weight indicates greater variability across cities, suggesting that the indicator contains more information and has a stronger impact on the overall resilience score.
Taken together, the results consistently demonstrate a suppressive effect of environmental regulation on manufacturing resilience, validating Hypothesis H1.
5.2. Robustness and Endogeneity Tests
To ensure the robustness and causal validity of the baseline findings, this section conducts extended empirical analyses addressing both potential endogeneity concerns and model robustness. The detailed results are presented in Table 4.
Table 4.
Robustness test.
(1) Lagged variable test:
Considering the potential time lag between the implementation of environmental regulation and its impact on manufacturing dynamics, we included the one-period lagged environmental regulation variable into the baseline regression. The estimated coefficient remained significantly negative (−4.0157; t = −3.72; p < 0.01), indicating that the core conclusion is not driven by contemporaneous feedback effects and remains stable across dynamic specifications.
The use of lagged variables not only helps capture the dynamic effects of environmental regulation but also addresses the structural time mismatch that may exist between regulatory intent and actual enforcement. For example, policy commitments outlined in government work reports typically require a temporal transition before they are institutionalized into enforceable rules or actions. By incorporating lagged terms in our model specification, we aimed to reduce the temporal inconsistency across different regulatory dimensions and enhance the internal consistency of our empirical framework.
(2) Instrumental variable estimation (2SLS):
To further address the potential issue of reverse causality, we adopted the regional CO2 treatment rate as an instrumental variable for environmental regulation intensity and applied a two-stage least squares (2SLS) estimation approach.
In the first-stage regression, the CO2 treatment rate showed a strong and significant association with environmental regulation intensity, with an F-statistic well above the critical threshold (F = 38.75), effectively ruling out weak instrument concerns.
In the second-stage regression, the estimated coefficient of environmental regulation was still significantly negative (−1.1754; t = −3.98; p < 0.01), confirming the causal effect.
While we acknowledge that the CO2 treatment rate may be indirectly correlated with long-term regional industrial conditions, it primarily reflects historical infrastructure investment in emission control, which evolves exogenously relative to short-term fluctuations in manufacturing resilience. Therefore, its application as an instrumental variable is theoretically plausible and empirically supported.
(3) Alternative variable construction:
To examine whether the conclusions are sensitive to measurement choices, we replaced the original environmental regulation index with the logarithm of regional green patent applications as a proxy. The coefficient remained significantly negative (−0.0452; t = −3.57; p < 0.01), confirming the robustness of the conclusions.
(4) Outlier adjustment:
After trimming the top and bottom 1% of all variables to reduce the impact of outliers, the main effect remained stable and statistically significant (−0.2905; t = −14.76), suggesting that extreme values do not materially affect the estimation.
(5) Exclusion of special samples:
To control for potential structural heterogeneity, the four municipalities (Beijing, Shanghai, Tianjin, Chongqing) were excluded from the sample. The estimated coefficient remained consistent (−2.3266; t = −36.82), demonstrating that the findings are not driven by data from atypical regions.
(6) Alternative estimation method:
We also adopted a fixed-effects weighted regression model (reghdfe) to account for unobserved heterogeneity more precisely. The coefficient of environmental regulation remained negative and significant (−0.2904; t = −14.76), reinforcing the reliability of the benchmark results.
(7) Reflection on model structure and future improvement:
The current empirical framework adopts a linear specification to identify mediating mechanisms. As noted in Section 3, although this is consistent with existing theoretical models, we acknowledge the potential existence of nonlinear or threshold effects in the impact of environmental regulation. While this paper does not yet incorporate panel threshold or segmented regression models due to complexity and space limitations, we fully recognize this as a critical direction for future research. Follow-up studies will further explore whether environmental regulation exhibits inflection points in its influence on resilience transmission mechanisms.
In the robustness test, this paper used the “annual volatility of the number of newly registered manufacturing enterprises” as an alternative dependent variable for resilience to re-estimate the benchmark model. The results show that the regression coefficient of environmental regulation under this indicator is consistent with that in the main model and is still statistically significant. This shows that the core conclusion of the article is highly robust to the indicator selection and verifies that the proposed mechanism is stable under various definitions of resilience.
In conclusion, across multiple robustness checks—including lagged specification, instrumental variable estimation, variable substitution, outlier treatment, sample exclusion, and alternative estimation strategies—the negative relationship between environmental regulation and manufacturing resilience remains consistently significant. These findings provide strong empirical support for Hypothesis H1 and reinforce the theoretical framework presented in earlier sections.
5.3. Tests for Mediating Effects
To further clarify the mechanism through which environmental regulation affects manufacturing resilience, this study followed the mediation analysis framework rather than a moderation model, strictly adhering to the logic of causal pathway testing. We introduced two mediating variables—industrial autonomy and digital transformation—to identify the indirect effects of environmental regulation. Following the classical three-step regression approach proposed by Baron and Kenny (1986) [36], we conducted stepwise regressions and apply Sobel tests as well as Bootstrap sampling to verify the significance and statistical robustness of the indirect effects. The estimation results are reported in Table 5.
Table 5.
Mediation effect test.
(1) Mediating effect of industrial autonomy
The results in Column (1) show that environmental regulation significantly promotes industrial autonomy (coefficient = 1.117; p < 0.01), and in turn, higher levels of autonomy significantly improve manufacturing resilience (Sobel interaction coefficient = 0.182; Z = 7.025; p < 0.01), supporting Hypothesis H2.
This finding indicates that although environmental regulation increases compliance costs, it also creates incentives for firms to enhance their control over core technologies and production links. Such improvements increase their ability to adjust structurally, reconfigure resources, and maintain operational stability under external shocks. In this sense, industrial autonomy acts as an endogenous “buffer mechanism” enhancing the system’s resilience.
(2) Mediating effect of digital transformation
As shown in Column (2), environmental regulation has a significant positive effect on digital transformation (coefficient = 0.459; p < 0.05). Digital transformation also significantly contributes to resilience (Sobel interaction coefficient = 0.753; Z = 2.064; p < 0.05), confirming Hypothesis H3.
This mechanism suggests that digital transformation enables real-time monitoring, intelligent resource allocation, and flexible production scheduling. These capabilities are critical for improving regulatory compliance at lower costs while strengthening systemic resilience and innovation capacity.
(3) Integrated interpretation of direct and indirect effects
Together with the confirmed negative direct effect of environmental regulation on resilience (as verified in Section 5.1), the above mediation paths highlight a dual impact mechanism: environmental regulation may suppress resilience in the short term through compliance costs but can simultaneously foster long-term adaptive recovery via capacity restructuring.
Therefore, policymakers should go beyond command-and-control regulation and simultaneously implement innovation subsidies, digital infrastructure support, and differentiated policy incentives. This will help manufacturers turn compliance pressure into a catalyst for transformation, achieving a synergy between green development and industrial resilience.
5.4. Heterogeneity Analysis
5.4.1. Heterogeneity Analysis of Regional Environmental Regulatory Intensity
To assess the differentiated impact of environmental regulation under varying institutional conditions, we divided the sample into high- and low-regulation groups using the median value of the ratio of industrial pollution control investment to industrial added value, following the previous literature [37,38]. The regression results are reported in Table 6.
Table 6.
Heterogeneity analysis results.
In high-regulation regions, environmental regulation exerts a significant negative effect on manufacturing resilience (p < 0.01), indicating that stricter-compliance environments are associated with reduced adaptability and structural stability. By contrast, in low-regulation regions, the effect is statistically insignificant, suggesting that moderate regulatory pressure may not substantially disrupt industrial dynamics.
This evidence supports the existence of heterogeneous effects based on regulatory intensity and confirms that policy stringency plays a critical role in shaping manufacturing resilience outcomes.
5.4.2. Heterogeneity Analysis of Manufacturing Firm Types
To further investigate how different types of manufacturing firms respond to environmental regulation, we used the Chinese Industrial Enterprise Database to categorize enterprises into two groups: individual industrial and commercial businesses and non-individual firms (e.g., limited-liability or joint-stock enterprises). We performed group-specific regressions, and the results are shown in Table 6.
The results reveal that environmental regulation has no statistically significant effect on the resilience of individual businesses. This likely stems from their relatively small operational scale, limited emissions, and low capital intensity, which often place them outside the strict enforcement scope of environmental policies. Additionally, their high flexibility and loose organizational structure allow them to rapidly adjust operations—for example, by downsizing, shifting business focus, or even suspending operations temporarily—to evade regulatory costs. This “adaptive buffering mechanism” enables them to maintain operational stability amid regulatory shocks and reflects their decentralized, small-scale, and high-frequency survival strategy.
By contrast, non-individual firms show a significantly negative response to environmental regulation at the 1% significance level. These enterprises generally have larger production capacity, more rigid organizational structures, and face stricter compliance requirements. They must absorb not only direct costs of environmental governance (e.g., pollution control technologies) but also institutional burdens related to external audits, legal reviews, and public accountability. Their limited flexibility and higher exposure to regulatory enforcement reduce their structural adaptability and weaken their system-wide resilience under pressure.
In summary, enterprise type plays a critical moderating role in shaping the resilience outcomes of environmental regulation. Individual businesses rely on flexible adjustment strategies to buffer against policy shocks, while non-individual firms bear the primary burden of institutional pressure. These findings suggest that green policy frameworks should account for firm heterogeneity and adopt differentiated regulatory approaches. Tailored support policies and layered enforcement mechanisms can help balance green transformation goals with the structural resilience of diverse industrial entities.
5.4.3. Heterogeneity Analysis of the Manufacturing Industry
To explore how industrial characteristics moderate the impact of environmental regulation, this study adopted the classification method proposed by Liu Hang et al., dividing manufacturing industries into two groups—sanctioned industries and non-sanctioned industries—based on their exposure to U.S. tariff actions between 2018 and 2021. Industries with a higher proportion of sanctioned products in total imports were categorized as sanctioned, typically involving high-tech and strategic sectors.
The regression results in Table 6 show that environmental regulation has a significantly negative effect on the resilience of non-sanctioned industries, whereas the effect for sanctioned industries is statistically insignificant. This suggests substantial heterogeneity in how regulatory policies affect different industrial sectors.
For non-sanctioned industries, the significant inhibitory effect may stem from their relatively lower levels of technological accumulation, limited innovation capabilities, and weaker institutional support. These sectors, often concentrated in traditional or resource-intensive domains, lack the structural flexibility and internal dynamic capabilities to buffer the cost shocks imposed by stringent environmental policies. In the absence of targeted policy compensation or supportive mechanisms, such industries are more vulnerable to compliance burdens, resulting in declining adaptability and structural responsiveness under regulatory pressure.
Conversely, sanctioned industries—which tend to be concentrated in high-tech, strategic, and innovation-intensive fields—exhibit greater resilience to environmental regulation. These sectors often receive strong government support under industrial policies like Made in China 2025 and have already built a foundation of technological redundancy, innovation pipelines, and diversified production strategies. In fact, facing the “dual pressure” of environmental constraints and external sanctions, these industries are more likely to respond proactively, leveraging green transformation as an opportunity for capability upgrading and value chain restructuring. This produces a potential “innovation compensation effect,” mitigating the negative impacts of regulatory pressure.
In summary, industry-specific factors—such as technological maturity, innovation potential, and policy orientation—are key determinants of how manufacturing sectors respond to environmental regulation. While non-sanctioned industries are more susceptible to regulatory burden due to structural rigidity, sanctioned industries demonstrate higher adaptation capacity under complex constraints. These findings imply that policymakers should avoid uniform regulatory enforcement and instead implement industry-specific governance frameworks, providing additional transformation support to vulnerable sectors while leveraging the adaptive strengths of strategic industries to promote dual goals of green transformation and industrial resilience.
5.4.4. Analysis of Regional Heterogeneity
To assess how the level of regional development moderates the effect of environmental regulation on manufacturing resilience, we divided the national sample into three conventional geographic regions, eastern, central, and western China, based on [36]. Table 6 reports the regression results for each subgroup.
The results show that environmental regulation has a significant negative impact on the resilience of the manufacturing sector in eastern China (p < 0.01), while the effects are statistically insignificant in the central and western regions. This reflects clear spatial heterogeneity in the way regulatory pressure affects industrial systems.
In the eastern region, higher economic development, more mature industrial ecosystems, and stricter regulatory enforcement create an institutional environment where environmental policies tend to be implemented more rigidly. Firms in this region are subject to higher compliance costs due to elevated standards, more frequent inspections, and tighter emissions limits. Furthermore, the region’s deep integration into global value chains and exposure to green trade barriers elevate operational complexity, making it harder for enterprises to absorb policy shocks. Although these firms may possess stronger technological capabilities, the cumulative burden of green compliance and external competition may compress their room for strategic restructuring, weakening their short-term resilience and dynamic adjustment capacity.
In contrast, central and western regions, which are still in earlier stages of industrial development, tend to have looser enforcement and more flexible governance structures. Many manufacturing firms in these areas operate within relatively lower regulatory thresholds, or benefit from subsidies, delayed enforcement, or policy tolerance aimed at promoting regional economic catch-up. Moreover, the dominant industries in these regions are often less capital-intensive and more labor-driven, allowing for greater internal adjustment through organizational flexibility and cost-based adaptation. As a result, environmental regulation in these regions exerts a more muted effect on manufacturing resilience.
This regional divergence underscores the importance of tailoring environmental policies to local development contexts. In areas like eastern China, regulatory frameworks should balance enforcement intensity with innovation support and transition incentives, to avoid undermining systemic resilience. In central and western China, meanwhile, it is critical to gradually elevate policy stringency in parallel with capacity-building, to prevent long-term environmental lock-in while safeguarding industrial stability.
In conclusion, regional differences in institutional environments, industrial maturity, and enforcement practices significantly shape the resilience response of manufacturing systems to environmental regulation. A more regionally adaptive policy strategy—one that emphasizes differentiated governance and staged regulatory upgrading—will be essential for achieving both green development and robust industrial resilience nationwide.
6. Conclusions and Policy Recommendations
Against the backdrop of China’s “dual-carbon” strategy and high-quality development goals, clarifying the impact mechanism and heterogeneous effects of environmental regulation on manufacturing resilience holds strong theoretical and policy relevance. Based on panel data covering 287 prefecture-level cities in China from 2006 to 2021, this study constructed a multidimensional index system for both environmental regulation intensity and manufacturing resilience, and empirically examined the overall impact, underlying mechanisms, and contextual heterogeneity. The main conclusions are as follows:
(1) Environmental regulation generally has a significant inhibiting effect on the resilience of manufacturing development. Whether measured by ex/ante-policy attention, post-enforcement intensity, or final pollution control outcomes, stronger regulation consistently reduces the adaptive capacity and systemic resilience of local manufacturing sectors. This negative effect remains robust across multiple specifications, suggesting that China’s current regulatory framework may impose short-term structural cost pressures on industrial systems.
(2) From a mechanism perspective, environmental regulation indirectly influences resilience via “capability reconfiguration” pathways. On one hand, appropriately designed regulation can stimulate enterprises to enhance autonomy and core technology control, thereby improving adaptive flexibility. On the other hand, digital transformation serves as an effective means of cost control and regulatory compliance, enhancing production efficiency and systemic resilience. Both mediating paths exhibit statistically significant effects, implying that structural upgrading is possible under regulatory pressure.
(3) From a heterogeneity perspective, the effect of environmental regulation shows clear differentiation across regions, firm types, and industries. Regions with more intense regulation, particularly the eastern region, exhibit stronger negative responses. Non-individual enterprises—due to their size and rigidity—are more affected than individual businesses. Moreover, traditional manufacturing sectors are more vulnerable to regulatory constraints, while sanctioned industries supported by policy and technology show stronger adaptability under dual external pressures.
(4) Importantly, this paper finds initial evidence of a nonlinear and conditionally constrained relationship between regulation and resilience. While high-intensity regulation may suppress resilience, moderate regulation—especially when combined with innovation capacity or digital infrastructure—can act as a driver of transformation. This suggests the presence of a threshold or U-shaped relationship, where the net impact of regulation depends on a region’s absorptive capacity, technological endowment, and institutional flexibility. Future empirical work should more explicitly model this potential nonlinearity to provide precise policy guidance.
Based on the above findings, the paper offers the following policy recommendations:
(1) Promote a more flexible and tiered environmental regulatory system. Policymakers should avoid a rigid, one-size-fits-all approach that imposes undue pressure on vulnerable sectors. Regulatory frameworks should incorporate regional, industrial, and firm-level differences, implementing a “classified regulation + dynamic adjustment” model to improve responsiveness and policy precision.
(2) Strengthen industrial autonomy and core technological capability. Governments should integrate the enhancement of technological sovereignty into environmental policy goals by offering subsidies, tax relief, and R&D support to help firms convert regulatory compliance into innovation incentives.
(3) Systematically advance digital infrastructure in the manufacturing sector. Given rising compliance costs, digital transformation should be treated as a strategic lever for boosting industrial resilience. Support should be provided for smart factories, data governance systems, and industrial internet applications to optimize cost structures and enhance governance capabilities.
(4) Build a resilience-oriented green governance performance system. Policymakers should incorporate resilience-related indicators (e.g., autonomy rate, substitution capacity, digitalization level) into environmental assessment systems for local governments, shifting the focus from “results-oriented” to “structure-oriented” evaluation frameworks to better align environmental goals with industrial sustainability.
(5) Beyond government policy design, manufacturing enterprises should also proactively build their internal coping capacity and adaptive mechanisms. Specifically, firms are encouraged to
Develop internal environmental information systems and compliance response protocols;
Invest in green technologies and digital infrastructure;
Enhance control over core technologies and foster endogenous innovation to restructure production modes and resource allocation.
(6) Lastly, this study acknowledges that the current resilience index—based on enterprise registration data, capital scale, and organizational structure—still reflects a static dimension. Future studies should incorporate micro-level indicators such as energy efficiency, carbon intensity per unit output, recovery time from disruptions, and order fulfillment dynamics to capture the full spectrum of dynamic manufacturing resilience.
In summary, green regulation and manufacturing resilience is not a simple linear conflict but a complex interactive system that can be reconciled through institutional innovation, technological support, and structural optimization. Only by embedding the governance concept of “development resilience” in the system design can we realize the synergy between the construction of a strong manufacturing country and the goal of ecological civilization.
Future research can further introduce micro-level data such as energy consumption efficiency, carbon emission intensity per unit of output, changes in order fulfillment cycles, and the speed of resumption of work, in order to more comprehensively portray the multidimensional resilience of the manufacturing system. In addition, this article’s research also has some shortcomings. The current indicator system still cannot fully cover the dynamic matching between policy content and emission governance. Future research will further introduce micro-policy text analysis, the identification of specific pollutant types, etc., to improve the responsiveness and explanatory power of the indicator system. Although this study has introduced “registration volatility” to enhance the dynamics of resilience indicators, there is still room for further improvement. For example, due to the lack of high-frequency micro data, we have not been able to include indicators with more behavioral response characteristics, such as the actual recovery cycle of enterprises, the rate of capacity recovery, and energy efficiency. Future research can explore the integration of multi-dimensional data such as taxation, electricity consumption, and environmental protection equipment commissioning to build a more operational dynamic resilience measurement system to comprehensively capture the recovery path and adaptability of the manufacturing system after the shock. In addition, while our empirical analysis adopts a linear framework, future studies may build upon this by incorporating nonlinear modeling approaches to test for potential threshold effects or inverted U-shaped relationships. For example, Hansen’s panel threshold regression method can be employed to identify critical intensity points where the impact of regulation on resilience shifts. Lastly, future research will gradually expand the sample period to 2022 and beyond, provided that the pace of data release permits this, to cover new features in the context of manufacturing recovery and deepening of the “dual-carbon” policy in the post-epidemic period.
Author Contributions
Data curation, X.Y. and Z.W.; Formal analysis, X.Y.; Funding acquisition Q.L. and W.L.; Investigation, X.Y. and K.Z.; Methodology, W.L.; Project administration, Q.L.; Resources, X.Y.; Software, X.Y. and Z.W.; Supervision, Q.L. and W.L.; Visualization, X.Y. and Y.Z.; Writing—original draft, X.Y.; Writing—review and editing X.Y. and Q.L. All authors have read and agreed to the published version of the manuscript.
Funding
This research was funded by Major Projects of Fujian Social Science Research Baser. [FJ2023JDZ028]. And the APC was funded by Special Fund Project of the Fujian Provincial Department of Finance [Fujian Finance Allocation Instruction in 2021 No. 848] [Fujian Finance Allocation Instruction in 2024 No. 900].
Institutional Review Board Statement
Not applicable.
Informed Consent Statement
Not applicable.
Data Availability Statement
All raw data contained in this study can be provided on request based on editorial needs. If in doubt, please consult the corresponding author.
Conflicts of Interest
The authors declare no conflicts of interest.
References
- Guo, F.; Sulaiman, N.; Karim, Z.A.; Sieng, L.W. Innovation, industrial structure upgrading, and environmental regulation: A literature review on drivers of high-quality economic development in China. J. Ecohumanism 2024, 3, 8117–8130. [Google Scholar]
- Shen, L.; Fan, R.; Wang, Y.; Yu, Z.; Tang, R. Impacts of environmental regulation on the green transformation and upgrading of manufacturing enterprises. Int. J. Environ. Res. Public Health 2020, 17, 7680. [Google Scholar] [CrossRef] [PubMed]
- Gong, M.; You, Z.; Wang, L.; Cheng, J. Environmental regulation, trade comparative advantage, and the manufacturing industry’s green transformation. Int. J. Environ. Res. Public Health 2020, 17, 2823. [Google Scholar] [CrossRef] [PubMed]
- Xie, R.; Teo, T.S.H. Green technology innovation, environmental externality, and industrial upgrading in China. Technol. Forecast. Soc. Change 2022, 184, 122020. [Google Scholar] [CrossRef]
- Du, K.; Cheng, Y.; Yao, X. Environmental regulation, green innovation, and industrial structure: Evidence from Chinese cities. Energy Econ. 2021, 98, 105247. [Google Scholar] [CrossRef]
- Wei, L.; Zhang, H. How environmental regulations affect the efficiency of green technology innovation. Am. J. Ind. Bus. Manag. 2020, 10, 507–521. [Google Scholar] [CrossRef]
- Gong, Q.; Wang, X.; Tang, X. How can the development of digital economy empower green transformation of manufacturing? Sustainability 2023, 15, 8577. [Google Scholar] [CrossRef]
- Wang, C.; Liu, X.; Li, Y. Exploring dynamic capability drivers of green innovation at different digital transformation stages. Sustainability 2024, 16, 5666. [Google Scholar] [CrossRef]
- Yin, S.; Zhang, N.; Ullah, K.; Gao, S. Enhancing digital innovation for green manufacturing: A PSR system framework. Systems 2022, 10, 72. [Google Scholar] [CrossRef]
- Zhu, X.; Zuo, X.; Li, H. Dual effects of heterogeneous environmental regulation on green innovation in steel enterprises. Ecol. Econ. 2021, 188, 107113. [Google Scholar] [CrossRef]
- Sun, Q.; Wang, Z.; Sun, Y.; Huang, X. Can digital transformation promote green innovation? Evidence from China. PLoS ONE 2024, 19, e0298191. [Google Scholar]
- Du, J.T.; He, J.F.; Gu, Q.N. The Promotion Effect of Digital Transformation on the DevelopmentResilience of Manufacturing Industry. Sci. Technol. Prog. Policy 2025, 1–12. [Google Scholar]
- Liu, J.; Zhao, Q. Mechanism testing of green transformation of industry by digital economy in China. Front. Environ. Sci. 2024, 11, 1292795. [Google Scholar] [CrossRef]
- Yang, J.; Zuo, Z.; Li, Y.; Guo, H. ESG performance, environmental regulation and green innovation. J. Environ. Manag. 2024, 372, 123244. [Google Scholar] [CrossRef]
- Hu, D.; Jiao, J.; Tang, Y.; Han, X.; Sun, H. GVC position and green technology innovation efficiency: A perspective of environmental regulation. Ecol. Indic. 2021, 121, 107195. [Google Scholar] [CrossRef]
- Ying, L.; Li, M.; Yang, J. Regional green innovation in intelligent manufacturing. Environ. Technol. Innov. 2021, 22, 101398. [Google Scholar] [CrossRef]
- Martin, R. Regional economic resilience, hysteresis and recessionary shocks. J. Econ. Geogr. 2012, 12, 1–32. [Google Scholar] [CrossRef]
- Fingleton, B.; Garretsen, H.; Martin, R. Resilience and regional dynamics: Towards a new analytical framework. Camb. J. Reg. Econ. Soc. 2012, 5, 3–21. [Google Scholar]
- Gong, M.; Lema, R. The Green and Digital Transition in Manufacturing Global Value Chains. 2023. Available online: https://unctad.org/system/files/non-official-document/tir2023_background1_en.pdf (accessed on 30 March 2025).
- Tian, Y.; Feng, C. The heterogeneous impact of environmental regulation on urban green scale economy: An empirical analysis based on city-level panel data in China. Environ. Sci. Pollut. Res. 2021, 28, 48392–48407. [Google Scholar] [CrossRef]
- Fan, F.; Lian, H.; Liu, X.; Wang, X. Can environmental regulation promote urban green innovation efficiency? An empirical study based on Chinese cities. J. Clean. Prod. 2020, 287, 125060. [Google Scholar] [CrossRef]
- Jia, L.; Hu, X.; Zhao, Z.; Zhou, T.; Liu, W.; He, B. The impact of digitization on green innovation performance: Evidence from 228 prefectural-level cities in China. Complexity 2022, 2022, 9442902. [Google Scholar] [CrossRef]
- Peng, R.; Zeng, B. Digital financial inclusion and inclusive green growth: Evidence from China’s green growth initiatives. Int. J. Financ. Stud. 2024, 13, 2. [Google Scholar] [CrossRef]
- Zhang, X.; Wu, X.; Zhou, W.; Fu, N. Research on the green innovation effect of digital economy network: Empirical evidence from the manufacturing industry in the Yangtze River Delta. Environ. Technol. Innov. 2024, 34, 103595. [Google Scholar]
- Jiang, J.; Hu, Z.; Zhang, L. Environmental Governance Attention in Local Government Work Reports: Evidence from Textual Analysis. China Environ. Sci. 2020, 40, 3157–3165. [Google Scholar]
- Huang, Y.; Chen, Z. Local Government Attention to the Dual Carbon Strategy: A Textual Analysis Based on Work Reports. J. Clean. Prod. 2022, 347, 131259. [Google Scholar]
- Zhang, H.; Liu, J.; Wang, Y. Green Finance Policy and Its Spatial Transmission: Evidence from Text Analysis of Government Documents. Environ. Econ. Policy Stud. 2021, 23, 789–808. [Google Scholar]
- Cheng, L.; Li, M. Quantifying Local Ecological Governance Priorities Using Text Mining of Policy Documents. Ecol. Indic. 2020, 113, 106208. [Google Scholar]
- Li, X.; Zhou, J.; Huang, J. Measuring the Observability of Local Environmental Enforcement and Its Effects on Pollution Control. J. Environ. Econ. Res. 2020, 5, 45–62. [Google Scholar]
- Meng, Y.; Liu, L.; Ran, Q. Can urban green transformation reduce the urban-rural income gap? Sustainability 2022, 14, 16350. [Google Scholar] [CrossRef]
- Liu, B.; Wang, J.; Li, R.; Peng, L.; Mi, L. Achieving carbon neutrality—The role of heterogeneous environmental regulations on urban green innovation. Front. Ecol. Evol. 2022, 10, 923354. [Google Scholar] [CrossRef]
- Wang, X.; Wang, S.; Zhang, Y. The impact of environmental regulation and carbon emissions on green technology innovation: Empirical evidence from urban agglomeration in China. Sustainability 2022, 14, 5381. [Google Scholar] [CrossRef]
- Feng, Y.; Wang, X.; Du, W.; Wu, H.; Wang, J. Effects of environmental regulation and FDI on urban innovation in China: A spatial Durbin econometric analysis. J. Clean. Prod. 2019, 235, 210–224. [Google Scholar] [CrossRef]
- Liu, J.; Wang, H.; Ho, H.; Huang, L.-P. Impact of heterogeneous environmental regulation on manufacturing sector green transformation and sustainability. Front. Environ. Sci. 2022, 10, 938509. [Google Scholar] [CrossRef]
- Zhou, X.; Yu, Y.; Yang, F.; Shi, Q. Spatial-temporal heterogeneity of green innovation in China. J. Clean. Prod. 2020, 282, 124464. [Google Scholar] [CrossRef]
- Baron, R.M.; Kenny, D.A. The moderator-mediator variable distinction in social psychological research: Conceptual, strategic, and statistical considerations. J. Pers. Soc. Psychol. 1986, 51, 1173–1182. [Google Scholar] [CrossRef]
- Zhou, R.; Zhang, Y.; Gao, X. The spatial interaction effect of environmental regulation on urban innovation capacity: Empirical evidence from China. Int. J. Environ. Res. Public Health 2021, 18, 4470. [Google Scholar] [CrossRef]
- Xiao, Y.; Wu, S.; Liu, Z.; Lin, H. Digital economy and green development: Empirical evidence from China’s cities. Front. Environ. Sci. 2023, 11, 1124680. [Google Scholar] [CrossRef]
Disclaimer/Publisher’s Note: The statements, opinions and data contained in all publications are solely those of the individual author(s) and contributor(s) and not of MDPI and/or the editor(s). MDPI and/or the editor(s) disclaim responsibility for any injury to people or property resulting from any ideas, methods, instructions or products referred to in the content. |
© 2025 by the authors. Licensee MDPI, Basel, Switzerland. This article is an open access article distributed under the terms and conditions of the Creative Commons Attribution (CC BY) license (https://creativecommons.org/licenses/by/4.0/).