
The Optimization of Industrial Structure Under the ‘Dual Carbon’ Goal via Multi-Objective Programming Model: Evidence from Guangdong Province, China


Abstract
1. Introduction
2. Literature Review
2.1. Carbon Emissions of Industries
2.2. Relationship Between Industrial Structure and Carbon Emissions
2.3. Multi-Objective Planning Model of Industrial Structure Optimization
3. Materials and Methodology
3.1. Methodology
3.1.1. Economic and Carbon Emission Forward and Backward Linkages of Industries
3.1.2. Multi-Objective Programming Model
- (1)
- Initialization:
- Set the initial time period .
- Input the initial GDP , initial carbon intensity , target GDP growth rate g, and attenuation rate of carbon intensity .
- Initialize the total carbon emissions TotalEmissions = 0.
- (2)
- Loop through each time period:For each time period from l to , perform the following steps:
- Use the formula to calculate the current carbon emissions .
- Update the total carbon emissions TotalEmissions = .
- According to the GDP growth constraint , choose a value for (typically taking equality, i.e., ) to ensure the GDP grows at least by the rate .
- According to the decay constraint , choose a value for (typically taking equality, i.e., ) to ensure the carbon intensity decays at the rate .
- Check the termination condition. If , set and continue the loop. If , end the loop and output the result of carbon emissions TotalEmissions.
3.2. Data Collection
4. Results and Discussion
4.1. Economic and Carbon Emission Forward and Backward Linkages
4.2. Optimization of Industrial Structure
5. Conclusions
Author Contributions
Funding
Institutional Review Board Statement
Informed Consent Statement
Data Availability Statement
Conflicts of Interest
Abbreviations
| IPCC | Intergovernmental Panel on Climate Change |
| CCS | Carbon capture and storage |
Appendix A

| Industry | Name | Descriptions |
|---|---|---|
| 1 | Agriculture, forestry, animal husbandry, and fishery products and services | Production of primary agricultural products such as planting, forestry, animal husbandry, aquaculture, and aquaculture. |
| 2 | Coal mining and selection products | Coal mining, washing and supporting services. |
| 3 | Oil and gas extraction products | Extraction of crude oil and natural gas, development of shale gas and coalbed methane, etc. |
| 4 | Metal ore mining and selection products | Mining and beneficiation of metal ores. |
| 5 | Non-metallic minerals and other mineral mining products | Mining and processing of non-metallic minerals. |
| 6 | Food and tobacco | Manufacturing of deep processed foods and production of tobacco products. |
| 7 | Textile | Cotton, synthetic fiber, wool textile and printing and dyeing precision processing. |
| 8 | Textile, clothing, shoes, hats, leather, down and its products | Manufacturing of ready to wear and clothing. Leather tanning, luggage, leather shoe manufacturing, etc. |
| 9 | Wood processing products and furniture | Manufacturing of sawn timber, artificial boards, wooden furniture, bamboo and rattan furniture. |
| 10 | Paper printing and cultural, educational, and sports equipment | Production of pulp, paper, cardboard, and paper containers. Manufacturing of stationery, toys, arts and crafts, and sports equipment. |
| 11 | Petroleum, coking products, and nuclear fuel processing products | Crude oil refining, coal to oil, biofuel processing, etc. |
| 12 | Chemical products | Manufacturing of basic chemical raw materials, fertilizers, pesticides, and synthetic materials. |
| 13 | Non-metallic mineral products | Production of cement, flat glass, ceramic products, and refractory materials. |
| 14 | Metal smelting and rolling processed products | Steel smelting and rolling. |
| 15 | Metalware | Manufacturing of metal tools, containers, steel structural components, and hardware products. |
| 16 | General equipment | Manufacturing of boilers, machine tools, bearings, and mechanical components. |
| 17 | Special equipment | Manufacturing of medical equipment, agricultural machinery, mining machinery, and environmental protection equipment. |
| 18 | Transportation equipment | Manufacturing of passenger cars, commercial vehicles, new energy vehicles, and their components. |
| 19 | Electrical machinery and equipment | Manufacturing of generators, transformers, wires and cables, and household appliances. |
| 20 | Communication equipment, computers, and other electronic devices | Manufacturing of computer systems, communication equipment, semiconductors, and electronic components. |
| 21 | Instruments and apparatuses | Manufacturing of industrial automation instruments, environmental monitoring instruments, and optical instruments. |
| 22 | Other manufactured products | Comprehensive utilization of waste resources, handicrafts, and other unspecified manufacturing industries. |
| 23 | Waste and scrap materials | Recycling and processing of scrap metal and non-metallic waste materials. |
| 24 | Repair services for metal products, machinery, and equipment | Repair of metal products, repair of general/specialized equipment, repair of electrical equipment, repair of transportation equipment, etc. |
| 25 | Production and supply of electricity and heat | Thermal, hydro, nuclear, wind power and other power generation and grid operation, and regional heating. |
| 26 | Gas production and supply | Natural gas liquefaction and transportation, gas supply, etc. |
| 27 | Production and supply of water | Tap water production, sewage treatment, seawater desalination, etc. |
| 28 | Architecture | Housing construction, civil engineering, building installation and decoration. |
| 29 | Wholesale and retail | Wholesale of goods and retail. |
| 30 | Transportation, warehousing, and postal services | Railway/road freight, air passenger transport, warehousing, and postal express delivery services. |
| 31 | Accommodation and catering | Hotels, homestays, restaurants, and fast food services. |
| 32 | Information transmission, software, and information technology services | Telecommunications, Internet access, software development, data processing, and information technology consulting. |
| 33 | Finance | Banking, securities, insurance, trust, financial leasing, etc., providing services such as fund financing, risk management, payment settlement, etc. |
| 34 | Real estate | Land and building development, sales, leasing, and management. |
| 35 | Leasing and business services | Provide asset leasing and specialized commercial services. |
| 36 | Scientific research and technical services | Natural science/engineering technology research and development, technology testing, and technology intermediary services. |
| 37 | Management of water resources, environment, and public facilities | Operation and maintenance of public facilities such as water supply, sewage treatment, environmental governance, parks, and urban greening. |
| 38 | Resident services, repairs, and other services | Convenient services and non productive activities for families and individuals. |
| 39 | Education | All forms of education (preschool education, primary education, secondary education, higher education, vocational skills training, etc.) |
| 40 | Health and social work | Medical and health services and social welfare services. |
| 41 | Culture, sports, and entertainment | Cultural and artistic activities, sports events, leisure and entertainment, etc. |
| 42 | Public administration, social security and social organizations | Administrative agency operations, social insurance management, and non-profit organization activities. |
References
- Yu, Y.; Deng, Y.R.; Chen, F.F. Impact of population aging and industrial structure on CO2 emissions and emissions trend prediction in China. Atmos. Pollut. Res. 2018, 9, 446–454. [Google Scholar] [CrossRef]
- Cheng, J.; Xie, Y.; Zhang, J. Industry structure optimization via the complex network of industry space: A case study of Jiangxi Province in China. J. Clean. Prod. 2022, 338, 130602. [Google Scholar] [CrossRef]
- Siqin, Z.Y.; Niu, D.X.; Li, M.Y.; Zhen, H.; Yang, X.L. Carbon dioxide emissions, urbanization level, and industrial structure: Empirical evidence from North China. Environ. Sci. Pollut. Res. 2022, 29, 34528–34545. [Google Scholar] [CrossRef] [PubMed]
- Cheng, Z.H.; Li, L.S.; Liu, J. Industrial structure, technical progress and carbon intensity in China’s provinces. Renew. Sustain. Energy Rev. 2018, 81, 2935–2946. [Google Scholar] [CrossRef]
- Xie, P.; Lu, Y.; Xie, Y. The influencing factors of carbon emissions in the industrial sector: Empirical analysis based on a spatial econometric model. Sustainability 2024, 16, 2478. [Google Scholar] [CrossRef]
- Hu, L.W.; Yuan, W.Y.; Jiang, J.K.; Ma, T.L.; Zhu, S.L. Asymmetric effects of industrial structure rationalization on carbon emissions: Evidence from thirty Chinese provinces. J. Clean. Prod. 2023, 428, 139347. [Google Scholar] [CrossRef]
- Zheng, H.L.; Gao, X.Y.; Sun, Q.R.; Han, X.D.; Wang, Z. The impact of regional industrial structure differences on carbon emission differences in China: An evolutionary perspective. J. Clean. Prod. 2020, 257, 120506. [Google Scholar] [CrossRef]
- Zhang, J.; Jiang, H.Q.; Liu, G.Y.; Zeng, W.H. A study on the contribution of industrial restructuring to reduction of carbon emissions in China during the five Five-Year Plan periods. J. Clean. Prod. 2018, 176, 629–635. [Google Scholar] [CrossRef]
- Li, L.; Lei, Y.L.; Wu, S.M.; He, C.Y.; Chen, J.B.; Yan, D. Impacts of city size change and industrial structure change on CO2 emissions in Chinese cities. J. Clean. Prod. 2018, 195, 831–838. [Google Scholar] [CrossRef]
- Dong, B.Y.; Ma, X.J.; Zhang, Z.L.; Zhang, H.B.; Chen, R.M.; Song, Y.Q.; Shen, M.C.; Xiang, R.B. Carbon emissions, the industrial structure and economic growth: Evidence from heterogeneous industries in China. Environ. Pollut. 2020, 262, 114322. [Google Scholar] [CrossRef]
- Tian, X.; Bai, F.L.; Jia, J.H.; Liu, Y.; Shi, F. Realizing low-carbon development in a developing and industrializing region: Impacts of industrial structure change on CO2 emissions in southwest China. J. Environ. Manag. 2019, 233, 728–738. [Google Scholar] [CrossRef] [PubMed]
- Zhang, P.D.; Yuan, H.M.; Bai, F.L.; Tian, X.; Shi, F. How do carbon dioxide emissions respond to industrial structural transitions? Empirical results from the northeastern provinces of China. Struct. Change Econ. Dyn. 2018, 47, 145–154. [Google Scholar] [CrossRef]
- Gu, R.; Li, C.; Li, D.; Yang, Y.; Gu, S. The impact of rationalization and upgrading of industrial structure on carbon emissions in the Beijing-Tianjin-Hebei urban agglomeration. Int. J. Environ. Res. Public Health 2022, 19, 7997. [Google Scholar] [CrossRef]
- Feng, T.T.; Liu, B.; Wei, Y.; Xu, Y.W.; Zheng, H.Y.Y.; Ni, Z.D.; Zhu, Y.D.; Fan, X.Y.; Zhou, Z.L. Research on the low-carbon path of regional industrial structure optimization. Energy Strategy Rev. 2024, 54, 101485. [Google Scholar] [CrossRef]
- Chen, M.Q. A study of low-carbon development, urban innovation and industrial structure upgrading in China. Int. J. Low-Carbon Technol. 2022, 17, 185–195. [Google Scholar] [CrossRef]
- Zhao, J.; Jiang, Q.Z.; Dong, X.C.; Dong, K.Y.; Jiang, H.D. How does industrial structure adjustment reduce CO2 emissions? Spatial and mediation effects analysis for China. Energy Econ. 2022, 105, 105704. [Google Scholar] [CrossRef]
- Zhao, C.Y. Can industrial structure optimization and industrial structure transition both lead to carbon lock-in mitigation? The case of China. Environ. Sci. Pollut. Res. 2024, 31, 23247–23261. [Google Scholar] [CrossRef]
- Fan, G.; Zhu, A.; Xu, H. Analysis of the impact of industrial structure upgrading and energy structure optimization on carbon emission reduction. Sustainability 2023, 15, 3489. [Google Scholar] [CrossRef]
- Liu, Y.; Wu, Y.Y.; Zhu, X.W. Industrial clusters and carbon emission reduction: Evidence from China. Ann. Reg. Sci. 2024, 73, 557–597. [Google Scholar] [CrossRef]
- Zhou, D.; Zhang, X.R.; Wang, X.Q. Research on coupling degree and coupling path between China’s carbon emission efficiency and industrial structure upgrading. Environ. Sci. Pollut. Res. 2020, 27, 25149–25162. [Google Scholar] [CrossRef]
- Chen, Y.; Pan, Y.B.; Wang, M.Y.; Ding, T.; Zhou, Z.X.; Wang, K. How do industrial sectors contribute to carbon peaking and carbon neutrality goals? A heterogeneous energy efficiency analysis for Beijing. Struct. Change Econ. Dyn. 2023, 66, 67–80. [Google Scholar] [CrossRef]
- Ren, H.X.; Ou, X.J.; Zhu, H.X. Spatial characteristics and coupling coordination between carbon emission efficiency and industrial structure in three metropolitan areas of Jiangsu Province, China. Sci. Prog. 2023, 106, 1–36. [Google Scholar] [CrossRef] [PubMed]
- Jin, G.; Guo, B.S.; Deng, X.Z. Is there a decoupling relationship between CO2 emission reduction and poverty alleviation in China? Technol. Forecast. Soc. Change 2020, 151, 119856. [Google Scholar] [CrossRef]
- Guo, Y.; Lu, J.Y.; Zhang, Q.; Cao, Y.L.; Chen, L.J.; Mauzerall, D.L. Co-production of steel and chemicals to mitigate hard-to-abate carbon emissions. Nat. Chem. Eng. 2024, 1, 365–375. [Google Scholar] [CrossRef]
- Wang, F.; Gao, C.; Zhang, W.; Huang, D. Industrial structure optimization and low-carbon transformation of Chinese industry based on the forcing mechanism of CO2 emission peak target. Sustainability 2021, 13, 4417. [Google Scholar] [CrossRef]
- Pan, X.F.; Wang, M.Y.; Li, M.N. Low-carbon policy and industrial structure upgrading: Based on the perspective of strategic interaction among local governments. Energy Policy 2023, 183, 113794. [Google Scholar] [CrossRef]
- Zhong, Z.Q.; Zheng, C.Y.; Chen, Z.G. Low-carbon cities pilot and industrial structure upgrading: Enabling or negative? Evidence from a quasi-natural experiment in China. J. Environ. Plan. Manag. 2024, 1–33. [Google Scholar] [CrossRef]
- Feng, Y.C.; Wu, H.Y. How does industrial structure transformation affect carbon emissions in China: The moderating effect of financial development. Environ. Sci. Pollut. Res. 2022, 29, 13466–13477. [Google Scholar] [CrossRef]
- Zhou, X.G.; Ji, J.X. A multi-objective optimization approach for interprovincial carbon emission reduction in China: Considering industrial structure and ownership attributes. J. Environ. Manag. 2025, 373, 123646. [Google Scholar] [CrossRef]
- Zhang, S.; Yu, Y.D.; Kharrazi, A.; Ren, H.T.; Ma, T.J. Quantifying the synergy and trade-offs among economy-energy-environment-social targets: A perspective of industrial restructuring. J. Environ. Manag. 2022, 316, 115285. [Google Scholar] [CrossRef]
- Jiang, M.H.; An, H.Z.; Gao, X.Y. Adjusting the global industrial structure for minimizing global carbon emissions: A network-based multi-objective optimization approach. Sci. Total Environ. 2022, 829, 154653. [Google Scholar] [CrossRef] [PubMed]
- Liu, N.; Kang, J.; Ng, T.S.; Su, B. Cutting CO2 emissions through demand side regulation: Implications from multi-regional input-output linear programming model. Front. Eng. Manag. 2022, 9, 452–461. [Google Scholar] [CrossRef]
- Zhu, B.; Zhang, T.L. The impact of cross-region industrial structure optimization on economy, carbon emissions and energy consumption: A case of the Yangtze River Delta. Sci. Total Environ. 2021, 778, 146089. [Google Scholar] [CrossRef] [PubMed]
- Jaffe, A.B.; Newell, R.G.; Stavins, R.N. A tale of two market failures: Technology and environmental policy. Ecol. Econ. 2005, 54, 164–174. [Google Scholar] [CrossRef]
- Acemoglu, D.; Aghion, P.; Bursztyn, L.; Hemous, D. The environment and directed technical change. Am. Econ. Rev. 2012, 102, 131–166. [Google Scholar] [CrossRef]
- Secundo, G.; Schena, R.; Russo, A.; Schiavone, F.; Sham, R. The impact of digital technologies on the achievement of the Sustainable Development Goals: Evidence from the agri-food sector. Total Qual. Manag. Bus. Excell. 2022, 1–17. [Google Scholar] [CrossRef]
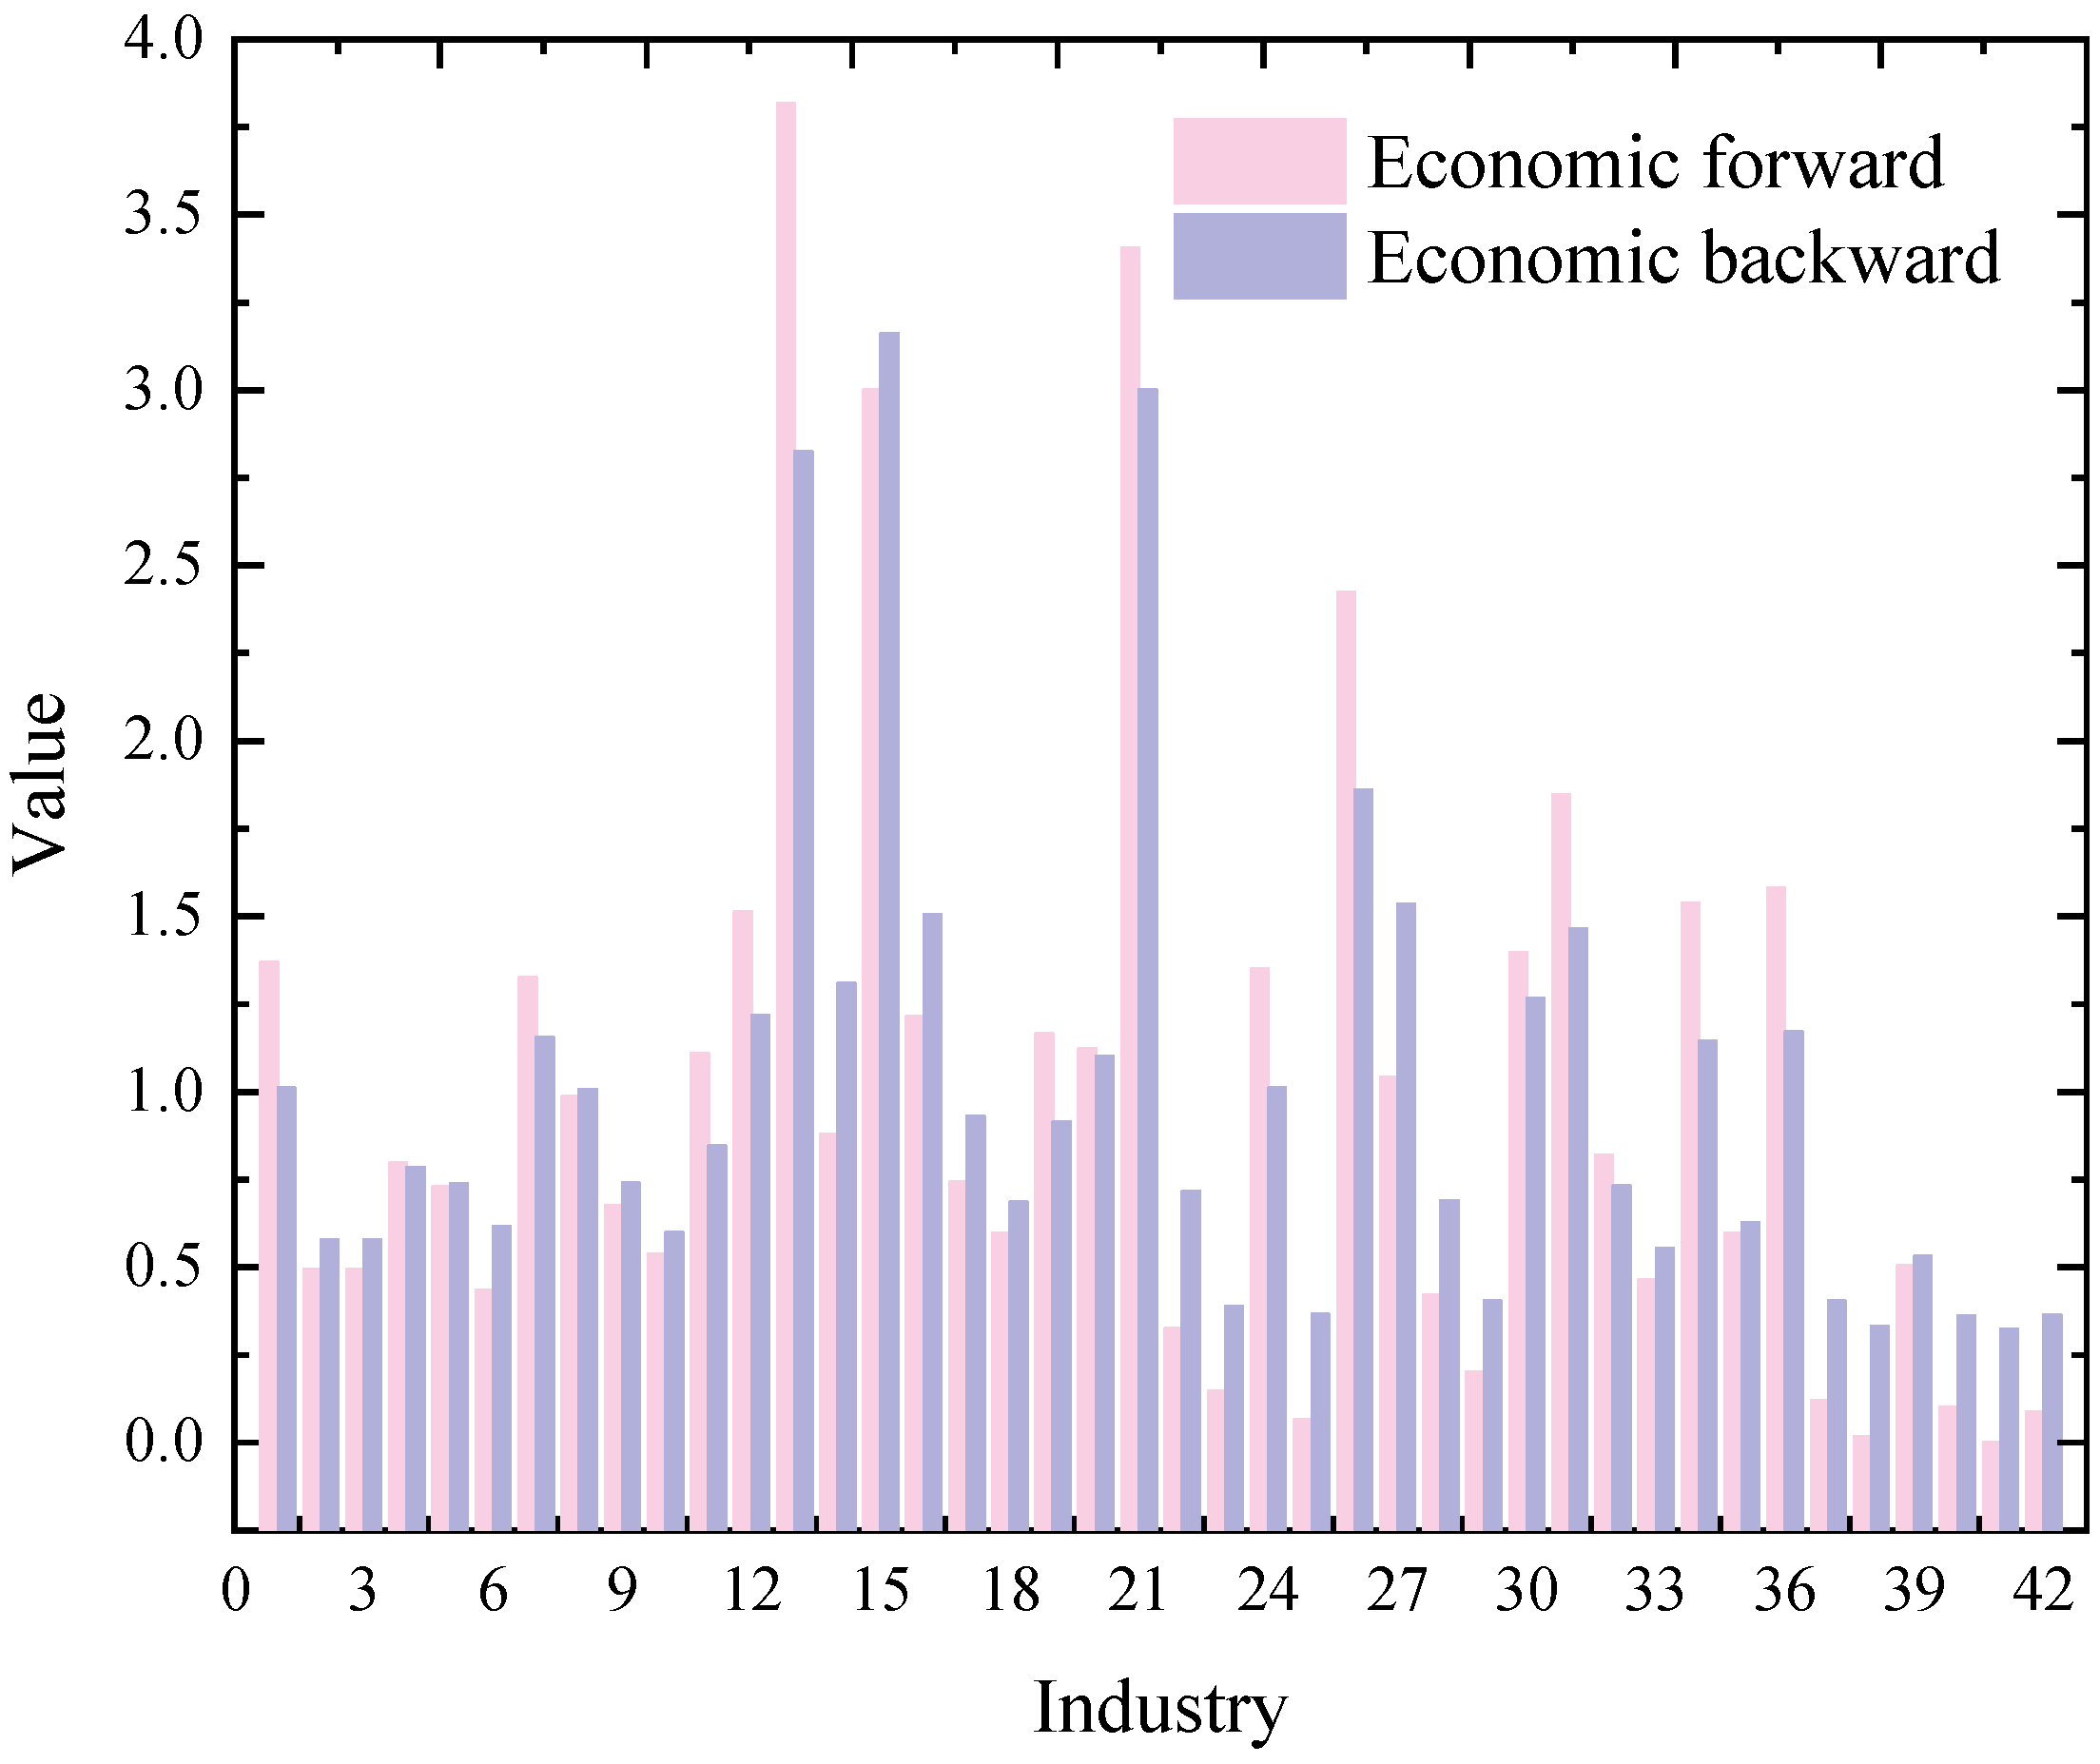


| Industry | Economic Forward | Economic Backward | Carbon Emission Forward | Carbon Emission Backward |
|---|---|---|---|---|
| 1 | 1.3702 | 1.011 | 0.4179 | 0.3167 |
| 2 | 0.4938 | 0.5785 | 0.1483 | 0.1784 |
| 3 | 0.4938 | 0.5785 | 0.1483 | 0.1784 |
| 4 | 0.7973 | 0.7854 | 0.5952 | 0.6021 |
| 5 | 0.7307 | 0.7382 | 0.5078 | 0.5268 |
| 6 | 0.4358 | 0.6168 | 0.4367 | 0.6348 |
| 7 | 1.3266 | 1.1568 | 1.4223 | 1.2736 |
| 8 | 0.9877 | 1.0074 | 0.9266 | 0.9706 |
| 9 | 0.677 | 0.7411 | 0.7224 | 0.8121 |
| 10 | 0.5381 | 0.5985 | 0.6856 | 0.7831 |
| 11 | 1.1098 | 0.8478 | 1.3352 | 1.0474 |
| 12 | 1.5146 | 1.22 | 1.6701 | 1.3814 |
| 13 | 3.818 | 2.8265 | 3.9201 | 2.9802 |
| 14 | 0.8801 | 1.3108 | 1.3045 | 1.9953 |
| 15 | 3.0033 | 3.1616 | 3.3735 | 3.6468 |
| 16 | 1.2163 | 1.5055 | 1.5242 | 1.9374 |
| 17 | 0.7436 | 0.9304 | 0.713 | 0.9161 |
| 18 | 0.5979 | 0.6876 | 0.6493 | 0.7666 |
| 19 | 1.1654 | 0.9151 | 1.4357 | 1.1575 |
| 20 | 1.1236 | 1.1022 | 1.3853 | 1.3955 |
| 21 | 3.4048 | 3.0002 | 3.1588 | 2.8583 |
| 22 | 0.3271 | 0.7164 | 0.3609 | 0.8117 |
| 23 | 0.1474 | 0.3897 | 0.179 | 0.4858 |
| 24 | 1.3521 | 1.011 | 1.7247 | 1.3242 |
| 25 | 0.0648 | 0.3674 | 0.0624 | 0.3635 |
| 26 | 2.4258 | 1.8613 | 3.3247 | 2.6196 |
| 27 | 1.0412 | 1.5356 | 0.9092 | 1.377 |
| 28 | 0.4226 | 0.6902 | 0.0879 | 0.1475 |
| 29 | 0.2022 | 0.4037 | 0.0431 | 0.0884 |
| 30 | 1.3979 | 1.2674 | 6.3089 | 5.8735 |
| 31 | 1.8474 | 1.4658 | 0.5583 | 0.4549 |
| 32 | 0.8198 | 0.7324 | 0.1601 | 0.1469 |
| 33 | 0.4649 | 0.555 | 0.0877 | 0.1075 |
| 34 | 1.5381 | 1.1436 | 0.2204 | 0.1683 |
| 35 | 0.5973 | 0.6276 | 0.1306 | 0.1409 |
| 36 | 1.5812 | 1.17195 | 0.3716 | 0.2829 |
| 37 | 0.1209 | 0.4044 | 0.0225 | 0.0772 |
| 38 | 0.0184 | 0.3317 | 0.0035 | 0.0648 |
| 39 | 0.5049 | 0.5317 | 0.0767 | 0.083 |
| 40 | 0.1023 | 0.3623 | 0.0209 | 0.0761 |
| 41 | 0.0007 | 0.3238 | 0.0001 | 0.0662 |
| 42 | 0.0887 | 0.3659 | 0.014 | 0.0594 |
| Indicator | Economic Forward | Economic Backward | Carbon Emission Forward | Carbon Emission Backward |
|---|---|---|---|---|
| Economic forward | 1 | 0.9533 | 0.7298 | 0.6662 |
| Economic backward | 0.9533 | 1 | 0.7273 | 0.7209 |
| Carbon emission forward | 0.7298 | 0.7273 | 1 | 0.9771 |
| Carbon emission backward | 0.6662 | 0.7209 | 0.9771 | 1 |
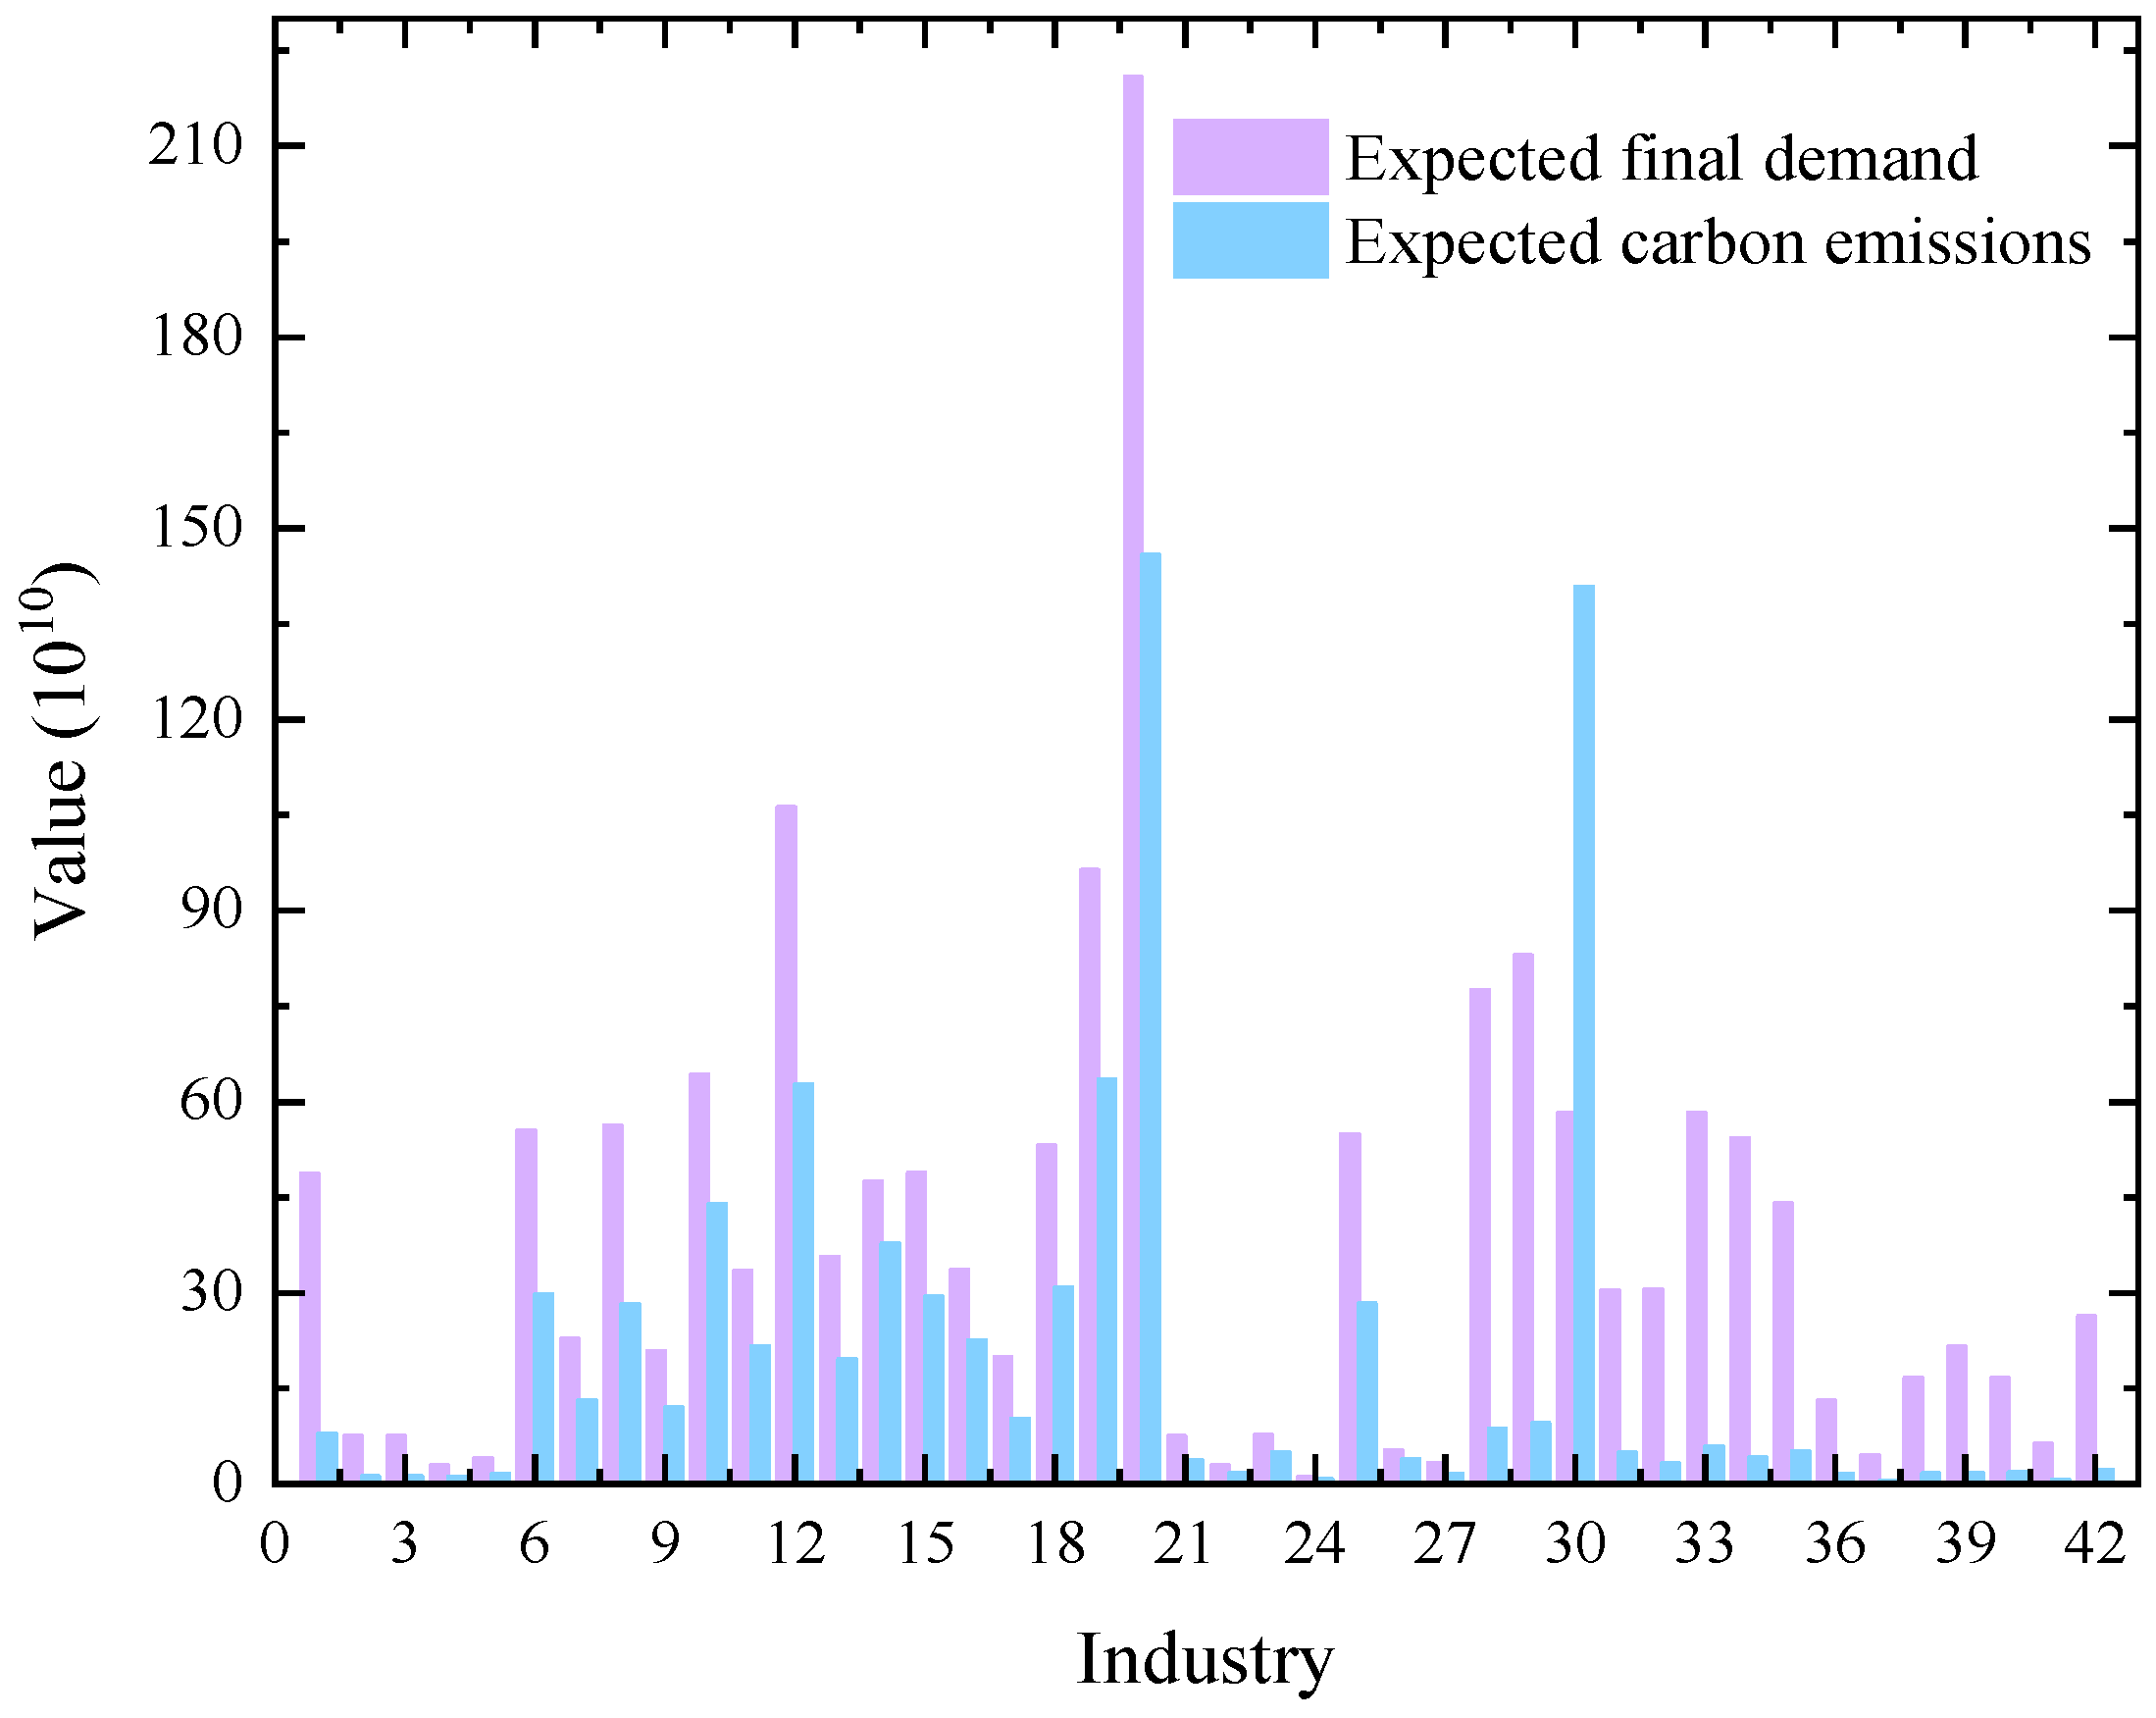
| Industry | Expected Final Demand (10,000 CNY) | Change in Final Demand (%) | Expected Carbon Emissions (10,000 tons) |
|---|---|---|---|
| 1 | 48,643,840 | 30.57 | 7,944,626.7 |
| 2 | 7,516,568.6 | 42.19 | 1,208,668.36 |
| 3 | 7,516,568.6 | 42.19 | 1,208,668.36 |
| 4 | 2,953,923.9 | −16.97 | 1,180,730.72 |
| 5 | 4,109,981.7 | −18.23 | 1,529,370.47 |
| 6 | 55,459,659 | −12.64 | 29,758,771.35 |
| 7 | 22,755,744 | −11.82 | 13,062,811.09 |
| 8 | 56,312,865 | −13.5 | 28,289,313.39 |
| 9 | 20,905,496 | −11.87 | 11,944,624.04 |
| 10 | 64,339,905 | −9.94 | 43,894,349.23 |
| 11 | 33,522,124 | −0.53 | 21,594,735.58 |
| 12 | 106,280,370 | −11.49 | 62,748,395.59 |
| 13 | 35,612,630 | −12.34 | 19,578,415.59 |
| 14 | 47,537,440 | −8.55 | 37,729,472.41 |
| 15 | 48,877,853 | −11.28 | 29,396,740.93 |
| 16 | 33,606,476 | −10.11 | 22,549,568.38 |
| 17 | 19,921,788 | −13.21 | 10,228,116.93 |
| 18 | 53,127,462 | −11.67 | 30,887,221.29 |
| 19 | 96,379,988 | −10.29 | 63,571,494.09 |
| 20 | 220,933,440 | −10.28 | 145,859,453.8 |
| 21 | 7,512,812.1 | −13.66 | 3,732,062.45 |
| 22 | 2,898,799.4 | −11.48 | 1,712,744.76 |
| 23 | 7,655,328.2 | −10.44 | 4,976,823.24 |
| 24 | 1,081,520.9 | −9.93 | 738,647.37 |
| 25 | 54,966,560 | −13.15 | 28,359,567.81 |
| 26 | 5,350,535.9 | −9.24 | 3,926,489.88 |
| 27 | 3,322,467.5 | −14.51 | 1,553,478.25 |
| 28 | 77,596,720 | −10.8 | 8,644,395.3 |
| 29 | 83,001,910 | 29.51 | 9,477,804.38 |
| 30 | 58,303,218 | −19.39 | 140,888,805.2 |
| 31 | 30,360,800 | −20.83 | 4,912,402.23 |
| 32 | 30,534,600 | −26.9 | 3,193,432.65 |
| 33 | 58,239,693 | 27.85 | 5,882,053.89 |
| 34 | 54,331,800 | 36.66 | 4,168,977.41 |
| 35 | 44,021,280 | −24.03 | 5,152,851.69 |
| 36 | 13,086,400 | −22.35 | 1,646,859.13 |
| 37 | 4,498,440 | 28.25 | 448,028.43 |
| 38 | 16,560,600 | 27.61 | 1,687,343.12 |
| 39 | 21,529,000 | 34.57 | 1,752,114.83 |
| 40 | 16,617,480 | 25.7 | 1,819,104.12 |
| 41 | 6,323,880 | 26.37 | 674,515.41 |
| 42 | 26,319,560 | 33.22 | 2,228,663.1 |
Disclaimer/Publisher’s Note: The statements, opinions and data contained in all publications are solely those of the individual author(s) and contributor(s) and not of MDPI and/or the editor(s). MDPI and/or the editor(s) disclaim responsibility for any injury to people or property resulting from any ideas, methods, instructions or products referred to in the content. |
© 2025 by the authors. Licensee MDPI, Basel, Switzerland. This article is an open access article distributed under the terms and conditions of the Creative Commons Attribution (CC BY) license (https://creativecommons.org/licenses/by/4.0/).
Share and Cite
Cheng, J.; Cai, C. The Optimization of Industrial Structure Under the ‘Dual Carbon’ Goal via Multi-Objective Programming Model: Evidence from Guangdong Province, China. Sustainability 2025, 17, 5912. https://doi.org/10.3390/su17135912
Cheng J, Cai C. The Optimization of Industrial Structure Under the ‘Dual Carbon’ Goal via Multi-Objective Programming Model: Evidence from Guangdong Province, China. Sustainability. 2025; 17(13):5912. https://doi.org/10.3390/su17135912
Chicago/Turabian StyleCheng, Jing, and Changhong Cai. 2025. "The Optimization of Industrial Structure Under the ‘Dual Carbon’ Goal via Multi-Objective Programming Model: Evidence from Guangdong Province, China" Sustainability 17, no. 13: 5912. https://doi.org/10.3390/su17135912
APA StyleCheng, J., & Cai, C. (2025). The Optimization of Industrial Structure Under the ‘Dual Carbon’ Goal via Multi-Objective Programming Model: Evidence from Guangdong Province, China. Sustainability, 17(13), 5912. https://doi.org/10.3390/su17135912