4.2. Selection of Variables and Data Explanation
1. Explained variable: carbon emission degree(
lnCO2it). As for the measurement and source of carbon emission data, there are different choices in the existing literature. Notably, Hu and Shao (2022) [
38] analyzed carbon emission dynamics using the metrics of total CO
2 output and emissions intensity per GDP unit. Concurrently, scholars, including Liu et al. (2022) [
3] and Yu et al. (2023) [
39], have adopted per capita CO
2 emissions as a proxy for environmental impact assessment. Aligning with this methodological framework, the present investigation computes per capita CO
2 emissions for Belt and Road Initiative economies by normalizing aggregate carbon emissions against population statistics, leveraging standardized datasets from the World Bank’s World Development Indicators (WDI) database. Following the exclusion of data points significantly absent in the statistical records, the information from 39 Belt and Road economies spanning from 2005 to 2020 is chosen for examination.
2. Primary explanatory factor: the OFDI stock of China (
lnOFDIit). We learnt, from Zhuang Danyu and Fu Lei (2021) [
40], to select OFDI stock data in order to avoid the problem of negative flow data in logarithmic processing.
3. Control variable: economic scale (lnGDPit). The impact of a nation’s economic magnitude on CO2 emissions must be acknowledged, with a potential inverted “U” curve illustrating their connection in the previously mentioned environmental Kuznets curve. Concurrently, this document employs fixed prices in 2010 dollars to mitigate the impact of price variances.
Level of industrialization (
lnIndustryit). There are many different ways to measure the level of industrialization in academic circles. Take, for instance, the technique of allocating varied importance to the output worth of distinct sectors within the GDP (Zhai and Huang 2023) [
23], and the ratio of the tertiary industry’s added value to that of the secondary industry (Hu and Shao, 2022) [
38]. Considering the global collaboration between China and various economies along the “Belt and Road” route, primarily focused on the manufacturing sector, this document employs the manufacturing industry’s additional value to denote the degree of industrialization.
The level of receptiveness towards the external world (lnOpenit). A cumulative measure of imported and exported goods and services relative to the gross domestic product (GDP).
Population density (lnPDit). Count of individuals per square kilometer of terrain.
Government effectiveness (
GEit). Use “Government Effectiveness: Estimate” from the WDI database. The definition of GE gives the country’s score on the aggregate indicator. The measurement of this metric is in the standard normal distribution unit, with a range between −2.5 and 2.5 (−2.5 is weak; 2.5 is strong). Government effectiveness captures perceptions of the quality of public services, the quality of the civil service and the degree of its independence from political pressures, the quality of policy formulation and implementation, and the credibility of the government’s commitment to such policies. This mirrors the caliber of governmental policy development and execution, along with the perceived trustworthiness of governmental policy dedication by the populace. For more details, please refer to the data files for each source available at
www.govindicators.org. The indicator was introduced considering that host governments can reduce carbon emissions by introducing emission reduction policies to eliminate lagging production capacity and promote environmental quality improvement through financial support for innovative research and development and guidance for industrial structure upgrading.
Degree of informatization (lnInternetit). The count of people accessing the Internet as a fraction of the overall population.
4.4. Regression Analysis
1. Preliminary test: In order to avoid problems such as pseudo-regression, decline in accuracy, and contrary to expectations in the regression analysis, the following processing is carried out: Initially, the aim is to investigate the presence of multicollinearity issues among variables in the panel model, thereby preventing regression result variances caused by linear relationships.
Table 3 lists the test results of the variance inflation factor (VIF). Findings indicate that all variable VIF values fall below 5, with the exception of government effectiveness (GE), which is marginally above 5, signifying the model’s minimal multicollinearity.
Next, a matrix test of correlation coefficients is conducted to more effectively assess the interconnections among variables. Results of the tests are displayed in
Table 4. According to the correlation coefficient matrix, the interrelation coefficient among all variables falls below 0.8, signifying a feeble connection between them.
Ultimately, the Hausman test is conducted to ascertain if the panel data are influenced by fixed or random effects. Results from the tests are displayed in
Table 5. A
p-value of 0.0000 is assigned to dismiss the null hypothesis, followed by choosing the fixed effect for regression analysis.
2. Initial regression analysis: The data in
Table 6 illustrate the foundational regression outcomes for CO
2 emissions from economies along the “Belt and Road” following China’s OFDI. The models represent the projected outcomes from incrementally incorporating control variables like economic size, industrialization level, openness to the outside world, population density, government effectiveness, and informatization level.
The coefficient of
ln_OFDI in model (1) is positive, but not significant, when other control variables are not added. Thus, control variables are sequentially incorporated into the subsequent regression models. Upon inclusion of
ln_GDP, the empirical analysis reveals that this variable demonstrates a consistently positive and statistically significant coefficient at the 1% level, consistent with the prevailing academic consensus that economic growth correlates positively with carbon dioxide emissions prior to reaching a carbon peak. The coefficient for
ln_Industry suggests that a 1% increase in industrialization corresponds to a 0.152% elevation in CO
2 emissions, exhibiting a statistically significant effect at the 1% level. This indicates that the acceleration of the industrialization process does lead to an increase in carbon emissions. The
ln_Open coefficient is negative, which confirms that trade among economies along the Belt and Road is beneficial. Although the correlation coefficient is not significant, it indicates that trade and openness can help reduce environmental pollution (Zhang et al., 2021) [
40]. The
ln_PD coefficient is significantly negative at the 1% level, and CO
2 emissions will decrease by 0.205% when population density increases by 1%. This may be because cities with higher population density are typically associated with greater economic development and technological innovation, leading to a reduction in carbon emission intensity. (Shang et al., 2023) [
41] At a 1% significance level, the
ln_Internet coefficient shows a positive trend, possibly due to the information and communication sector’s high electricity demand, resulting in elevated carbon dioxide emissions. Consequently, China ought to focus more on eco-friendly and low-carbon growth through collaborative information efforts with economies on the “Belt and Road” initiative. The GE coefficient turns out to be negative and to successfully meet the 1% significance threshold. A plausible reason could be that governments have fostered low-carbon growth through the encouragement of low-carbon product consumption, prompting businesses to launch eco-friendly products, and integrating low-carbon development tactics with market strategies.
In view of the fact that carbon emissions mainly come from the industrial sector, Zhuang and Fu (2021) [
6] refer to the industrialization level as an alternative indicator of economic scale and include it into the analysis of model (8) to directly compare the impact of industrialization process along the Belt and Road on carbon emissions of economies. Findings reveal a notable and positive
ln_Industry coefficient, suggesting a 0.657% rise in carbon dioxide emissions for each 1% increment in industrialization. Currently, the
ln_OFDI coefficient remains notably negative, underscoring China’s substantial impact on reducing CO
2 emissions from economies along these routes, aligning with the strategic objective of constructing an eco-friendly “Belt and Road”.
Regarding particular choices, China maintains eco-friendly environmental standards for investing in infrastructure construction and advocates for green, low-carbon growth. In the field of science and technology, China actively encourages enterprises with the “green and low-carbon” label to “go global”. For example, the Karot hydropower station built by China in cooperation with Pakistan adopted the world’s strictest environmental and social responsibility standards, provided more than 2000 jobs during the construction period, and provided over 3.1 billion KWH of clean energy for the local area, advocating for the synchronized growth of regional energy and industry. In 2016, the Teda Cooperation Zone, jointly built by China and Egypt, adopted green environmental protection as its standard and became a new platform for Chinese companies to explore low-carbon and environmentally friendly commercial applications, such as “seawater desalination” and “desert greening” in the local area, injecting new vitality into the Belt and Road Initiative. These instances clearly illustrate China’s collaborative efforts with Belt and Road nations in establishing an eco-friendly Belt and Road, thereby reinforcing the empirical findings of this study.
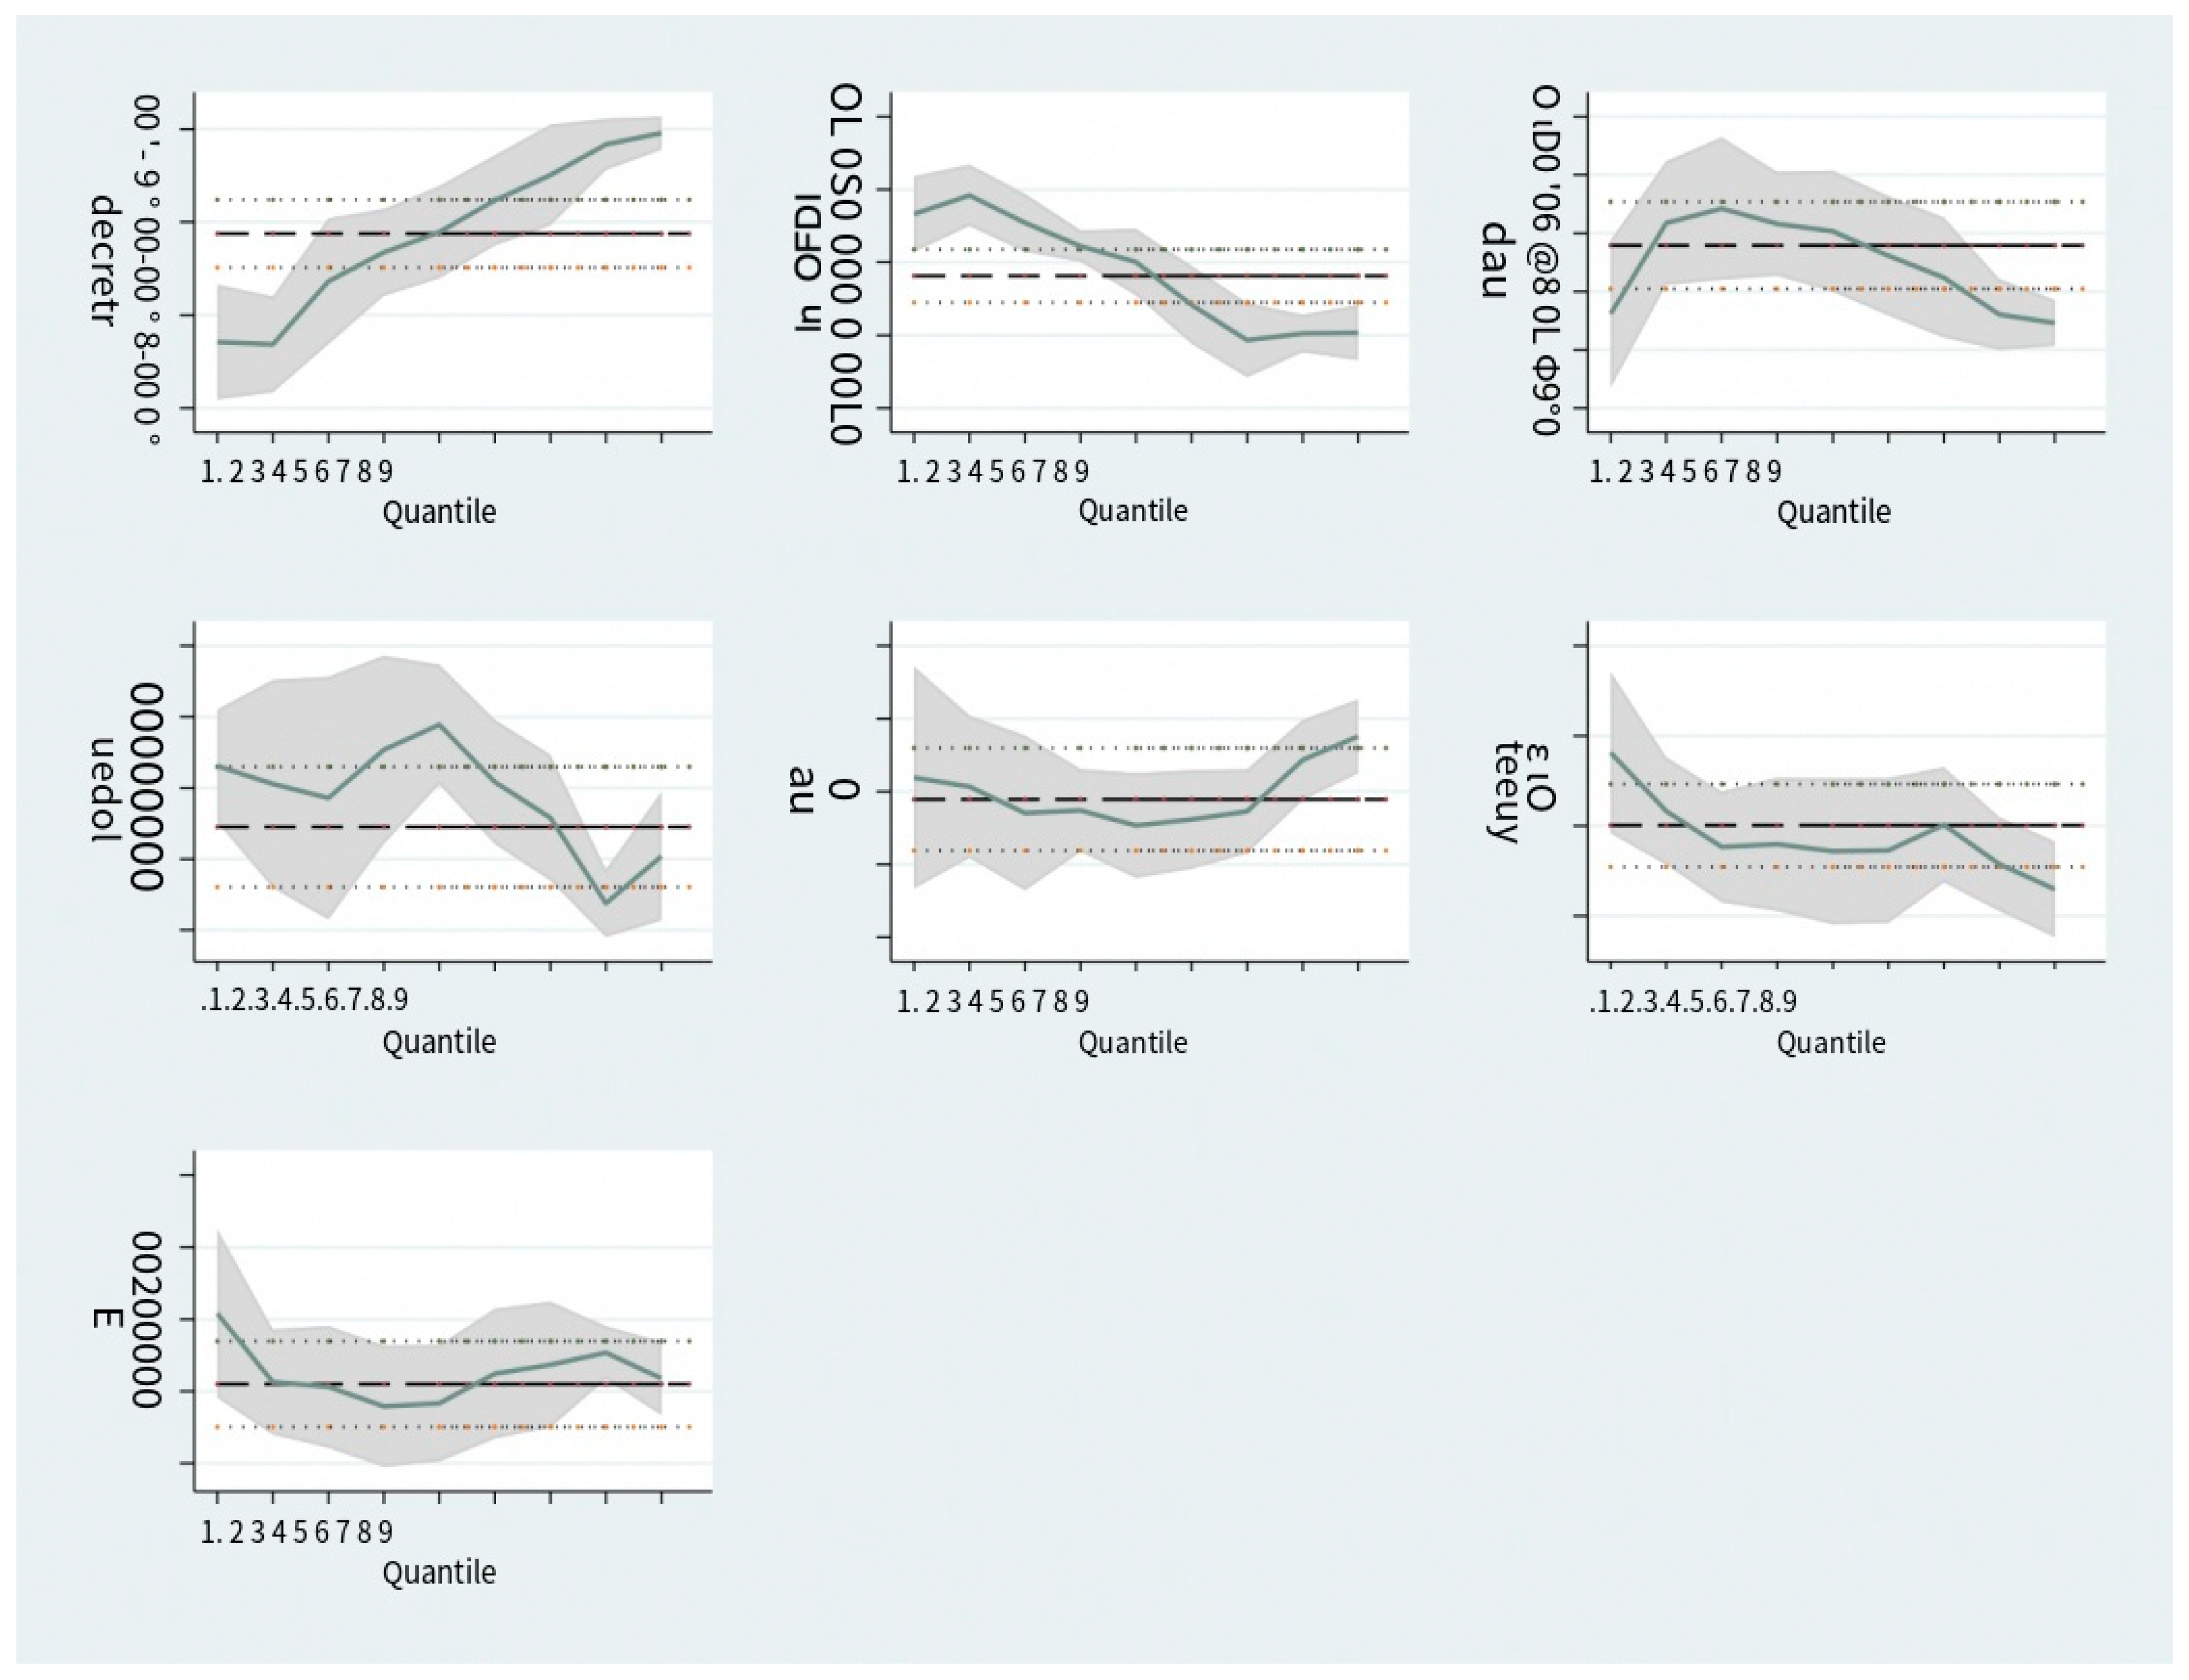
3. Quantile Regression (QR): It is considered that the traditional regression model based on the least squares estimation method has a bias in the estimation result due to the heteroscedasticity. Therefore, a quantile regression model is introduced in this paper. Even when the independent variable has different effects on different parts, the model can still describe the conditional distribution characteristics of the dependent variable more comprehensively. In addition, the coefficient of quantile regression is more stable and less susceptible to extreme value perturbations than that of the least squares method. The outcomes of the quantile regression are displayed in
Table 7 and
Figure 2.
The
lnOFDI coefficient successfully meets the significance threshold of 1% at 20%, 70%, 80%, and 90%, and 5% at 10%, according to
Table 6. In the traditional regression model (7), no direct explanation can be given for the result with a negative but not significant
lnOFDI coefficient. However, by introducing quantile regression, the trend changes in the
lnOFDI coefficient under the influence of different control variables can be directly reflected: the coefficient between 10% and 40% is positive, the coefficient between 50% is 0, and the coefficient between 10% and 20% is significant and then becomes insignificant. The coefficients between 60% and 90% of the sub-sites are negative and have significance from 70%. A possible explanation for this phenomenon is that economies with lower levels of carbon emissions themselves have stronger environmental regulations and commensurate levels of green development technology. Consequently, the ripple effect of green technology on China’s investments in comparable economies is minimal, and its influence on carbon emissions is negligible, potentially resulting in a rise in carbon emissions. As carbon dioxide emissions rise, China’s OFDI elasticity shifts from positive to negative, signifying that economies on these routes have successfully reduced their carbon emissions through the absorption of Chinese investments, with this reduction effect being more pronounced in economies where carbon emissions exceed 60%.
In conclusion, China’s commitment to the Belt and Road economies epitomizes the idea of synchronized economic and environmental growth, underscoring the ethos of collaboration and collective building of the Green Belt and Road. This stands in stark contrast to the malevolent conjectures of certain Western news outlets regarding the creation of “pollution refuges” as a result of China’s shift away from heavily polluting sectors.
4.5. Difference-in-Difference Method
The difference before and after the implementation of the policy is controlled by the differential model so as to effectively evaluate the effect of the policy. In the research, an experimental group and a control group need to be selected. At a certain moment, a particular policy will impact the experimental group, whereas the control group will remain unaffected by it. Prior to and following this specific moment, a comparison was made between the developmental alterations in the experimental and control groups. Should the alterations in the test group distinctly vary from those in the control group, one can deduce that the policy’s impact is substantial.
Based on the aforementioned guidelines, 2013 is selected as the timeline for the “Belt and Road” project, nations participating in the “Belt and Road” project are considered the test group, and those not involved are regarded as the control group. The difference-difference model is as follows:
In Formula (2), the independent variable is lnYit. the primary explanatory factor is treati·postt, and its corresponding coefficient is β1. treati is used to divide the processing group and control group according to whether countries along the Belt and Road are involved (1 for countries along the Belt and Road; 0 if it is not). postt represents the policy implementation period of the dummy variable. Set 2013 and subsequent years to 1, and pre-2013 years to 0. β0 is the constant term, Xit represents the matrix of control variables, and denotes the term for random errors. Data are selected based on their availability, and the time span is set from 2005 to 2020. In addition to the original economies along the “Belt and Road”, the pertinent data pertaining to different economies or regions are chosen.
To confirm the validity of the parallel trend hypothesis, carbon dioxide emissions from economies situated along the Belt and Road were analyzed against those not on the Belt and Road, both before and after the Initiative’s initiation, serving as a control group and a treatment group. A minimal variance in carbon emissions between the experimental and control groups signals that the requirements for the parallel trend test have been met. Consequently, alterations in the sample trends preceding and following the introduction of the “Belt and Road” policy in 2013 were analyzed.
Through the regression of the sample data using the differentially applied method, we pay attention to the positive and negative cross-term coefficients of the treatment group to judge whether the Belt and Road Initiative influences the carbon footprint of economies situated along these routes. The outcomes of the regression study are presented in
Table 8.
Once control variables are factored in, the negative regression coefficient for the cross and multiplier term at a 1% significance level suggests China’s outbound investment via the “Belt and Road” route is continuously committed to reducing pollution together with economies along the route, and fervently advocates for the adoption of strategies to reduce carbon emissions, embodying the robust principle of eco-friendly development. This result further validates China’s efforts in reconciling economic growth with environmental protection.
4.6. Robustness Test
Emissions of methane, nitrogen oxide, and overall greenhouse gases were chosen as substitute measures to thoroughly evaluate China’s OFDI’s effect on the economies along these routes and to conduct a thorough analysis of air quality and environmental states. These metrics serve as substitutes for the regression analysis of the initial variables, aiming to achieve stronger empirical findings. The outcomes of the regression study are presented in
Table 9.
The regression results showed that ln_OFDI had a significant negative correlation with methane emissions, nitrogen oxide emissions, and total greenhouse gas emissions, and no positive or negative coefficient changes were observed compared with the baseline regression. To be precise, a 1% rise in China’s OFDI leads to a 0.02% reduction in methane gas emissions, a 0.017% drop in nitrogen oxide gas emissions, a 0.075% decrease in overall greenhouse gas emissions, and a 0.014% fall in total carbon dioxide emissions. As a result, the significant impact of China’s OFDI in improving pollution levels and air quality in the “Belt and Road” economies is somewhat clear, underscoring the model’s robustness.
Compared with previous ones, a significant portion of the pertinent research on eco-friendly development within the Belt and Road Initiative is concentrated on the provinces or cities of China (Yang and Wang, 2018; Zhang, 2018; Liu et al., 2022) [
1,
2,
3], while the research on host countries is limited. This study utilizes recent data on Chinese direct investments along the Belt and Road to enhance current research by examining the determinants and levels of carbon emissions in the Belt and Road economies. This study aims to establish a comprehensive analytical framework for systematically examining the theoretical linkages between China’s Outward Foreign Direct Investment (OFDI) and its implications for carbon emission trajectories and environmental quality under the Belt and Road Initiative (BRI), thereby informing strategic policy formulation to advance sustainable, low-carbon development pathways across BRI partner economies.
Further research strengthening this discussion would involve “regional standardization of laws” and “unobserved factors”. Specifically speaking, regional standardization of laws refers to the process within a certain geographical area where countries or regions gradually eliminate legal differences through consultation, cooperation, and other means to achieve legal coordination and unity. This process aims to promote economic, social, and cultural exchanges within the region, enhance legal efficiency, reduce transaction costs, and thereby advance the regional integration process of carbon emission reduction related to investment. At the same time, unobserved factors may include psychological factors, technical limitations, random events, and other factors that are difficult to quantify. These unobserved factors may sometimes have a significant impact on the results of this study. In-depth research will further delve into the micro level and expand to some unobserved factors.


