Article

Effects of Planting Density and Site Index on Stand and Soil Nutrients in Chinese Fir Plantations

by
He Sun
1,2,†,
Jie Lei
2,3,†,
Juanjuan Liu
2,3,
Xiaoyan Li
2,3,
Deyi Yuan
1,
Aiguo Duan
2,3,* and
Jianguo Zhang
1,2,*
1
College of Forestry, Central South University of Forestry and Technology, Changsha 410004, China
2
State Key Laboratory of Efficient Production of Forest Resources, Research Institute of Forestry, Chinese Academy of Forestry, Beijing 100091, China
3
Key Laboratory of Tree Breeding and Cultivation of National Forestry and Grassland Administration, Research Institute of Forestry, Chinese Academy of Forestry, Beijing 100091, China
*
Authors to whom correspondence should be addressed.
These authors contributed equally to this work.
Sustainability 2025, 17(13), 5867; https://doi.org/10.3390/su17135867
Submission received: 29 April 2025 / Revised: 12 June 2025 / Accepted: 20 June 2025 / Published: 26 June 2025

Abstract

This study investigated the effects of planting density and site index on stand attributes and soil nutrients in mature Chinese fir [Cunninghamia lanceolata (Lamb.) Hook.] plantations across Fujian and Sichuan Provinces, elucidating the pathways through which these factors influence standing volume (SV). The results showed that (1) planting density significantly affected stand variables, with average diameter at breast height (ADBH) decreasing and SV initially increasing and then declining with higher density. The number of mortality plants (NMP) and actual stand density (ASD) both increased significantly with higher density. Average tree height (ATH) and dominant height (DH) responses varied by region, with ATH decreasing in Sichuan and DH decreasing in Fujian with higher density. (2) Planting density affected soil nutrients differently in the two provinces, with soil total potassium (TK) increasing in Fujian and phosphorus decreasing in Sichuan. (3) Site index was positively correlated with ATH and ADBH but negatively correlated with ASD and NMP. Its relationship with soil nutrients was province-specific: in Fujian, site index was negatively correlated with total phosphorus (TP) and positively correlated with TK and soil pH, while in Sichuan it was only positively correlated with TK. (4) Structural equation modeling revealed different regulatory pathways: in Fujian, planting density influenced SV through both ASD and soil nutrients, while in Sichuan it affected only through ASD. This study highlights the region-specific interactions between planting density, site index, stand structure, and soil nutrients, providing a foundation for optimized plantation management.

1. Introduction

Sustainable forest management is critical in addressing the challenges posed by land degradation and the need for resilient ecosystems. Stand density is a critical and controllable factor in the sustainable management of artificial forests. It significantly influences plantation ecosystem stability, the maintenance of aboveground net primary productivity, and competition for underground resources [1,2,3]. Planting density affects not only stand growth and structure [4] but also alters soil physical and chemical properties [5,6,7]. The influence of stand density on forest growth and soil quality has been extensively investigated [8,9,10,11,12]. Iddrisu et al. found that a medium planting density enhanced forest growth and improved soil properties in red pine (Pinus resinosa) plantations [13]. Ali et al. observed that a lower planting density was more favorable for improving the physical and chemical soil properties of Sargasso pine (Pinus caribaea) plantations [7]. Similarly, thinning in Japanese larch (Larix kaempferi) plantations results in increased soil pH and available phosphorus content [14,15]. Studies on Chinese fir (Cunninghamia lanceolata) have shown that the rhizosphere soil in low-density plantations contains higher levels of various phosphorus forms compared to high-density stands. Reducing stand density in Chinese fir plantations can enhance the supply of available phosphorus (AP), thereby better meeting the nutrient requirements of the trees [16].
The site index, a widely used forest management indicator, is defined as the dominant height of a stand at a specific age and serves as a proxy for the potential productivity of plantation forests [17,18,19,20,21]. It profoundly influences stand and soil systems by regulating nutrient supply, water retention capacity, and microenvironmental conditions. Some studies have reported that under favorable site conditions net primary productivity in younger stands increases more rapidly [22]. However, research on Australian mountain ash (Eucalyptus regnans F. Muell.) found no significant impact of site index on maximum stand density or the self-thinning index [23]. In Western hemlock (Tsuga heterophylla), soil pH and the carbon-to-nitrogen ratio rise sharply with increasing site index before eventually stabilizing [24]. In Sitka spruce (Picea sitchensis (Bong.) Carr.) plantations within humid climates, soil nutrient content shows a strong correlation with variations in site index [25]. Similarly, in natural Red pine (Pinus resinosa Ait.) stands, site index is significantly associated with soil nitrogen, potassium, and cation exchange capacity [26].
Chinese fir [Cunninghamia lanceolata (Lamb.) Hook.], commonly known as Chinese fir, is one of China’s most widely cultivated timber species, valued for its rapid growth and high economic return, particularly in the Yangtze River Basin and the southern Qinling Mountains [27]. According to the Ninth National Forest Resource Inventory, C. lanceolata accounts for about 25% of the area and 33% of the volume of China’s total artificial tree plantations [28]. Improving plantation quality and maintaining soil fertility have become pressing concerns in the management of Chinese fir forests. As these stands mature and canopy closure intensifies, challenges such as stand structure deterioration and significant soil nutrient depletion emerge, limiting both growth potential and long-term ecological stability. Current research on Chinese fir plantations primarily focuses on specific localities, with relatively few studies comparing plantations across different regions [29,30,31]. Research on the effects of stand density on stand characteristics and soil nutrients in Chinese fir plantations has primarily concentrated on density influences, with relatively few studies examining the role of site index. As a result, the combined effects of stand density and site index on the growth and soil properties of Chinese fir plantations remain poorly understood. Structural equation modeling (SEM) has rarely been applied to investigate the pathways influencing stocking decisions in Chinese fir plantations. Applying SEM to analyze the relationships among stand density, site index, and stocking integrates silvicultural parameters with statistical models, offering new insights into stand productivity regulation. In this study, SEM was employed to assess the influence pathways of stand volume in cedar plantations, quantifying both the direct and indirect effects of management practices on productivity. This study presents a comprehensive analysis of how planting density and site index affect stand characteristics and soil nutrient variables in Chinese fir plantations across Fujian and Sichuan provinces, as well as their combined impact on stand productivity, particularly stand volume. This study aimed to offer theoretical insights and technical support for optimizing density configurations and implementing site-adaptive management strategies in mature Chinese fir plantations, thereby promoting both ecological and economic sustainability.
The main objectives of this study are to (1) analyze the effects of planting density on stand characteristics and soil nutrient variables; (2) examine the effects of site index on these variables; and (3) explore the pathways through which planting density and site index influence standing volume using structural equation modeling.

2. Materials and Methods
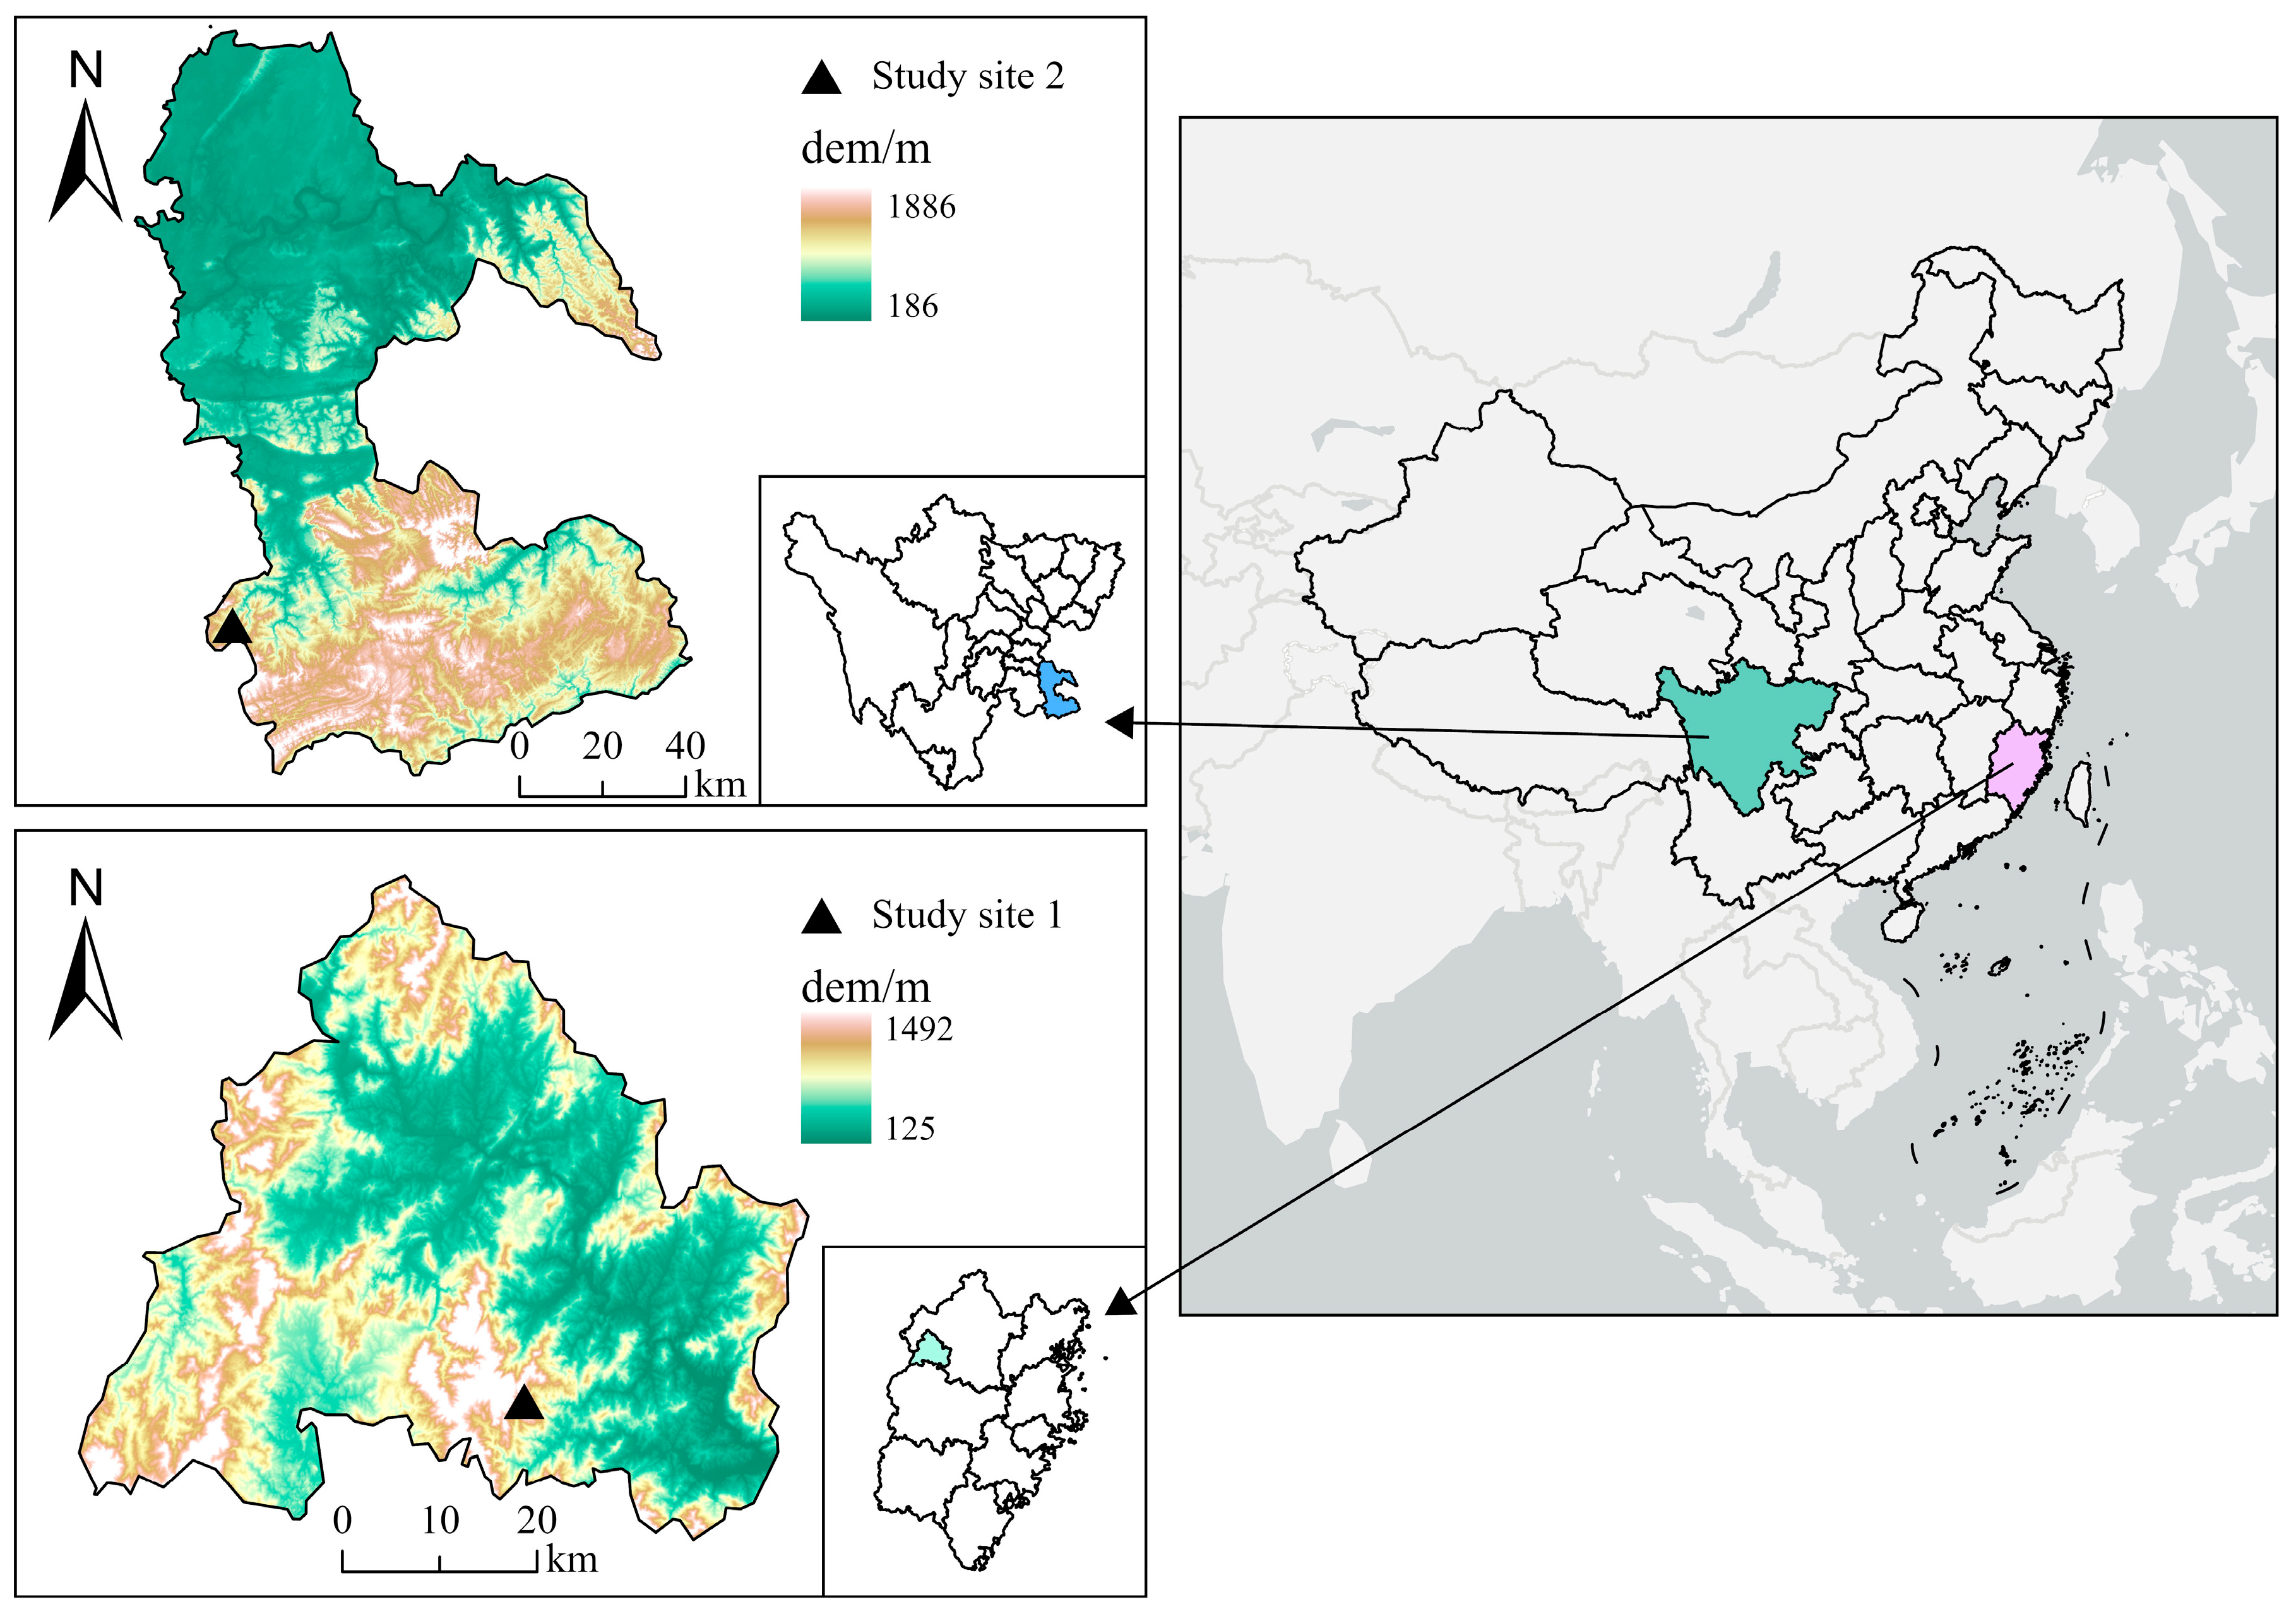
2.1. Study Area

In the spring of 1981, Chinese fir plantations were established in two regions (Figure 1). The first study site was located at Weimin Town National Forest Farm, Shaowu City, Fujian Province (27°05′ N, 117°43′ E), and the second at a forest farm in Minsheng Village, Naxi District, Sichuan Province (28°47′ N, 105°23′ E). Naxi District, situated in the southern part of the Sichuan Basin, experiences a subtropical humid monsoon climate characterized by four distinct seasons, mild temperatures, and abundant rainfall. The region has an average annual temperature of 17.5 °C and an annual precipitation of 1182 mm, with terrain dominated by high hills. Shaowu City has a subtropical monsoon climate with abundant rainfall ranging from 1500 to 2100 mm annually. Its soil primarily comprises red soil developed from granite parent material, with a soil depth exceeding 1.00 m (Table 1). Fujian features high site quality with favorable climatic and edaphic conditions. In contrast, Sichuan represents an inland mountainous area with lower site quality. These differences make the two provinces ideal for comparative analysis of stand and soil responses to planting density and site conditions.
Five planting densities were implemented in the experimental forests of each study region: 1667 trees·hm−2 (Density A), 3333 trees·hm−2 (Density B), 5000 trees·hm−2 (Density C), 6667 trees·hm−2 (Density D), and 10,000 trees·hm−2 (Density E). The corresponding row spacings were 2 m × 3 m, 2 m × 1.5 m, 2 m × 1 m, 1 m × 1.5 m, and 1 m × 1 m, respectively. Each sample plot covered 600 m2, with three replicates established per density, resulting in a total of 15 plots for each region.

2.2. Sample Collection and Measurement

Soil sampling was performed in 2011 in the mature 30-year-old plantation. In each sample plot, three 1 m × 1 m soil sampling points were selected along the diagonal. Approximately 1 kg of soil was collected from the center of each point at depths of 0–100 cm for physicochemical analysis. To reduce spatial heterogeneity in soil nutrients, the samples from the three points within each plot were thoroughly mixed to form a composite sample. Consequently, one composite sample was obtained per plot, yielding a total of 30 composite soil samples for nutrient content and pH determination.
Additionally, various stand structure parameters were measured when the stand reached 30 years of age, including average tree height (ATH), average diameter at breast height (ADBH), dominant height (DH), standing volume (SV), actual stand density (ASD), and number of mortality plants (NMP). ATH was calculated by randomly selecting at least 20 representative trees per plot, measuring their heights with height poles, and computing the mean [32]. ADBH was determined by measuring the diameter at 1.3 m above ground level for all live trees using a breast height ruler. DH was defined as the mean height of the top 20% of Chinese fir trees ranked by DBH within each plot [33]. SV was calculated by summing the total volume of all live trees, based on the number of surviving plants and the average wood volume per plant, and converting the result to a per-hectare basis (m3·ha−2). ASD was obtained by counting all live trees within the plot and expressing this as plants per hectare. NMP was recorded by tallying naturally dead or fallen trees in each plot. Additionally, the average height of dominant trees in 20-year-old Chinese fir plantations was used to assess the site index of each plot (Table 2). The average wood volume per plant was estimated using the empirical formula provided in the Departmental Frequency Fir Binary Stump Collection Table [34], as follows:
V = 0.000058777042D1.9699831 × H0.89646157
Soil nutrient content and soil pH were determined following standardized methods established by the Society of Soil Science of China [35]. Soil organic matter (SOM) was quantified via potassium dichromate volumetric oxidation at high temperature. Total nitrogen (TN) was determined using the Kelvin-distillation titration method, while total phosphorus (TP) was measured using the sodium hydroxide melting–molybdenum-antimony anti-colorimetric method. Total potassium (TK) was assessed via sodium hydroxide melting. Available nitrogen (AN) was measured through flame atomic absorption spectrophotometry, and available phosphorus (AP) was extracted using hydrochloric acid–ammonium fluoride and analyzed via the molybdenum–antimony anti-colorimetric method. Available potassium (AK) was determined by neutral ammonium acetate leaching followed by flame photometry. Soil pH was measured potentiometrically with a standardized glass electrode system.

2.3. Data Analysis

A one-way analysis of variance (ANOVA) was employed to examine the effects of planting density on stand structure and soil nutrient parameters in Fujian and Sichuan provinces. Post hoc multiple comparisons were conducted using the least significant difference (LSD) method at a significance level of p < 0.05. Prior to conducting one-way ANOVA, the normality of the residuals was assessed using the Shapiro–Wilk test, and homogeneity of variances was tested using Levene’s test. Correlation analyses were subsequently performed to explore relationships among site index, stand factors, and soil nutrient factors in both provinces. Structural equation modeling (SEM) was used to investigate the direct and indirect effects of planting density and site index on SV. SV was chosen as the dependent variable because it represents stand productivity, a key indicator of forest performance, and is influenced by ASD and soil nutrients. To address multicollinearity in the SEM, principal component analysis (PCA) was applied to reduce the dimensionality of eight soil nutrient variables. Based on eigenvalues ≥ 1 and maximum variance rotation, two principal components were extracted, referred to as the “soil C-N-P factor” and the “soil K-pH factor” (Table A1 and Table A2). These components were subsequently incorporated into the SEM in place of the original soil nutrient variables. SEM was conducted using the “plspm” package and the sem() function [3]. All statistical analyses were conducted using R 4.3.0, with statistical plots generated in both Origin 2022 and R 4.3.0.

3. Results

3.1. Effect of Planting Density on Stand Factors in Mature Chinese Fir Plantations

Planting density exhibited a significant influence on ATH, but this effect varied across regions. In Sichuan, planting density significantly influenced ATH (p < 0.05; Figure 2a). Overall, ATH declined with increasing planting density, except for a notable increase at density D. The ATH values at densities A, B, C, D, and E were 13.21 m, 11.75 m, 11.25 m, 12.24 m, and 11.13 m, respectively. In contrast, in Fujian, planting density had no significant effect on ATH, where values across densities A to E fluctuated between 15.73 m and 18.83 m.
Planting density significantly affected ADBH in both provinces (p < 0.05; Figure 2b), with ADBH decreasing as planting density increased. In Fujian, ADBH declined from 22.06 cm at density A to 14.77 cm at density E. Similarly, in Sichuan, ADBH decreased from 16.24 cm to 11.03 cm across the same density range.
The effect of planting density on DH varied between the two provinces (Figure 2c). In Fujian, DH significantly decreased with increasing planting density (p < 0.05), dropping from 23.33 m at density A to 18.54 m at density E. In Sichuan, however, no significant differences in DH were observed (p > 0.05), with values ranging narrowly from 15.80 m to 16.59 m across densities A to E.
Planting density significantly influenced SV in both provinces (p < 0.05; Figure 2d), though the response patterns differed. In Fujian, SV showed no significant differences among densities A, B, and C (649.47–694.69 m3·ha−1) but slightly increased to 698.83 m3·ha−1 at density D before significantly declining to 577.37 m3·ha−1 at density E (p < 0.05). In Sichuan, SV remained similar across densities A, B, and C (170.49~173.52 m3·ha−1), significantly increased to 215.06 m3·ha−1 at density D (p < 0.05), and slightly decreased to 199.90 m3·ha−1 at density E.
As shown in Figure 2e, planting density significantly affected ASD in both provinces (p < 0.05). In Fujian, ASD significantly increased from 1578 to 2962 plants per hectare as density rose from A to C (p < 0.05), but no significant differences were detected among densities C, D, and E (2962~3162 plants per hectare; p > 0.05). In Sichuan, ASD increased significantly from 1072 to 2705 plants per hectare between densities A and D (p < 0.05), but no significant difference was observed between densities D (2705 plants/ha) and E (2800 plants/ha; p > 0.05).
Planting density had a significant impact on NMP in both Fujian and Sichuan provinces (p < 0.05, Figure 2f), with NMP increasing as planting density increased. In Fujian, NMP rose from 898 to 6883 plants per hectare as density increased from A to E. Similarly, in Sichuan, NMP increased from 5958 to 72,008 plants per hectare over the same density range.

3.2. Effect of Planting Density on Soil Nutrient Factors in Mature Chinese Fir Plantations

As shown in Figure 3a, SOM content did not differ significantly across planting densities in either province (p > 0.05). In Sichuan, SOM content fluctuated between 9.30 and 14.41 g/kg without a clear trend, with the highest SOM recorded at density B. In Fujian, SOM values ranged from 18.12 to 22.23 g/kg, peaking at density D.
The effect of planting density on soil TN content is depicted in Figure 3b. Planting density had no significant effect on TN content in either province (p > 0.05). In Sichuan, soil TN content initially increased and then decreased with planting density, reaching a maximum of 0.52 g/kg at density D. In Fujian, no consistent trend was observed, though the highest TN content (0.93 g/kg) occurred at density D and the lowest (0.78 g/kg) at density E.
As is shown in Figure 3c, the effects of planting density on soil AN content varied between the two provinces. In Fujian, no significant differences in soil AN content were observed among the different planting densities (p > 0.05), with values ranging from 68.03 to 77.97 mg/kg. The highest AN content was recorded in stands with density A. In contrast, in Sichuan, significant differences were detected (p < 0.05), with stands at density B (59.58 mg/kg) exhibiting significantly higher AN content than those at densities A, C, and D (30.45–39.18 mg/kg).
Planting density significantly affected soil TP content in Fujian (p < 0.05), while no significant effects were observed in Sichuan (Figure 3d). In Fujian, soil TP content differed significantly among densities (p < 0.05). Stands at densities C (0.49 g/kg) and D (0.50 g/kg) had the highest TP content, significantly exceeding that of stands at density B (0.44 g/kg; p < 0.05). No significant differences were observed between densities A (0.48 g/kg) and E (0.47 g/kg) compared to other densities (p > 0.05). In Sichuan, soil TP content was relatively low (0.05–0.10 g/kg) and showed no significant variation across planting densities.
Planting density had different effects on soil available phosphorus (AP) content in the two provinces (Figure 3e). In Fujian, soil AP content increased with planting density, rising from 2.11 mg/kg at density A to 2.82 mg/kg at density E; however, the differences were not statistically significant (p > 0.05). In Sichuan, soil AP content decreased with increasing planting density. The A-density stands (1.23 mg/kg) had significantly higher AP content than stands at densities C, D, and E (0.29, 0.34, and 0.42 mg/kg, respectively; p < 0.05), whereas no significant difference was found between the B-density stand (0.84 mg/kg) and the others (p > 0.05).
As shown in Figure 3f, planting density had a significant positive effect on soil TK content in both provinces. In Fujian, soil TK content increased with planting density, from 18.55 g/kg in the A-density stand to 25.93 g/kg in the E-density stand. A significant difference was found between the A- and B-density stands (p < 0.05), but no significant differences were observed among the higher-density stands (p > 0.05). Similarly, in Sichuan, soil TK content increased with planting density. The E-density stand (28.58 g/kg) exhibited significantly higher TK content than the D-density stand (21.58 g/kg), which in turn was significantly higher than the A-, B-, and C-density stands (13.76, 11.69, and 14.51 g/kg, respectively; p < 0.05).
Planting density had a non-linear and region-specific effect on soil AK content (Figure 3g). In Fujian, soil AK content initially increased from density A to B, reaching a peak of 62.24 mg/kg, then declined with further increases in planting density, reaching a minimum of 47.88 mg/kg at density E, significantly lower than in the B-density stand (p < 0.05). In Sichuan, soil AK content decreased sharply from density A (75.50 mg/kg) to B (31.21 mg/kg; p < 0.05), then rose significantly to 52.67 mg/kg at density C (p < 0.05), before declining again at densities D (37.97 mg/kg) and E (42.95 mg/kg; p < 0.05).
Planting density exhibited distinct effects on soil pH in the two study regions (Figure 3h). In Sichuan, soil pH consistently increased with planting density. Soil pH in density A (3.91) and B (3.89) stands was significantly lower than in D (4.01) and E (4.03) stands (p < 0.05), while no significant differences were observed between C (3.97) and the higher densities (D and E). In Fujian, soil pH values across all planting densities ranged from 4.28 to 4.51, with no significant differences among them (p > 0.05).

3.3. Effect of Site Index on Soil Nutrients and Stand Variables

The correlation analysis (Table 3) demonstrated that the site index had a significant impact on stand growth characteristics in both regions. Across provinces, site index exhibited strong positive correlations with ATH, ADBH, and DH. Specifically, ATH was strongly correlated with site index in both Fujian (r = 0.84 **) and Sichuan (r = 0.79 **). Similar patterns were observed for ADBH (Fujian: r = 0.57 **; Sichuan: r = 0.76 **) and DH (Fujian: r = 0.96 **; Sichuan: r = 0.49 **). SV also showed a significant positive correlation with site index in Fujian (r = 0.55 **), though not in Sichuan. Conversely, site index was significantly negatively correlated with ASD and NMP in both Fujan (ASD: r = −0.49 **; NMP: r = −0.25 *) and Sichuan (ASD: r = −0.53 **; NMP: r = −0.50 **).
Correlation analysis showed that site index was variably correlated with soil nutrients in the two regions (Table 4). In Fujian, the site index was significantly negatively correlated with soil TP (−0.54 **), and significantly positively correlated with soil TK (0.37 **) and pH (0.27 *). In Sichuan, a significant positive correlation was observed between the site index and soil AK (0.37 **).

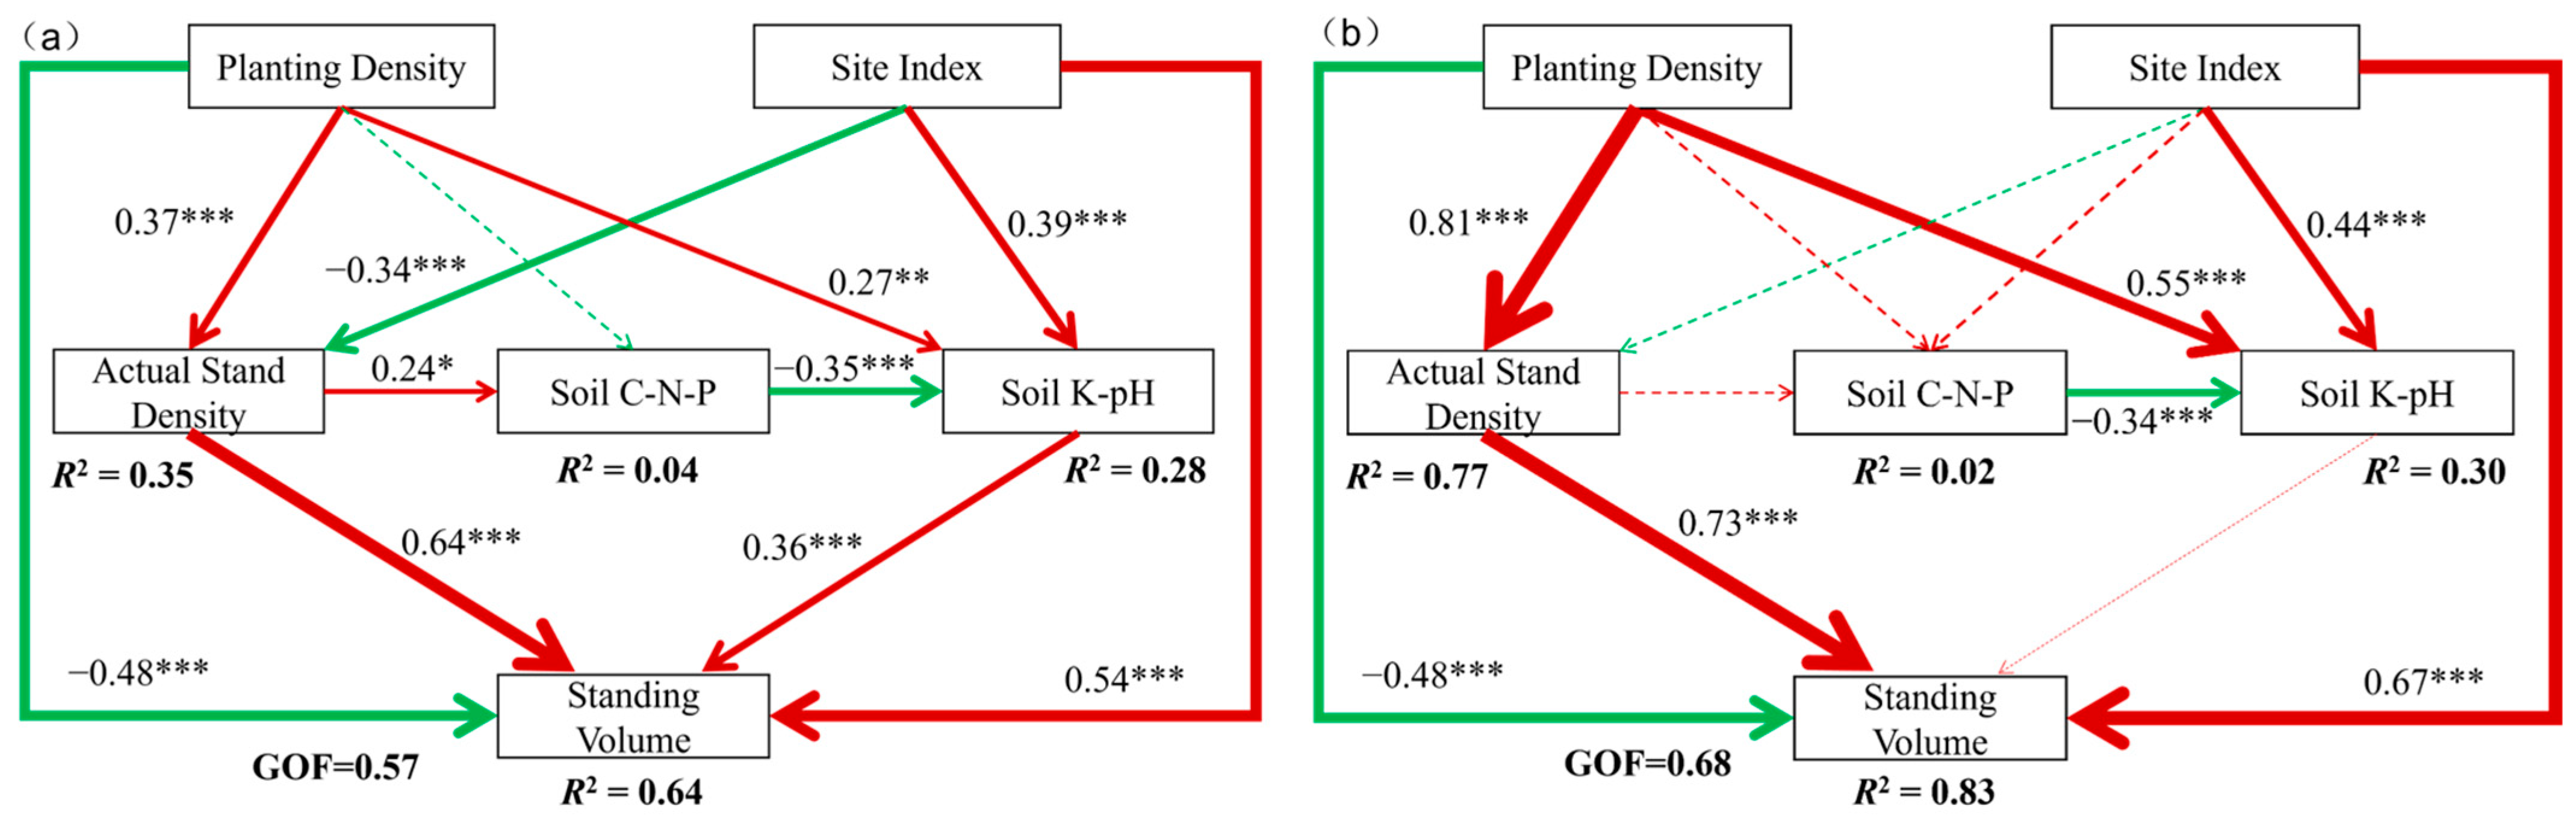
3.4. Pathway Analysis of the Effects of Planting Density and Site Index on Standing Volume

Structural equation modeling (SEM) results (Figure 4) revealed that planting density and site index both had significant direct effects on SV in Fujian and Sichuan (Figure 4a,b). In both regions, planting density had a significant negative effect on SV (–0.48 ***, –0.48 ***), while site index had a positive effect, stronger in Sichuan (0.67 ***) than in Fujian (0.54 ***).
Planting density also indirectly influenced SV through ASD (Figure 4a,b). It significantly increased ASD in both provinces (Fujian: 0.37 ***; Sichuan: 0.81 ***), and ASD in turn had a strong positive effect on SV (Fujian: 0.64 ***; Sichuan: 0.73 ***). However, site index negatively affected ASD only in Fujian (−0.34 ***), and this pathway was not significant in Sichuan.
Soil nutrient factors contributed to SV variation primarily in Fujian (Figure 4a). There, both planting density (0.27 **) and site index (0.39 ***) positively influenced the soil K–pH factor, which subsequently enhanced SV (0.36 ***). Moreover, ASD positively affected the soil C–N–P factor (0.24 *), which had a negative effect on the K–pH factor (–0.35 ***). In Sichuan, however, indirect effects through soil nutrients were not significant (Figure 4b).
The SEM explained a substantial proportion of variance in SV in both regions (Fujian: 64%; Sichuan: 85%), but the contributing pathways differed, with soil nutrients playing a more prominent mediating role in Fujian (Figure 4a,b).

4. Discussion

4.1. Effects of Planting Density on Stand and Soil Nutrient Factors

The results indicated that stand variables in Fujian and Sichuan responded similarly to planting density, with ADBH decreasing as planting density increased. Consistent with previous studies, ADBH was found to significantly decline with increasing density at equivalent stand ages [36]. In high-density stands, trees allocate more photosynthetic products to height growth to outcompete neighboring trees for light, thereby constraining radial growth [37]. Both NMP and ASD increased with planting density in Fujian and Sichuan, likely due to intensified intraspecific competition. When planting density exceeded the competition threshold, individual survival rates declined, reducing the number of live stems per unit area [38,39]. Although NMP increased under higher densities, ASD remained significantly greater than in lower-density stands. SV initially rose with increasing planting density, reaching a maximum at the D density level, before subsequently declining. This trend may reflect a compensatory effect: while ADBH was lower in high-density stands, the overall increase in tree number initially offset this limitation, enhancing total stocking. However, beyond the D density threshold, stand stocking approached the site’s carrying capacity, and further increases in density did not yield additional gains in SV. The study also revealed provincial differences in stand responses to planting density. In Fujian, DH significantly declined with increasing density, whereas in Sichuan no significant effect was observed. This discrepancy may be attributed to differences in site quality; Fujian’s higher site index, characterized by fertile soils and ample water availability, promotes vigorous growth, thereby intensifying light competition under high-density planting and limiting individual tree development [40]. Conversely, in Sichuan, where site quality is comparatively lower, tree growth was primarily constrained by nutrient and water limitations, diminishing the observable effects of density.
Regarding soil nutrients, soil AP content in Sichuan significantly decreased with increasing planting density, consistent with prior findings that lower planting densities promote phosphorus accumulation [16,41]. High planting densities likely intensified phosphorus uptake by trees to sustain elevated standing volumes, resulting in soil phosphorus depletion. Additionally, soil pH in Sichuan’s plantations significantly increased with density, paralleling observations in Guangxi’s fir forests [42]. This pH rise may be attributed to the greater deposition of apoplastic material in denser stands, where decomposition processes release alkaline calcium and magnesium ions that replace H+ on soil colloids via ion exchange. In Fujian, soil TK content significantly increased with planting density, likely due to greater litter production in high-density stands, enhancing potassium release during litter decomposition [43].

4.2. Effect of Site Index on Stand and Soil Nutrient Factors

This study identified a significant positive correlation between site index and stand factors, including ATH, ADBH, and SV. Higher site index plots benefited from a combination of greater soil nutrient availability, higher moisture content, and favorable climatic conditions, providing abundant nutrients to the root system [24,25]. Under such conditions, ample photosynthate production, coupled with increased nitrogen and phosphorus uptake by the roots, promoted tree growth and development, thereby enhancing SV. Moreover, the higher soil water-holding capacity associated with high site index stands likely alleviated drought stress and extended the duration of photosynthesis, further contributing to increases in DH, DBH, and stocking capacity [44,45].
In Chinese fir plantations in Fujian and Sichuan Provinces, site index was also significantly positively correlated with soil potassium content. This relationship may arise because stands with higher site index generally possess more favorable soil thickness, slope orientation, and moisture conditions, all of which accelerate apoplastic decomposition and mineral weathering rates. Consequently, apoplastic mineralization and nutrient accumulation occur at higher annual rates in high site index stands compared to low site index stands [46]. In addition, the proportion of fine root biomass is typically greater in high site index soils. Root exudates, such as oxalic and citric acids, can mobilize potassium in acidic soils, thereby increasing soil potassium availability [46]. This study further found that the neutralization index was significantly negatively correlated with soil phosphorus content in Chinese fir plantations in Fujian Province. Given the widespread phosphorus limitation observed in southern China’s Chinese fir forests [47,48], low site index plots often exhibited insufficient phosphorus availability to support forest growth, masking the relationship between stand index and soil phosphorus content. In contrast, high site index plots generally had higher phosphorus reserves; as stand index increased, intensified forest growth and phosphorus uptake led to a reduction in soil phosphorus levels.

4.3. Pathways of Planting Density and Stand Index on Stand Productivity

Using SEM, this study analyzed the pathways through which planting density, site index, and other factors influenced SV in mature stands across Fujian and Sichuan Provinces. The results demonstrated that SV was significantly affected by both planting density and site index in both regions, although the strength and mechanisms of these effects differed between provinces. In Fujian, planting density directly suppressed, and site index directly promoted, SV. Additionally, both factors indirectly influenced SV by altering ASD, which had a significant positive effect on SV. ASD also affected the soil K-pH factor through its influence on the soil C-N-P factor, ultimately impacting SV. These findings highlight the critical role of soil nutrients as foundational resources supporting forest growth and productivity [49,50]. In contrast, although the negative effect of planting density and the positive effect of site index on SV remained significant in Sichuan, the influence of site index on ASD was not significant. This may be attributed to the severe soil acidification prevalent in Sichuan’s Chinese fir plantations, where nutrient availability is markedly reduced in acidic soils [51]. Consequently, increases in site index could not fully offset the nutrient limitations constraining forest growth and productivity.

5. Conclusions and Suggestions

5.1. Conclusions

This study systematically examined the effects of planting density and site index on stand structure and soil nutrients in mature Chinese fir plantations in Fujian and Sichuan Provinces, employing ANOVA, correlation analysis, and SEM. The major conclusions are as follows:
(1) With increasing planting density, ADBH significantly declined. SV initially increased and then declined with rising planting density, reaching its maximum at density D. Both NMP and ASD increased significantly as planting density increased. However, the response of ATH varied between provinces: ATH generally decreased with increasing planting density in Sichuan but rebounded at density D. Whereas, in Fujian ATH was not significantly affected by planting density. Similarly, DH decreased significantly with increasing density in Fujian but showed no significant change in Sichuan.
(2) Planting density significantly affected soil nutrient factors. Across both regions, TK and AK were consistently influenced, with TK showing a significant increase under higher planting densities. In Fujian, soil TP and AK exhibited fluctuating trends with changing density. In Sichuan, planting density had broader effects, significantly altering soil AN, AP, TK, AK, and pH. Notably, soil AP content decreased with increasing density, while soil pH significantly increased.
(3) The site index exhibited significant positive correlations with stand factors such as ATH, ADBH, and SV, and significant negative correlations with ASD and NMP. The influence of site index on soil nutrients was regionally distinct: in Fujian, the site index was significantly negatively correlated with TP and positively correlated with TK, while in Sichuan it showed a significant positive correlation with soil AK.
(4) SEM revealed that planting density and site index directly affected SV and indirectly regulated it through ASD and soil nutrient factors. In Fujian, ASD and soil nutrients both exerted strong positive effects on SV, whereas in Sichuan only ASD had a significant positive effect.
This study elucidates the complex interrelationships between planting density, site index, stand factors, and soil nutrient factors in Chinese fir plantations, offering theoretical insights for density optimization, nutrient conservation, and adaptive management in Chinese fir plantations. These findings contribute valuable knowledge to support region-specific strategies for sustainable forest management.

5.2. Suggestions

Based on the results of this study, the following management suggestions for Chinese fir plantations in Fujian and Sichuan Provinces are proposed:
(1) Optimized planting density management for sustainable productivity: This study found that SV peaked at density D in both provinces. Therefore, in Chinese fir plantation management, D density (6667 trees/ha) should be used as the upper threshold for initial afforestation density to maximize stocking capacity while avoiding excessive competition. Additionally, management should be tailored to site-specific conditions, increasing density in high site index areas and reducing it in low site index areas to maintain ecological stability.
(2) Soil nutrient monitoring and management: This study shows that excessively high planting density may deplete soil phosphorus, which affects tree growth. Therefore, in high-density stands, soil phosphorus levels should be regularly monitored and supplemented, if necessary, particularly in regions like Sichuan with already low AP levels. Additionally, in low-density stands, early attention should focus on compensating for the low apoplastic material levels, which do not replenish sufficient nutrients to the forest floor, by applying appropriate fertilizers and improving soil quality.
(3) Utilization of stand conditions: The response paths of SV differed across site index. In Fujian, a high site index area, sufficient nutrient supply promoted the accumulation of SV. In Sichuan, a low site index area, lower nutrient levels limited SV increase. Therefore, forest managers should adopt site-specific strategies—in high site index areas, density should be increased, but productivity should be maintained through thinning and fertilization after forest maturity. In low site index areas, density should be controlled and fertilizers applied rationally to reduce resource competition, increase growth rate, and prevent plantation decline.

Author Contributions

Conceptualization, H.S. and J.L. (Jie Lei); methodology, H.S. and J.L. (Jie Lei); software, X.L.; validation, H.S. and J.L. (Jie Lei); formal analysis, H.S. and J.L. (Jie Lei); investigation, J.L. (Juanjuan Liu); resources, D.Y.; data curation, H.S.; writing—original draft preparation, H.S.; writing—review and editing, H.S. and J.L. (Jie Lei); visualization, H.S.; supervision, A.D.; project administration, J.Z.; funding acquisition, A.D. and J.Z. All authors have read and agreed to the published version of the manuscript.

Funding

This research was funded by the National Key Research and Development Program of China (No. 2021YFD2201300) and the National Natural Science Foundation of China (No. 32271862).

Institutional Review Board Statement

Not applicable.

Informed Consent Statement

Not applicable.

Data Availability Statement

The datasets referenced in this study are not publicly accessible as they are part of an ongoing research project. For access, please contact Ms. Sun at sunhe1323@163.com.

Conflicts of Interest

The authors declare no conflicts of interest.

Appendix A

Table A1. Principal component total variance explanation for soil nutrients.
Initial EigenvalueExtracted Load Squared
ComponentTotalVariance
Percentage
%
Cumulative
%
TotalVariance
Percentage
%
Cumulative
%
13.0137.6337.633.0137.6337.63
22.2027.5665.192.2027.5665.19
30.8310.4075.59
40.556.8882.48
50.475.9688.45
60.394.9093.36
70.283.6196.97
80.243.02100.00
Table A2. Rotated component matrix for Soil nutrients.
VariableComponent
12
SOM0.89-
TN0.80-
AN0.84−0.25
TP0.660.16
AP0.500.29
TK-0.88
AK0.170.83
pH-0.73

References

  1. la Marca, O.; Marziliano, P.A.; Moretti, N. Experimental research in ageing holm oak (Quercus ilex L.) coppices: Preliminary results. Ann. For. Sci. 1998, 55, 461–476. [Google Scholar] [CrossRef]
  2. Harrington, T.B.; Harrington, C.A.; DeBell, D.S. Effects of planting spacing and site quality on 25-year growth and mortality relationships of Douglas-fir (Pseudotsuga menziesii var. menziesii). For. Ecol. Manag. 2009, 258, 18–25. [Google Scholar] [CrossRef]
  3. Sun, H.; Lei, J.; Liu, J.; Zhang, X.; Yuan, D.; Duan, A.; Zhang, J. Soil Comprehensive Fertility Changes in Response to Stand Age and Initial Planting Density of Long-Term Spacing Trials of Chinese Fir Plantations. Forests 2025, 16, 224. [Google Scholar] [CrossRef]
  4. Chen, X. Studies on the growth features and stand strcutures of 30-year-old Pinus msssoniana forests with various densities. J. Fujian For. Sci. Technol. 1995, 22, 40–43. [Google Scholar]
  5. Bahru, T.; Ding, Y. Effect of stand density, canopy leaf area index and growth variables on Dendrocalamus brandisii (Munro) Kurz litter production at Simao District of Yunnan Province, southwestern China. Glob. Ecol. Conserv. 2020, 23, e01051. [Google Scholar] [CrossRef]
  6. Alaback, P.B.; Herman, F.R. Long-term response of understory vegetation to stand density in Picea-Tsuga forests. Can. J. For. Res. 1988, 18, 1522–1530. [Google Scholar] [CrossRef]
  7. Ali, A.; Dai, D.; Akhtar, K.; Teng, M.; Yan, Z.; Urbina-Cardona, N.; Mullerova, J.; Zhou, Z. Response of understory vegetation, tree regeneration, and soil quality to manipulated stand density in a Pinus massoniana plantation. Glob. Ecol. Conserv. 2019, 20, e00775. [Google Scholar] [CrossRef]
  8. O’Hara, K.L. Stand structure and growing space efficiency following thinning in an even-aged Douglas-fir stand. Can. J. For. Res. 1988, 18, 859–866. [Google Scholar] [CrossRef]
  9. Schönau, A.P.G.; Coetzee, J. Initial spacing, stand density and thinning in eucalypt plantations. For. Ecol. Manag. 1989, 29, 245–266. [Google Scholar] [CrossRef]
  10. Hernández, J.; del Pino, A.; Vance, E.D.; Califra, Á.; Del Giorgio, F.; Martínez, L.; González-Barrios, P. Eucalyptus and Pinus stand density effects on soil carbon sequestration. For. Ecol. Manag. 2016, 368, 28–38. [Google Scholar] [CrossRef]
  11. Noh, N.J.; Son, Y.; Lee, S.K.; Yoon, T.K.; Seo, K.W.; Kim, C.; Lee, W.-K.; Bae, S.W.; Hwang, J. Influence of stand density on soil CO2 efflux for a Pinus densiflora forest in Korea. J. Plant Res. 2010, 123, 411–419. [Google Scholar] [CrossRef] [PubMed]
  12. Kara, F.; Topaçoğlu, O. Influence of stand density and canopy structure on the germination and growth of Scots pine (Pinus sylvestris L.) seedlings. Environ. Monit. Assess. 2018, 190, 749. [Google Scholar] [CrossRef] [PubMed]
  13. Iddrisu, A.-Q.; Hao, Y.; Issifu, H.; Getnet, A.; Sakib, N.; Yang, X.; Abdallah, M.M.; Zhang, P.J.F. Effects of Stand Density on Tree Growth, Diversity of Understory Vegetation, and Soil Properties in a Pinus koraiensis Plantation. Forests 2024, 15, 1149. [Google Scholar] [CrossRef]
  14. Wang, S.T.; Li, H. The effect of thinning on the soil physical and chemical properties of Larix kaempferi plantation. J. Liaoning For. Sci. Technol. 2019, 293, 46–48. [Google Scholar]
  15. Dai, X.J. Effects of soil fertility on Tending Thinning on the forest in cold area. For. Prospect. Des. 2016, 4, 76. [Google Scholar]
  16. Fang, X.-M.; Zhang, X.-L.; Zong, Y.-Y.; Zhang, Y.; Wan, S.-Z.; Bu, W.-S.; Chen, F.-S.; Paz-Ferreiro, J. Soil phosphorus functional fractions and tree tissue nutrient concentrations influenced by stand density in subtropical Chinese fir plantation forests. PLoS ONE 2017, 12, e0186905. [Google Scholar] [CrossRef]
  17. Bergès, L.; Chevalier, R.; Dumas, Y.; Franc, A.; Gilbert, J.-M. Sessile oak (Quercus petraea Liebl.) site index variations in relation to climate, topography and soil in even-aged high-forest stands in northern France. Ann. For. Sci. 2005, 62, 391–402. [Google Scholar] [CrossRef]
  18. Seynave, I.; Gégout, J.-C.; Hervé, J.-C.; Dhôte, J.-F.; Drapier, J.; Bruno, É.; Dumé, G. Picea abies site index prediction by environmental factors and understorey vegetation: A two-scale approach based on survey databases. Can. J. For. Res. 2005, 35, 1669–1678. [Google Scholar] [CrossRef]
  19. Jianbo, S.; Xiangdong, L.; Yuancai, L.; Yutang, L. Comparison between site index and site form for site quality evaluation of Larix olgensis plantation. J. Beijing For. Univ. 2018, 40, 1–8. [Google Scholar]
  20. Kayahara, G.J.; Klinka, K.; Marshall, P.L. Testing site index–site-factor relationships for predicting Pinus contorta and Picea engelmannii × P. glauca productivity in central British Columbia, Canada. For. Ecol. Manag. 1998, 110, 141–150. [Google Scholar] [CrossRef]
  21. Sharma, R.P.; Brunner, A.; Eid, T. Site index prediction from site and climate variables for Norway spruce and Scots pine in Norway. Scand. J. For. Res. 2012, 27, 619–636. [Google Scholar] [CrossRef]
  22. Yu, Y.; Chen, J.M.; Yang, X.; Fan, W.; Li, M.; He, L.; Yang, J. Influence of site index on the relationship between forest net primary productivity and stand age. PLoS ONE 2017, 12, e0177084. [Google Scholar] [CrossRef] [PubMed]
  23. Tang, S.; Meng, F.-R.; Meng, C.H. The impact of initial stand density and site index on maximum stand density index and self-thinning index in a stand self-thinning model. For. Ecol. Manag. 1995, 75, 61–68. [Google Scholar] [CrossRef]
  24. Kayahara, G.J.; Carter, R.E.; Klinka, K. Site index of western hemlock (Tsuga heterophylla) in relation to soil nutrient and foliar chemical measures. For. Ecol. Manag. 1995, 74, 161–169. [Google Scholar] [CrossRef]
  25. Farrelly, N.; Dhubháin, Á.N.; Nieuwenhuis, M. Sitka spruce site index in response to varying soil moisture and nutrients in three different climate regions in Ireland. For. Ecol. Manag. 2011, 262, 2199–2206. [Google Scholar] [CrossRef]
  26. Alban, D.H. Red pine site index in Minnesota as related to soil and foliar nutrients. For. Sci. 1974, 20, 261–269. [Google Scholar]
  27. Zhang, Y.; Xu, Q.; Zhang, B.; Gao, D.; Wang, T.; Xu, W.; Ren, R.; Wang, S. Contrasting water-use patterns of Chinese fir among different plantation types in a subtropical region of China. Front. Plant Sci. 2022, 13, 946508. [Google Scholar] [CrossRef]
  28. Liu, Z.; Zhong, Y.; Chen, Z.; Wei, J.; Li, D.; Zhang, S. Landscape Dynamics, Succession, and Forecasts of Cunninghamia lanceolata in the Central Producing Regions of China. Forests 2024, 15, 1817. [Google Scholar] [CrossRef]
  29. Chen, H. Phosphatase activity and P fractions in soils of an 18-year-old Chinese fir (Cunninghamia lanceolata) plantation. For. Ecol. Manag. 2003, 178, 301–310. [Google Scholar] [CrossRef]
  30. Ma, X.; Heal, K.V.; Liu, A.; Jarvis, P.G. Nutrient cycling and distribution in different-aged plantations of Chinese fir in southern China. For. Ecol. Manag. 2007, 243, 61–74. [Google Scholar] [CrossRef]
  31. Wu, A.; Hu, X.; Wang, F.; Guo, C.; Wang, H.; Chen, F.-S. Nitrogen deposition and phosphorus addition alter mobility of trace elements in subtropical forests in China. Sci. Total Environ. 2021, 781, 146778. [Google Scholar] [CrossRef]
  32. Wang, S.; Kobayashi, K.; Takanashi, S.; Liu, C.-P.; Li, D.-R.; Chen, S.-W.; Cheng, Y.-T.; Moriguchi, K.; Dannoura, M. Estimating divergent forest carbon stocks and sinks via a knife set approach. J. Environ. Manag. 2022, 330, 117114. [Google Scholar] [CrossRef]
  33. Zhang, B.; Sajjad, S.; Chen, K.; Zhou, L.; Zhang, Y.; Yong, K.K.; Sun, Y. Predicting Tree Height-Diameter Relationship from Relative Competition Levels Using Quantile Regression Models for Chinese Fir (Cunninghamia lanceolata) in Fujian Province, China. Forests 2020, 11, 183. [Google Scholar] [CrossRef]
  34. Xu, D.Y.; Liu, J.F.; Tong, S.Z. Optimization model for density control in Chinese fir plantations—DENTROL. For. Sci. 1993, 29, 415–423. (In Chinese) [Google Scholar]
  35. Lu, R.K. Soil Agricultural Chemical Analysis Method; China Agricultural Science and Technology Press: Beijing, China, 2000. [Google Scholar]
  36. Ramalho, F.M.G.; Pimenta, E.M.; Goulart, C.P.; De Almeida, M.N.F.; Vidaurre, G.B.; Hein, P.R.G. Effect of stand density on longitudinal variation of wood and bark growth in fast-growing Eucalyptus plantations. iForest—Biogeosci. For. 2019, 12, 527–532. [Google Scholar] [CrossRef]
  37. Yi, X.; Wang, N.; Ren, H.; Yu, J.; Hu, T.; Su, Y.; Mi, X.; Guo, Q.; Ma, K. From canopy complementarity to asymmetric competition: The negative relationship between structural diversity and productivity during succession. J. Ecol. 2021, 110, 457–465. [Google Scholar] [CrossRef]
  38. Long, S.; Zeng, S.; Wang, G. Dynamics of stand density and self-thinning in Chinese fir plantations: Theoretical insights and empirical validation. Front. Plant Sci. 2024, 15, 1444807. [Google Scholar] [CrossRef]
  39. Canham, C.D.; LePage, P.T.; Coates, K.D. A neighborhood analysis of canopy tree competition: Effects of shading versus crowding. Can. J. For. Res. 2004, 34, 778–787. [Google Scholar] [CrossRef]
  40. Lei, J.; Du, H.; Duan, A.; Zhang, J. Effect of stand density and soil layer on soil nutrients of a 37-year-old Cunninghamia lanceolata plantation in Naxi, Sichuan Province, China. Sustainability 2019, 11, 5410. [Google Scholar] [CrossRef]
  41. Duan, A.; Lei, J.; Hu, X.; Zhang, J.; Du, H.; Zhang, X.; Guo, W.; Sun, J. Effects of Planting Density on Soil Bulk Density, pH and Nutrients of Unthinned Chinese Fir Mature Stands in South Subtropical Region of China. Forests 2019, 10, 351. [Google Scholar] [CrossRef]
  42. Kunhamu, T.K.; Kumar, B.M.; Viswanath, S. Does thinning affect litterfall, litter decomposition, and associated nutrient release in Acacia mangium stands of Kerala in peninsular India? Can. J. For. Res. 2009, 39, 792–801. [Google Scholar] [CrossRef]
  43. Carter, R.; Klinka, K. Relationships between growing-season soil water-deficit, mineralizable soil nitrogen and site index of coastal Douglas fir. For. Ecol. Manag. 1990, 30, 301–311. [Google Scholar] [CrossRef]
  44. Reddy, A.R.; Chaitanya, K.V.; Vivekanandan, M. Drought-induced responses of photosynthesis and antioxidant metabolism in higher plants. J. Plant Physiol. 2004, 161, 1189–1202. [Google Scholar] [CrossRef] [PubMed]
  45. Zhou, G.; Guan, L.; Wei, X.; Tang, X.; Liu, S.; Liu, J.; Zhang, D.; Yan, J. Factors influencing leaf litter decomposition: An intersite decomposition experiment across China. Plant Soil 2008, 311, 61–72. [Google Scholar] [CrossRef]
  46. Jones, D.L.; Darrah, P.R. Role of root derived organic acids in the mobilization of nutrients from the rhizosphere. Plant Soil 1994, 166, 247–257. [Google Scholar] [CrossRef]
  47. Tong, R.; Wu, T.; Jiang, B.; Wang, Z.; Xie, B.; Zhou, B. Soil carbon, nitrogen, and phosphorus stoichiometry and its influencing factors in Chinese fir plantations across subtropical China. Front. For. Glob. Chang. 2023, 5, 1086328. [Google Scholar] [CrossRef]
  48. Tong, R.; Zhou, B.; Jiang, L.; Ge, X.; Cao, Y.; Yang, Z. Leaf Nitrogen and Phosphorus Stoichiometry of Chinese fir Plantations across China: A Meta-Analysis. Forests 2019, 10, 945. [Google Scholar] [CrossRef]
  49. Van Sundert, K.; Horemans, J.A.; Stendahl, J.; Vicca, S. The influence of soil properties and nutrients on conifer forest growth in Sweden, and the first steps in developing a nutrient availability metric. Biogeosciences 2018, 15, 3475–3496. [Google Scholar] [CrossRef]
  50. Paoli, G.D.; Curran, L.M. Soil Nutrients Limit Fine Litter Production and Tree Growth in Mature Lowland Forest of Southwestern Borneo. Ecosystems 2007, 10, 503–518. [Google Scholar] [CrossRef]
  51. Martins, P.; Sampedro, L.; Moreira, X.; Zas, R. Nutritional status and genetic variation in the response to nutrient availability in Pinus pinaster. A multisite field study in Northwest Spain. For. Ecol. Manag. 2009, 258, 1429–1436. [Google Scholar] [CrossRef]
Figure 1. Distribution of study sites in subtropic China. Note: The first research site is located at Weimin State-owned Forest Farm, Shaowu City, Fujian Province, and the second site is at Minsheng Village Forest Farm, Luzhou City, Sichuan Province.
Sustainability 17 05867 g001
Figure 2. Changes in ATH (a), ADBH (b), DH (c), SV (d), ASD (e), NMP (f) in different planting densities in Chinese fir plantations for Fujian (a1f1) and Sichuan (a2f2) provinces. NOTE: ATH is the average tree height, ADBH is the average diameter at breast height, DH is the dominant height, SV is the standing volume, ASD is the actual stand density, NMP is the natural mortality plants. Each column represents the mean value across three replicated plots. Error bars indicate the standard deviation. Different letters indicate significant differences in different planting densities treatments (p < 0.05).
Sustainability 17 05867 g002
Figure 3. Changes in SOM (a), TN (b), AN (c), TP (d), AP (e), TK (f), AK (g) and pH (h) in different planting densities in Chinese fir plantations for Fujian (a1h1) and Sichuan (a2h2) provinces. NOTE: SOM is soil organic matter, TN is total nitrogen, AN is available nitrogen, TP is total phosphorus, AP is available phosphorus, TK is total potassium, AK is available potassium.
Sustainability 17 05867 g003
Figure 4. Path analysis of the effects of planting density and site index on the standing volume of Chinese fir plantations in Fujian (a) and Sichuan (b) provinces. Note: Solid arrows represent significant effects (red indicating positive and green indicating negative), while dashed arrows indicate non-significant pathways. Significance levels are denoted as: * for p < 0.05, ** for p < 0.01, and *** for p < 0.001. The numbers along the arrows correspond to standardized path coefficients. Marginal R2 values for standing volume with planting density and site index are presented.
Sustainability 17 05867 g004
Table 1. General situation of physical geography of Chinese fir plantation in different regions.
LocationEast LongitudeNorth LatitudeLandformParent RockSoil Type
Naxi105°23′28°47′Low mountainsShaleRed soil
Shaowu117°43′27°05′Low mountainsShaleRed soil
Table 2. Descriptive statistics of site index for Fujian and Sichuan provinces.
Plot NumberPlanting Density (hm−2)FujianSichuan
1166716.1013.07
2166720.8314.24
3166721.5814.44
4333313.9812.23
5333320.7712.67
6333319.0713.62
7500015.4811.87
8500021.2811.30
9500020.0212.97
10666714.4511.74
11666721.1012.24
12666714.3013.60
1310,00014.0711.71
1410,00020.7512.10
1510,00012.2512.87
Table 3. Correlation analysis between site index and stand characteristics.
ProvinceStand Factors
ATHADBHDHSVASDNMP
Fujian0.84 **0.57 **0.96 **0.55 **−0.49 **−0.25 *
Sichuan0.79 **0.76 **0.49 **0.18−0.53 **−0.50 **
Note: as defined in Figure 2. Statistical significance is denoted as: * p < 0.05; ** p < 0.01.
Table 4. Correlation analysis between site index and soil nutrients.
ProvinceSoil Nutrients
SOMTNANTPAPTKAKpH
Fujian−0.100.030.02−0.54 **0.160.37 **0.180.27 *
Sichuan0.040.17−0.050.000.18−0.140.37 **−0.18
Note: as defined in Section 2.2. Statistical significance is denoted as: * p < 0.05; ** p < 0.01.
Disclaimer/Publisher’s Note: The statements, opinions and data contained in all publications are solely those of the individual author(s) and contributor(s) and not of MDPI and/or the editor(s). MDPI and/or the editor(s) disclaim responsibility for any injury to people or property resulting from any ideas, methods, instructions or products referred to in the content.

