
Suitability and Potential Evaluation of Carbon Dioxide Geological Storage: Case Study of Dezhou Subdepression


Abstract
1. Introduction
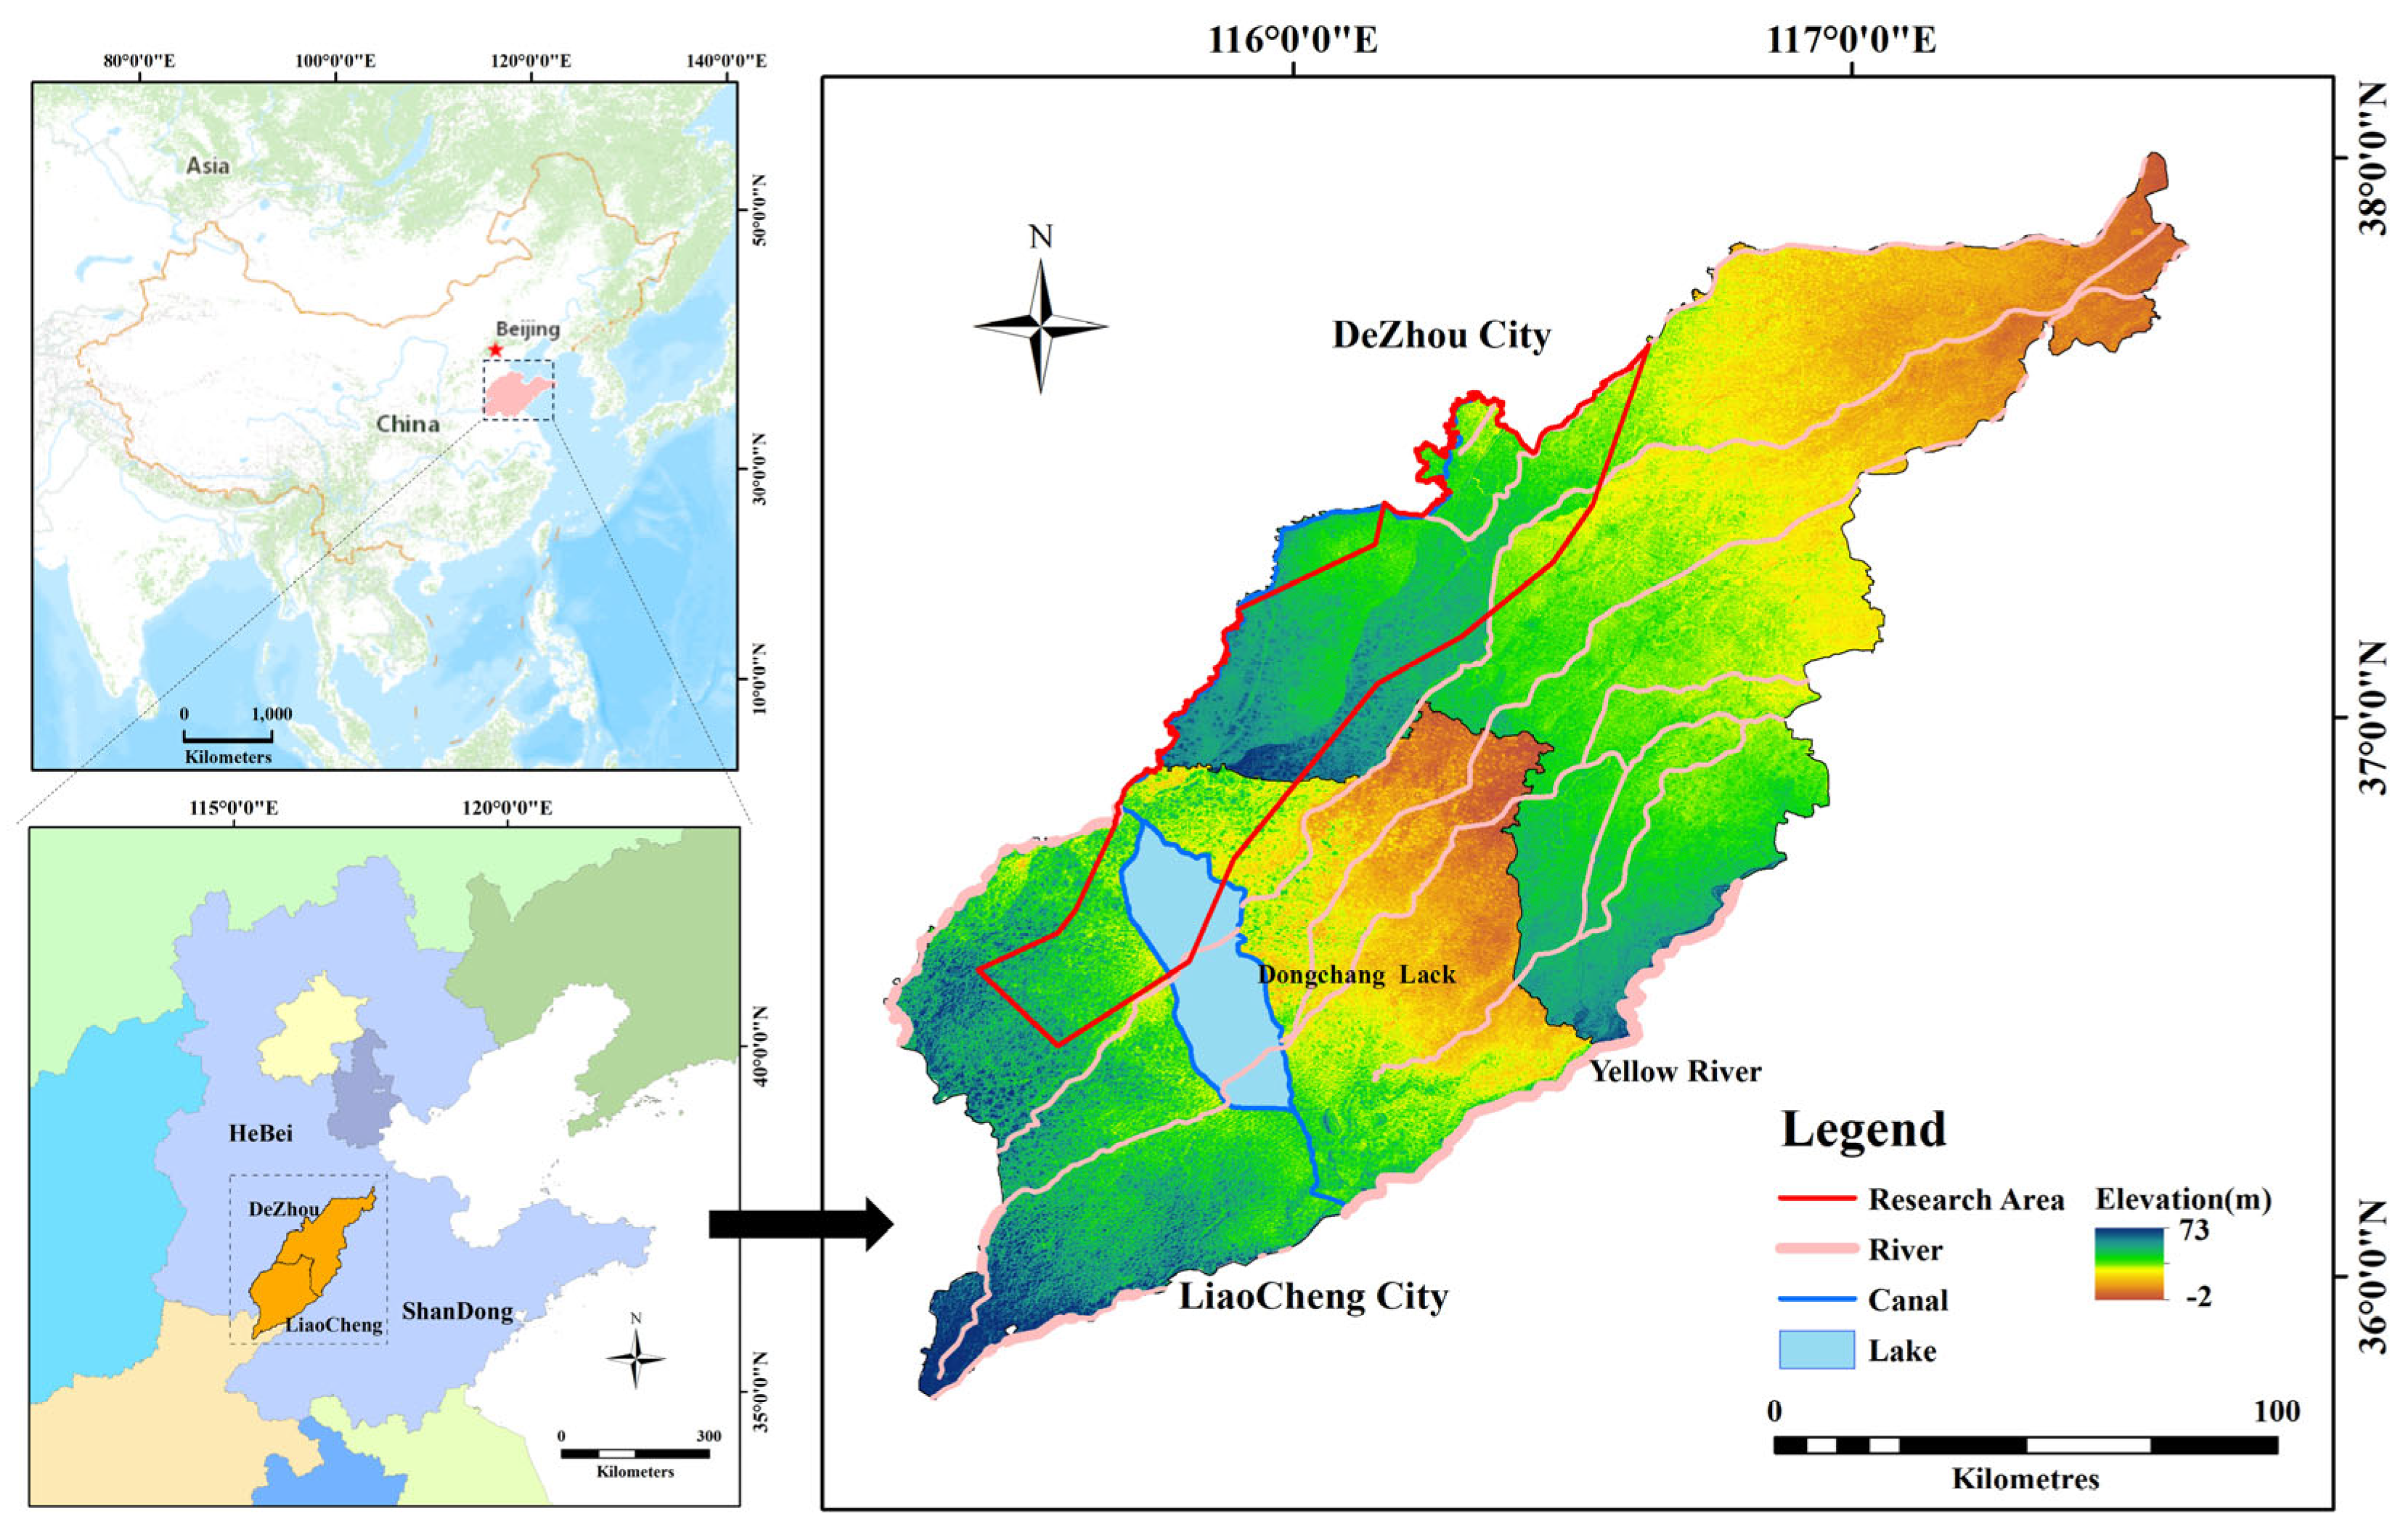
2. Study Area
2.1. General Situation of Physical Geography
2.2. Stratigraphic Characteristics
2.3. Reservoir Caprock Characteristics
2.4. Geological Structure
2.5. Characteristics of Geothermal Field
3. Methods
3.1. Data Source
3.2. Evaluation Method
- (1)
- Determine the evaluation index system
- (2)
- Constructing a Judgement Matrix
- (3)
- Calculate the weight of each index
- (4)
- Consistency checking
- (5)
- Fuzzy matrix is constructed by fuzzy comprehensive evaluation method
- (6)
- Analysis of comprehensive evaluation results
3.3. Calculation of CO2 Sequestration Capacity
4. Results and Discussion
4.1. Suitability Evaluation for Geological Storage of CO2
4.1.1. Index Weight (AHP)
- (1)
- Revealing the interrelationships among various factors within the system and establishing a hierarchical framework for the system. The system in this study is categorized into three hierarchical levels: the indicator layer, sub-indicator layer, and indicator.
- (2)
- The significance of each factor is equitably compared, and a judgment matrix is constructed to facilitate the comparison between two factors.
- (3)
- The weights of each index layer and sub-index layer were computed, and the corresponding results are presented in Table 1. Subsequently, the consistency of the obtained outcomes was assessed.
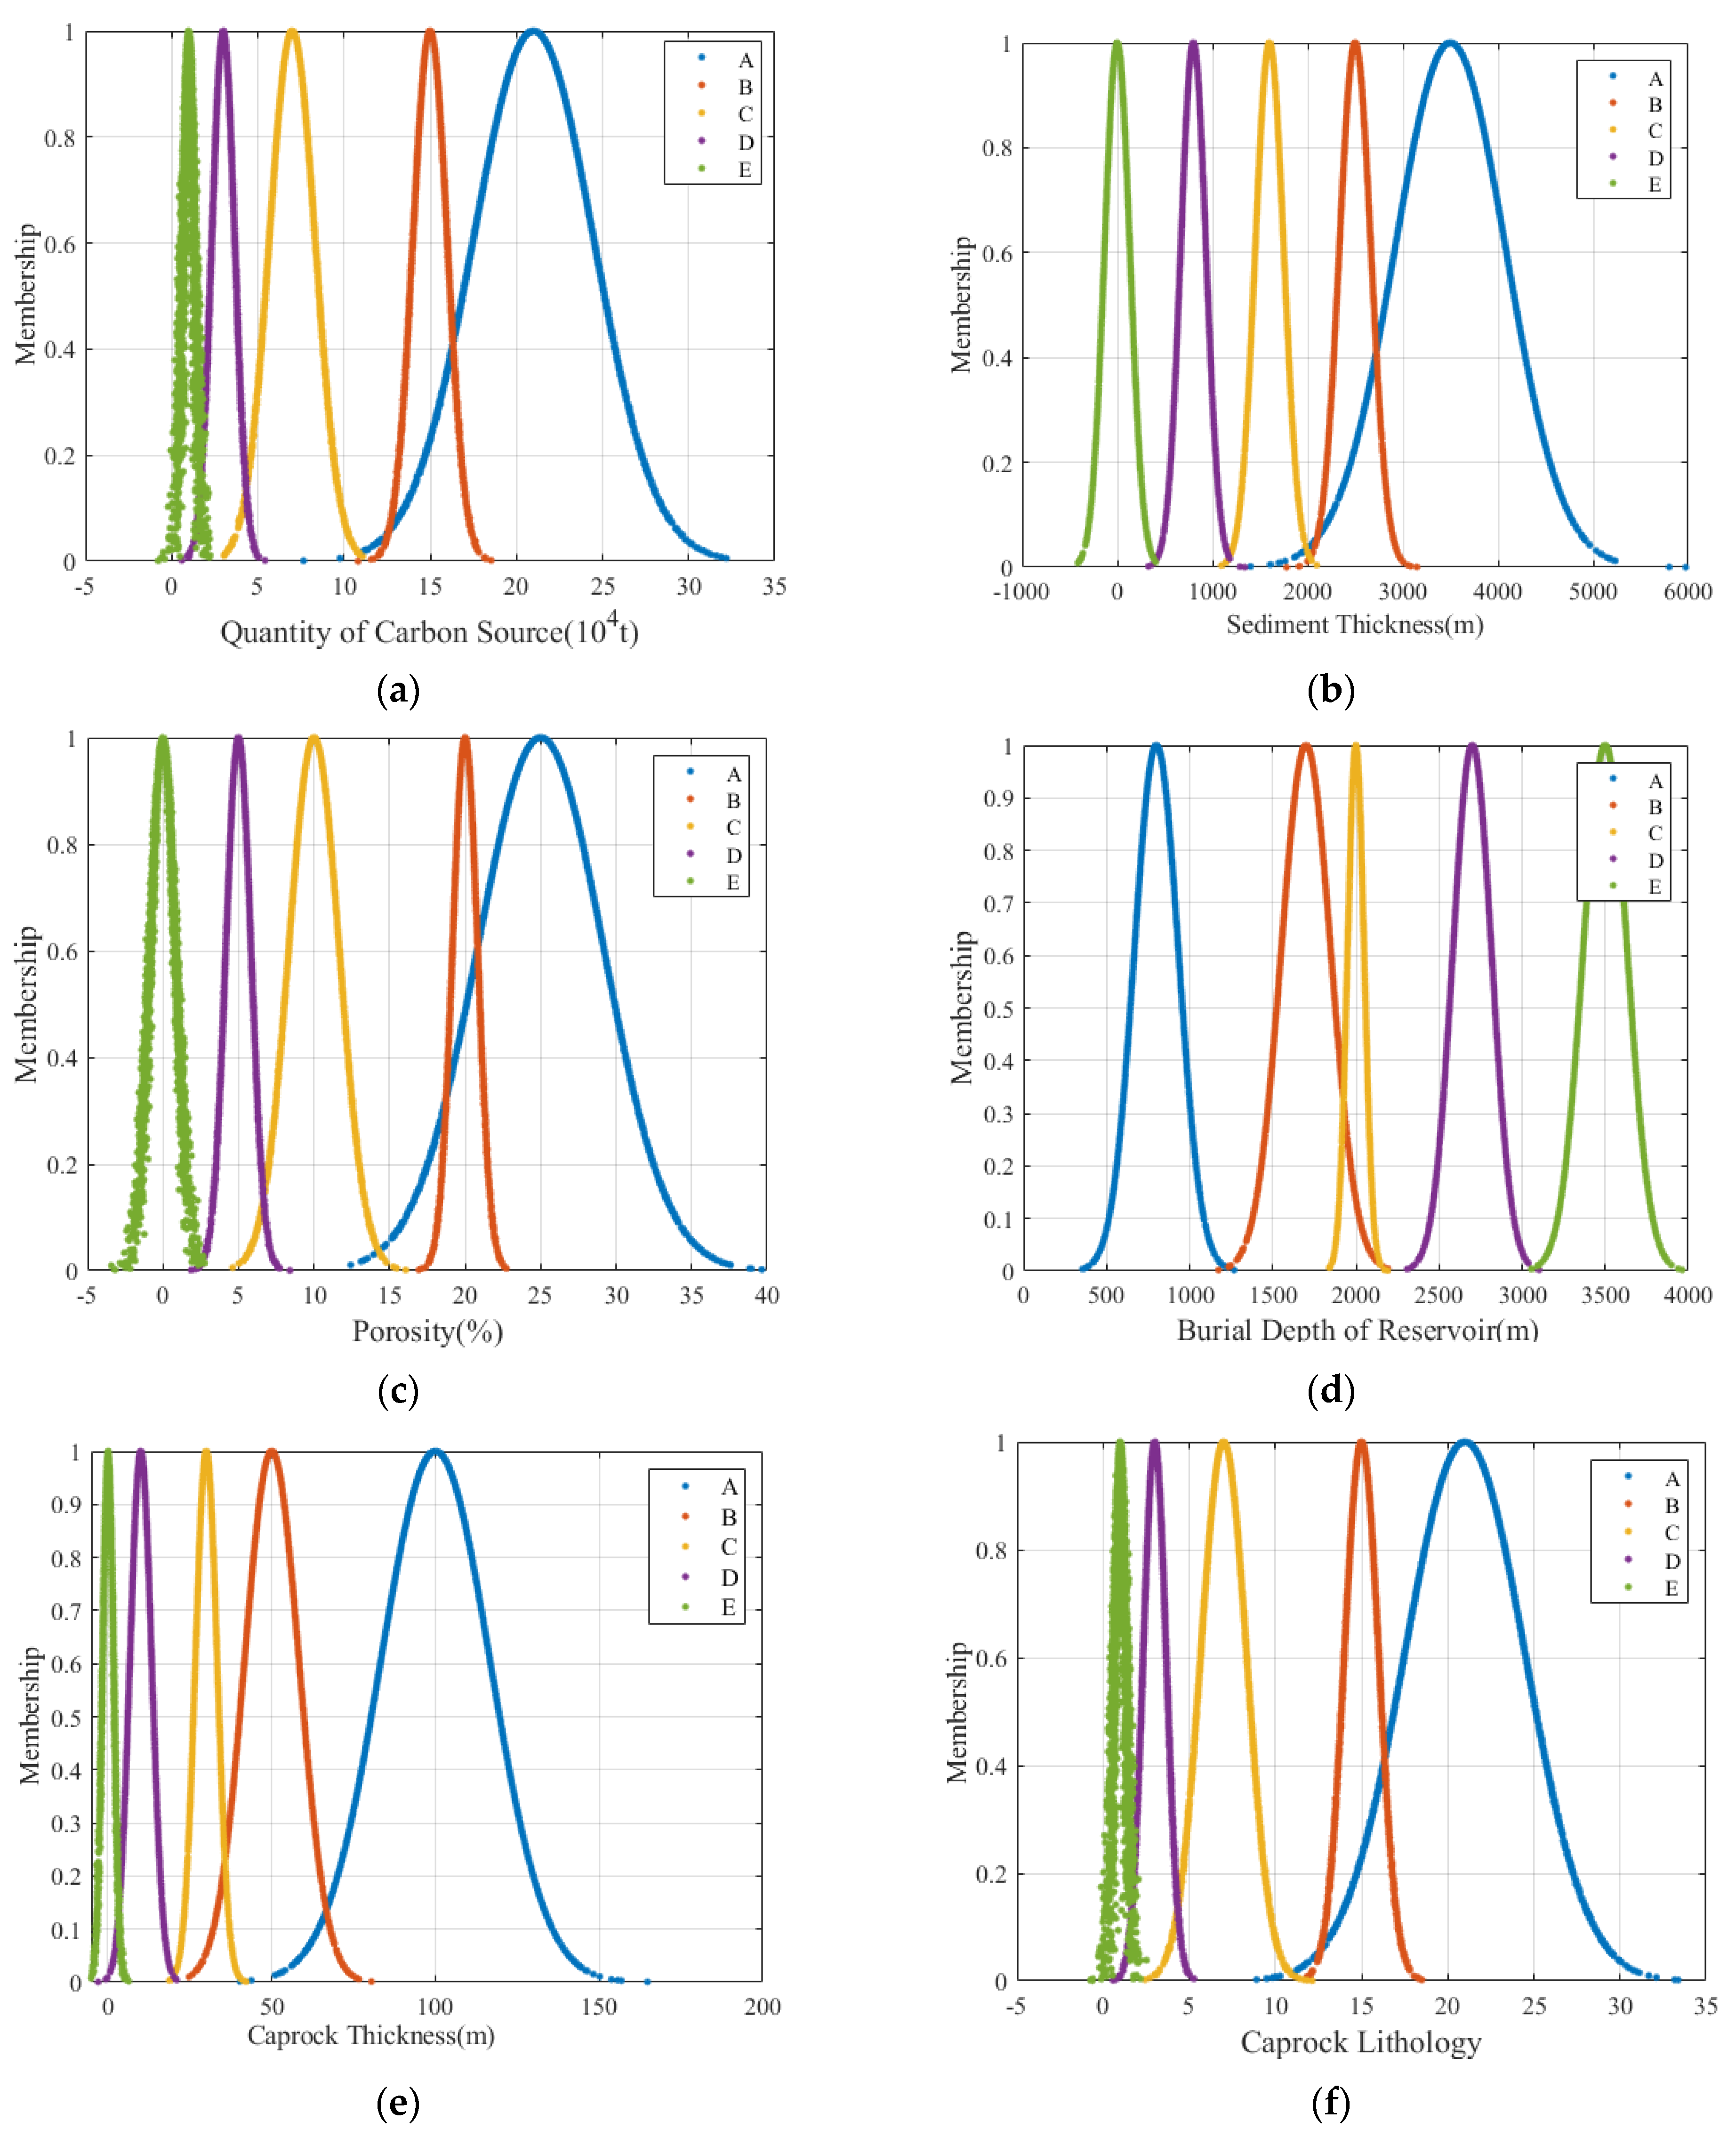
4.1.2. Fuzzy Comprehensive Evaluation of Suitability
4.2. CO2 Storage Calculation by Numerical Simulation
4.2.1. CO2 Geological Reservoir Conditions
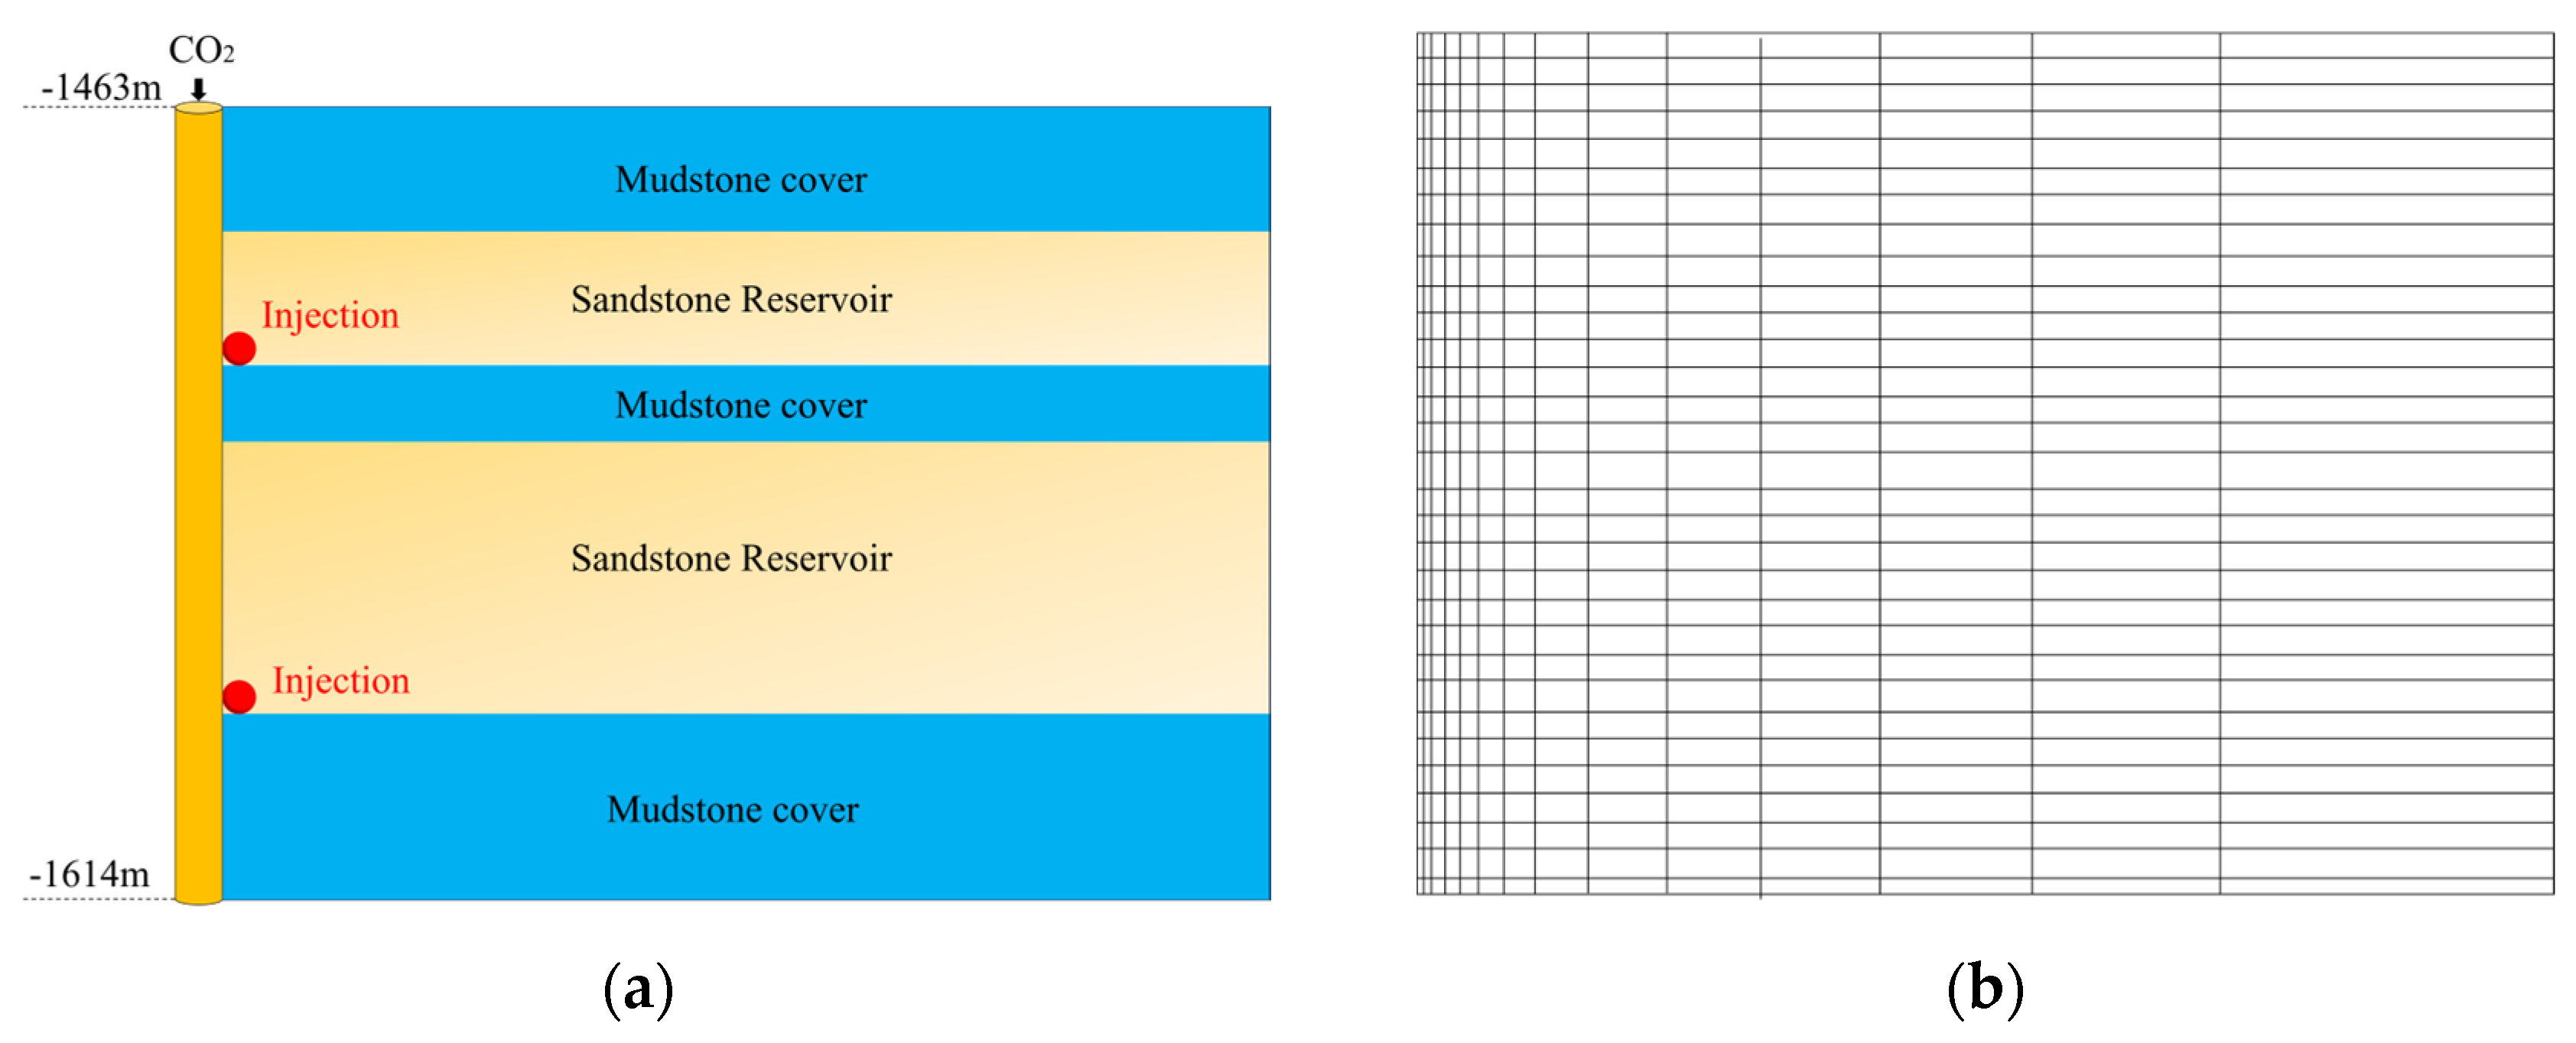
4.2.2. Model Building and Boundary Condition Setting
4.2.3. Model Parameter Setting
4.2.4. Configuration of Simulation Scheme
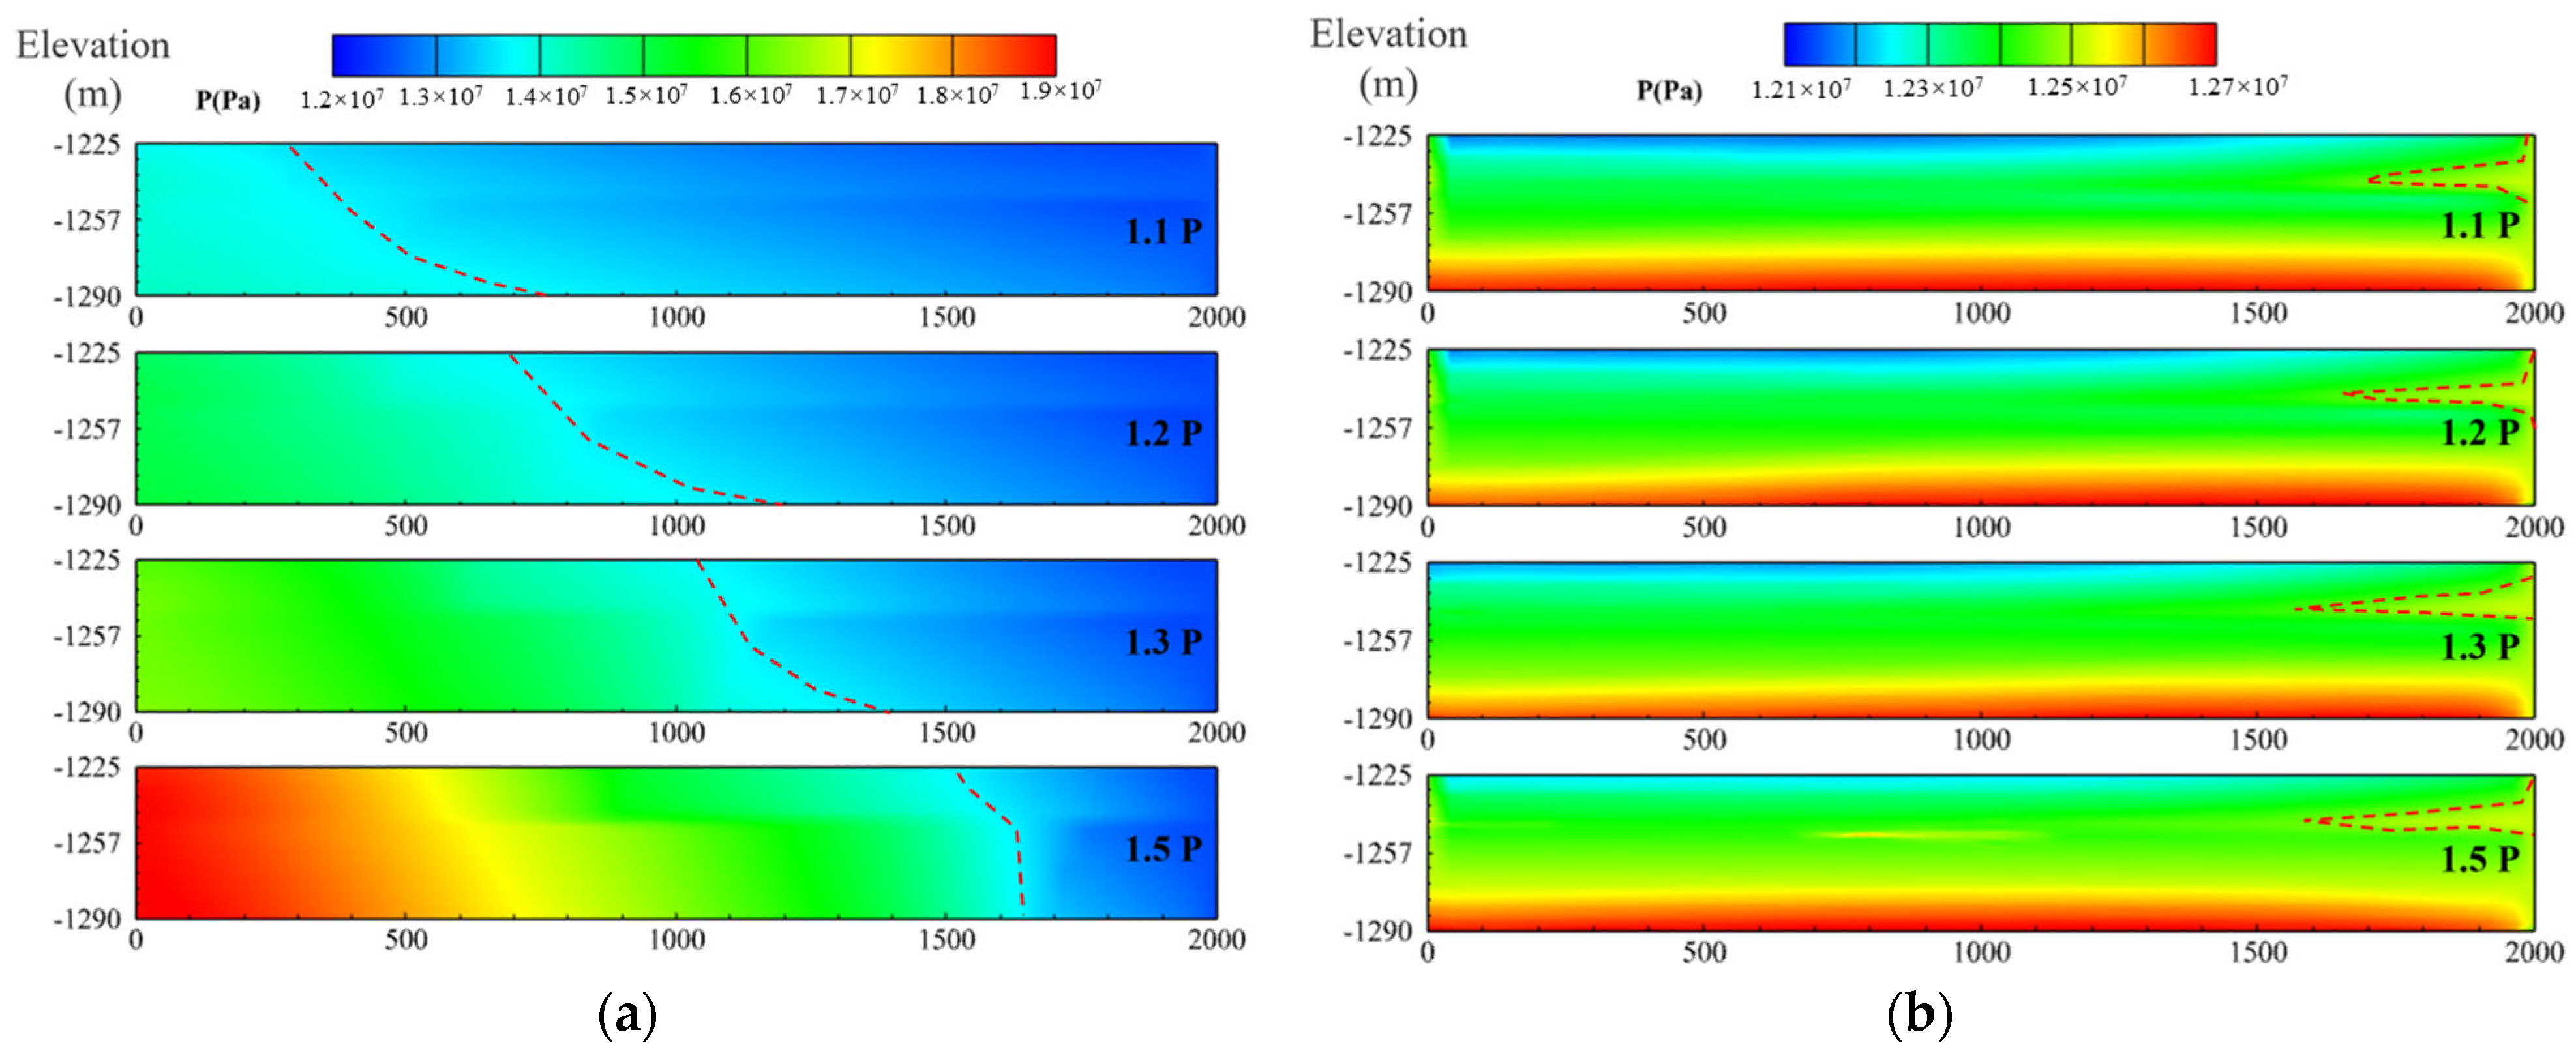
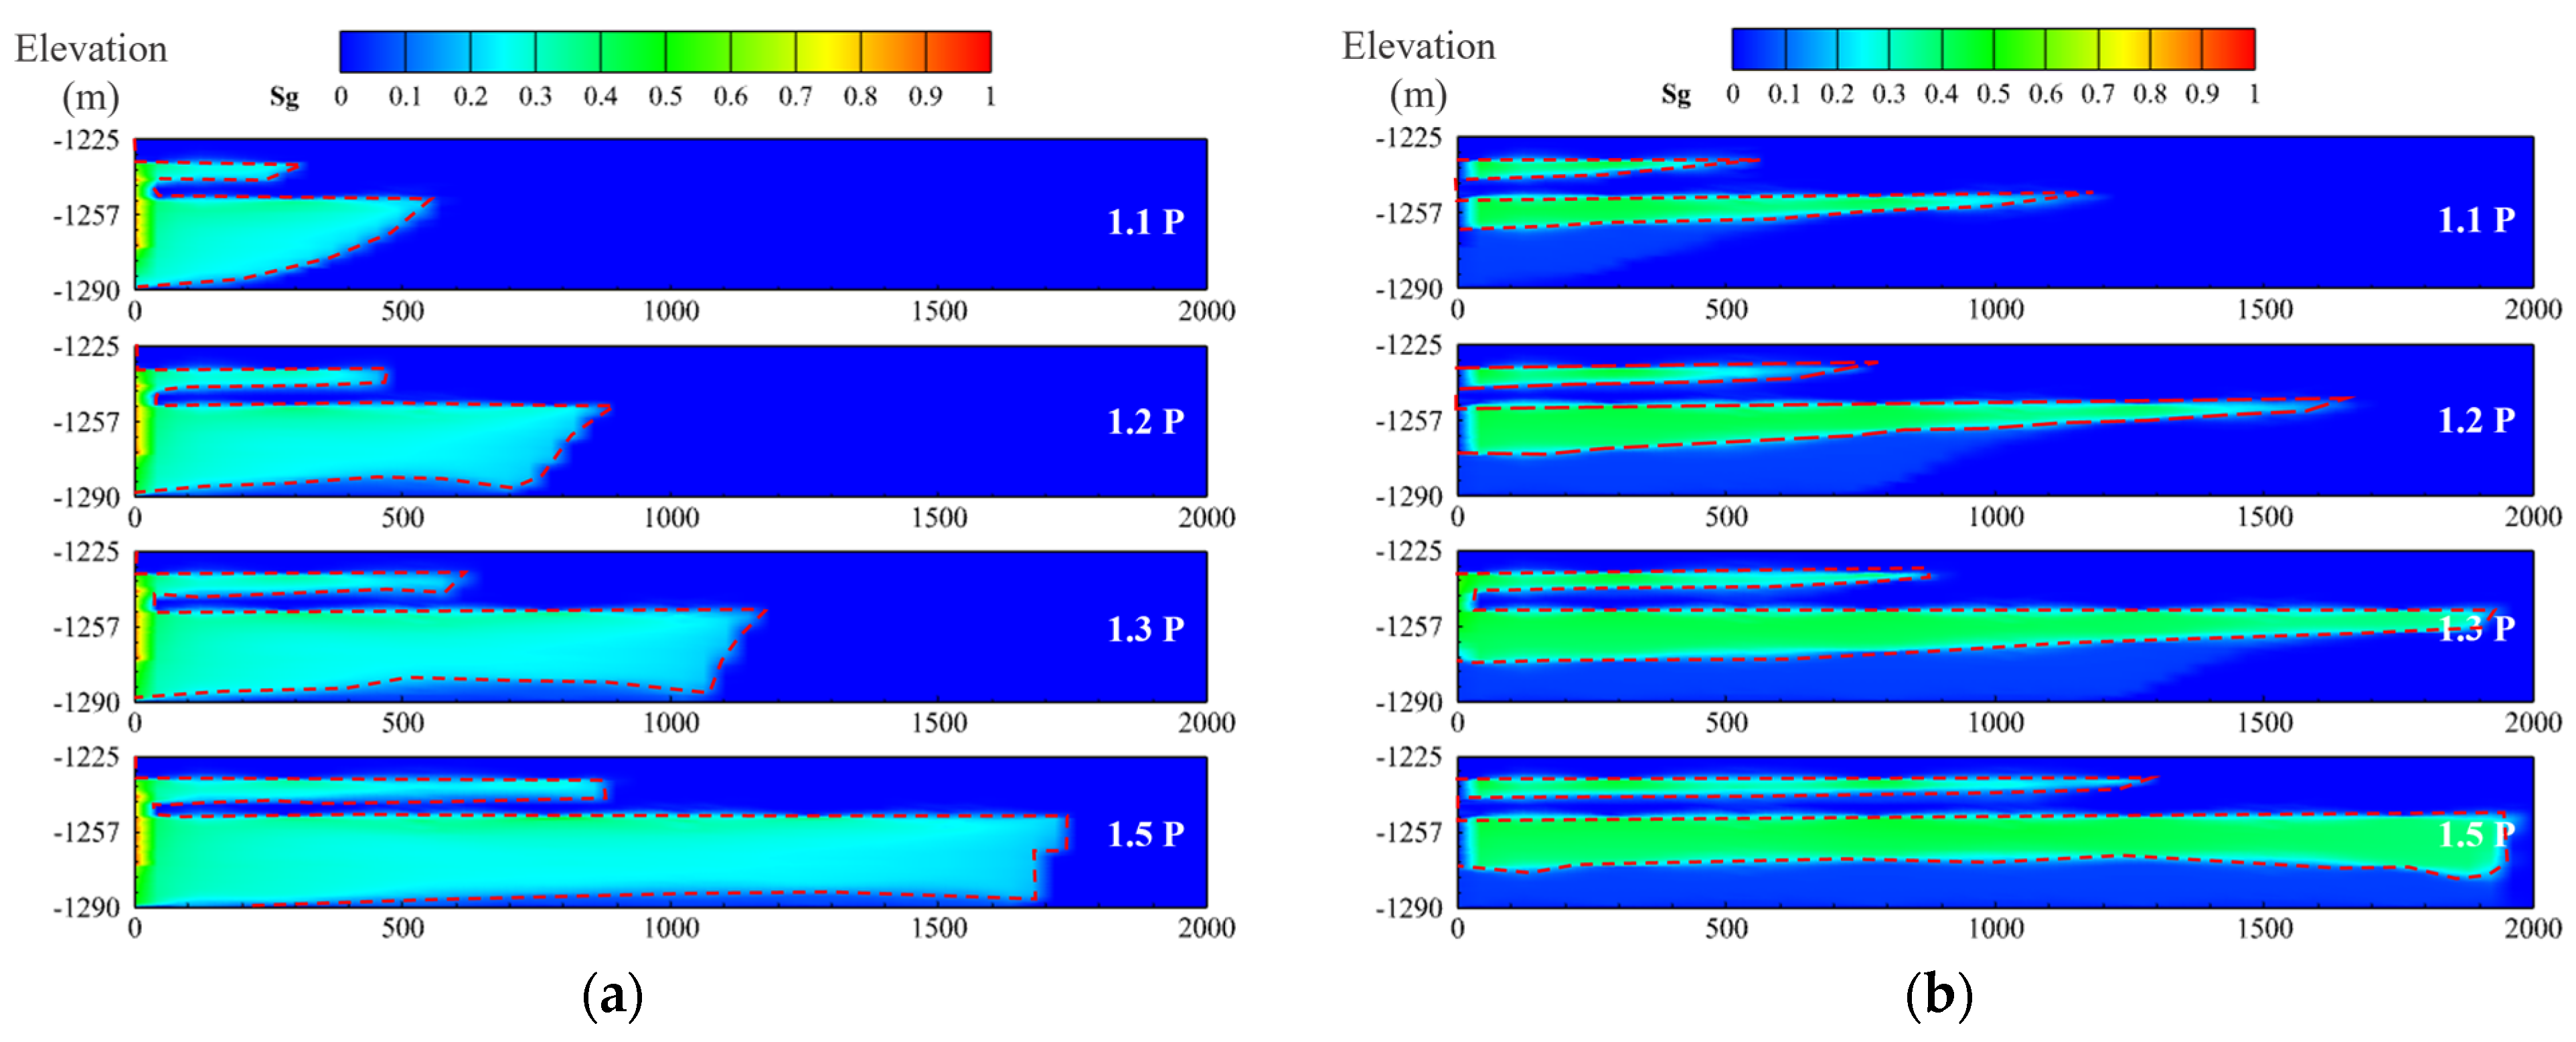
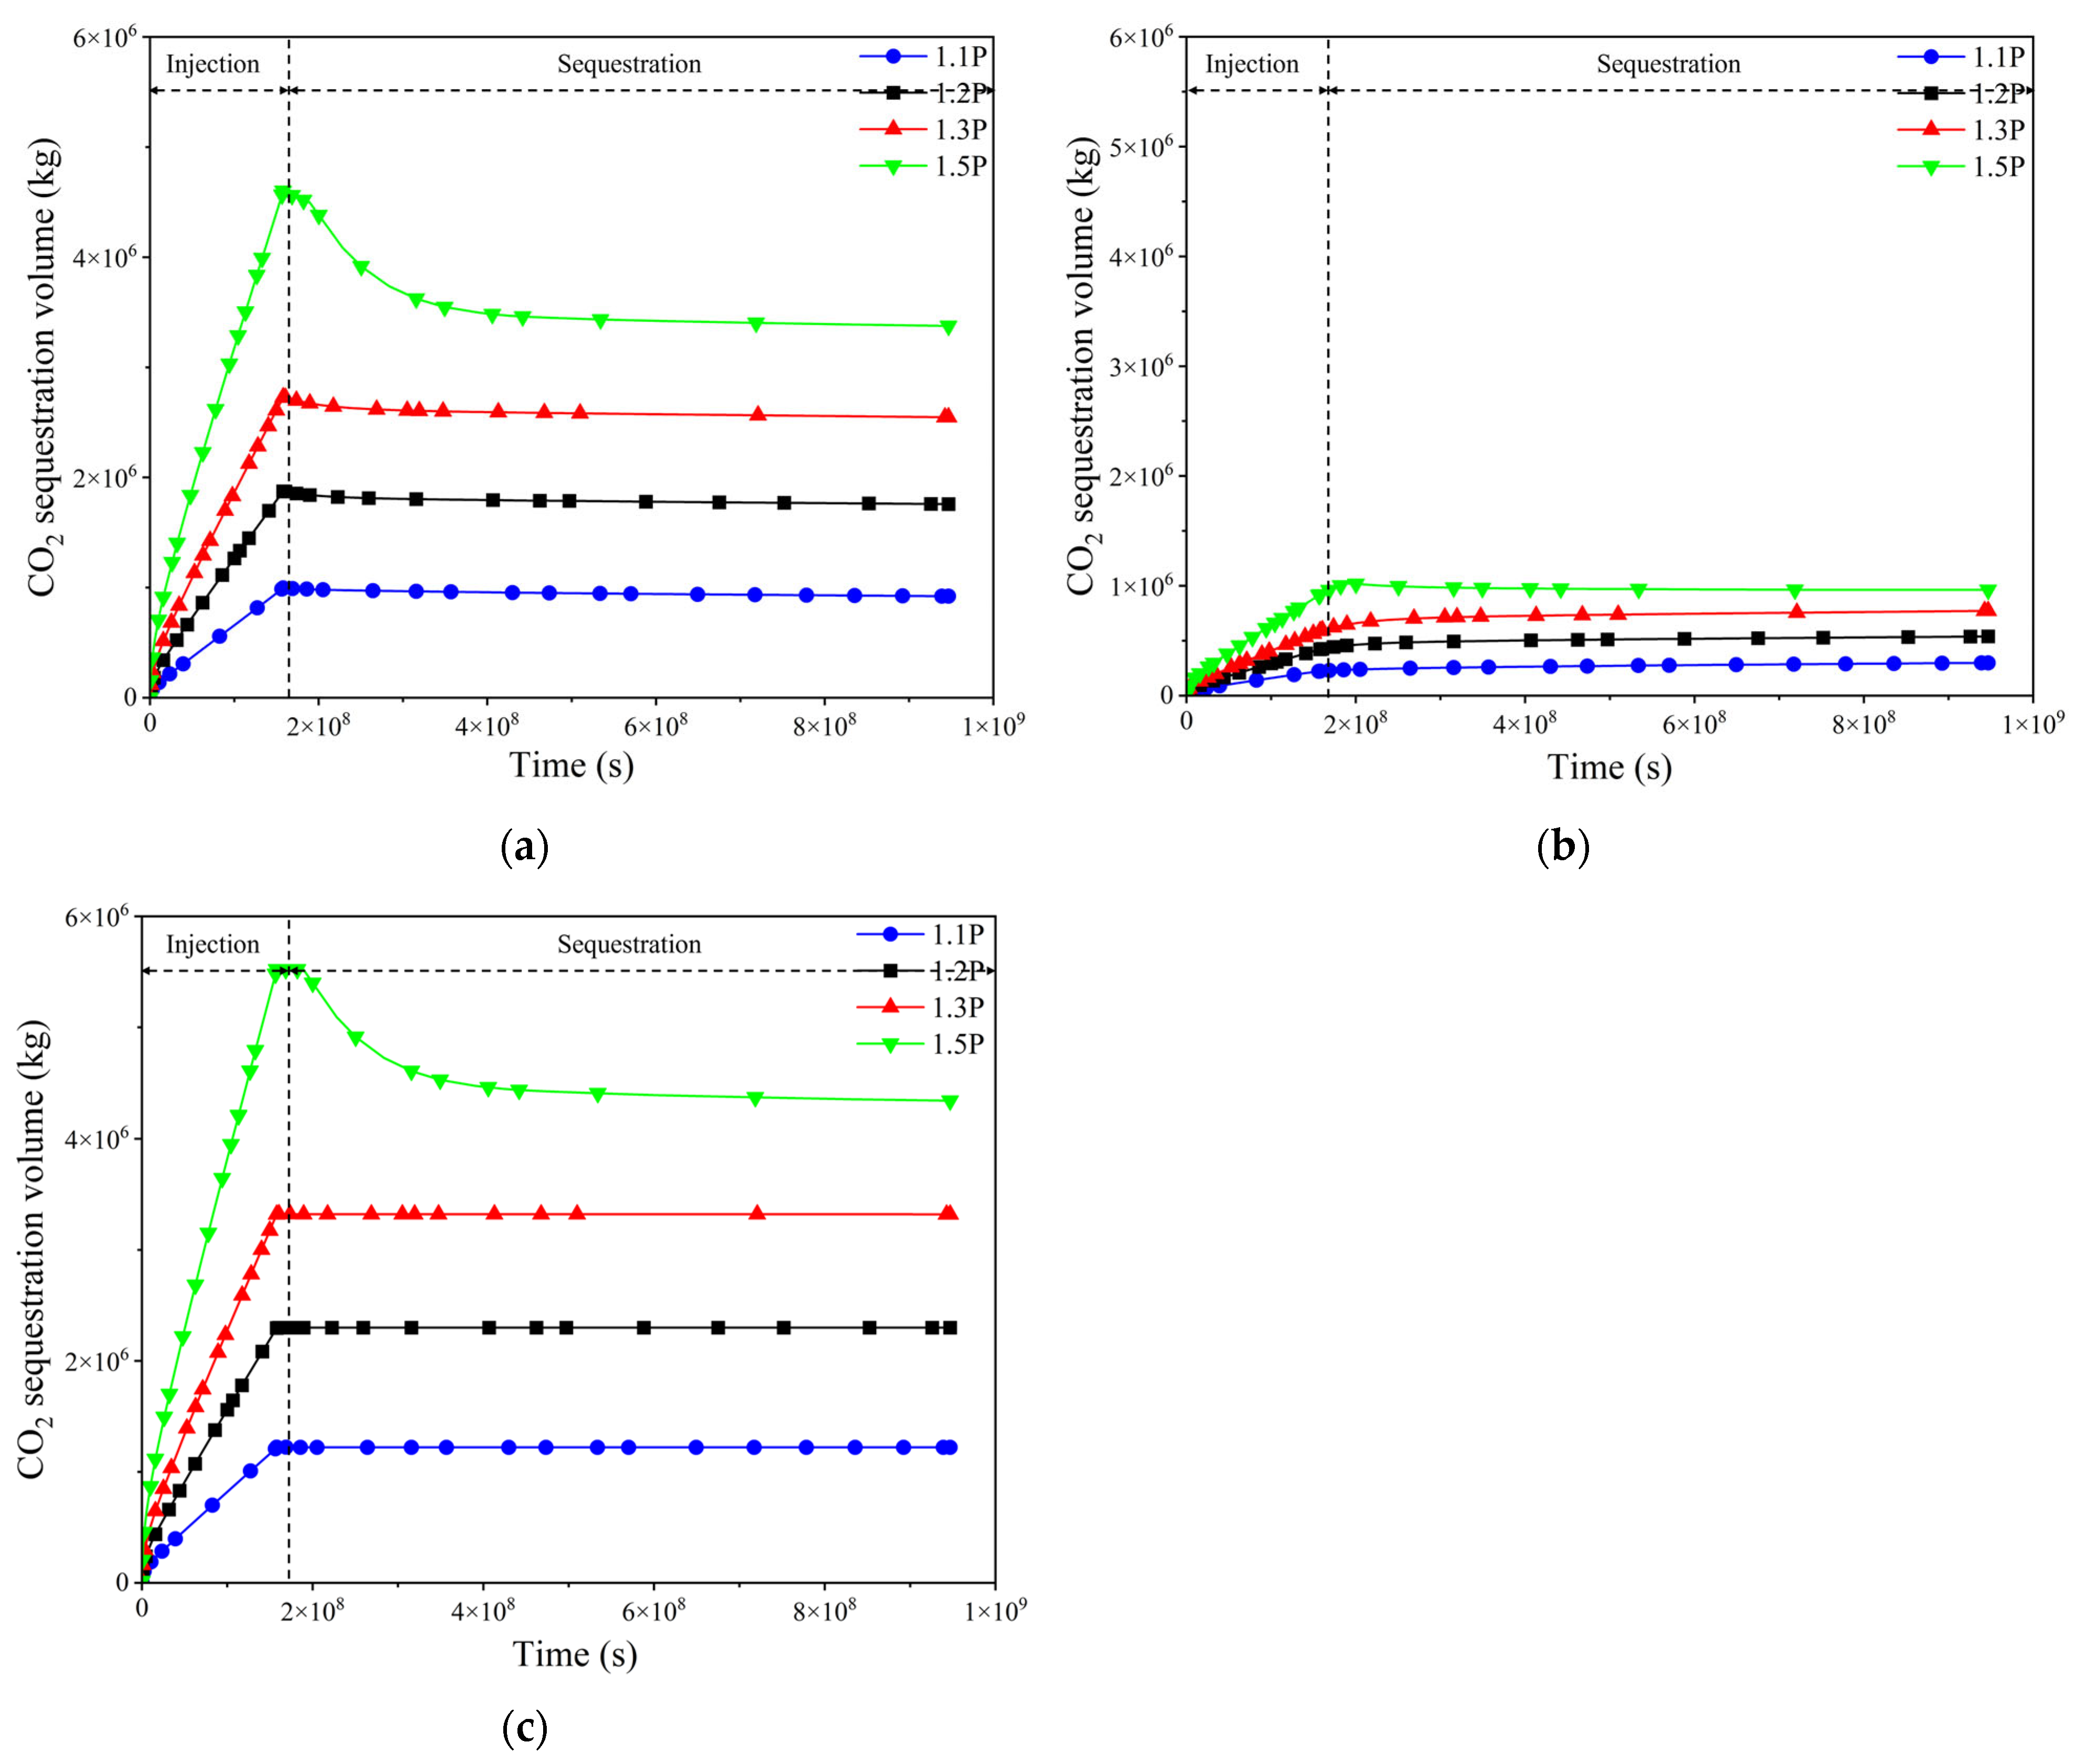
4.2.5. Analysis of Simulation Results
4.3. Discussion
5. Conclusions
- (1)
- The Dezhou Subdepression demonstrates favorable reservoir caprock characteristics, including optimal burial depth (>800 m), sufficient porosity/permeability in sandstone reservoirs, and thick, low-permeability mudstone caprocks.
- (2)
- Numerical simulations reveal a strong correlation between injection pressure (1.1P–1.5P, where P = reservoir pressure) and storage efficiency. Total sequestered CO2 increases by ~275% (from 1.22 × 10⁵ kg at 1.1P to 5.52 × 10⁶ kg at 1.5P), while lateral plume migration expands by 240%.
- (3)
- Optimal pressure thresholds should be maintained below 1.3P to maximize sequestration without exceeding caprock fracture gradients.
- (4)
- The integrated workflow (AHP-Fuzzy + Numerical simulation) provides a replicable framework for early-stage site screening in similar sedimentary basins.
Author Contributions
Funding
Institutional Review Board Statement
Informed Consent Statement
Data Availability Statement
Conflicts of Interest
Abbreviations
| CO2 | Carbon dioxide |
| AHP | Analytic Hierarchy Process |
| P | Original Group pressure |
| CCUS | Carbon capture, utilization, and storage |
| FUZZY | Fuzzy comprehensive evaluation method |
| Q4 | Holocene Series (Quaternary) |
| Q3 | Upper Pleistocene Series (Quaternary) |
| Q2 | Middle Pleistocene Series (Quaternary) |
| Q1 | Lower Pleistocene Series (Quaternary) |
| N2m | Minghuazhen Group (Neogene) |
| N1g | Guantao Group (Neogene) |
| E3d | Dongying Group (Paleogene) |
| E2-3s | 2nd–3rd Member, Shahejie Group (Paleogene) |
| E1-2k | Kongdian Group (Paleogene) |
| CI | Consistency index |
| CR | Consistency ratio |
References
- Slanina, Z. 125 years of Svante Arrhenius‘ concept of the greenhouse effect. Chem. Listy 2020, 114, 701–702. [Google Scholar]
- Rodhe, H.; Charlson, R.; Crawford, E. Svante Arrhenius and the greenhouse effect. Ambio 1997, 26, 2–5. [Google Scholar]
- Lin, Z.; Kuang, Y.; Li, W.; Zheng, Y. Research Status and Prospects of CO2 Geological Sequestration Technology from Onshore to Offshore: A Review. Earth-Sci. Rev. 2024, 258, 104928. [Google Scholar] [CrossRef]
- Zhong, Z.; Carr, T.R. Geostatistical 3D geological model construction to estimate the capacity of commercial scale injection and storage of CO2 in Jacksonburg-Stringtown oil field, West Virginia, USA. Int. J. Greenh. Gas Control 2019, 80, 61–75. [Google Scholar] [CrossRef]
- Feng, G.; Feng, X.; Chen, B.; Xiao, Y. Performance and feasibility analysis of two microseismic location methods used in tunnel engineering. Tunn. Undergr. Space Technol. 2017, 63, 183–193. [Google Scholar] [CrossRef]
- Zhang, L.; Yang, Q.; Zhang, S.; Shan, L.; Jiang, Q.; Sun, M. Enhanced CO2 Storage Efficiency Due to the Impact of Faults on CO2 Migration in an Interbedded Saline Aquifer. Int. J. Greenh. Gas Control 2024, 133, 104104. [Google Scholar] [CrossRef]
- Wang, F.; Jing, J.; Xu, T.; Yang, Y.; Jin, G. Impacts of stratum dip angle on CO2 geological storage amount and security. Greenh Gases 2016, 6, 682–694. [Google Scholar] [CrossRef]
- Chen, S.; Liu, J.; Zhang, Q.; Teng, F.; McLellan, B.C. A critical review on deployment planning and risk analysis of carbon capture, utilization, and storage (CCUS) toward carbon neutrality. Renew. Sustain. Energy Rev. 2022, 167, 112537. [Google Scholar] [CrossRef]
- Zhang, X.; Liu, W.; Chen, J.; Jiang, D.; Fan, J.; Daemen, J.J.K.; Qiao, W. Large-scale CO2 disposal/storage in bedded rock salt caverns of China: An evaluation of safety and suitability. Energy 2022, 249, 123727. [Google Scholar] [CrossRef]
- Jing, T.; Fu, J.; Zhou, J.; Ma, X.; Diao, Y.; Liu, T.; Fu, L.; Guo, J. An automatic modeling approach for the potential evaluation of CO2 geological storage in the deep saline aquifer. Front. Energy Res. 2022, 10, 957014. [Google Scholar] [CrossRef]
- Zhang, Z.; Huisingh, D. Carbon dioxide storage schemes: Technology, assessment and deployment. J. Clean. Prod. 2017, 142, 1055–1064. [Google Scholar] [CrossRef]
- Zhang, J.; Chiu, S.-T.; Braga-Neto, U.; Gildin, E. Physics-Informed Neural Networks for CO2 Migration Modeling in Stratified Saline Aquifers: Applications in Geological Carbon Sequestration. Geoenergy Sci. Eng. 2025, 247, 213689. [Google Scholar] [CrossRef]
- Kanin, E.; Garagash, I.; Boronin, S.; Zhigulskiy, S.; Penigin, A.; Afanasyev, A.; Garagash, D.; Osiptsov, A. Geomechanical Risk Assessment for CO2 Storage in Deep Saline Aquifers. J. Rock Mech. Geotech. Eng. 2025, 17, 1986–2008. [Google Scholar] [CrossRef]
- Ghosh, R.; Sen, M.K.; Vedanti, N. Quantitative interpretation of CO2 plume from Sleipner (North Sea), using post-stack inversion and rock physics modeling. Int. J. Greenh. Gas Control 2015, 32, 147–158. [Google Scholar] [CrossRef]
- Wang, J.; Yuan, Y.; Chen, J.; Zhang, W.; Zhang, J.; Liang, J.; Zhang, Y. Geological Conditions and Suitability Evaluation for CO2 Geological Storage in Deep Saline Aquifers of the Beibu Gulf Basin (South China). Energies 2023, 16, 2360. [Google Scholar] [CrossRef]
- Li, P.; Zhou, D.; Zhang, C.; Chen, G. Assessment of the effective CO2 storage capacity in the Beibuwan Basin, offshore of southwestern P. R. China. Int. J. Greenh. Gas Control 2015, 37, 325–339. [Google Scholar] [CrossRef]
- Luo, A.; Li, Y.; Chen, X.; Zhu, Z.; Peng, Y. Review of CO2 sequestration mechanism in saline aquifers. Nat. Gas Ind. B 2022, 9, 383–393. [Google Scholar] [CrossRef]
- Khandoozi, S.; Hazlett, R.; Fustic, M. A critical review of CO2 mineral trapping in sedimentary reservoirs—From theory to application: Pertinent parameters, acceleration methods and evaluation workflow. Earth-Sci. Rev. 2023, 244, 104515. [Google Scholar] [CrossRef]
- Ye, J.; Afifi, A.; Rowaihy, F.; Baby, G.; De Santiago, A.; Tasianas, A.; Hamieh, A.; Khodayeva, A.; Al-Juaied, M.; Meckel, T.A.; et al. Evaluation of geological CO2 storage potential in Saudi Arabian sedimentary basins. Earth-Sci. Rev. 2023, 244, 104539. [Google Scholar] [CrossRef]
- Yang, L.; Rui, W.; Zhao, Q.; Xue, Z.; Zhou, Y. A CO2 storage potential evaluation method for saline aquifers in a petroliferous basin. Pet. Explor. Dev. 2023, 50, 484–491. [Google Scholar]
- Mi, Z.; Wang, F.; Yang, Y.; Wang, F.; Hu, T.; Tian, H. Evaluation of the potentiality and suitability for CO2 geological storage in the Junggar Basin, northwestern China. Int. J. Greenh. Gas Control 2018, 78, 62–72. [Google Scholar] [CrossRef]
- He, H.; Tian, C.; Jin, G.; Han, K. Evaluating the CO2 geological storage suitability of coal-bearing sedimentary basins in China. Environ. Monit. Assess. 2020, 192, 462. [Google Scholar] [CrossRef]
- Chen, Q.; Hou, J.; Wei, B.; Gong, R.; Du, Q.; Liu, Y. Study on CO2 Storage Suitability Evaluation and Storage Potential Prediction Method in Site-Level Saline Aquifer: A Case Study of X Saline Aquifer Block in Enping 15-1 Oilfield. Geoenergy Sci. Eng. 2025, 246, 213598. [Google Scholar] [CrossRef]
- Lia, Y.; Li, P.; Qu, H.-J.; Wang, G.-W.; Sun, X.-H.; Ma, C.; Yao, T.-X. Potential Evaluation of Saline Aquifers for the Geological Storage of Carbon Dioxide: A Case Study of Saline Aquifers in the Qian-5 Member in Northeastern Ordos Basin. China Geol. 2023, 7, 12–25. [Google Scholar] [CrossRef]
- Davarazar, M.; Nemati, B.; Gorgich, M.; Maheronnaghsh, S.; Bayat Ghiasi, S.A.; Zandi, S.; Mohammadi, M. A Sustainable Approach for the Site Selection of CO2 Underground Storage. Application of Fuzzy-Delphi Methodology. J. Settl. Spat. Plan. 2020, SI, 113–123. [Google Scholar] [CrossRef]
- Bachu, S. Screening and ranking of sedimentary basins for sequestration of CO2 in geological media in response to climate change. Environ. Earth Sci. 2003, 44, 277–289. [Google Scholar] [CrossRef]
- Oldenburg, C.M. Screening and ranking framework for geologic CO2 storage site selection on the basis of health, safety, and environmental risk. Environ. Geol. 2008, 54, 1687–1694. [Google Scholar] [CrossRef]
- Tomić, L.; Karović Maričić, V.; Danilović, D. The preliminary selection of oil reservoir in Serbia for carbon dioxide injection and storage by a multicriteria decision-making approach: A case study. Energy Sources Part A Recovery Util. Environ. Eff. 2021, 47, 8596–8610. [Google Scholar] [CrossRef]
- Derse, O. CO2 capture, utilization, and storage (CCUS) storage site selection using DEMATEL-based Grey Relational Analysis and evaluation of carbon emissions with the ARIMA method. Environ. Sci. Pollut. Res. 2023, 30, 14353–14364. [Google Scholar] [CrossRef]
- Zhao, Q.; Deng, Z.; Zhao, M.; Liu, D. CO2 geological sequestration potential of the low-rank coals in the southern margin of the Junggar Basin. Front. Earth Sci. 2023, 17, 727–738. [Google Scholar] [CrossRef]
- Safaei-Farouji, M.; Misch, D.; Sachsenhofer, R.F. A review of influencing factors and study methods of carbon capture and storage (CCS) potential in coals. Int. J. Coal. Geol. 2023, 277, 104351. [Google Scholar] [CrossRef]
- Topor, T.; Slota-Valim, M.; Kudrewicz, R. Assessing the Geothermal Potential of Selected Depleted Oil and Gas Reservoirs Based on Geological Modeling and Machine Learning Tools. Energies 2023, 16, 5211. [Google Scholar] [CrossRef]
- Mwakipunda, G.C.; Ngata, M.R.; Mgimba, M.M.; Yu, L. Carbon Dioxide Sequestration in Low Porosity and Permeability Deep Saline Aquifer: Numerical Simulation Method. J. Energy Resour. Technol. 2023, 145, 073401. [Google Scholar] [CrossRef]
- Sun, H.; Xiong, F.; Wu, Z.; Ji, J.; Fan, L. An extended numerical manifold method for two-phase seepage-stress coupling process modelling in fractured porous medium. Comput. Methods Appl. Mech. Eng. 2022, 391, 114514. [Google Scholar] [CrossRef]
- Sun, H.; Xiong, F.; Wei, W. A 2D hybrid NMM-UPM method for waterflooding processes modelling considering reservoir fracturing. Eng. Geol. 2022, 308, 106810. [Google Scholar] [CrossRef]
- Sun, H.; Wu, Z.; Zheng, L.; Yang, Y.; Huang, D. An extended numerical manifold method for unsaturated soil-water interaction analysis at micro-scale. Int. J. Numer. Anal. Methods Geomech. 2021, 45, 1500–1525. [Google Scholar] [CrossRef]
- Xiong, F.; Sun, H.; Zhang, Q.; Wang, Y.; Jiang, Q. Preferential flow in three-dimensional stochastic fracture networks: The effect of topological structure. Eng. Geol. 2022, 309, 106856. [Google Scholar] [CrossRef]
- Chen, R.; Xu, W.; Chen, Y. A Numerical Model for Evaluating the Long-Term Migration and Phase Transition Behavior of Foam-Assisted Injection of CO2 in Saline Aquifers. Geoenergy Sci. Eng. 2024, 243, 213328. [Google Scholar] [CrossRef]
- Xie, M.; Wang, S.; Feng, S.; Xu, C.; Li, X.; Sun, X.; Ma, Y.; Gan, Q.; Wang, T. A Stability Assessment of Fault-Caprock Trapping Systems for CO2 Storage in Saline Aquifer Layers Using a Coupled THMC Model. Energies 2025, 18, 900. [Google Scholar] [CrossRef]
- Zhang, Q.; Xu, Q.; Yang, Y.; Iglauer, S.; Liu, J.; Liu, F.; Zhang, L.; Sun, H.; Zhang, K.; Yao, J. Permeability Heterogeneity Effects on Density-Driven CO2 Natural Convection and Carbon Sequestration Efficiency. Fuel 2024, 363, 130871. [Google Scholar] [CrossRef]
- Ali, M.; Jha, N.K.; Pal, N.; Keshavarz, A.; Hoteit, H.; Sarmadivaleh, M. Recent advances in carbon dioxide geological storage, experimental procedures, influencing parameters, and future outlook. Earth-Sci. Rev. 2022, 225, 103895. [Google Scholar] [CrossRef]
- Deveci, M.; Demirel, N.C.; John, R.; Oezcan, E. Fuzzy multi-criteria decision making for carbon dioxide geological storage in Turkey. J. Nat. Gas Sci. Eng. 2015, 27, 692–705. [Google Scholar] [CrossRef]
- Dahiya, S.; Singh, B.; Gaur, S.; Garg, V.K.; Kushwaha, H.S. Analysis of groundwater quality using fuzzy synthetic evaluation. J. Hazard. Mater. 2007, 147, 938–946. [Google Scholar] [CrossRef] [PubMed]
- Liou, S.M.; Lo, S.L.; Hu, C.Y. Application of two-stage fuzzy set theory to river quality evaluation in Taiwan. Water Res. 2003, 37, 1406–1416. [Google Scholar] [CrossRef] [PubMed]
- Taheriyoun, M.; Karamouz, M.; Baghvand, A. Development of an Entropy-Based Fuzzy Eutrophication Index for Reservoir Water Quality Evaluation. Iran. J. Environ. Health Sci. Eng. 2010, 7, 1–14. [Google Scholar]
- Li, Q.; Cai, W.H.; Chen, C.; Meiburg, E. A diffuse interface model for low solubility binary flows in porous media. J. Comput. Phys. 2022, 470, 111582. [Google Scholar] [CrossRef]
- Mori, K.; Tawara, Y.; Hazart, A.; Tada, K.; Tosaka, H. Simulating nitrogen long-term fate and transport processes at a regional scale with a surface and subsurface fully-coupled watershed model. In Proceedings of the 21St International Congress On Modelling and Simulation (Modsim2015), Gold Coast, Australia, 29 November–4 December 2015; pp. 2514–2520. [Google Scholar]
- Xu, T.; Sonnenthal, E.; Spycher, N.; Pruess, K. TOUGHREACT—A simulation program for non-isothermal multiphase reactive geochemical transport in variably saturated geologic media: Applications to geothermal injectivity and CO2 geological sequestration. Comput. Geosci. 2006, 32, 145–165. [Google Scholar] [CrossRef]
- Xu, T.; Apps, J.A.; Pruess, K.; Yamamoto, H. Numerical modeling of injection and mineral trapping of CO2 with H2S and SO2 in a sandstone Group. Chem. Geol. 2007, 242, 319–346. [Google Scholar] [CrossRef]
- Oldenburg, C.M.; Lewicki, J.L.; Dobeck, L.; Spangler, L. Modeling Gas Transport in the Shallow Subsurface During the ZERT CO2 Release Test. Transp. Porous Media 2010, 82, 77–92. [Google Scholar] [CrossRef]
- Solomon, S.; Bureau-Cauchois, G.; Ahmed, N.; Aarnes, J.; Holtedahl, P. CO2 Storage Capacity Assessment of Deep Saline Aquifers in the Mozambique Basin. Energy Procedia 2014, 63, 5266–5283. [Google Scholar] [CrossRef]


| Indicator Layer | Weight | Sub-Indicator Layer | Weight | Indicator | Weight |
|---|---|---|---|---|---|
| Geological safety | 0.4761 | Regional crustal stability | 0.3091 | Peak seismic acceleration | 0.0311 |
| Historical seismicity | 0.0697 | ||||
| Active fault | 0.2083 | ||||
| Capping capacity | 0.1328 | Depth of cover layer | 0.0441 | ||
| Cap lithology | 0.0249 | ||||
| Cap thickness | 0.0257 | ||||
| Cap continuity | 0.0381 | ||||
| Hydrogeological condition | 0.0342 | Hydrodynamic action | 0.0214 | ||
| Degree of mineralization | 0.0128 | ||||
| Storage capability | 0.4523 | Building element size | 0.0739 | Area of tectonic unit | 0.0469 |
| Deposition thickness | 0.0270 | ||||
| Reservoir | 0.1343 | Reservoir depth | 0.0678 | ||
| Reservoir thickness | 0.0359 | ||||
| Reservoir lithology | 0.0160 | ||||
| Porosity | 0.0103 | ||||
| Permeability | 0.0043 | ||||
| Geothermal condition | 0.2441 | Ground temperature | 0.1607 | ||
| Geothermal gradient | 0.0834 | ||||
| Environmental and economic conditions | 0.0716 | Social environment | 0.0339 | Population density | 0.0191 |
| Land use type | 0.0148 | ||||
| Economic condition | 0.0377 | Carbon source quantity | 0.0214 | ||
| Carbon source distance | 0.0163 |
| Suitability Class | A | B | C | D | E |
|---|---|---|---|---|---|
| Membership | 0.0794 | 0.6140 | 0 | 0 | 0.3066 |
| Argument | Value | Argument | Value |
|---|---|---|---|
| Porosity (%) | 10.30~34.30 | Salinity | 0.03 |
| Permeability (mD) | 10.13~1833.98 | Thermal conductivity coefficient (W/m °C) | 2.51 |
| Burial depth (m) | −1463.00~−1614.00 | Specific Heat Capacity (J/Kg °C) | 920.00 |
| Temperature (°C) | 59.51~66.89 | Rock particle density (Kg/m3) | 2600.00 |
| Pressure (MPa) | 12.50 | Pore compression coefficient (Pa−1) | 4.50 × 10⁻¹⁰ |
Disclaimer/Publisher’s Note: The statements, opinions and data contained in all publications are solely those of the individual author(s) and contributor(s) and not of MDPI and/or the editor(s). MDPI and/or the editor(s) disclaim responsibility for any injury to people or property resulting from any ideas, methods, instructions or products referred to in the content. |
© 2025 by the authors. Licensee MDPI, Basel, Switzerland. This article is an open access article distributed under the terms and conditions of the Creative Commons Attribution (CC BY) license (https://creativecommons.org/licenses/by/4.0/).
Share and Cite
Liu, Z.; Ye, L.; Liu, H.; Jia, C.; Zhu, H.; Li, Z.; Liu, H. Suitability and Potential Evaluation of Carbon Dioxide Geological Storage: Case Study of Dezhou Subdepression. Sustainability 2025, 17, 5860. https://doi.org/10.3390/su17135860
Liu Z, Ye L, Liu H, Jia C, Zhu H, Li Z, Liu H. Suitability and Potential Evaluation of Carbon Dioxide Geological Storage: Case Study of Dezhou Subdepression. Sustainability. 2025; 17(13):5860. https://doi.org/10.3390/su17135860
Chicago/Turabian StyleLiu, Zhizheng, Lin Ye, Hao Liu, Chao Jia, Henghua Zhu, Zeyu Li, and Huafeng Liu. 2025. "Suitability and Potential Evaluation of Carbon Dioxide Geological Storage: Case Study of Dezhou Subdepression" Sustainability 17, no. 13: 5860. https://doi.org/10.3390/su17135860
APA StyleLiu, Z., Ye, L., Liu, H., Jia, C., Zhu, H., Li, Z., & Liu, H. (2025). Suitability and Potential Evaluation of Carbon Dioxide Geological Storage: Case Study of Dezhou Subdepression. Sustainability, 17(13), 5860. https://doi.org/10.3390/su17135860