Abstract
The growing global demand for sustainable energy solutions has spurred interest in hybrid renewable energy systems, particularly those combining photovoltaic (PV) solar and wind power. This study records the technical and financial feasibility of establishing hybrid solar photovoltaic and wind power stations in Iraq, Al-Rutbah and Al-Nasiriya, with a total power of 60 MW for each, focusing on optimizing energy output and cost-efficiency. The analysis evaluates key technical factors, such as resource availability, system design, and integration challenges, alongside financial considerations, including capital costs, operational expenses, and return on investment (ROI). Using the RETScreen program, the research explores potential locations and configurations for maximizing energy production and minimizing costs, and the evaluation is performed through the calculation Internal Rate of Return (IRR) on equity (%), the Simple Payback (year), the Net Present Value (NPV), and the Annual Life Cycle Savings (ALCSs). The results show that both PV and wind technologies demonstrate significant energy export potential, with PV plants exporting slightly more electricity than their wind counterparts. Al Nasiriya Wind had the highest output, indicating favorable wind conditions or better system performance at that site. The results show that the analysis of the proposed hybrid system has a standardizing effect on emissions, reducing variability and environmental impact regardless of location. The results demonstrate that solar PV is significantly more financially favorable in terms of capital recovery time at both sites, and that financial incentives, especially grants, are essential to improve project attractiveness, particularly for wind power. The analysis underscores the superior financial viability of solar PV projects in both regions. It highlights the critical role of financial support, particularly capital grants, in turning renewable energy investments into economically attractive opportunities.
1. Introduction
The global transition towards sustainable energy systems necessitates exploring and implementing hybrid renewable energy solutions. Hybrid power plants, integrating wind and solar photovoltaic (PV) technologies, offer a promising approach to enhancing energy reliability, reducing greenhouse gas emissions, and achieving energy independence. These systems capitalize on the complementary nature of wind and solar resources, providing a more consistent and stable energy output [1,2]. Generally, renewable energy sources are sustainable and have a minimal environmental footprint. However, over 80% of the world’s energy comes from non-renewable sources [3]. As the global energy sector continues its transition toward low-carbon and decentralized energy systems, hybrid renewable energy systems (HRES) combining wind and solar photovoltaic (PV) technologies have emerged as promising alternatives to conventional power generation [4,5]. These systems offer advantages such as reduced intermittency, improved energy reliability, and lower levelized electricity (LCOE) costs, particularly in remote or off-grid regions. Such systems’ design, simulation, and optimization require robust analytical tools capable of handling technical, economic, and environmental parameters [6]. Two widely adopted tools in this context are HOMER (Hybrid Optimization of Multiple Energy Resources, initially by NREL (National Renewable Energy Laboratory)), now maintained by HOMER Energy by UL and widely used for microgrid design, particularly in remote or off-grid locations, system simulation, optimization, sensitivity analysis, and component modeling); and RETScreen Clean Energy Management Software (Natural Resources Canada (NRCan), with support from NASA and other international agencies, which helps to assess the viability of energy efficiency and renewable energy projects, performing feasibility analysis, performance analysis, portfolio analysis, and database integration), which have become industry standards for the feasibility assessment of renewable and hybrid energy systems [7,8]. Numerous studies have assessed the technical and economic feasibility. For instance, Abbaspour et al. [9] analyzed PV–wind–diesel–battery hybrid power systems for industrial towns in Spain. Using HOMER software, the study optimized configurations to minimize Net Present Cost (NPC) and Cost of Energy (COE). Ishaq et al. [10] conducted a techno-economic analysis of Pakistan’s hybrid grid-connected PV/wind system. The study utilized NREL’s Geospatial Toolkit and HOMER software to simulate the system over its lifespan. The findings highlight the importance of favorable environmental criteria, such as solar irradiance and wind speeds, in determining the feasibility and performance of hybrid systems. Also, Kaabeche et al. [11] conducted a techno-economic assessment of hybrid PV-wind systems in Algeria using HOMER. Similarly, Shaahid et al. [12] used HOMER to evaluate wind–solar–diesel hybrid systems for rural electrification in Saudi Arabia. Ngan and Tan [13] examined hybrid system design in Malaysia, while Bekele and Tadesse [14] assessed off-grid applications in Ethiopia. On the other hand, RETScreen has been applied extensively in project feasibility and financial evaluation. Frangou et al. [15] used RETScreen to analyze renewable energy projects in the Mediterranean. Bazilian et al. [16] highlighted its importance in global clean energy policy analysis. More recent applications include hybrid modeling in Colombia by Zambrano and Olaya [17] and cost–benefit analysis in Nigeria by Oladigbolu et al. [18].
Olatomiwa et al. [19] focused on optimizing a hybrid renewable energy system combining photovoltaic (PV), wind, and diesel generator components for power generation in a Nigerian context using HOMER software. Aimed at addressing the challenges of unreliable grid supply and high fuel costs in remote areas, the study evaluates the technical and economic viability of different hybrid configurations. Using real meteorological data and load profiles specific to the selected site, the researchers simulated and compared several system architectures. Key performance indicators such as Net Present Cost (NPC), Levelized Cost of Energy (LCOE), and renewable fraction were analyzed. The results demonstrate that a hybrid PV/wind/diesel system with battery storage significantly reduces fuel consumption and emissions compared to diesel-only systems, while maintaining cost-effectiveness. The study concludes that hybrid systems offer a sustainable and economically feasible solution for improving energy access in Nigeria’s off-grid and rural communities.
Elegeonye et al. [20] explored the development of renewable hybrid mini-grid systems as a sustainable solution for rural electrification in Sub-Saharan Africa. Recognizing the limitations of standalone photovoltaic (PV) systems, particularly during periods of low solar irradiance, the authors propose the integration of diesel generators to form a hybrid electricity supply system (HESS). The research involves modeling the HESS using DIgSILENT software, adhering to global engineering standards and practical considerations. The study compares the techno-economic and environmental performance of the hybrid system against PV-only and diesel-only configurations. Findings indicate that the HESS offers improved reliability and user comfort across different seasons, with lower life cycle costs, reduced fuel consumption, and a smaller carbon footprint compared to diesel-only systems. They conclude that hybrid mini-grids present a viable and sustainable approach to enhancing energy access in remote communities within Sub-Saharan Africa. Mahesh and Sandhu [21] present a comprehensive critical review of the developments in hybrid wind and photovoltaic (PV) energy systems, emphasizing their potential in addressing the energy demands of regions like India. The study delves into various aspects of hybrid systems, including optimal sizing, component modeling, energy and economic analysis, and control strategies. By analyzing the existing literature and case studies, the authors highlight the advantages of hybrid systems over standalone configurations, such as improved reliability, efficiency, and cost-effectiveness. The review also discusses the challenges in implementing these systems, including technical complexities, economic constraints, and policy barriers. The authors underscore the importance of simulation tools like HOMER and RETScreen in designing and evaluating hybrid systems, facilitating informed decision making for stakeholders. The study concludes that with appropriate planning and support, hybrid wind/PV systems can play a pivotal role in achieving sustainable and decentralized energy solutions, particularly in developing countries. Zubi et al. [22] performed a RETScreen-based analysis to assess the feasibility of solar energy projects in the United Arab Emirates (UAE). The study focused on evaluating the technical performance, economic viability, and environmental impact of implementing solar photovoltaic systems in the region. The findings indicate that solar projects in the UAE are both technically feasible and economically beneficial, with significant potential for reducing carbon emissions. The research provides valuable insights for policymakers and investors interested in the UAE’s renewable energy sector, as shown in Table 1. Singh and Baredar [23] investigated the modeling and simulation of wind and photovoltaic (PV) hybrid energy systems in India. The study aimed to design an efficient hybrid system capable of meeting the energy demands of remote and rural areas. Using simulation tools, the research analyzed system performance under various scenarios, considering factors like resource availability and load requirements. The results demonstrate that wind/PV hybrid systems could provide a reliable and sustainable energy solution, reducing dependence on conventional energy sources and contributing to rural electrification efforts in India.

Table 1.
The summary highlights the authors, their achievements, and the applied renewable energy solutions/tools.
On the other side, Zhang et al. [24] introduced a robust control strategy employing super-twisting sliding mode control (STSMC) for grid-side inverters (GSIs) in wind power generation systems (WPGSs) utilizing permanent magnet synchronous generators (PMSGs). The new approach addresses challenges posed by parameter perturbations and external disturbances by improving a comprehensive GSI model that includes DC voltage, AC current, and AC voltage control loops [25].
Although previous research has explored various plans, the technical and financial feasibility of establishing hybrid solar photovoltaic and wind power stations has not been explored. Instead, efforts must be devoted, and the focus must be on optimizing energy output and cost-efficiency in different countries, including Iraq. This work examines the technical and financial feasibility of establishing hybrid solar photovoltaic and wind power stations with a power of 60 MW in two Iraqi locations, Al-Rutbah and Al-Nasiriya, focusing on optimizing energy output and cost-efficiency. The study adopted a REScreen-based analysis to assess the feasibility of a hybrid solar photovoltaic and wind power station at these locations. First, the research methodology presented challenges in solar and wind energy: technical and engineering challenges, economic and financial barriers, and environmental and grid integration challenges. Second, the technical assessment included the amount of electricity exported to the grid, emission analysis, and cost analysis. Third, the financial analysis included three scenarios of the Internal Rate of Return (IRR), the Simple Payback Period (SPB), and the Net Present Value (NPV) analysis. Finally, a risk analysis for the Al-Rutbah and Al-Nasiriya renewable energy projects was presented.
2. Materials and Methods
This section describes the main research strategy and the techniques used in the study, namely the feasibility of a hybrid solar photovoltaic and wind power station in Al-Rutbah and Al-Nasiriya in Iraq. The analysis evaluates key technical factors, such as resource availability, system design, and integration challenges, alongside financial considerations, including capital costs, operational expenses, and return on investment (ROI), using the RETScreen program. The models were subjected to a measurement program, which will be described further in the section. The entire numerical analysis is discussed, including change in the hybrid plant’s design and how the changing location affects performance, a description of the features of the hybrid PV and wind plant analysis utilized, and an uncertainty analysis. Figure 1 shows the selected Iraqi locations and the characteristics of the atmospheric conditions [26,27], such as solar resource potential and wind speed for Al-Rutbah and Al-Nasiriya.
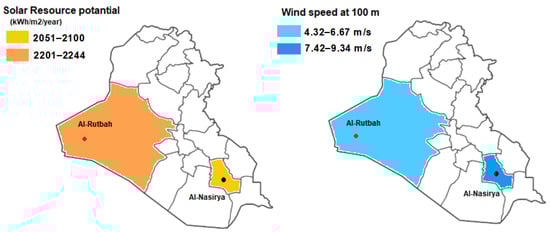
Figure 1.
Solar resource potential and wind speed for PV + WT hybrid plants in Al-Rutbah and Al-Nasiriya.
2.1. Challenges in Solar and Wind Energy
- Technical and Engineering Challenges of Solar and Wind Energy;
- Solar Sector: The focus here is on boosting the efficiency and longevity of solar panels. As the demand for solar modules grows, domestic manufacturers work at full capacity, and new production facilities are being developed. These efforts aim to produce durable panels that can withstand various environmental factors, enhancing power generation.
- Wind Energy Advancements: In wind energy, engineering challenges revolve around designing turbines that maximize energy capture and efficiency. This requires a deep understanding of aerodynamics, material science, and environmental considerations.
- Supply Chain and Cost Fluctuations: The solar and wind industries face supply chain disruptions, cost variations, and rising prices of essentials [20,21].
- Economic and Financial Barriers
- The economic outlook for solar and wind energy presents both opportunities and challenges. Due to their cost-effectiveness, solar and wind energy are sometimes becoming more appealing for utility-scale power generation.
- Financing and Policy Support: Securing investments and effectively navigating policy frameworks is critical for the economic feasibility of these projects. Government efforts to promote domestic solar products and renewable energy have been substantial.
- Market Dynamics: The renewable energy market, especially in the solar and wind sectors, is influenced by government initiatives, demand from commercial and industrial users, and shifting global market trends.
- Environmental and Grid Integration Challenges;
- Land Acquisition and Environmental Impact: Establishing a uniform policy on land acquisition is essential for the successful development of projects. Issues related to land ownership can influence financing and undermine project stability.
- Grid Integration and Evacuation Infrastructure: The swift commissioning of solar and wind projects often outpaces the development of transmission facilities, creating significant challenges. Enhancing evacuation infrastructure and transmission capacity is crucial, particularly in regions with high potential for renewable energy [22,26,27].
2.2. Solutions for Renewable Implementation
- Overcoming the challenges of implementing renewable energy solutions requires a comprehensive approach.
- Financial incentives like grants, low-interest loans, and tax benefits can substantially lower the initial costs of hybrid systems, making them more attractive to investors.
- Leasing options provide a minimal or no-upfront cost alternative, enabling businesses to adopt renewable energy with minimal initial investment. Advancements in technology and innovative design are critical for maximizing the efficiency and integration of renewable technologies [26].
- High-efficiency panels and smart inverters in solar PV systems enhance energy production, even in constrained spaces. Similarly, wind energy technologies designed for optimal performance in various climates extend their usability and efficiency.
- Implementing hybrid systems offers a dependable and efficient power solution year-round, as shown in Figure 2.
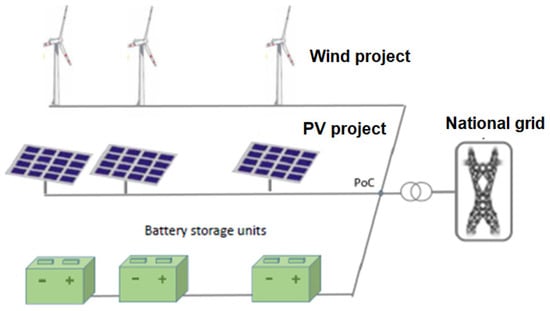 Figure 2. PV + wind hybrid power plant, co-located, grid-connected.
 - Strategic planning and professional consultation are vital for navigating local regulations and successfully integrating renewable systems into existing infrastructures.
- Expertise in renewable energy solutions facilitates the process and ensures installations comply with all regulatory requirements.
- Governments promote the successful adoption of renewable energy technologies by addressing these challenges through financial support, technical innovation, and strategic planning. This approach contributes to environmental sustainability, improves economic viability, and enhances energy independence, paving the way for a more sustainable future in the commercial sector [27].
2.3. Analysis Method
RETScreen Expert is a comprehensive Clean Energy Management Software platform designed to assist professionals and decision-makers in assessing the feasibility of energy efficiency, renewable energy, and cogeneration projects. It also enables users to monitor and verify the ongoing energy performance of buildings, power plants worldwide, and factories, as well as manage entire portfolios of facilities [7]. Developed by international collaborators, a wide range of researchers utilized the software in design for different projects. Additionally, RETScreen is an educational and research tool that is referenced in academic research. In this analysis, RETScreen version 8.1 was used. RETScreen Expert offers comprehensive modeling for a wide array of clean energy sources, both traditional and non-traditional, alongside conventional energy sources and technologies. This includes energy efficiency solutions ranging from large industrial setups to individual homes and diverse heating and cooling methods like biomass, heat pumps, and solar air/water systems. It also covers power generation from renewables such as solar, wind, wave, hydro, and geothermal, in addition to conventional technologies like gas and steam turbines and reciprocating engines. The platform supports combined heat and power systems, or cogeneration [7,8]. Users can access integrated databases for products, projects, benchmarks, hydrology, climate data, and links to global energy resource maps within their analytical worksheets.
For solar PV analysis, the calculation of hourly global and diffuse irradiance begins with determining the monthly average daily diffuse radiation , which is derived from the monthly average daily global radiation .
When the sunset hour angle for the month’s average day is less than 81.4°, and
Thus, is the index of monthly average clearness, defined as
where is the monthly average extraterrestrial daily solar radiation on a horizontal surface. For the calculation of average efficiency,
where ηr is the PV module efficiency at the reference temperature
where is the Nominal Operating Cell Temperature, Tc is the mean monthly ambient temperature, and Ta is the theoretical value. ηr, and depend on the type of PV module considered [8,9].
For the calculation of hourly irradiance in the plane of the PV array,
where for each hour of the “average day”, global horizontal irradiance H and its diffuse and beam components and ρ represents the diffuse reflectance of the ground (also called ground albedo) and β represents the slope of the PV array.
On-Grid Model: The on-grid model represents the simplest system configuration, as illustrated in Figure 3. No specific load is defined in this model, and the array size is determined by the user rather than the software [11]. The inverter capacity is set equal to the nominal power of the array. The energy supplied to the grid corresponds to the total energy produced by the array, minus any losses incurred through the inverter:
where represents the inverter efficiency. Depending on the grid configuration, the grid may not accept a portion of this energy. The actual energy delivered is
where is the PV energy absorption rate.
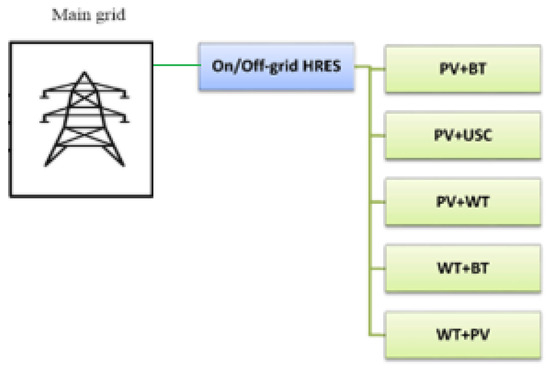
Figure 3.
Structural scheme of PV + WT on grid, off-grid, and scenario.
When needed in the model, the Weibull probability density function calculates wind speed distribution in RETScreen. This distribution is widely used in wind energy engineering because it closely matches the observed long-term distribution of average wind speeds across various locations [14]. In some instances, the model may also apply the Rayleigh distribution, a specific case of the Weibull distribution where the shape factor equals 2. The Weibull function defines the probability p(x) of experiencing a wind speed x at any given time during the year.
This expression is valid for k > 1, x ≥ 0, and C > 0. k is the shape factor, specified by the user. The shape factor will typically range from 1 to 3. C is the scale factor, which is calculated from the following equation:
where is the average wind speed value, and Γ is the gamma function. In some cases, the model will calculate the wind speed distribution from the wind power density at the site rather than from the wind speed. The relations between the wind power density and the average wind speed are as follows:
where is the air density and is the probability of having a wind speed during the year.
The wind plant capacity factor (PCF) represents the ratio of the plant’s average annual power production to its rated power capacity.
where is the renewable energy collected, expressed in kWh, WPC is the wind plant capacity, expressed in kW, and is the number of hours in a year.
How the Program Works: RETScreen is a multilingual software platform designed to minimize the financial and time costs of identifying and assessing potential renewable energy and energy efficiency projects. It supports the modeling of a broad spectrum of clean energy sources—both conventional and emerging, as well as traditional energy systems. This includes heating and cooling, renewable power (solar, wind, etc.), traditional power, energy efficiency, and combined heat and power (CHP) or cogeneration systems. The software’s analytical worksheets are integrated with extensive databases for products, projects, benchmarks, hydrology, climate, and links to global energy resource maps, as illustrated in Figure 4.
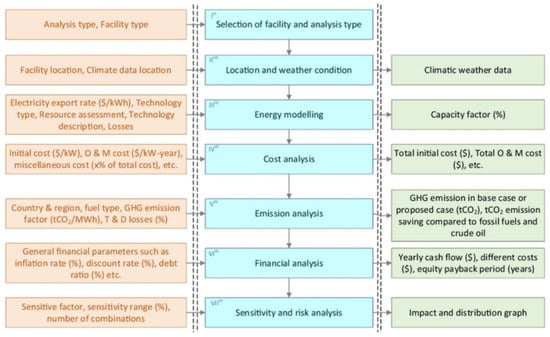
Figure 4.
RETScreen analysis steps.
3. Results and Discussion
This section discusses and analyzes RETScreen results, which include two paths. The first path discusses the technical assessment results. The second path discusses the results of financial analysis. Finally, the results of risk analysis are presented.
3.1. Technical Assessment Results
Figure 5 illustrates the amount of electricity exported to the grid (in MWh) from different renewable power plant types, solar photovoltaic (PV) and wind, at two locations: Al Rutbah and Al Nasiriya. The x-axis represents the power plant sites categorized by location and technology, while the y-axis shows the electricity exported to the grid, ranging from 0 to 50,000 MWh. According to the figure, Al Rutbah PV exported approximately 46,500 MWh. In contrast, Al Nasiriya PV exported slightly less, around 45,000 MWh. Al Rutbah Wind exported approximately 39,000 MWh. Al Nasiriya Wind showed the highest export rate among wind installations, at around 46,000 MWh. Overall, both PV and wind technologies demonstrate significant energy export potential, with PV plants generally exporting slightly more electricity than their wind counterparts. Al Nasiriya Wind had the highest output, indicating favorable wind conditions or better system performance at that site.
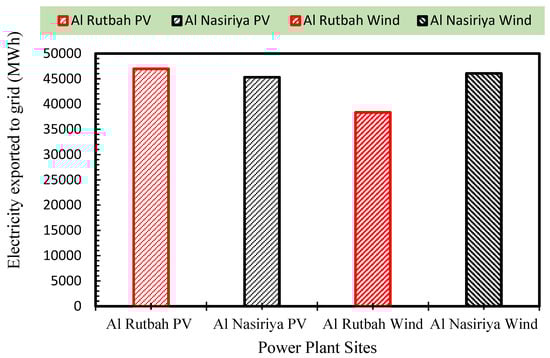
Figure 5.
Variation in the amount of electricity exported to the grid (in MWh) from different renewable power plant types: solar photovoltaic (PV) and wind.
Figure 6 compares the total electricity exported to the grid (in MWh) by the combined photovoltaic (PV) and wind power projects at two locations: Al Rutbah and Al Nasiriya. The total electricity exported ranges from 82,000 MWh to 92,000 MWh for the two power plant sites. The results record that the Al Nasiriya project (PV + Wind) exported the highest amount of electricity, approximately 91,500 MWh, indicating a strong overall performance of both renewable sources at this site. In contrast, the Al Rutbah project (PV + Wind) exported around 85,000 MWh, which is noticeably lower than Al Nasiriya’s output. This suggests that the Al Nasiriya site has a more favorable environment, better system efficiency, or both, for renewable energy generation when combining PV and wind technologies. The difference in export levels may be due to site-specific factors such as solar irradiance, wind speed, infrastructure efficiency, or grid integration capabilities.
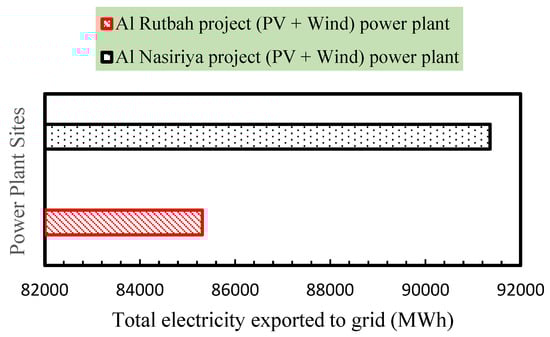
Figure 6.
Variation in the total electricity exported to the grid (in MWh) by the combined photovoltaic (PV) and wind power projects at Al Rutbah and Al Nasiriya.
Figure 7 displays a comparative emission analysis for two hybrid power plant sites, Al Rutbah plant and Al Nasiriya plant, under the base case (likely conventional fossil-based systems) and the proposed case (a hybrid of PV and wind technologies). The results show that both sites exhibit a dramatic reduction in emissions under the proposed hybrid configuration compared to the base case. For the Al-Rutbah plant, emissions in the base case are around 83,000 units, and emissions drop to approximately 6000 units in the proposed case. While for the Al Nasiriya project, emissions in the base case are higher, around 89,000 units, and the proposed case emissions are again significantly lower, close to 6000 units. Although the Al Nasiriya base case emissions are higher than Al Rutbah’s, the proposed cases for both sites yield similar emission levels. This analysis of the proposed hybrid system shows that it has a standardizing effect on emissions, reducing variability and environmental impact regardless of location. Table 2 shows emissions analysis for both power plant sites. It effectively communicates the ecological advantage of transitioning from conventional power generation (base case) to hybrid renewable systems (proposed case). It supports the case for a broader implementation of PV + wind hybrids, especially in areas like Al Rutbah and Al Nasiriya, where emission reductions can be maximized [16].
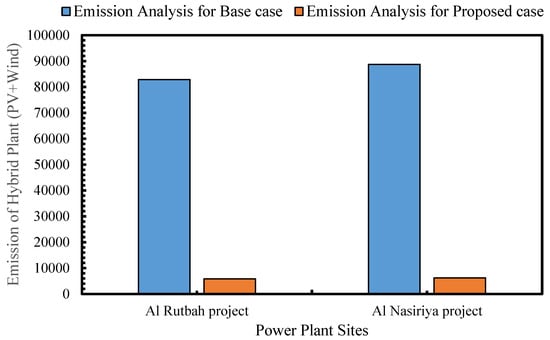
Figure 7.
A comparative emission analysis for two hybrid power plant sites, Al Rutbah plant and Al Nasiriya plant.
Table 2.
Emissions analysis for power plant sites: Al Rutbah plant and Al Nasiriya plant.
Table 3 shows the proposed cases’ initial, operation, and maintenance costs, including credits for any base case costs avoided in the proposed power plants. Less detailed and less accurate information is typically required for a pre-feasibility analysis, while more detailed and more accurate information is usually needed for a feasibility analysis.
Table 3.
Cost analysis.
3.2. Financial Analysis Results
The RETScreen Financial Analysis Model, found in the Financial Summary worksheet of the RETScreen Software, allows the user to input various financial parameters, such as discount rates, etc., and to automatically calculate key financial feasibility indicators, such as Internal Rate of Return, Simple Payback, Net Present Value, etc. This section presents the results obtained from the financial analysis model for two plants, including the inflation rate (%) (the projected annual average inflation rate over the project’s life). For example, inflation for the next 25 years in Iraq is currently forecasted to range between 2 and 3% [28]. The analysis included the following data: inflation rate 3%, reinvestment rate 9%, project life 25 years, debt ratio 70%, debt interest ratio: 6%, debt term: 15 years, and electricity export escalation rate 2.3%. A financial analysis was performed, including Internal Rate of Return (IRR), Simple Payback Period (SPB), and Net Present Value (NPV) under several scenarios, each based on different assumptions and definitions, as outlined below:
- Scenario 1 (Sc 1): Project implementation without any grants (grants = USD 0) and with no revenue from GHG reduction credits (GHG credit rate = USD 0/tCO2).
- Scenario 2 (Sc 2): Project implementation with a grant covering 60% of the initial capital cost and no revenue from GHG reduction credits (GHG credit rate = USD 0/tCO2).
- Scenario 3 (Sc 3): Project implementation without any grants (grants = USD 0), but with GHG reduction credits valued at USD 30/tCO2. The crediting period is fixed at 10 years, representing the duration over which the project receives revenue from GHG reduction.
Table 4 presents the Internal Rate of Return (IRR) for solar photovoltaic and wind power projects at the Al-Rutbah and Al-Nasiriya sites under three financial scenarios and a range of electricity tariffs. Across both locations, solar PV consistently shows stronger financial performance than wind power. At low tariffs (USD 0.015/kWh), both technologies yield negative IRRs, indicating poor feasibility without support. As tariffs increase, solar PV becomes viable more quickly, particularly under Scenario 2 (60% grant), which produces positive returns starting at USD 0.035/kWh at both sites. Scenario 3 (GHG credits at USD 30/tCO2 for 10 years) also enhances solar PV returns, though less dramatically than grants, with IRRs exceeding 37% at USD 0.095/kWh in both projects. In contrast, wind power remains largely unviable at Al-Rutbah, showing negative IRRs under most conditions and only marginal improvements under Scenario 2 at higher tariffs. At Al-Nasiriya, wind power performs slightly better, with Scenario 2 achieving positive IRRs at tariffs of USD 0.075/kWh and above, and Scenario 1 even showing a small positive IRR at the highest tariff level. These results highlight that while solar PV is financially more attractive across both sites, targeted financial incentives are essential to improve the feasibility of wind energy, especially in locations with less favorable wind resources. Figure 8 shows the variation in Internal Rate of Return (IRR) for solar photovoltaic and wind power projects at the Al-Rutbah and Al-Nasiriya sites.
Table 4.
The Internal Rate of Return (IRR) variation for solar photovoltaic and wind power projects at the Al-Rutbah and Al-Nasiriya sites.
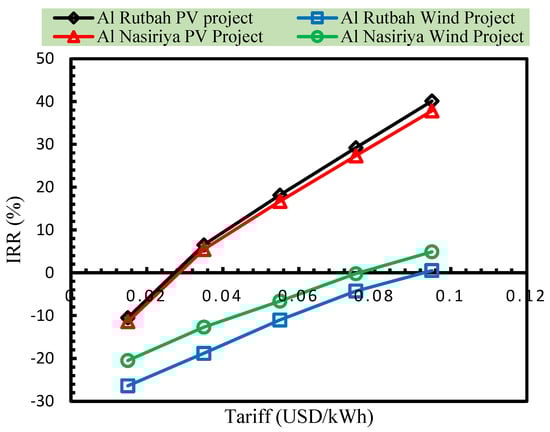
Figure 8.
The variation in IRR for solar photovoltaic and wind power projects at the Al-Rutbah and Al-Nasiriya sites (Scenario 2).
Table 5 presents the Simple Payback Period (SPB) for solar photovoltaic and wind power projects at the Al-Rutbah and Al-Nasiriya sites under different electricity tariff levels and three financial scenarios. Across both locations, solar PV consistently shows shorter payback periods than wind power, particularly under Scenarios 2 (60% grant) and 3 (GHG credit at USD 30/tCO2 for 10 years). At the lowest tariff (USD 0.015/kWh), SPB values are extremely high for solar PV and undefined for wind power in most cases, indicating poor financial viability without external support. However, as tariffs increase, solar PV projects become much more attractive, with SPB dropping below 10 years at tariffs of USD 0.055/kWh and above under Scenarios 2 and 3. For instance, at USD 0.095/kWh, solar PV achieves SPBs as low as 2.88 years (Al-Rutbah) and 2.99 years (Al-Nasiriya) in Scenario 2. In contrast, wind power projects at Al-Rutbah exhibit long or undefined SPBs even at higher tariffs, while Al-Nasiriya shows slightly improved outcomes, reaching a minimum of 7.58 years at USD 0.095/kWh in Scenario 2. Overall, the results demonstrate that solar PV is significantly more financially favorable in terms of capital recovery time at both sites, and that financial incentives, especially grants, are essential to improve project attractiveness, particularly for wind power. Figure 9 shows the variation in Simple Payback Period (SPB) for solar photovoltaic and wind power projects at the Al-Rutbah and Al-Nasiriya sites.
Table 5.
The Simple Payback Period (SPB) variation for solar photovoltaic and wind power projects at the Al-Rutbah and Al-Nasiriya sites.
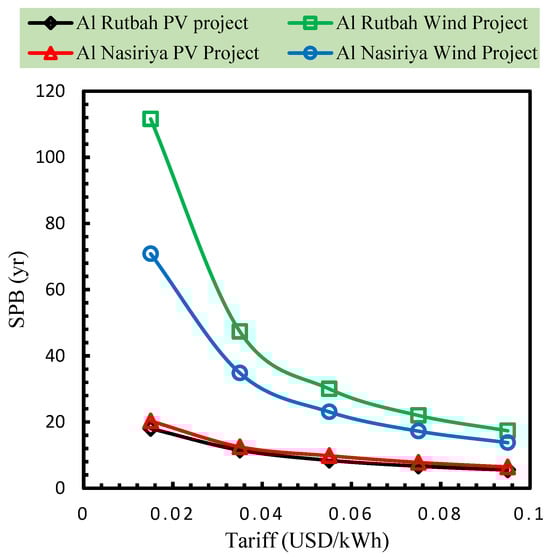
Figure 9.
The variation in SPB for solar photovoltaic and wind power projects at the Al-Rutbah and Al-Nasiriya sites (Scenario 2).
Table 6 presents the Net Present Value (NPV) analysis for solar photovoltaic and wind power projects at the Al-Rutbah and Al-Nasiriya sites across three financial scenarios and different electricity tariffs. The results show that solar PV projects consistently outperform wind power in both locations, with NPV increasing as tariff levels rise. Under Scenario 1 (no grants or GHG credits), solar PV projects remain financially unviable at tariffs below USD 0.055/kWh, with negative NPVs. However, positive NPVs emerge starting at USD 0.055/kWh for Al-Rutbah and slightly later for Al-Nasiriya, indicating marginal financial feasibility. Scenario 2 (60% grant) significantly boosts NPVs for both solar and wind technologies, turning them positive at lower tariffs—solar PV becomes highly profitable above USD 0.035/kWh at both sites. Scenario 3 (GHG credit of USD 30/tCO2 for 10 years) provides moderate improvements but is less impactful than direct grants. Wind power remains economically challenging at Al-Rutbah, yielding negative NPVs under most scenarios and tariffs, except under Scenario 2 at the highest tariff (USD 0.095/kWh). In contrast, wind power at Al-Nasiriya performs relatively better, achieving positive NPVs under Scenario 2 at tariffs above USD 0.075/kWh. Overall, the analysis underscores the superior financial viability of solar PV projects in both regions, and highlights the critical role of financial support, particularly capital grants, in turning renewable energy investments into economically attractive opportunities. Figure 10 shows the variation in Net Present Value (NPV) for solar photovoltaic and wind power projects at the Al-Rutbah and Al-Nasiriya sites.
Table 6.
The Net Present Value (NPV) variation for solar photovoltaic and wind power projects at the Al-Rutbah and Al-Nasiriya sites.
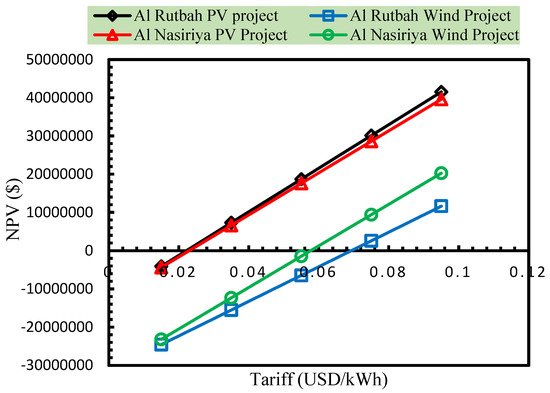
Figure 10.
The variation in NPV for solar photovoltaic and wind power projects at the Al-Rutbah and Al-Nasiriya sites (Scenario 2).
Table 7 highlights the Annual Life Cycle Savings (ALCSs) for solar PV and wind energy projects at Al-Rutbah and Al-Nasiriya, demonstrating the economic sustainability of these technologies across various scenarios and tariff rates. For both locations, solar PV shows a clear transition from negative to positive ALCS as tariffs increase, particularly under Scenarios 2 (60% grant) and 3 (GHG credit of USD 30/tCO2 for 10 years). In Al-Rutbah, solar PV under Scenario 1 remains financially unviable at tariffs below USD 0.055/kWh, with negative savings, but begins to show modest gains at higher tariffs, reaching over USD 2.4 million/year at USD 0.095/kWh. Scenario 2 delivers the strongest performance, producing annual savings exceeding USD 4.2 million at the same tariff. A similar trend is observed in Al-Nasiriya, with solar PV yielding the highest ALCS under Scenario 2 and becoming economically viable from USD 0.055/kWh upward. Wind power, on the other hand, generally performs poorly in both locations under Scenarios 1 and 3, with consistently negative ALCS across most tariffs. Only in Scenario 2 and at higher tariffs (USD 0.075 and USD 0.095/kWh) do wind projects begin to show modest annual savings, particularly in Al-Nasiriya, where ALCS reaches about USD 2 million/year under the most favorable conditions. These findings affirm that solar PV is more economically favorable in both regions, and that targeted financial incentives, especially grants, are essential to enhance the viability of wind energy investments.
Table 7.
The Annual Life Cycle Savings (ALCSs) variation for solar photovoltaic and wind power projects at the Al-Rutbah and Al-Nasiriya sites.
Table 8 presents IRR, SPB, NPV, and ALCS for the hybrid project (wind and solar photovoltaic). The results show that all metrics improve significantly with increasing tariff rates. The economic performance with higher tariffs, both in Al-Rutbah and Al-Nasiriya, shows improvement, but results vary across scenarios. Generally, Scenario 2 yields the best IRR, SPB, NPV, and ALCS results.
Table 8.
The IRR, SPB, NPV, and ALCS for the hybrid project (wind and solar photovoltaic).
3.3. Risk Analysis Results
Table 9 presents a risk analysis for the Al-Rutbah and Al-Nasiriya renewable energy projects, focusing on key parameters including initial costs, operation and maintenance (O&M) costs, and the electricity exported to the grid. The analysis applies a ±25% variation to assess the potential impact on both solar photovoltaic (PV) and wind projects. For both locations, the range of initial costs is significantly higher for wind power compared to solar PV. For instance, at Al-Rutbah, solar PV investment costs range between approximately USD 22.3 million and USD 37.1 million, while wind power ranges from USD 47.3 million to USD 78.8 million, highlighting greater financial exposure in wind development. Similarly, O&M costs for wind power are notably higher, with potential annual costs reaching USD 1.31 million compared to a maximum of around USD 412,500 for solar PV, reflecting the more maintenance-intensive nature of wind systems. In terms of electricity export potential, solar PV at Al-Rutbah varies from 35,220 MWh to 58,700 MWh annually, while wind shows a broader range due to higher variability in wind resources. Al-Nasiriya exhibits similar trends, with PV export ranging from approximately 33,971 MWh to 56,618 MWh, and wind generation ranging from 34,546 MWh to 57,577 MWh. These variations emphasize that while solar PV offers more predictable cost and generation profiles, wind power is subject to greater uncertainty in both investment and performance. The findings reinforce the need for robust financial planning and risk mitigation strategies, particularly for wind projects, which are more sensitive to cost and resource variability.
Table 9.
Risk analysis for the Al-Rutbah and Al-Nasiriya sites.
Figure 11 presents the probabilistic distribution of energy production costs for both the PV and wind power projects, derived from risk analysis simulations. The variation in the PV project reveals that the energy production cost predominantly lies within the range of approximately 63.20 to 66.80 USD/MWh, with the highest frequency observed around 63.20 USD/MWh. This concentration suggests relatively stable cost behavior and moderate sensitivity to input uncertainties such as initial investment, O&M costs, and energy yield. The cost distribution for PV is narrower and skewed slightly right, indicating a more predictable and manageable risk profile. Conversely, the wind project exhibits a broader and more dispersed cost distribution, ranging roughly from 132.76 to 180.79 USD/MWh. The cost frequency is highest in the 149.9 to 151.83 USD/MWh range, but several bins show significant frequencies across a wider cost range, reflecting higher sensitivity to uncertainties. The wider spread indicates that wind energy production costs are more volatile and risk-prone due to higher initial costs, O&M variability, and fluctuations in wind energy yield.
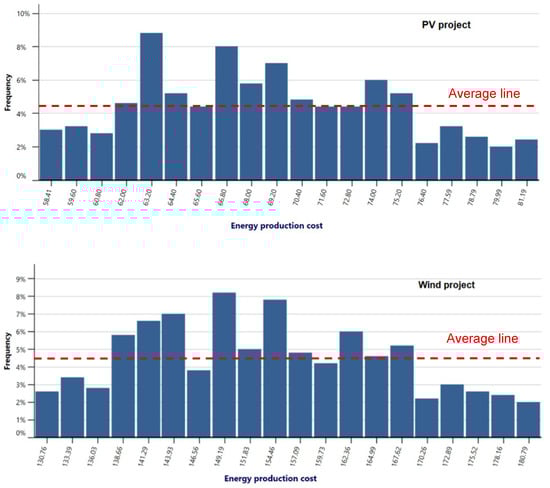
Figure 11.
The distribution of energy production costs for both the PV and wind power projects.
Overall, the figure emphasizes that, under uncertainty, PV projects offer a more predictable cost profile compared to wind projects, which are more susceptible to variations in input parameters, leading to higher financial risk.
4. Conclusions
This work describes a RETScreen analysis to study potential locations and configurations for maximizing energy production and minimizing costs. The evaluation is performed through calculation of the Internal Rate of Return (IRR) on equity (%), the Simple Payback (year), the Net Present Value (NPV), and the Annual Life Cycle Savings (ALCSs). Two sites were selected to analyze and evaluate the performance of a 60 MW hybrid (wind, solar photovoltaic) power plant: Al-Rutbah and Al-Nasiriya. The most important conclusions can be highlighted as follows:
- The results indicate that both PV and wind technologies demonstrate significant energy export potential, with PV plants generally exporting slightly more electricity than their wind counterparts. Al Nasiriya Wind had the highest output, indicating favorable wind conditions or better system performance at that site.
- The results show that the analysis of the proposed hybrid system shows that it has a standardizing effect on emissions, reducing variability and environmental impact regardless of location.
- The results highlight that while solar PV is financially more attractive across both sites, targeted financial incentives are essential to improve the feasibility of wind energy, especially in locations with less favorable wind resources.
- The results demonstrate that solar PV is significantly more financially favorable in terms of capital recovery time at both sites, and that financial incentives, especially grants, are essential to improve project attractiveness, particularly for wind power.
- The analysis underscores the superior financial viability of solar PV projects in both regions. It highlights the critical role of financial support, particularly capital grants, in turning renewable energy investments into economically attractive opportunities.
- The wind project exhibits a broader and more dispersed cost distribution, ranging roughly from 132.76 to 180.79 USD/MWh. The cost frequency is highest in the 149.9 to 151.83 USD/MWh range. The wider spread indicates that wind energy production costs are more volatile and risk-prone due to higher initial costs, O&M variability, and fluctuations in wind energy yield. The results emphasize that, under uncertainty, PV projects offer a more predictable cost profile compared to wind projects, which are more susceptible to variations in input parameters, leading to higher financial risk.
- Finally, after analyzing the financial parameters of the hybrid project, the results show that all metrics improve significantly with increasing tariff rates for both Al-Rutbah and Al-Nasiriya. However, the economic performance results vary across scenarios. Generally, Scenario 2 yields the best IRR, SPB, NPV, and ALCS results.
Author Contributions
Conceptualization, M.E.A.; Methodology, H.A.A.W.; Software, L.F.A.-M.; Validation, M.E.A.; Formal analysis, M.E.A. and H.A.A.W.; Resources, L.F.A.-M.; Writing—original draft, L.F.A.-M.; Writing—review and editing, H.A.A.W.; Visualization, M.E.A. All authors have read and agreed to the published version of the manuscript.
Funding
This research received no external funding.
Institutional Review Board Statement
Not applicable.
Informed Consent Statement
Not applicable.
Data Availability Statement
The original contributions presented in this study are included in the article.
Conflicts of Interest
Author Luay F. Al-Mamory was employed by General Company for The Distribution of Middle Euphrates Electricity. The remaining authors declare that the research was conducted in the absence of any commercial or financial relationships that could be construed as a potential conflict of interest.
References
- Al-Maliki, W.A.K.; Al-Hasnawi, A.G.T.; Abdul Wahhab, H.A.; Alobaid, F.; Epple, B. A Comparison Study on the Improved Operation Strategy for a Parabolic trough Solar Power Plant in Spain. Appl. Sci. 2021, 11, 9576. [Google Scholar] [CrossRef]
- Al-Maliki, W.A.K.; Khafaji, H.Q.A.; Abdul Wahhab, H.A.; Al-Khafaji, H.M.H.; Alobaid, F.; Epple, B. Advances in Process Modelling and Simulation of Parabolic Trough Power Plants: A Review. Energy 2022, 15, 5512. [Google Scholar] [CrossRef]
- Mohammadi, H.; Saghaian, S.; Gharibi, B.Z.D. Renewable and Non-Renewable Energy Consumption and Its Impact on Economic Growth. Sustainability 2023, 15, 3822. [Google Scholar] [CrossRef]
- Ludwig, D.; Breyer, C.; Solomon, A.A.; Seguin, R. Evaluation of an onsite integrated hybrid PV-Wind power plant. AIMS Energy 2020, 8, 988–1006. [Google Scholar] [CrossRef]
- Chrifi-Alaoui, L.; Drid, S.; Ouriagli, M.; Mehdi, D. Overview of Photovoltaic and Wind Electrical Power Hybrid Systems. Energy 2023, 16, 4778. [Google Scholar] [CrossRef]
- Babaremu, K.; Olumba, N.; Chris-Okoro, I.; Chuckwuma, K.; Jen, T.; Oladijo, O.; Akinlabi, E. Overview of Solar–Wind Hybrid Products: Prominent Challenges and Possible Solutions. Energy 2022, 15, 6014. [Google Scholar] [CrossRef]
- Owolabi, A.B.; Kigha Nsafon, B.E.; Wook Roh, J.; Suh, D.; Huh, J. Validating the techno-economic and environmental sustainability of solar PV technology in Nigeria using RETScreen Experts to assess its viability. Sustain. Energy Technol. Assess. 2019, 36, 100542. [Google Scholar] [CrossRef]
- Al-Dousari, A.; Al-Nassar, W.; Al-Hemoud, A.; Alsaleh, A.; Ramadan, A.; Al-Dousari, N.; Ahmed, M. Solar and wind energy: Challenges and solutions in desert regions. Energy 2019, 176, 184–194. [Google Scholar] [CrossRef]
- Abbaspour, A.; Jahed, A.; Ahmad, A. Techno-economic analysis of PV–wind–diesel–battery hybrid power systems for industrial towns under different climates in Spain. Energy Sci. Eng. 2023, 11, 2831–2850. [Google Scholar] [CrossRef]
- Ishaq, S.; Naveed, S.; Mahmood Khan, S.; Najam-ul-Islam, M. Techno-Economic Analysis of a Hybrid Grid-Connected/PV/Wind System in Pakistan. Int. J. Renew. Enery Res. 2020, 6, 1319–1327. [Google Scholar]
- Kaabeche, A.; Belhamel, M.; Ibtiouen, R. Techno-economic valuation and optimization of integrated photovoltaic/wind energy conversion system. Sol. Energy 2011, 85, 2407–2420. [Google Scholar] [CrossRef]
- Shaahida, S.M.; El-Amina, I.; Rehmana, S.; Al-Shehria, A.; Ahmada, F.; Bakashwaina, J.; AlHadhramia, L.M. Techno-Economic Potential of Retrofitting Diesel Power Systems with Hybrid Wind-Photovoltaic-Diesel Systems for Off-Grid Electrification of Remote Villages of Saudi Arabia. Int. J. Green Energy 2010, 7, 632–646. [Google Scholar] [CrossRef]
- Ngan, M.S.; Tan, C.W. Assessment of economic viability for PV/wind/diesel hybrid energy system in southern Peninsular Malaysia. Renew. Sustain. Energy Rev. 2012, 16, 634–647. [Google Scholar] [CrossRef]
- Bekele, G.; Tadesse, G. Feasibility study of small Hydro/PV/Wind hybrid system for off-grid rural electrification in Ethiopia. Appl. Energy 2012, 97, 5–15. [Google Scholar] [CrossRef]
- Frangou, M.; Tsoutsos, T.; Sakellariou, N. Sustainability assessment of a solar thermal power project in Mediterranean application in the island of Crete. Ecol. Indic. 2012, 18, 379–386. [Google Scholar] [CrossRef]
- Bazilian, M.; Hobbs, B.F.; Blyth, W.; MacGill, I.; Howells, M. Interactions between energy security and climate change: A focus on developing countries. Energy Policy 2011, 39, 750–3756. [Google Scholar] [CrossRef]
- Zambrano, C.; Olaya, Y. An agent-based simulation approach to congestion management for the Colombian electricity market. Ann. Oper. Res. 2017, 258, 217–236. [Google Scholar] [CrossRef]
- Oladigbolu, J.O.; Ramli, M.A.M.; Al-Turki, Y.A. Techno-Economic and Sensitivity Analyses for an Optimal Hybrid Power System Which Is Adaptable and Effective for Rural Electrification: A Case Study of Nigeria. Sustainability 2019, 11, 4959. [Google Scholar] [CrossRef]
- Olatomiwa, L.; Mekhilef, S.; Huda, A.S.N.; Ohunakin, O.S. Economic evaluation of hybrid energy systems for rural electrification in six geo-political zones of Nigeria. Renew. Energy 2015, 83, 435–446. [Google Scholar] [CrossRef]
- Elegeonye, H.I.; Owolabi, A.B.; Ohunakin, O.S.; Abdulfatai Olatunji Yakub, A.O.; Yahaya, A.; Same, N.N.; Dongjun Suh, D.; Huh, J. Techno-Economic Optimization of Mini-Grid Systems in Nigeria: A Case Study of a PV–Battery–Diesel Hybrid System. Energy 2023, 16, 4645. [Google Scholar] [CrossRef]
- Mahesh, A.; Sandhu, K.S. Hybrid wind/photovoltaic energy system developments: Critical review and findings. Renew. Sustain. Energy Rev. 2015, 52, 1135–1147. [Google Scholar] [CrossRef]
- Zubi, G.; Dufo-López, R.; Pasaoglu, G.; Pardo, N. Techno-economic assessment of an off-grid PV system for developing regions to provide electricity for basic domestic needs: A 2020–2040 scenario. Appl. Energy 2016, 176, 309–319. [Google Scholar] [CrossRef]
- Singh, A.; Baredar, P. Techno-economic assessment of a solar PV, fuel cell, and biomass gasifier hybrid energy system. Energy Rep. 2016, 2, 254–260. [Google Scholar] [CrossRef]
- Zhang, W.; Wang, Y.; Zeeshan, M.; Han, F.; Song, K. Super-twisting sliding mode control of grid-side inverters for wind power generation systems with parameter perturbation. Int. J. Electr. Power Energy Syst. 2025, 165, 110501. [Google Scholar] [CrossRef]
- Zhang, W.; Sun, C.; Alharbi, M.; Hasanien, H.M.; Song, K. A voltage-power self-coordinated control system on the load-side of storage and distributed generation inverters in distribution grid. Ain Shams Eng. J. 2025, 16, 103480. [Google Scholar] [CrossRef]
- Ajel, M.G.; Gedik, E.; Abdul Wahhab, H.A.; Shallal, B.A. Performance Analysis of an Open-Flow Photovoltaic/Thermal (PV/T) Solar Collector Using Different Fin Shapes. Sustainability 2023, 15, 3877. [Google Scholar] [CrossRef]
- Sachit, M.S.; Shafri, H.Z.M.; Abdullah, A.F.; Rafie, A.S.M. Combining Re-Analyzed Climate Data and Landcover Products to Assess the Temporal Complementarity of Wind and Solar Resources in Iraq. Sustainability 2022, 14, 388. [Google Scholar] [CrossRef]
- Karee, A.F.; Akroot, A.; Abdul Wahhab, H.A.; Talal, W.; Ghazal, R.M.; Alfaris, A. Exergo–Economic and Parametric Analysis of Waste Heat Recovery from Taji Gas Turbines Power Plant Using Rankine Cycle and Organic Rankine Cycle. Sustainability 2023, 15, 9376. [Google Scholar] [CrossRef]
Disclaimer/Publisher’s Note: The statements, opinions and data contained in all publications are solely those of the individual author(s) and contributor(s) and not of MDPI and/or the editor(s). MDPI and/or the editor(s) disclaim responsibility for any injury to people or property resulting from any ideas, methods, instructions or products referred to in the content. |
© 2025 by the authors. Licensee MDPI, Basel, Switzerland. This article is an open access article distributed under the terms and conditions of the Creative Commons Attribution (CC BY) license (https://creativecommons.org/licenses/by/4.0/).