Article

Dynamic Impacts of Economic Growth, Energy Use, Urbanization, and Trade Openness on Carbon Emissions in the United Arab Emirates

by
Hatem Ahmed Adela
1,2,*,
Wadeema BinHamoodah Aldhaheri
1,3 and
Ahmed Hatem Ali
4
1
Department of Islamic Studies, Mohamed Bin Zayed University for Humanities (Part-Time Faculty), Abu Dhabi P.O. Box 106621, United Arab Emirates
2
Department of Economics, Sadat Academy for Management Sciences, Cairo 11837, Egypt
3
College of Islamic Studies, Mohamed Bin Zayed University for Humanities, Abu Dhabi P.O. Box 106621, United Arab Emirates
4
TAQA Industrialization and Energy Services, Abu Dhabi P.O. Box 51111, United Arab Emirates
*
Author to whom correspondence should be addressed.
Sustainability 2025, 17(13), 5823; https://doi.org/10.3390/su17135823
Submission received: 4 May 2025 / Revised: 10 June 2025 / Accepted: 19 June 2025 / Published: 24 June 2025

Abstract

The United Arab Emirates has become increasingly concerned about carbon dioxide emissions due to their impact on climate change and the environment, as it is one of the top ten world oil producers. This reflects its recognition of the need for sustainable development. Therefore, this research aims to study the dynamic impact of economic growth, urbanization, energy consumption, and economic openness on CO2 emissions, during the period 1975–2022. To capture these effects, a novel dynamic ARDL is employed to separate the impact of each variable separately. The results indicate that the effect of GDP per capita on carbon emissions is negative, as a 1% increase in economic growth leads to a decrease in carbon dioxide emissions by 0.6%. Moreover, the findings confirm that the UAE economy does not apply to the Kuznets curve in developing countries. Furthermore, the impact of energy consumption, urbanization, and trade openness is positive on CO2 emissions, as a 1% increase in each raises CO2 by 0.17%, 11.6%, and 1.2%, respectively. These findings are important for decision makers in the environmental field to make decisions to reduce carbon emissions by altering the impact of economic variables and spread awareness towards reducing carbon emissions.

1. Introduction

The concerns over climate change and global warming have escalated over the last two decades due to the surge in greenhouse gas (GHG) emissions, primarily carbon emissions of CO2, which constitute about 82% of total GHG emissions. The dominant sources of GHG emissions are forest fires, industrial combustion processes, and the burning of fossil fuels [1]. This remarkable rise is considerably attributed to human activities, leading to immense negative impacts on food and water security, human health, economies, and society. From 2011 to 2020 the global surface temperature rose by 1.1 °C above the 1850–1900 baseline [2]. This has resulted in associated deterioration and damage to the environment.
The majority of emissions stem primarily from developing countries seeking to expedite economic growth [3]. Over the period 1990–2005, China’s CO2 emissions increased by an average of 6.6%. Although there was a reduction to an average growth rate of 4.3% from 2005 to 2020, China retained a share of 30.5% of the total CO2 emissions in 2020. China classifies itself as a developing country in the WTO. However, the World Bank and U.N. Development Program classify China as an upper-middle-income country [4], while the IMF calls the country an emerging and developing economy [5]. Moreover, India’s emissions increased by an average of 5.5% during the same period, constituting 7% of the total greenhouse gas emissions in 2020. In contrast, the United States and the European Union accomplished reductions of −1.2% and −1.6%, respectively, over the period 2005–2019 [1]. The ceaseless rise in CO2 emissions is expected to have significant effects on the global climate system, leading to severe consequences for various sectors of society [6]. Hence, reducing CO2 emissions and improving environmental quality have emerged as a worldwide priority to promote sustainable development and alleviate the adverse impacts of climate change [7].
The UAE is ranked among the top ten world oil producers. The oil and gas sector accounts for 13% of all total exports [8], and provides the majority of government revenues, contributing an average of 29.8% of the UAE’s GDP spanning the period 2010 to 2022 [9]. Furthermore, the country faces challenges as a coastal country, which makes it vulnerable to the effects of climate change, and it also has limited natural resources. Therefore, the UAE prioritizes the transition towards sustainable energy as a key priority. It is committed to achieving a significant reduction in carbon emissions, considering it a pivotal concern of the nation’s environmental strategy, which includes the transformation of the emirates’ cities into smart cities, aiming to sustain economic development and efficiently manage human movement [10]. Therefore, the UAE established the Ministry of Climate Change and Environment in 2016, exhibiting a proactive and early attempt to mitigate the effects of climate change and achieve the target 25% reduction in GHG emissions by 2030 compared with 1990 under the Paris Agreement [11]. Furthermore, it launched in 2021 the 2050 Strategic Plan for achieving net-zero emissions by 2050. The United Arab Emirates is considered the first country in the Middle East and North Africa (MENA) region to fulfill this important environmental objective [12].
Furthermore, the UAE has embarked on 14 projects to reduce greenhouse gas emissions (GHGs) under the umbrella of clean development mechanism projects. The total expected annual decline from these projects is estimated at one million tons of carbon dioxide equivalent. In addition, the UAE is committed to expanding the role of zero-carbon technologies in the economy and investing in renewable energy and nuclear power [13]. Notably, the UAE’s carbon emissions declined from 32.6 tons of CO2 per person in 1990 to 21.9 in 2010, and 19.3 in 2022 [14]. Policymakers’ concerns about climate is increasing substantially to achieve the balance between sustainable development and climate change mitigation. Additionally, the UAE hosted the UN’s COP28 climate change conference, emphasizing the contribution of the oil and gas sector to achieving net-zero emissions [15].
Therefore, it is important to emphasize the need for the inclusive investigation of the dynamic impacts of socio-economic and environmental factors on carbon emissions (CO2) in the UAE, which shows the characteristics of a country with a high energy demand and heavy dependence on fossil fuel consumption due to its thriving economy and hosting nearly nine times its population, comprising over two hundred various nationalities. Therefore, the current study delves into the dynamic impact of the economic, energy, and socio-economic variables of carbon emissions (CO2) in the UAE, utilizing a Dynamic Autoregressive Distributed Lag (DARDL) model. Furthermore, this study seeks to evaluate the validity of the Environmental Kuznets Curve (EKC) hypothesis. It has the potential to provide policymakers with a thorough and valuable understanding, facilitating the formulation of efficient policies in key areas such as renewable energy, a low-carbon economy, and sustainable urban areas. Furthermore, this study may contribute to the formulation of new strategies to prepare the UAE for potential future scenarios of global warming.
This paper is structured into five sections as below: the first section is the introduction, followed by the literature review. The third section shows the data and methodology. The fourth section exhibits empirical results and discussion, while the concluding section includes conclusions and policy implications.

2. Literature Review

Many studies have investigated the relationship between economic growth and environmental quality through the traditional theory of the Environmental Kuznets Curve hypothesis (EKC), which suggests an inverted U-shaped relationship between economic growth and the environment, where environmental degradation tends to rise as income increases until a turning point, which expresses that a certain level of income is achieved, leading to a shift towards environmentally conscious practices, leading to an increased demand for clean and sustainable energy [16]. The hypothesis posits that the adoption of clean technologies has become a means to avert environmental degradation. These studies utilize data from different countries or groups of countries and employ methods such as decoupling decomposition analysis and econometrics. These studies have yielded diverse findings and are unable to pinpoint a distinctly global perspective on the connection between environmental sustainability and economic growth [17]. Over the last three decades, many variables have been integrated into traditional theories to investigate the relationship between socio-economic variables and both greenhouse gas (GHG) emissions and carbon dioxide emissions, highlighting the significant impact of factors such as economic development, energy consumption, urbanization, innovation, and trade openness on CO2 emissions [18]. However, the initial assessment report by the Intergovernmental Panel on Climate Change (IPCC) in 1990 asserted the critical importance of addressing climate change and carbon dioxide emissions, emphasizing the need to stabilize greenhouse gas concentrations at a level that would prevent harmful human-induced interference with the climate system. Policymakers, scientists, and both governmental bodies and international organizations have been closely monitoring the concern of green gas emissions, particularly CO2 emissions.
There are two primary approaches to investigating the relationship between economic and social variables and carbon dioxide emissions, as well as examining the validity of the Environmental Kuznets Curve hypothesis across various countries, first, based on cross-section analysis using panel data techniques, especially in exploring the nexus between economic growth and the environment. Mitic et al. (2023) [19] investigate the causality relationship between carbon emissions and economic growth, energy, and employment in eight Southeastern European countries during the period 1995 to 2019. The findings reveal that there is a long-run equilibrium relationship between CO2 emissions, GDP, and employment, as well as a bidirectional causality between economic growth and carbon emissions. Khan et al. (2020) [20] investigate the factors that contribute to the economic and environmental sustainability of the South Asian Association for Regional Cooperation (SAARC) from 2005 to 2017, utilizing the panel Autoregressive Distributed Lag (ARDL) method. The results indicate that incorporating environmental sustainability practices in business operations is positively associated with economic growth, whereas regulatory pressure shows an insignificant effect on economic growth. Ajide et al. (2021) [21] examine the effect of investments on carbon emissions in G20 economies from 1992 to 2014, employing exogenously and endogenously determined methods. The results indicate that fixed capital investments in the G9 advanced economies do not have a significant impact on carbon emissions. Meanwhile, the other G11 developing economies have a significant positive impact on carbon emissions. This implies that fixed capital investments pose environmental threats to developing economies compared with developed economies. Adeleye et al. (2021) [22] explore the impact of per capita income and energy on carbon emissions, utilizing panel data in 28 African countries from 1990 to 2019. The findings suggest that while both variables contribute to an increase in emissions, their combined interaction leads to a reduction in emissions. Dimitriadis et al. (2021) [23] examine the causal relationships between carbon dioxide emissions, economic growth, and both renewable and non-renewable energy consumption across a panel of 68 developing countries from 1990 to 2014, employing a multivariate panel and panel bootstrap cointegration tests. The findings indicate that there are dynamic linkages among variables. Espoir et al. (2023) [24] examine the effect of economic growth, renewable energy, urbanization, and governance on CO2 emissions across 47 African countries from 1996 to 2019, using the panel cointegration test and the Dumitrescu–Hurlin causality. The results validate the EKC hypothesis. Furthermore, renewable energy has a significant negative effect on CO2 emissions, and governance has a positive effect in the long run. Meanwhile in the short run, economic growth does not have a significant effect on emissions. In addition, there is a bidirectional relationship between CO2 emissions and all the explanatory variables.
Remarkably, the findings from previous studies employ panel data techniques and by analyzing a large number of countries show contradictory results, particularly in the verification of the Environmental Kuznets Curve hypothesis.
Therefore, the second approach focuses on the implications for individual countries instead of a group of countries. Many of these studies apply the Autoregressive Distributed Lag (ARDL) method, while some employ the Dynamic Autoregressive Distributed Lag (DARDL) approach. Raihan et al. (2022a) [25] examine the dynamic impacts of economic growth, energy use, urbanization, agricultural productivity, and forested area on carbon dioxide emissions in Kazakhstan over the period 1996 to 2020, utilizing the Autoregressive Distributed Lag (ARDL) model. The findings suggest a positive long-run relationship between economic growth, energy use, urbanization, and CO2 emissions. However, the increase in agricultural productivity and the expansion of forested areas contributed to a reduction in CO2 emissions. Dahmani et al. (2021) [18] examine the relationship between per capita GHG emissions, urbanization, energy consumption, innovation, and trade openness using the extended STIRPAT model and the Autoregressive Distributed Lag (ARDL) model in Tunisia spanning the period from 1990 to 2018. The results indicate that renewable energy contributes to a long-run decrease in greenhouse gas (GHG) emissions. Solarin et al. (2021) [26] investigate the impact of economic growth and urbanization on the ecological footprint (EFP) of Nigeria from 1977 to 2016, employing the Dynamic Autoregressive Distributed Lag (ARDL) model; the findings reveal that in the short run economic growth exhibits a detrimental effect on the environment, whereas it is associated with an improvement in environmental quality in the long run, Additionally, both FDI and trade contribute to ecological degradation. Raihan et al. (2022b) [27] investigate the impacts of economic growth, urbanization, renewable energy, tourism, industrialization, forest area, and agricultural productivity in Turkey from 1990 to 2020, employing the dynamic ordinary least squares method. The findings show that an increase in economic growth, urbanization, tourism, and industrialization increases carbon dioxide emissions, whereas a rise in renewable energy consumption, agricultural productivity, and forest areas lead to a reduction in carbon dioxide emissions. Orhan et al. (2021) [28] examine the relationship between CO2 emissions and economic growth in India, from 1965 to 2019, utilizing the Bayer and Hanck cointegration and gradual shift causality tests. The results reveal a unidirectional causality from energy consumption and economic growth to CO2 emissions. Begum et al. (2020) [6] investigate the dynamic effects of economic growth and deforested areas on carbon dioxide emissions in Malaysia from 1990 to 2016, employing the dynamic ordinary least squares (DOLS). The findings show that both economic growth and deforested areas have a negative impact on carbon emissions. Hossain et al. (2022) [29] examine the validity of the Environmental Kuznets Curve (EKC) hypothesis in India from 1980 to 2019, utilizing the Dynamic Autoregressive Distribution Lag (DARDL) method. The results support the validity of the Environmental Kuznets Curve (EKC) hypothesis in India. Shaheen et al. (2020) [30] investigate the impact of gross domestic product (GDP), energy consumption, and urbanization on carbon dioxide emissions in Pakistan spanning from 1972 to 2014, utilizing Autoregressive Distributed Lag (ARDL); the results indicate that energy consumption and GDP have a positive impact on CO2 emissions, while industrialization and urbanization are statistically insignificant. Bekhet and Othman (2017) [31] examines the relationship between carbon dioxide emissions, energy consumption, urbanization, GDP, financial development, and domestic investment in Malaysia from 1971 to 2015, employing the vector error correction model and Granger causality test. The results reveal that urbanization has a positive impact on CO2 emissions in the early stage while having a negative impact at advanced stages.
Yusuf (2023) [32] examines the validity of the Environmental Kuznets Curve hypothesis and the short and long run dynamic effects of socioeconomic factors on ecological sustainability in Nigeria from 1980 to 2020, employing the Autoregressive Distributed Lag (ARDL) method. The findings affirm the presence of the Environmental Kuznets Curve hypothesis for Nigeria in the short and long run.
Most studies based on time series data used the ARDL and the Johansen cointegration analysis methods which cannot separate the impact of each variable without the influence from other variables. Therefore, this study focuses on investigating the impact of GDP, energy consumption, urbanization, and trade openness, using both the traditional ARDL method and dynamically using the DARDL method developed by Jordan and Philips to extract the individual effect for each independent variable in the short and long run spanning more than four decades. Furthermore, this study contributes to filling the gap in empirical studies on the impact of eco-socio variables on carbon dioxide emissions in the UAE and helps policymakers to address the appropriate environmental protection policies in the short and long term.

3. Data and Methodology

The current study presents an empirical investigation of the dynamic impacts of economic growth, energy use, urbanization, and trade openness on carbon dioxide emissions (CO2) in the UAE. Studies have indicated that these variables are the most frequently used and most influential in analyzing the impact of economic factors on carbon dioxide emissions. This study employs the Dynamic Autoregression Distributed Lag (DARDL) method developed by Jordan and Philips (2018) [33] based on the novel ARDL method by Pesaran and Shin (1999) [34] and Pesaran et al. (2001) [35] from the period from 1975 to 2022. The explanatory variables data for gdpc and urbp are obtained from the World Bank, while ceng and CO2 are sourced from British Petroleum divided by the population number based on World Bank data, and trad is sourced from UNCTAD. Table 1 defines the data sources. Table 2 displays the variables’ statistical characteristics for time series data over more than four decades from 1975 to 2022, which allows for the detection of asymmetrical forms between variables. Furthermore, Figure 1 shows the trajectory of variables over time, which influences and shapes the model specifications.
The descriptive statistics in Table 2 reveal various features. Notably, the standard deviations highlight significant variation in dispersion across all variables, as depicted in Figure 1. Also, the skewness values mirror a non-normal distribution for all variables, indicating a normal positive skewness for all variables except the cneg variable which has a normal negative skewness. Additionally, the kurtosis values are shown to be below 3, referring to a leptokurtic distribution for all variables. Also, the Jarque–Bera values, which measure the difference between skewness and kurtosis, mirrors the fact that gdpc, urbp, and trad are normally distributed whereas the CO2 and ceng variables are non-normally distributed. Moreover, the skewness, kurtosis, and Jarque–Bera values for the residuals are normally distributed. These findings suggest that the model is stable and should include a constant. Also, applying the ARDL method using raw data is accurate instead of transforming the data to be logarithms where the data is in the form of percentiles. Furthermore, Table 3 shows that the independent variable CO2 has a strong correlation with the trad variable, where the coefficient has more than 90% moderate correction with both gdpc and urbp between 85% and 87%, and weak correction with ceng at 13%. Figure 2 exhibits the trends across all variables; it is noted that the trend in carbon dioxide emissions over the period is upward, while the trend in ceng shows an upward trajectory until 1990 and then a downward trend until 2022. All variables have relative fluctuations spanning the period from 1975 until 2022. Therefore, it is imperative to incorporate these independent variables into the suggested model. It also justifies the need to investigate the relationship between CO2 and explanatory variables in the short and long run.

4. Methodology

The Autoregressive Distributed Lag model (ARDL) proposed by Pesaran and Shin (1999) [34] and developed by Pesaran, Shin, and Smith (2001) [35] has been widely used in recent years in different fields of social sciences for estimating the relationships between various variables in both the short and long run [36,37,38,39,40,41]. It is recognized as one of the most versatile approaches in the econometric analysis of economic growth and energy nexus, particularly when the research framework is affected by shocks and unexpected changes (Menegaki 2019) [42].
The ARDL model is a form of unrestricted error correction model (ECM) without the condition that the variables must be at the same lag, as proposed by Engle and Granger (1987) [43], who suggested a method based on residual analysis. Johansen (1988) [44] introduced a maximum likelihood approach, which enables the estimation of numerous cointegrating vectors, and was expanded by Johansen and Juselius (1990) [45]. However, many research studies have found that these methods are not appropriate for small samples (Narayan and Smyth 2007) [46]. The main feature of the ARDL methodology is the possibility of testing cointegration among different integration orders of time series variables, stipulating that they are not higher than I(1), and that the dependent variable must be non-stationary and integrated at I(1). Also, the ARDL approach is more reliable when using small samples (i.e., 30–80 observations) (Sultanuzzaman et al. 2018) [47].
However, the implementation of the ARDL model suffers from complex structure dynamics specifications, including multiple lags and varying levels of differences. This makes it difficult to explicate the effects of short and long run changes in the explanatory variables on dependent variables (Jordan and Philips 2018) [33]; in addition, the Pesaran et al. (2001) [35] approach assumes that the impact of explanatory variables on dependent variables is symmetric in both the short and long run, whether they increase or decrease. However, the dependent variable may be more sensitive to the rise or bust of the explanatory variables. Therefore, the Nonlinear Autoregressive Lag (NARDL) method proposed by Shin, Yu, and Greenwood-Nimmo (2014) [48] overcomes this challenge by decomposing the effects of independent variables into positive and negative impacts on the dependent variables, allowing for the estimation of the potential asymmetric impacts of the relevant explanatory variables on the dependent variable. (Allen and McAleer 2021) [49], which leads to supplementing the knowledge that a policymaker needs to make clear and appropriate decisions by separating the asymmetric influences of independent variables on dependent variables. Another aspect of the ARDL method is that the estimation of individual change in one independent variable on a dependent variable while other variables remain equal is not available. Therefore, Jordan and Philip (2018) [33] introduced a novel time series model, DARDL, to address this challenge by applying alternative dynamic simulation techniques to a variety of ARDL models, including the error correction model. This enables one to forecast the effect of positive or negative change in one regressor on the dependent variable while maintaining all other variables as equal, relying on the substantive significance of results through meaningful counterfactual dynamic implementations rather than testing the hypothesis model coefficients through estimation, simulation, and prediction. This approach averts the spurious changes in the dependent variable brought about by a regressor (Jordan and Philips 2018) [33].
Therefore, the Dynamic Nonlinear Autoregressive Distributed Lag (DARDL) model appears more appropriate when investigating the nexus of various variables and environmental elements, providing policymakers precise insights into how the change in specific independent variable affects the dependent variable, while other variables are held constant.
Thus, the supposed econometric model can be depicted as follows:
C O 2 = β 0 + β 1 g d p c t + β 2 c e n g t + β 3 u r b p t + β 4   t r a d t + ɛ t
where β 1 , β 2 , β 3   , and β 4 signify the coefficients that represent the elasticity of the dependent variable, carbon dioxide emissions, to a 1% per capita change in GDP ( g d p c ), energy consumption ( c e n g ) , urbanization ( u r b p ) , and trade openness ( t r a d ), respectively. β 0 and ɛ t denote the constant and error term, respectively, and the observation period measured in years.
The time series regressors are not of an integration order higher than I(1), and the dependent variable is I(1) and not stationary at I(0). We can estimate the relationship between the variables in the short and long through an ARDL model in error correction form (Danish 2020) [50] as follows:
C O 2 t = α 0   +   β 1 C O 2 t 1   +   β 1 g d p c t 1   +   β 2 c e n g t 1   +   β 3 u r b p t 1   +   β 4 t r a d t 1   +   i = 1 n α 1 C O t i   +   i = 0 m 1 α 2 g d p c t i   +   i = 0 m 2 α 3 c e n g t i   +   i = 0 m 3 α 4 u r b p t i   +   i = 0 m 4 α 4 t r a d t i   +   ɛ t
where Δ represents the first difference, n and m denote the optimal lag length defined by the Akaike information criterion (AIC), and ɛ t represents the error term. The ARDL long run coefficients are β 1   β 2   β 3   β 4 , whereas α 1   α 2   α 3   α 4   are the short run coefficients.
The F-statistics, based on the ARDL bounds test by Pesaran et al. (2001) [35], test the variables’ long run equilibrium relationship, while the null hypothesis denotes no cointegration H 0 :   β 1 = β 2 + = β 3 = β 4 = 0 , against the alternative hypothesis H 1 :   β 1 , β 2 + β 3 β 3 = 0 , which indicates that there is a long run cointegration relationship among variables.
For estimating the error correction term, we start with the initial form of the ARDL method as an unrestricted form of the ECM, where the ARDL method replaces the long run term β 1 C O 2 t 1 + β 2 g d p c t 1 + β 3 c e n g t 1 + β 4 u r b p t 1 + β 4 t r a d t 1   by its residuals ( ψ E C T t 1   )
The lagged residuals series are presented as the following:
ψ E C T t 1   = C O 2 t 1 β 0 β 1 g d p c t 1 β 2 c e n g t 1 β 3 u r b p t 1 β 4   t r a d t 1
Therefore, the error correct term can be estimated by the following equation:
d C O 2 t = α 0   +   i = 1 m α 1 C O 2 t i   +   j = 0 n α 2 g d p c t j   +   k = 0 r α 3 c e n g t k   +   l = 0 q α 4 u r b p t l   +   r = 0 w α 5 t r a d t r   +   ψ E C T t 1   +   μ t  
where E C T t 1   represents the error correction term, while ψ is the speed of adjustment coefficient of the long run equilibrium, which must be negative and statistically significant to confirm the convergence towards equilibrium, otherwise, the model implies non-stationarity.
The current study satisfies both the requirements of cointegration among the variables and a first-order difference in the data series in order to apply the dynamic stimulated ARDL technique. Furthermore, the dynamic ARDL method uses up to 5000 simulations of the parameter vector utilizing a multivariate normal distribution [33,51]
Therefore, according to Jordan and Philips (2018) [33], the dynamic ARDL bounds equation is as follows:
C O t = α 0   +   θ 0 C O 2 t 1   +   β 1 g d p c t   +   θ 1 g d p c t 1   +   β 2 c e n g t   +   θ 2 c e n g t 1   +   β 3 u r b p t   + +   θ 3 u r b p t 1   +   β 4   t r a d t   +   θ 4 t r a d t 1   +   ɛ t
Dynamic simulations estimate the vector of parameters by presenting reliable counterfactual plots that convey the substantive significance of results instead of relying on testing the model coefficients (Jordan, 2018) [33]. In addition, this technique uses graphs to predict the responsiveness of carbon dioxide emissions to positive and negative changes in each independent variable, while keeping other regressors constant (Khan et al., 2020) [52].

5. Results and Discussion

Before proceeding with the DARDL model, it is necessary to conduct the unit root test to verify the stationarity of variables to identify their order of integration and avoid spurious regression. Followed by determining the optimal lag length value, subsequently, the ARDL bound test is employed to investigate the long run relationship among the variables comparing the results of those obtained from the DARDL model.

6. Unit Root Tests

The results of the unit root tests are presented in Table 4, utilizing two traditional unit root tests: the augmented Dickey–Fuller (ADF) and the Phillips and Perron (PP), assessed through the Akaike Information Criterion (AIC) with a constant to explore the order of variables integration. They strongly suggest that the null hypothesis cannot be rejected at this level, indicating that all variables are stationary in the first difference I(1) for both tests. This confirms that the novel dynamic ARDL model can be utilized.

7. Optimal Lag Length Criteria

Table 5 displays the optimal lag length structure based on five criteria: Akaike Information Criterion (AIC), sequential modified LR test statistics, final prediction error (FPE), Hannan and Quinn (1979) [53], and Yaniv and Schwartz (1991) [54]. The selection of lag length is important to avoid the serial correlation of the error correction term, utilizing the residuals of the VAR model (Bruns and Stern 2019) [55]. The best fitting lagged difference structure is selected and used to purge autocorrelation to ensure the residuals are white noise.
The optimal lag length identified through this process is p = 1 or 2; the results of the ARDL bounds test indicate that lag 2 is more accurate. However, these criteria often yield contradictory outcomes in empirical financial studies (Othman et al. 2019) [56]. Moreover, the AIC, SC, and HQ are prominent criteria for choosing the optimal lag for various time series data variables (Khan et al., 2020) [20].

8. Diagnostic Statistics Tests

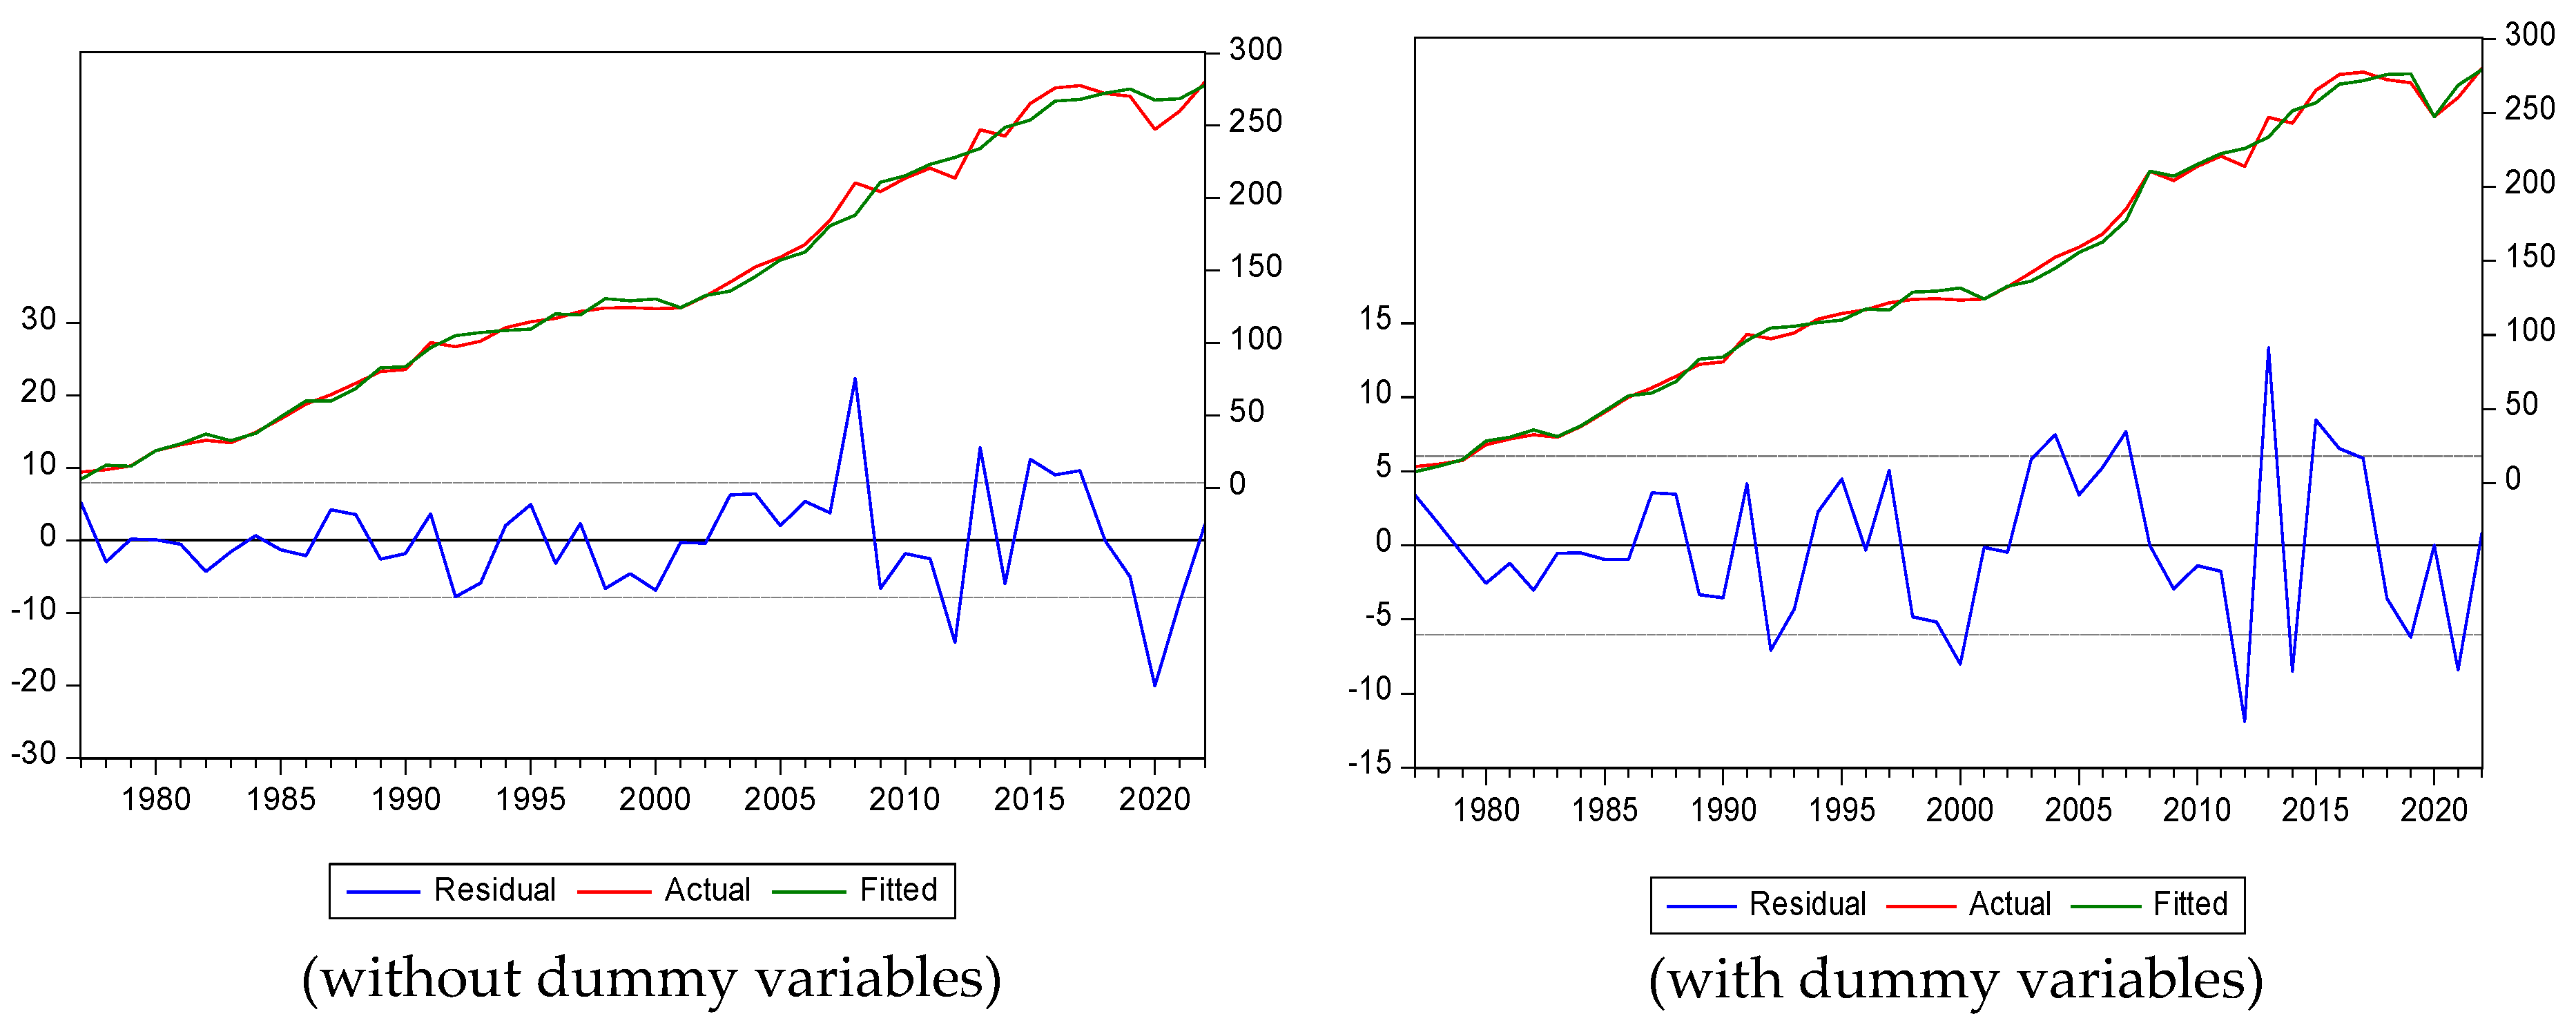
Table 6 shows the results of different diagnostic statistics tests, such as ARCH which regresses the squires’ residuals on lagged squared residuals and a constant, indicating there is no heteroscedasticity on the lagged residuals errors p = 2. The Breusch–Godfrey Serial Correlation LM test is greater than 0.05 significance levels which implies that the null hypothesis of no serial correlation cannot be rejected. Also, a general specification test for the linear regression model by the Ramsey RESET test verifies that the model is correctly specified. Additionally, the initial indication of Jarque–Bera shows that the residual’s distribution is abnormal, as depicted in Figure 2, with a Jarque–Bera value of 6.907927 and p = 0.031620. This suggests structural breaks in 2008, 2012, 2013, and 2020. Therefore, we conclude that dummy variables should be used for these years as fixed regressors in the equation to make the estimated residuals normally distributed.

9. ARDL Bounds Cointegration Test

The ARDL bounds test is conducted by Pesaran et al. (2001) [35] within the framework of an unrestricted ECM to explore the long run relationships between the variables, utilizing the results of the unit roots tests and the selection of lag length. Table 7 displays the results of the bounds test and F-statistic value compared with critical values and approximate p-values from Kripfganz and Schneider (2020) [57]. The results indicate that the calculated F-statistic value is 5.762560, greater than the critical values of the upper bounds I(1) at 1% significance level. These findings reject the null hypothesis, affirming the presence of long run cointegration between the variables.

10. ARDL and DARDL Estimation Results and Discussion

Table 8 displays that the error correction term E C T t 1 value is negative and statistically significant, indicating that the speed of adjustment to correct the divergence and convergence of the long run equilibrium relationship during the short term is 0.29 annually at 1% significance level.
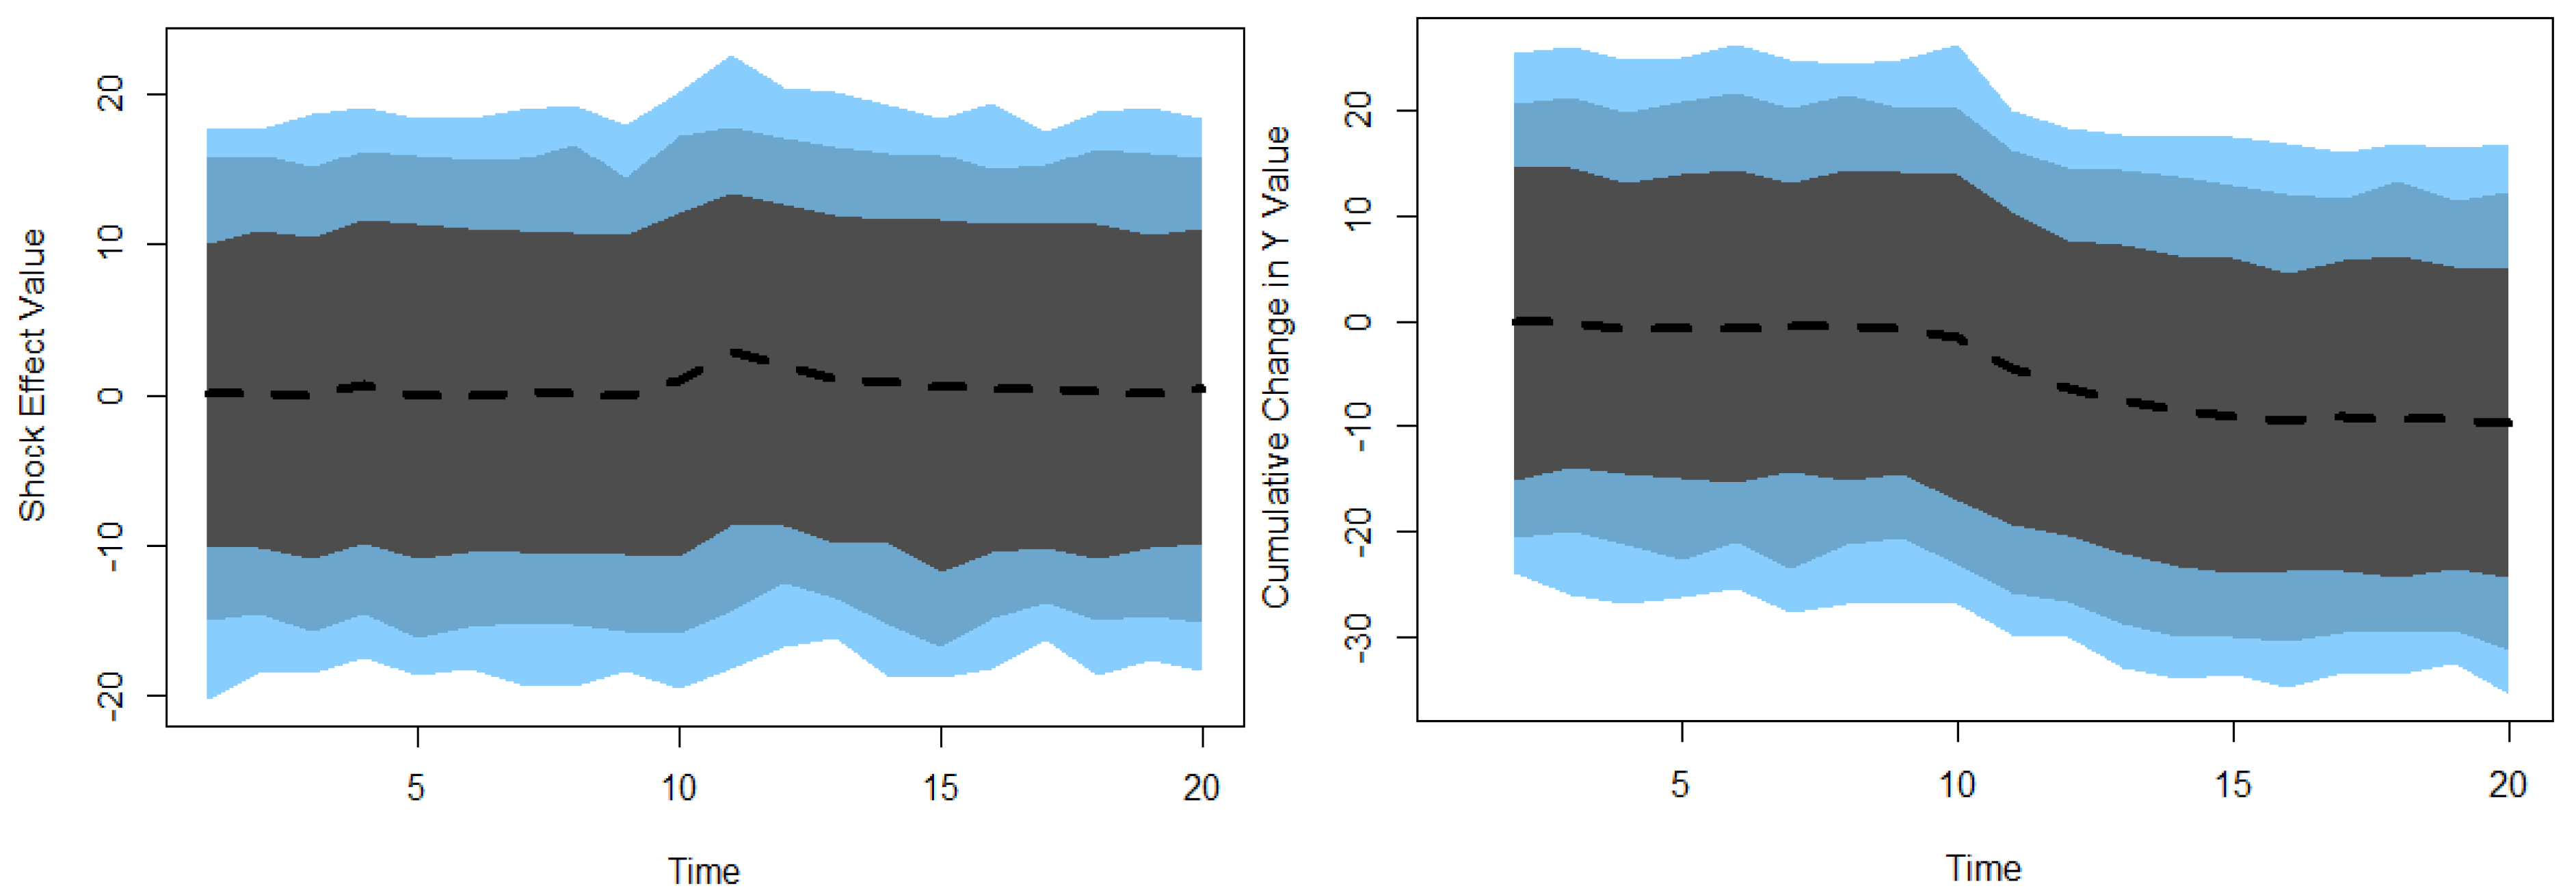
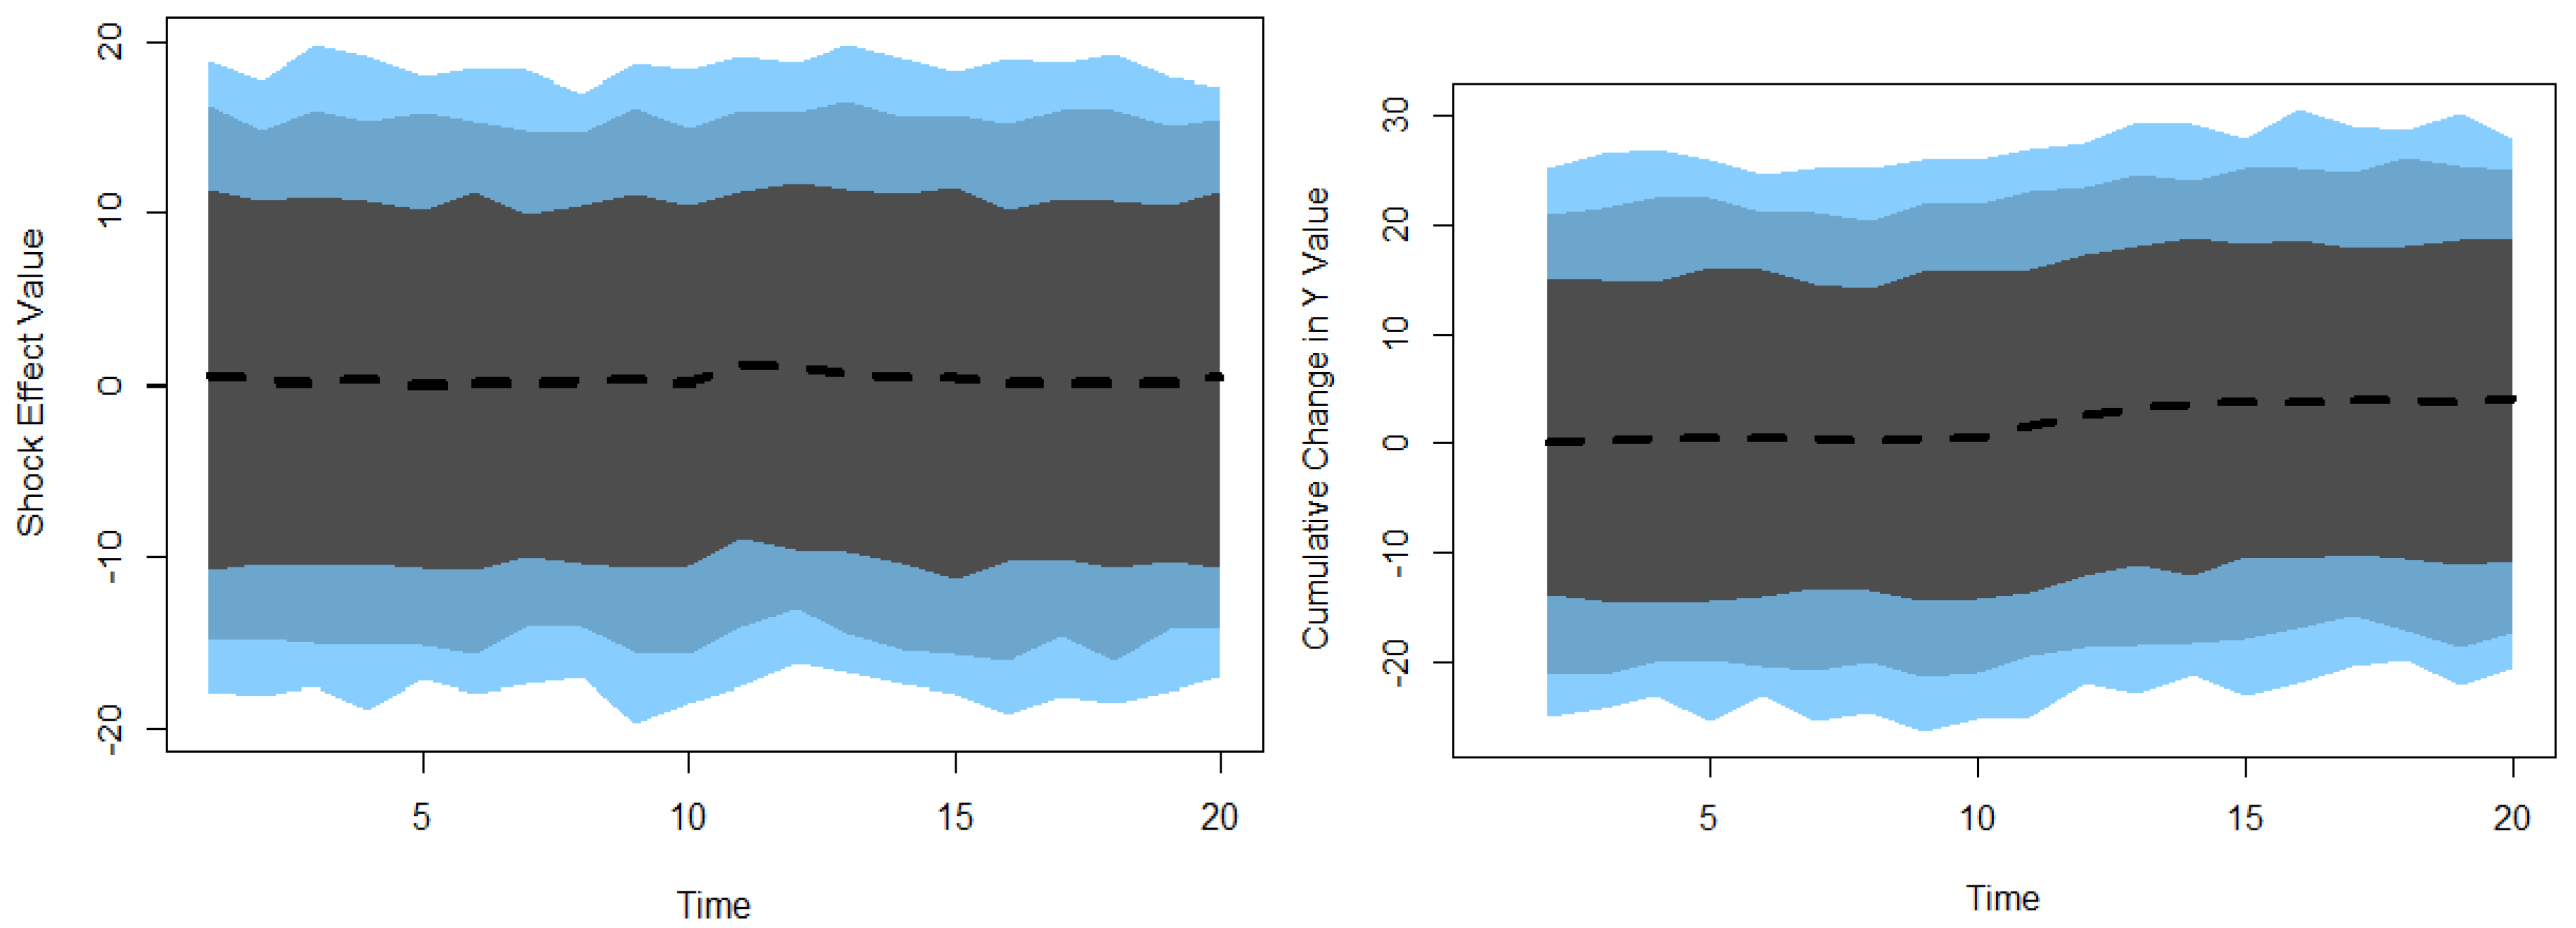
Figure 3, Figure 4, Figure 5 and Figure 6 display the results of the DARDL model, which confirm the findings in Table 8.
Figure 3, Figure 4, Figure 5 and Figure 6 depict the dynamic ARDL effects, which indicate that a shock by 1% standard deviation to the variable real GDP per capita (gdpc) does not affect CO2 in the short term until t = 5 and lag = 2. However, in the long term, the relationship is significantly negative, consistent with the long run cumulative effect of DARDL, where an increase in real GDP per capita leads to a decrease in carbon dioxide emissions by 0.6% at a 1% significance level. These findings are consistent with the Environmental Kuznets Curve when it slopes downward after reaching the turning point of environmental degradation and economic growth continues in most developed countries [58,59], indicating that the UAE is increasingly compatible with the improvement of the environment as real GDP per capita increases. Resulting from that, the UAE has achieved the second-highest average economic growth in the region since the country’s establishment in 1975 until 2022, following only Qatar. Additionally, the per capita income has reached an average of 62.100 USD and reached 53.700 USD in 2022, classifying the UAE as a high per capita income country. Also, the UAE has improved income inequality, placing the UAE among the ten countries with the lowest Gini coefficients in 2022 [14]. This may increase the demand for environmentally friendly goods for wealthier individuals, while decreasing the demand for lower-income groups to purchase less eco-friendly products. In addition, all governmental entities in the UAE take environmental considerations into account when planning and performing their projects in coordination with the Ministry of Climate Change and Environment. Also, the private sector is subject to environmental laws before obtaining the license to start a project. Furthermore, the federal regime allows each emirate to focus on the strict protection of the environment and have its own laws under the umbrella of the federal environmental law to ensure that all enterprises and individuals comply to protect the environment. This confirms the adoption of environmental protection and sustainable development of the UAE economy by applying strategic plans conducted by the government.
Furthermore, a shock by 1% standard deviation in energy consumption (ceng) does not have a statistically significant effect on CO2 emissions in the short term, when t ≤ 10 and lag = 2. This signifies that a small increase in energy consumption is not significant in the short run. CO2 emissions only increase in response to a new equilibrium prediction just above t = 10. The cumulative DARDL impact on CO2 is significantly positive, as a 1% increase in energy consumption (ceng) raises CO2 by 0.17% in the long run at a 1% significance level. Moreover, the UAE ranks within the top ten oil producers globally, where the contribution of the oil sector to GDP is 27.3% in 2022 [9]. This causes an increase in CO2 emissions from natural gas flaring associated with oil extraction, reaching 0.21 million tons per capita [60].
The UAE is reshaping its economy at a high speed through substantial investments in sustainable initiatives, such as energy efficiency, renewable energy, public transportation and eco-friendly vehicles, and green building development and eco-cities, Also, the UAE is encouraging industries to adopt greener production processes [61]. This may encourage most citizens and the richest expats to make intensive use of environmentally friendly goods. Meanwhile, the poorest expats tend to increase their demand for less environmentally friendly and cheaper goods to maximize their savings. This behavior could contribute to raising CO2 emissions. These findings are important for economic policymakers in the UAE to enhance individuals’ awareness of purchasing environmentally friendly products, as well as reduce the import of products that significantly contribute to carbon dioxide emissions.
The Dynamic ARDL findings indicate that a 1% standard deviation change in urbanization does not affect CO2 emissions in the short term, whereas, it has a significant positive impact on CO2 emissions in the long term; the interval takes 10 years. The cumulative effect displays a positive effect, where an increase in urbanization by 1% leads to an increase in CO2 emissions by 11.6% at 1% significance level. This influence highlights the detrimental effect of urbanization on CO2 emissions in the UAE and boosts the result of per capita energy consumption impact on carbon dioxide emissions, despite the wealthiest citizens and expats intensively using environmentally friendly goods and services. The results are concluded in recent studies on the urbanization–CO2 emissions nexus.
The UAE has adopted many projects in urban areas to protect the environment and reduce carbon emissions, especially in its two biggest emirates, the capital, Abu Dhabi, and Dubai, moving towards diversifying and greening its economy in sustainable initiatives under the UAE Vision 2021, such as the UAE Green Agenda 2030, which recovers 75% of municipal waste, and the National Climate Change Plan 2050, which comprises renewable energy and increasing eco-friendly public transportation vehicles by expanding the hybrid vehicle system in 2021, particularly, with public vehicles and electric charging stations aiming to cover 30% of all trips in Dubai by 2030. Dubai established a mandatory building code including energy, water, materials, and waste compliance standards. Furthermore, federal buildings have been built in compliance with the UAE Green Building specifications [13]. A large-scale renewable energy project for solar energy in Dubai has a capacity target to generate 5000 MW by 2030 and to generate about 3000 MW from three solar projects in Abu Dhabi. Moreover, Dubai is applying its Clean Energy Strategy 2050, which aims to reduce energy and water consumption by 20% to 30% by 2030, particularly through implementing green building standards, since buildings consume approximately 80% of electricity. In addition, Abu Dhabi operates public lighting specifications, resulting in a remarkable reduction in energy by 67% and a decrease in carbon emissions by 80% compared with current technologies. This leads to a significant increase in demand for green jobs related to energy efficiency, renewable energy, and other environmental fields [62]. Despite these huge government efforts, governmental environmental entities should increase the incentives for such programs to influence wealthy individuals’ behavior in the UAE.
Moreover, a shock of 1% standard deviation in the trade openness variable positively affects CO2 emissions at the 5% and 1% significance levels in the short and long term, respectively. The dynamic ARDL shows a small increase in the short run and a positive cumulative effect in the long run, where a 1% increase in trade openness leads to a rise in CO2 by 0.26% in the short run and a 1.2% increase in the long run. The harmful impact of trade openness on CO2 emissions in the UAE is consistent with many studies [63,64,65,66,67,68], but contrary to Wang and Zhang’s (2021) [69] findings, which applied to high- and middle-income countries. These results indicate that the government should encourage imports of environmentally friendly goods and make environmental restrictions on importing harmful goods, along with anti-environment foreign direct investment. The UAE is the most attractive country for FDI, hosting 4.5 billion USD in 2022, and must consider this matter seriously to avoid the case of many developing countries who opened their economies to anti-environment FDI after developed countries imposed environmental restrictions in the early 1970s (Al-Ayouty et al. 2017) [70]. Notably, the UAE is the fourth country worldwide hosting greenfield investments in new projects in 2022 [71].

11. Conclusions

Over the last decade, the United Arab Emirates has strived to control and reduce CO2 emissions, the major component of GHGs. The primary aim of this study is to provide policymakers with a clear depiction of economic determinants that influence economic activity and population behavior and ultimately lead to CO2 emissions in the UAE. This may facilitate determining the appropriate policies to reduce CO2 emissions. The present study empirically investigates the effects of per capita income, energy use, urbanization, and trade openness on CO2 emissions over the period 1975–2022, employing the dynamic ARDL approach by Jordan and Philips (2018) [33] to estimate the dynamic effect in the short and long run. This study also verifies the Environmental Kuznets Curve (EKC) hypothesis in the UAE.
The findings of this study, verified by the ARDL bounds test by Pesaran et al. (2001) [35], provide evidence of a strong long run equilibrium relationship among the variables at 1% statistical significance level, with the error correction term adjustment at a speed of −0.29 through the short run relationships.
The main findings from the dynamic ARDL reveal that shock by 1% standard deviation for real GDP per capita and energy consumption does not affect CO2 in the short run until t ≤ 5 and t ≤ 10, respectively. Moreover, there is no significant short run relationship between urbanization and CO2 emissions. In contrast, trade openness has a positive short run effect on CO2 emissions at the 5% significance level.
The long run cumulative effect by DARDL indicates a significant negative impact of real GDP per capita on CO2, consistent with long-term ARDL results, where a rise in real GDP per capita leads to a decrease in carbon dioxide emissions by 0.6% at the 1% significance level. The result supports the fact that the UAE economy is incompatible with the Environmental Kuznets Curve (EKC), which is valid after the occurrence of the turnaround point. This indicates that the UAE’s economy consistently protects the environment as real GDP per capita increases. As a result, the UAE’s economy has transformed from an oil-dependent economy to a diversified economy, where the oil sector’s contribution to gross domestic product decreased from 62% in 1985 to 27.3% in 2022. This is in addition to the environmental protection and renewable energy initiatives adopted by the UAE, such as the establishment of Masdar City, solar energy projects, and ambitious recycling programs.
Also, the UAE has improved income inequality and is located in the top ten countries with the lowest Gini coefficients. The per capita income is classified as high per capita income. This may increase the demand for environmentally friendly goods for citizens and wealthier expats. This finding underscores the importance for policymakers in the UAE to enhance the public awareness of purchasing environmentally friendly products, especially among lower-income expats and reduce the import of products that cause significant carbon dioxide emissions.
Furthermore, the UAE governmental agencies and private sector must comply with environmental laws before project licensing. Moreover, the federal regime allows each emirate to enforce its strict environmental laws under the federal framework to ensure that all enterprises and individuals comply to protect the environment.
The DARDL long run cumulative effect of per capita energy consumption (ceng) on CO2 indicates a significant positive impact, as an increase in energy consumption per capita (ceng) by 1% raises CO2 by 0.17% at the 1% significance level. This result is consistent with the positive effect captured in many recent empirical studies [22,72].
However, the per capita energy consumption of CO2 emissions is 0.21 million tons from natural gas flaring associated with oil extraction, where the UAE ranks among the top ten oil producers. Nevertheless, the UAE is rapidly transforming its economy through increasing investments toward sustainable initiatives, such as energy efficiency, renewable energy, public transportation, eco-friendly vehicles, green building development, and eco-cities, Also, the UAE is encouraging industries to adapt greener production processes.
The Dynamic ARDL findings indicate that urbanization has a significant positive impact on CO2 emissions in the long term; the cumulative effect takes 10 years. The ARDL results indicate that a rise in urbanization by 1% leads to an increase in CO2 emissions by 11.6% at the 1% significance level. This effect reveals the detrimental effect of urbanization on CO2 emissions in the UAE. It also supports the result of per capita energy consumption impact on CO2 emission. The results align with recent studies on the nexus between urbanization and CO2 emissions [73,74]. However, the UAE undertakes numerous projects in urban areas to protect the environment and reduce carbon dioxide emissions, as a part of a broad strategy to diversify and green its economy under the UAE Vision 2021, the UAE Green Agenda 2030, and the National Climate Change Plan 2050.
The Dynamic ARDL model shows that trade openness has a positive impact on CO2 emissions in the short and long run, where a 1% rise in trade openness leads to an increase in CO2 by 0.26% and 1.2% in the short and long run, respectively. These results are aligned with several studies (Ertugrul et al. 2016) [63]; Lv and Xu 2019 [64]; Cetin et al. 2018 [65]; Tran 2020 [66]; Udeagha and Ngepah 2022 [67]; and Chhabra et al. 2022 [68], while they contradict the findings of Wang and Zhang (2021) [69] in high- and middle-income countries.
The detrimental impact of trade openness on CO2 emissions in the UAE suggests that the government should stimulate importing environmentally friendly goods and services and impose restrictions on harmful ones. Additionally, there is a necessity to avoid the scenario faced by many developing countries that opened their economies to anti-environment foreign direct investment after developed countries implemented environmental restrictions.
These findings are crucial for environmental policymakers, as they provide guidance on how to reduce carbon emissions by addressing the influence of economic factors and promoting greater public awareness of emission reduction strategies.

Author Contributions

Conceptualization, H.A.A. and A.H.A.; methodology, H.A.A.; software, H.A.A., W.B.A., and A.H.A.; validation, H.A.A., W.B.A., and A.H.A.; formal analysis, H.A.A. and A.H.A.; investigation, H.A.A. and A.H.A.; resources, H.A.A., W.B.A., and A.H.A.; data curation, H.A.A.; writing—original draft preparation, H.A.A.; writing—review and editing, H.A.A., W.B.A., and A.H.A.; visualization, H.A.A.; supervision, H.A.A.; project administration, H.A.A.; funding acquisition, H.A.A., W.B.A., and A.H.A. All authors have read and approved the manuscript.

Funding

This research received no external funding.

Institutional Review Board Statement

Not applicable.

Informed Consent Statement

Not applicable.

Data Availability Statement

The datasets are available in the World Development indicators data of the World Bank, British Petroleum Statistics (2023), Solt (2023), and UNCTAD (2023). The data sources are presented in Table 1.

Conflicts of Interest

Author Ahmed Hatem Ali was employed by the company TAQA Industrialization and Energy Services. The remaining authors declare that the research was conducted in the absence of any commercial or financial relationships that could be construed as a potential conflict of interest.

References

  1. Olivier, J.G.J. Trends in Global CO2 and Total GHG Emissions. Trends in Global CO2 and Total Greenhouse Gas Emissions: 2021 Summary Report. PBL Netherlands Environmental Assessment Agency. 2022, pp. 1–72. Available online: https://www.pbl.nl/en/publications/trends-in-global-co2-and-total-greenhouse-gas-emissions-2021-summary-report (accessed on 3 May 2025).
  2. Intergovernmental Panel on Climate Change (IPCC). Climate Change 2023: Synthesis Report. Contribution of Working Groups I, II and III to the Sixth Assessment Report of the Intergovernmental Panel on Climate Change; Core Writing Team, Lee, H., Romero, J., Eds.; Intergovernmental Panel on Climate Change (IPCC): Geneva, Switzerland, 2023; pp. 35–115. [Google Scholar] [CrossRef]
  3. Jahanger, A.; Usman, M.; Ahmad, P. Investigating the effects of natural resources and institutional quality on CO2 emissions during globalization mode in developing countries. Int. J. Environ. Sci. Technol. 2022, 20, 9663–9682. [Google Scholar] [CrossRef]
  4. UNDP. China. Available online: https://www.undp.org/china/about-china-0 (accessed on 6 December 2023).
  5. International Monetary Fund (IMF) World Economic Outlook Database. 2023. Available online: https://www.imf.org/en/Publications/WEO/weo-database/2023/April/groups-and-aggregates (accessed on 5 January 2024).
  6. Begum, R.A.; Raihan, A.; Said, M.N.M. Dynamic Impacts of Economic Growth and Forested Area on Carbon Dioxide Emissions in Malaysia. Sustainability 2020, 12, 9375. [Google Scholar] [CrossRef]
  7. Raihan, A.; Said, M.N.M. Cost–Benefit Analysis of Climate Change Mitigation Measures in the Forestry Sector of Peninsular Malaysia. Earth Syst. Environ. 2022, 6, 405–419. [Google Scholar] [CrossRef]
  8. International Energy Agency (IEA). 2023. Available online: https://www.trade.gov/country-commercial-guides/united-arab-emirates-oil-and-gas (accessed on 22 March 2024).
  9. Federal Competition and Statistic Center (FCSC). Open Data. Available online: https://fcsc.gov.ae/ar-ae/Pages/Footer%20Links/Careers.aspx (accessed on 8 February 2024).
  10. UAE. Strategies and Visions. Official Portal. Available online: https://u.ae/en/about-the-uae/strategies-initiatives-and-awards/strategies-plans-and-visions (accessed on 11 February 2024).
  11. Ministry of Climate Change and Environment (MOCCAE). National Climate Change Plan of the United Arab Emirates 2017–2050. Available online: https://u.ae/en/about-the-uae/strategies-initiatives-and-awards/strategies-plans-and-visions/environment-and-energy/national-climate-change-plan-of-the-uae (accessed on 9 March 2024).
  12. International Energy Agency (IEA). Net Zero by 2050, A Roadmap for the Global Energy Sector 32-36. Available online: https://www.iea.org/reports/net-zero-by-2050 (accessed on 13 May 2024).
  13. Ministry of Climate Change and Environment (MOCCAE). Accelerating Action Towards a Green, Inclusive and Resilient Economy. pp. 1–69. Available online: https://www.moccae.gov.ae/ (accessed on 3 May 2025).
  14. World Bank. Data. Available online: https://data.worldbank.org/indicator/NY.GDP.PCAP.CD?locations=AE (accessed on 7 June 2024).
  15. International Energy Agency (IEA). Emissions from Oil and Gas Operations in Net Zero Transitions, a World Energy Outlook Special Report on the Oil and Gas Industry and COP28. pp. 1–33. Available online: https://www.iea.org/reports/emissions-from-oil-and-gas-operations-in-net-zero-transitions (accessed on 21 June 2024).
  16. Dinda, S. Environmental Kuznets Curve Hypothesis: A Survey. Ecol. Econ. 2004, 49, 431–455. [Google Scholar] [CrossRef]
  17. Hailemariam, A.; Dzhumashev, R.; Shahbaz, M. Carbon emissions, income inequality and economic development. Empir. Econ. 2020, 59, 1139–1159. [Google Scholar] [CrossRef]
  18. Dahmani, M.; Mabrouki, M.; Ragni, L. Decoupling Analysis of Greenhouse Gas Emissions from Economic Growth: A Case Study of Tunisia. Energies 2021, 14, 7550. [Google Scholar] [CrossRef]
  19. Mitic, P.; Fedajev, A.; Radulescu, M.; Rehman, A. The relationship between CO2 emissions, economic growth, available energy, and employment in SEE countries. Environ. Sci. Pollut. Res. 2023, 30, 16140–16155. [Google Scholar] [CrossRef]
  20. Khan, M.I.; Teng, J.Z.; Khan, M.K. The impact of macroeconomic and financial development on carbon dioxide emissions in Pakistan: Evidence with a novel dynamic simulated ARDL approach. Environ. Sci. Pollut. Res. 2020, 27, 39560–39571. [Google Scholar] [CrossRef]
  21. Ajide, K.B.; Ibrahim, R.L. Threshold effects of capital investments on carbon emissions in G20 economies. Environ. Sci. Pollut. Res. 2021, 28, 39052–39070. [Google Scholar] [CrossRef]
  22. Adeleye, B.N.; Osabohien, R.; Lawal, A.I.; Alwis, T.D. Energy use and the role of per capita income on carbon emissions in African countries. PLoS ONE 2021, 16, e0259488. [Google Scholar] [CrossRef]
  23. Dimitriadis, D.; Katrakilidis, C.; Karakotsios, A. Investigating the dynamic linkages among carbon dioxide emissions, economic growth, and renewable and non-renewable energy consumption: Evidence from developing countries. Environ. Sci. Pollut. Res. 2021, 28, 40917–40928. [Google Scholar] [CrossRef] [PubMed]
  24. Espoir, D.K.; Sunge, R.; Bannor, F. Exploring the dynamic effect of economic growth on carbon dioxide emissions in Africa: Evidence from panel PMG estimator. Environ. Sci. Pollut. Res. 2023, 30, 112959–112976. [Google Scholar] [CrossRef] [PubMed]
  25. Raihan, A.; Tuspekova, A. Dynamic impacts of economic growth, energy use, urbanization, agricultural productivity, and forested area on carbon emissions: New insights from Kazakhstan. World Dev. Sustain. 2022, 1, 100019. [Google Scholar] [CrossRef]
  26. Solarin, S.A.; Nathaniel, S.P.; Bekun, F.V.; Okunola, A.; Alhassan, A. Towards achieving environmental sustainability: Environmental quality versus economic growth in a developing economy on ecological footprint via dynamic simulations of ARDL. Environ. Sci. Pollut. Res. 2021, 28, 17942–17959. [Google Scholar] [CrossRef] [PubMed]
  27. Raihan, A.; Tuspekova, A. Dynamic impacts of economic growth, renewable energy use, urbanization, industrialization, tourism, agriculture, and forests on carbon emissions in Turkey. Carbon Res. 2022, 1, 20. [Google Scholar] [CrossRef]
  28. Orhan, A.; Adebayo, T.S.; Genc, S.Y.; Kirikkaleli, D. Investigating the Linkage between Economic Growth and Environmental Sustainability in India: Do Agriculture and Trade Openness Matter? Sustainability 2021, 13, 4753. [Google Scholar] [CrossRef]
  29. Hossain, M.E.; Soumen, R.E.J.; Sourav, M.; Saha, S.M.; Onwe, J.C.; Nwulu, N.; Bekun, V.B.; Taha, A. Can Energy Efficiency Help in Achieving Carbon-Neutrality Pledges? A Developing Country Perspective Using Dynamic ARDL Simulations. Sustainability 2021, 14, 7537. [Google Scholar] [CrossRef]
  30. Shaheen, A.; Jinyong, S.J.; Sadia, A.S.; Shafaq, S.A.; Muhammad, H.M. The Dynamic Linkage between Income, Energy Consumption, Urbanization and Carbon Emissions in Pakistan. Pol. J. Environ. Stud. 2020, 29, 267–276. [Google Scholar] [CrossRef] [PubMed]
  31. Bekhet, H.A.; Othman, N. Impact of Urbanization Growth on Malaysia CO2 Emissions: Evidence from the Dynamic Relationship. J. Clean. Prod. 2017, 154, 374–388. [Google Scholar] [CrossRef]
  32. Yusuf, A. Dynamic effects of energy consumption, economic growth, international trade and urbanization on environmental degradation in Nigeria. Energy Strategy Rev. 2023, 50, 101228. [Google Scholar] [CrossRef]
  33. Jordan, S.; Philips, A.Q. Cointegration testing and dynamic simulations of autoregressive distributed lag models. Stata J. 2018, 18, 902–923. [Google Scholar] [CrossRef]
  34. Pesaran, M.H.; Shin, Y. An Autoregressive Distributed Lag Modelling Approach to Cointegration Analysis. In Chapter 11 in Econometrics and Economic Theory in the 20th Century the Ragnar Frisch Centennial Symposium; Strom, S., Ed.; Cambridge University Press: Cambridge, UK, 1999; pp. 371–413. [Google Scholar] [CrossRef]
  35. Pesaran, M.H.; Shin, Y.; Smith, R.J. Bounds testing approaches the analysis of level relationships. J. Appl. Econom. 2001, 3, 289–326. [Google Scholar] [CrossRef]
  36. Ahmed, Y.N.; Delin, H. Current Situation of Egyptian Cotton: Econometrics Study Using ARDL Model. J. Agric. Sci. 2019, 11, 88–97. [Google Scholar] [CrossRef]
  37. Sarkodie, A.S.; Owusu, P.A. The relationship between carbon dioxide and agriculture in Ghana: A comparison of VECM and ARDL model. Environ. Sci. Pollut. Res. 2016, 23, 10968–10982. [Google Scholar] [CrossRef]
  38. Ali, S.; Zubair, M.; Hussain, S. The combined effect of climatic factors and technical advancement on yield of sugarcane by using ARDL approach: Evidence from Pakistan. Environ. Sci. Pollut. Res. 2021, 28, 39787–39804. [Google Scholar] [CrossRef]
  39. Voumik, L.C.; Ridwan, M. Impact of FDI, industrialization, and education on the environment in Argentina: ARDL approach. Heliyon 2023, 9, e12872. [Google Scholar] [CrossRef] [PubMed]
  40. Raj, P.; Kalluru, S.R. Does crime impede economic growth? An evidence from India. Cogent Soc. Sci. 2023, 9, 2196814. [Google Scholar] [CrossRef]
  41. Shaari, M.S.; Nasir, N.M.; Harun, N.H.; Muhsain, S.N.F.; Ridzuan, A.R. Exploring the Relationship between Tertiary Education and Child Maltreatment: An ARDL Analysis. J. Hum. Earth Future 2023, 4, 10–22. [Google Scholar] [CrossRef]
  42. Menegaki, A.N. The ARDL Method in the Energy-Growth Nexus Field; Best Implementation Strategies, economies. Economies 2019, 7, 105. [Google Scholar] [CrossRef]
  43. Engle, R.F.; Granger, C.W.J. Co-Integration and Error Correction: Representation, Estimation, and Testing. Econometrica 1987, 55, 251–276. [Google Scholar] [CrossRef]
  44. Johansen, S. Statistical analysis of cointegrating vectors. J. Econ. Dyn. Control 1988, 12, 231–254. [Google Scholar] [CrossRef]
  45. Johansen, S.; Juselius, K. Maximum likelihood estimation and inference on cointegration with applications to the demand for money. Oxf. Bull. Econ. Stat. 1990, 52, 169–210. [Google Scholar] [CrossRef]
  46. Narayan, P.K.; Smyth, R. Higher education, real income, and real investment in China: Evidence from granger causality tests. Educ. Econ. 2007, 14, 107–125. [Google Scholar] [CrossRef]
  47. Sultanuzzaman, M.R.; Hongzhong, F.; Akash, M.; Wang, B.; Shakij, U.S.M. The role of FDI inflows and export on economic growth in Sri Lanka: An ARDL approach. Cogent Econ. Financ. 2018, 6, 1518116. [Google Scholar] [CrossRef]
  48. Shin, Y.; Yu, B.; Greenwood-Nimmo, M. Modelling asymmetric cointegration and dynamic multipliers in a nonlinear ARDL framework. In Festschrift in Honor of Peter Schmid; Sickles, R.C., Horrace, W.C., Eds.; SSRN; Springer: New York, NY, USA, 2014; pp. 281–314. [Google Scholar] [CrossRef]
  49. Allen, D.E.; McAleer, M. A nonlinear autoregressive distributed lag (NARDL) analysis of the FTSE and S&P500 indexes. Risks 2021, 9, 195. [Google Scholar] [CrossRef]
  50. Danish; Ulucak, R. Linking biomass energy and CO2 emissions in China using dynamic Autoregressive-Distributed Lag simulations. J. Clean. Prod. 2020, 250, 119533. [Google Scholar] [CrossRef]
  51. Sarkodie, S.A.; Strezov, V.; Weldekidan, H.; Asamoah, E.F.; Owusu, P.A.; Doyi, I.N.Y. Environmental sustainability assessment using dynamic Autoregressive-Distributed Lag simulations—Nexus between greenhouse gas emissions, biomass energy, food and economic growth. Sci. Total Environ. 2019, 668, 318–332. [Google Scholar] [CrossRef]
  52. Khan, S.A.R.; Zhang, Y.Z.; Arshian, S.; Golpira, H. Determinants of economic growth and environmental sustainability in South Asian Association for Regional Cooperation: Evidence from panel ARDL. Environ. Sci. Pollut. Res. 2020, 27, 45675–45687. [Google Scholar] [CrossRef]
  53. Hannan, E.J.; Quinn, B.G. The determination of the order of an autoregression. J. R. Stat. Soc. Ser. B 1979, 2, 190–195. [Google Scholar] [CrossRef]
  54. Yaniv, O.; Schwartz, B. Criterion for loop stability in MIMO feedback systems having an uncertain plant. Int. J. Control 1991, 3, 527–539. [Google Scholar] [CrossRef]
  55. Bruns, S.B.; Stern, D.I. Lag length selection and p-hacking in Granger causality testing: Prevalence and performance of meta-regression models. Empir. Econ. 2019, 56, 797–830. [Google Scholar] [CrossRef]
  56. Othman, A.H.A.; Syed, M.A.; Razali, H.; Azman, B.M.N. The Future of the Banking System under the Dominance and Development of the Cryptocurrency Industry: Empirical Evidence from Cointegration Analysis. J. Wealth Manag. 2019, 2, 109–127. [Google Scholar] [CrossRef]
  57. Kripfganz, S.; Schneider, D.C. Response surface regressions for critical value bounds and approximate p-values in equilibrium correction models. Oxf. Bull. Econ. Stat. 2020, 82, 1456–1481. [Google Scholar] [CrossRef]
  58. Canm, M.; Gozgor, G. Dynamic Relationships Among CO2 Emissions, Energy Consumption. Economic Growth, and Economic Complexity in France. In Energy Consumption, Economic Growth, and Economic Complexity in France; SSRN; University Library of Munich: Munich, Germany, 2016; pp. 1–21. [Google Scholar] [CrossRef]
  59. Leal, P.H.; Marques, A.C. The evolution of the environmental Kuznets curve hypothesis assessment: A literature review under a critical analysis perspective. Heliyon 2022, 8, e11521. [Google Scholar] [CrossRef]
  60. British Petroleum. Data. Available online: https://www.bp.com/en/global/corporate/energy-economics.html (accessed on 21 July 2024).
  61. Ministry of Climate Change and Environment (MOCCAE). Annual Report 2019/2020. Available online: https://www.moccae.gov.ae/en/knowledge-and-statistics/green-economy.aspx (accessed on 25 July 2024).
  62. Ministry of Climate Change and Environment (MOCCAE). UAE Green Jobs Program: Jobs and Skills for the UAE’s Green Economy Transformation. Available online: https://worldgreeneconomy.org/greenjobs.pdf (accessed on 20 August 2024).
  63. Ertugrul, H.M.; Cetin, M.; Seker, F.; Dogan, E. The impact of trade openness on global carbon dioxide emissions: Evidence from the top ten emitters among developing countries. Ecol. Indic. 2016, 67, 543–555. [Google Scholar] [CrossRef]
  64. Lv, Z.; Xu, T. Trade openness, urbanization, and CO2 emissions: Dynamic panel data analysis of middle-income countries. J. Int. Trade Econ. Dev. 2019, 28, 317–330. [Google Scholar] [CrossRef]
  65. Cetin, M.; Ecevit, E.; Yucel, A.G. The impact of economic growth, energy consumption, trade openness, and financial development on carbon emissions: Empirical evidence from Turkey. Environ. Sci. Pollut. Res. 2018, 25, 36589–36603. [Google Scholar] [CrossRef]
  66. Tran, V.N. The environmental effects of trade openness in developing countries: Conflict or cooperation? Environ. Sci. Pollut. Res. 2020, 27, 19783–19797. [Google Scholar] [CrossRef]
  67. Udeagha, M.C.; Ngepah, N. Does trade openness mitigate the environmental degradation in South Africa? Environ. Sci. Pollut. Res. 2022, 29, 19352–19377. [Google Scholar] [CrossRef]
  68. Chhabra, M.; Giri, A.K.; Kumar, A. Do trade openness and institutional quality contribute to carbon emission reduction? Evidence from BRICS countries. Environ. Sci. Pollut. Res. 2023, 30, 50986–51002. [Google Scholar] [CrossRef]
  69. Wang, Q.; Zhang, F. The effects of trade openness on decoupling carbon emissions from economic growth—Evidence from 182 countries. J. Clean. Prod. 2021, 279, 123838. [Google Scholar] [CrossRef] [PubMed]
  70. Al-Ayouty, I.; Hassaballa, H.; Rizk, R. Clean manufacturing industries and environmental quality: The case of Egypt. Environ. Dev. 2017, 21, 19–25. [Google Scholar] [CrossRef]
  71. UNCTAD. World Investment Report. Available online: https://unctad.org/system/files/official-document/wir2023_en.pdf (accessed on 7 August 2024).
  72. Gillani, S.; Sultana, B. Empirical Relationship between Economic Growth, Energy Consumption and CO2 Emissions: Evidence from ASEAN Countries. iRASD J. Energy Environ. 2020, 1, 83–93. [Google Scholar] [CrossRef]
  73. Sufyanullah, K.; Arshad, K.; Sufyan, A.M.A. Does emission of carbon dioxide is impacted by urbanization? An empirical study of urbanization, energy consumption, economic growth and carbon emissions—Using ARDL bound testing approach. Energy Policy 2022, 164, 112908. [Google Scholar] [CrossRef]
  74. Ullah, A.; Munir, S.; Badshah, S.L.; Khan, N.; Ghani, L.; Poulson, B.G.; Emwas, A.H.; Jaremko, M. Important Flavonoids and Their Role as a Therapeutic Agent. Molecules 2020, 25, 5243. [Google Scholar] [CrossRef]
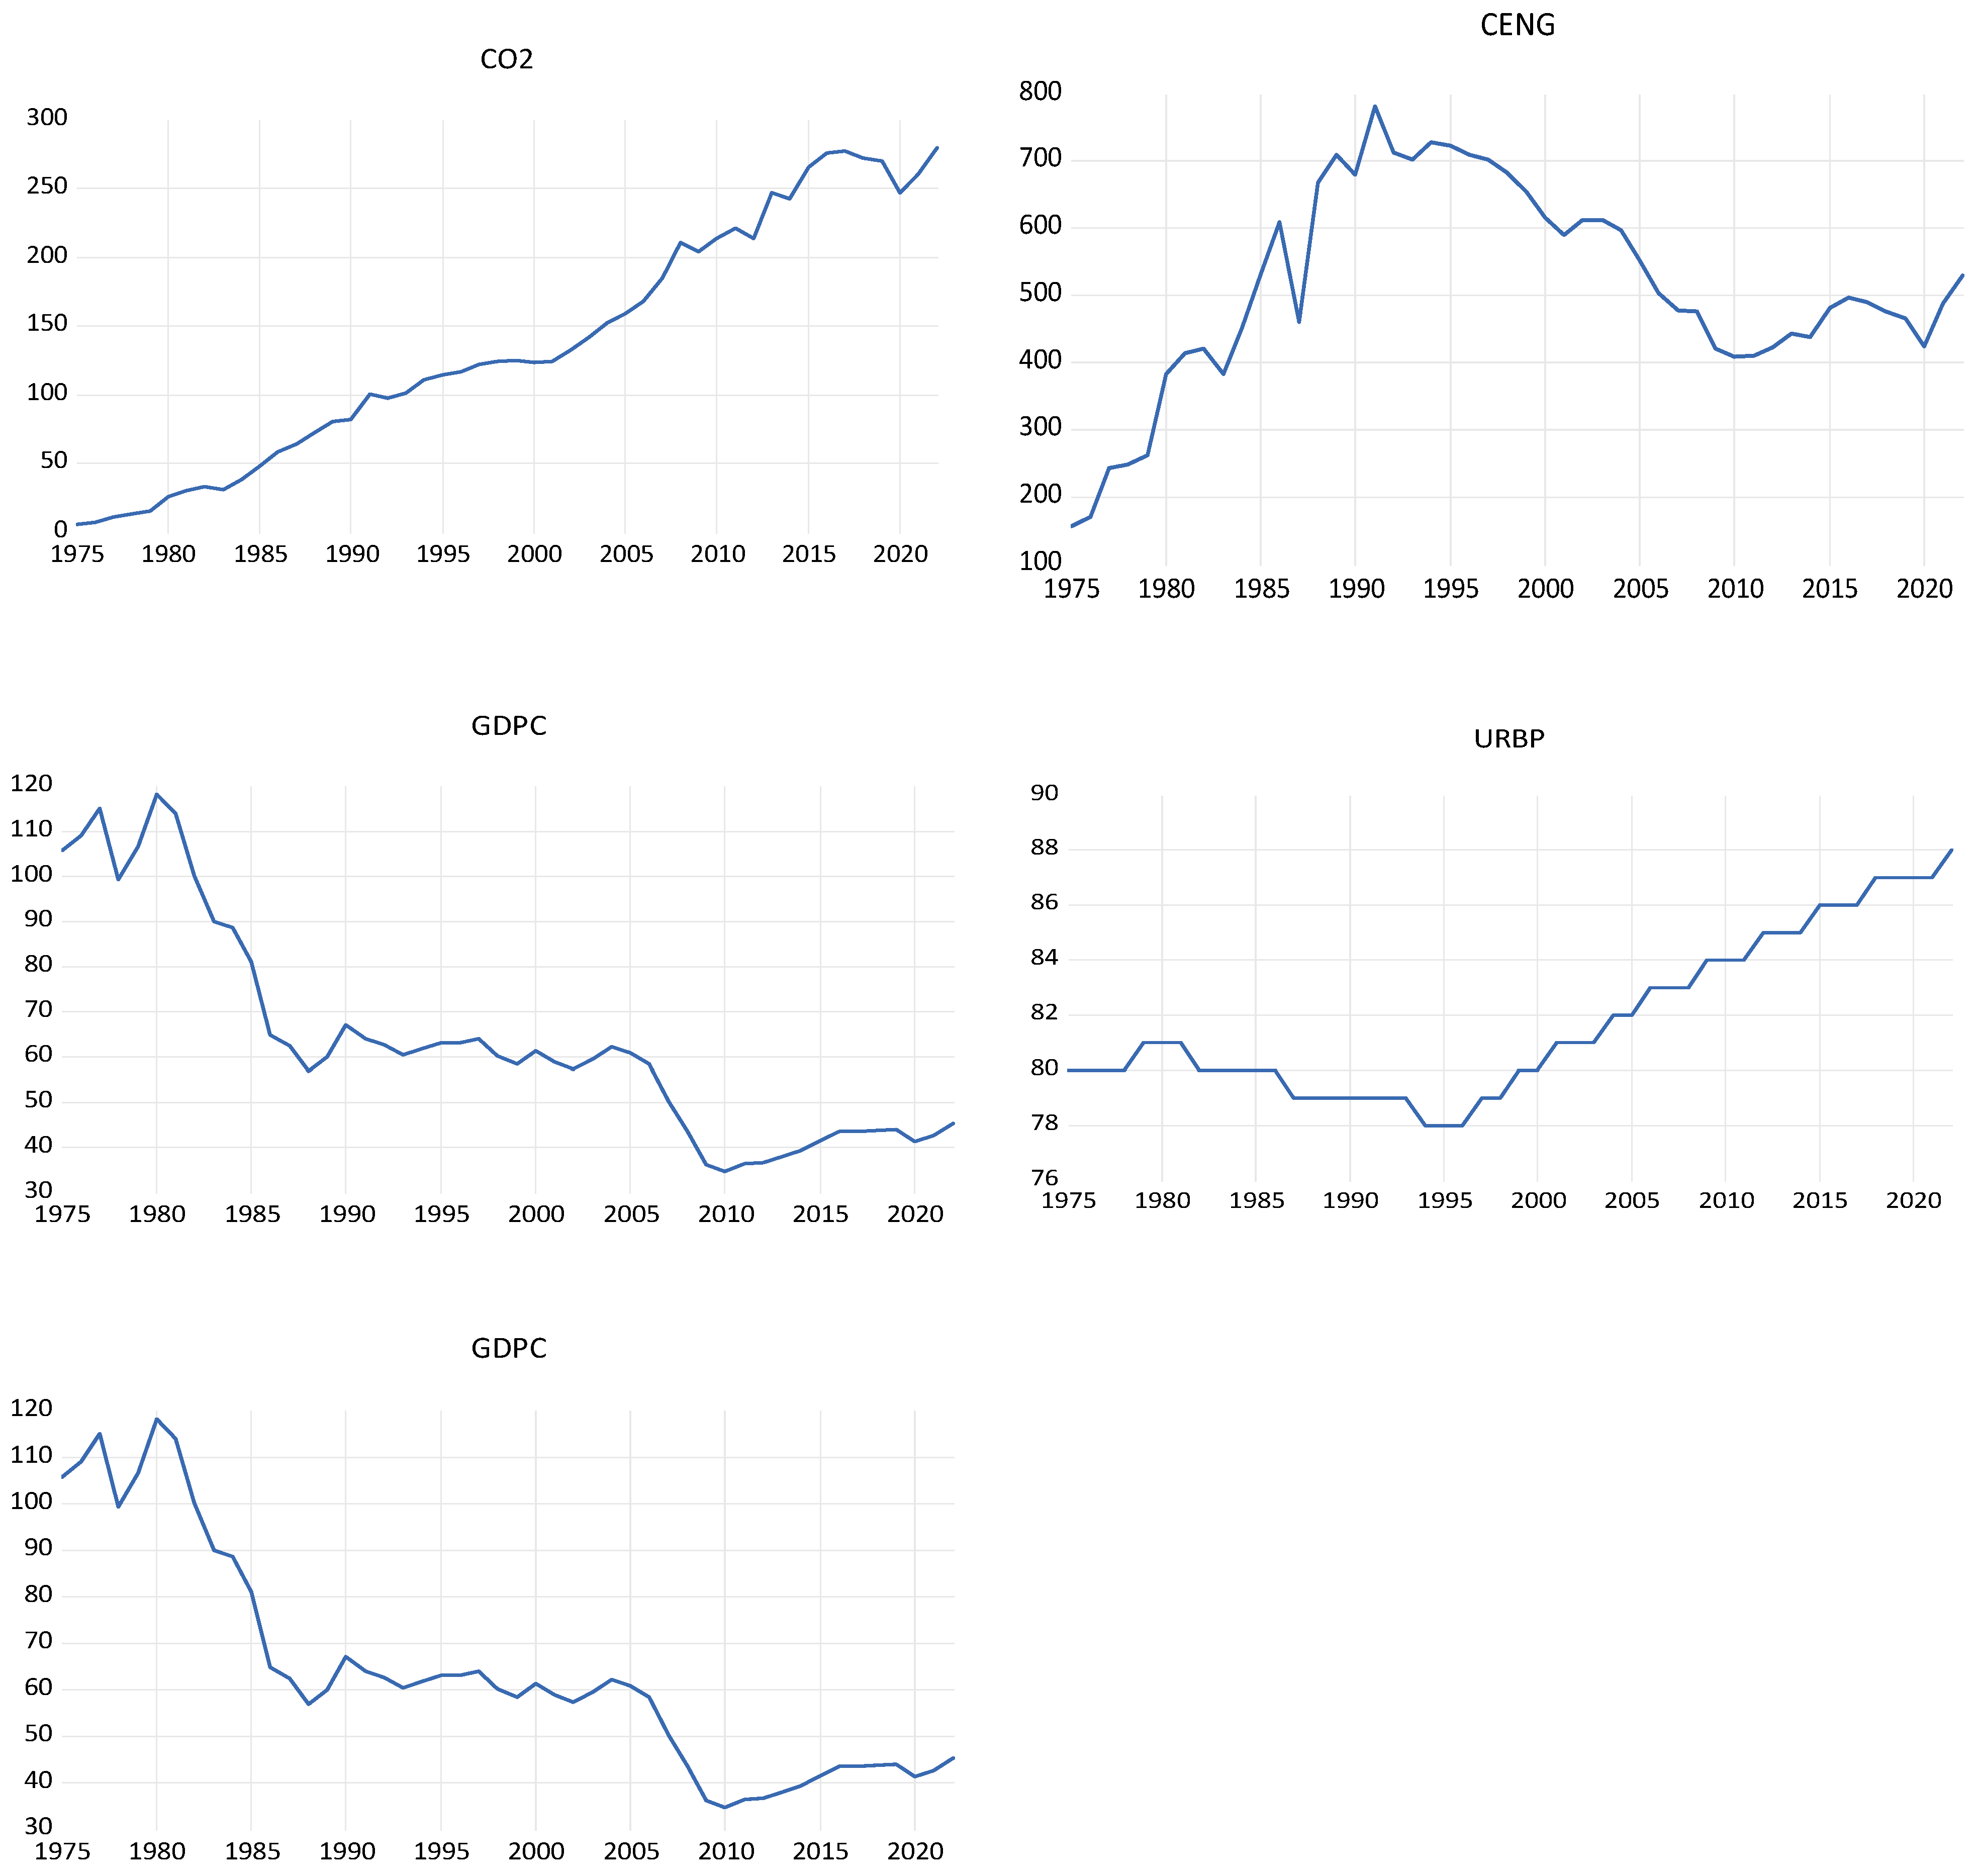
Figure 1. Time path evolution of the series.
Sustainability 17 05823 g001
Figure 2. Jarque–Bera residual’s distribution.
Sustainability 17 05823 g002
Figure 3. Real GDP per capita. The effects of a 1% increase in predicted GDP per capita on CO2 in the UAE and the cumulative impact on CO2 emissions. The dashed line indicates the average expected values. The shaded area from darkest to lightest shows 75%, 90%, and 95% confidence intervals.
Sustainability 17 05823 g003
Figure 4. Energy consumption per capita. The effects of a 1% increase in predicted energy consumption per capita on CO2 in the UAE and the cumulative impact on CO2 emissions. The dashed line indicates the average expected values. The shaded area from darkest to lightest shows 75%, 90%, and 95% confidence intervals.
Sustainability 17 05823 g004
Figure 5. Urbanization. The effects of a 1% increase in predicted urbanization on CO2 in the UAE and the cumulative impact on CO2 emissions. The dashed line indicates the average expected values. The shaded area from darkest to lightest shows 75%, 90%, and 95% confidence intervals.
Sustainability 17 05823 g005
Figure 6. Trade openness. The effects of a 1% increase in predicted trade openness on CO2 in the UAE and the cumulative impact on CO2 emissions. The dashed line indicates the average expected values. The shaded area from darkest to lightest shows 75%, 90%, and 95% confidence intervals.
Sustainability 17 05823 g006
Table 1. Variables description and data sources.
VariablesDefinitionSources
gdpcGross Domestic Product per capita (100 = 2015) in US $(World Bank, 2023) https://data.worldbank.org/indicator/NY.GDP.PCAP.PP.KD?locations = AE (accessed on 7 April 2024)
urbpUrban population (% of total population)(World Bank, 2023) https://data.worldbank.org/indicator/SP.URB.TOTL.IN.ZS?locations=AE (accessed on 7 April 2024)
tradTrade openness (total trade of merchandise and services of exports and imports % of GDP)(UNCTAD, 2023) https://unctadstat.unctad.org/wds/TableViewer/tableView.aspx (accessed on 9 April 2024)
cengEnergy consumption per capita(British Petroleum, 2023) https://www.bp.com/en/global/corporate/energy-economics.html (accessed on 15 April 2024)
CO2Carbon dioxide emissions per capita (Million tons/population)https://www.bp.com/en/global/corporate/energy-economics/statistical-review-of-world-energy.html (accessed on 22 May 2024)
https://data.worldbank.org/indicator/SP.POP.TOTL?locations=AE (accessed on 22 May 2024)
Table 2. Descriptive statistics.
CO2CENGGDPCURBPTRADResiduals
Mean135.7125512.893763.9977181.77083101.86041.622213
Median123.8500489.250060.2500081.0000085.050001.010533
Maximum280.0000782.1000118.100088.00000187.80003,632,316
Minimum5.300000156.700034.5000078.0000050.30000−3,070,813
Std. Dev.88.50509151.686423.782092.92632641.0913113.52234
Skewness0.196419−0.3391550.9215560.6557820.5550250.033518
Kurtosis1.7894432.6663302.8023662.1069921.8966423.461036
Jarque–Bera3.2395391.1428806.8722485.0353224.8992220.434096
Probability0.1979440.5647120.0321890.0806480.0863270.804891
Sum6514.20024,618.903071.8903925.0004889.300
Sum Sq. Dev.368,158.11,081,41226,582.62402.479279,359.29
Observations4848484848
Table 3. Matrix of correlations.
CO2CENGGDPCTRADURBP
CO21.000000
CENG0.1287221.000000
GDPC−0.873793−0.4104601.000000
TRAD0.948409−0.092684−0.7485441.000000
URBP0.846007−0.333429−0.5587120.9103571.000000
Table 4. Unit root test results.
Name of VariablesADFPP
Level—Intercept
CO2−0.000799−0.051173
gdpc−1.946174−1.604992
ceng−2.476056−2.480298
urbp1.1967831.395271
trad1.1114510.997145
First difference—Intercept
CO2−7.453174 ***−7.451163 ***
gdpc−5.381963 ***−5.328618 ***
ceng−7.765042 ***−7.694939 ***
urbp−7.147115 ***−7.202300 ***
trad−5.505809 ***−5.479583 ***
Note: (i) The unit root tests’ critical values, with intercepts at 1% and 5% significance levels, are -3.5811 and -2.9266 for both the augmented Dickey–Fuller (ADF) and Phillips–Perron (PP) tests. ( i i ) *** indicates statistical significance at 1. The VAR model refers lags up to p = 9.
Table 5. Optimal lag length.
LagLogLLRFPEAICSCHQ
0−900.3810NA5.13331141.1536841.3564341.22887
1−687.1708368.27229971581332.5986733.81517 *33.04981 *
2−656.328546.26340 *80025633 *32.3331134.5633533.16019
3−632.553930.258599541685932.3888135.6328033.59184
4−603.502430.372041.02e+0832.20465 *36.4623833.78362
Table by authors. Note: * indicates the optimal lag order selected by the criterion; LR, FPE, AIC, SC, and HQ information criteria. The findings indicate that the optimal lag length is (p = 1 or 2).
Table 6. Diagnostics tests.
Test(F Value)(p Value)
Breusch–Godfrey Serial Correlation LM test0.8205680.4487No serial coloration
ARCH Heteroscedasticity test0.2631960.7699No heteroscedasticity
Ramsey RESET test2.5774430.0907The model is specified correctly
Jarque–Bera normality test3.5444640.169953Estimated residuals are normally distributed
Table by authors. Note: H0: p-value > 0.05 for both, heteroscedasticity, autocorrelation, and model specification.
Table 7. Cointegration bound test.
Calculated ValuesKripfganz and Schneider (2020) Critical Values
F-statistic
9.9088794
10%5%1%
I(0)I(1)I (0)I(1)I(0)I(1)
2.4023.3452.8503.9053.8925.173
2.3723.3202.8233.8723.8455.150
2.2003.0902.5603.4903.2904.370
Source: authors’ calculation. Note: I(0) and I(1) are stationary and non-stationary bounds, respectively.
Table 8. ARDL estimation results.
Short and Long Run ARDL Cointegration Estimation Coefficients
E C T t 1 −0.292210 (0.0000) ***
[−8.258111]
c−971.5859 (0.0007) ***
[-3.737654]
gdpct−1−0.623702 (0.0285) **
[−2.288064]
cengt−10.168313 (0.0001) ***
[4.304784]
urbpt−111.63541(0.0010) ***
[3.597406]
tradt−11.241712 (0.0000) ***
[4.922813]
D(trad)0.265802 (0.0400) **
[2.136070]
D_200822.07872 (0.0009) ***
[3.646860]
D_2012−14.54701 (0.0186) ***
[−2.471032]
D_201320.09106 (0.0019) ***
[3.362280]
D_2020−24.57638 (0.0002) ***
[−4.179439]
Table by authors. Note: ** and *** indicate statistical significance at the 5% and 1% levels, t-statistics are in parentheses, p values are included in square brackets.
Disclaimer/Publisher’s Note: The statements, opinions and data contained in all publications are solely those of the individual author(s) and contributor(s) and not of MDPI and/or the editor(s). MDPI and/or the editor(s) disclaim responsibility for any injury to people or property resulting from any ideas, methods, instructions or products referred to in the content.