Review

Reactive Filtration Water Treatment: A Retrospective Review of Sustainable Sand Filtration Re-Engineered for Advanced Nutrient Removal and Recovery, Micropollutant Destructive Removal, and Net-Negative CO2e Emissions with Biochar

1
Department of Mechanical and Industrial Engineering, University of Wisconsin-Platteville, Platteville, WI 53818, USA
2
Department of Soil and Water Systems, University of Idaho, Moscow, ID 83844, USA
3
Department of Chemical and Biological Engineering, University of Idaho, Moscow, ID 83844, USA
*
Author to whom correspondence should be addressed.
Sustainability 2025, 17(13), 5799; https://doi.org/10.3390/su17135799
Submission received: 24 April 2025 / Revised: 12 June 2025 / Accepted: 17 June 2025 / Published: 24 June 2025
(This article belongs to the Special Issue Sustainable Development and Application of Biochar)

Abstract

A core tertiary wastewater reactive filtration technology, where continuously renewed hydrous ferric oxide coated sand is created in an upflow continuous backwash filter, has been adopted in about 100 water resource recovery facilities in several countries. Primarily focused on ultralow phosphorus discharge requirements to address nutrient pollution impacts and harmful algae blooms, the technology has also demonstrated the capacity to address high-efficiency removals of Hg, As, Zn, N, and other pollutants of concern, in addition to water quality needs met by common sand filtration, including total suspended solids. Recent work has demonstrated the capability of an additive iron–ozone catalytic oxidation process to the core reactive filtration technology platform to address micropollutants such as pharmaceuticals. Most recently, direct injection of frangible biochar into the reactive sand filter bed as a consumable reagent demonstrates a novel biochar water treatment technology in a platform that yields dose-dependent carbon negativity. In this work, the reactive filtration technology performance is reviewed from field pilot-scale to full-scale installation scenarios for nutrient removal and recovery applications. We also review the potential of the technology for nutrient recovery with the addition of biochar and micropollutant destructive removal with catalytic oxidation. Research exploration of this reactive filtration technology includes life cycle assessment (LCA) and techno-economic assessment to evaluate the environmental and economic impacts of this advanced water treatment technology. A recent LCA study of a pilot-scale field research and full-scale municipal system with over 2200 inventory elements shows a dose-dependent carbon negativity when biochar is injected into the process stream of reactive filtration. In this study, LCA demonstrates that reactive filtration has the potential as a negative emissions technology with −1.21 kg CO2e/m3, where the negative contribution from the dosed biochar is −1.53 kg CO2e/m3. In this biochar water treatment configuration, the system not only effectively removes pollutants from wastewater but also contributes to carbon sequestration and nutrient recovery for agriculture, making it a potentially valuable approach for sustainable water treatment.

Graphical Abstract

1. Introduction

In this review, we explore a novel reactive filtration platform for water treatment that attempts to address concerns regarding sustainable water resources, nutrient recovery for agriculture, and climate change mitigation through biochar carbon sequestration. The United Nations Sustainable Development Goals (UN SDGs) outlined the need for developing accelerated and innovative solutions to address the global challenges that humans and the planet face in creating a sustainable and equitable future [1]. SDG 6, Clean Water and Sanitation, aims to ensure the accessibility and availability of safe drinking water for all. This involves developing novel solutions to improve water quality, to increase water use efficiency, and to protect and restore water-related ecosystems. SDG 13, Climate Action, aims to take immediate and impactful actions to address climate change and its effects. This includes finding solutions for greenhouse gas emission reduction and increased climate resilience and adaptation measures. SDG 2, Zero Hunger, aims to stop hunger and malnutrition, achieve food security, and advance sustainable agriculture. SDG 12, Responsible Consumption and Production includes efforts to reduce waste and focus attention on life cycle and overall sustainability in personal, industrial, corporate and community practice. These SDGs motivate researchers to develop innovative technologies to address global challenges for future intergenerational needs. For example, a recent review paper concludes that nutrient-polluted water is broadly related to 16 of the 17 SDGs [2]. However, many of the SDGs, such as the ones described here, are difficult to address since they are complex, multi-disciplinary, and interconnected problems [3]. Thus, there is a new need and urgency in bringing cross-cutting applied science solutions to address complex interdisciplinary global challenges to help achieve a more sustainable and equitable future for all.
Freshwater availability is vital as it is one of the essential resources used for food production, manufacturing, energy generation, and recreation [4]. However, freshwater accessibility becomes a challenge as the increased demand for freshwater far exceeds its production and supply due to global climate change, rapid urbanization, and increasing population. This is exacerbated by pollution of water resources coming from both point and non-point sources, including industrial and municipal wastewater and urban and agricultural run-offs. Some of these run-offs may contain phosphorus (P) and nitrogen (N), where excess amounts of these elements in water can promote the accelerated growth of harmful algal blooms (HABs), thereby depleting freshwater sources and destroying marine ecosystems [5]. Thus, nutrient recycling from polluted waters presents an opportunity for researchers to develop water treatment technologies and to address the global challenges presented by UN SDGs [6].
Phosphorus, a finite resource whose use as a fertilizer is essential for food security, is being mined and depleted globally. Data from the U.S. Geological Survey show that the mining of phosphate rock in five states in the U.S. produced 21 million tons of marketable products in 2022 [7]. Globally, 3.0 million metric tons of P end up in wastewater annually [8]. The ongoing conflict between Russia and Ukraine, and the accompanying sanctions, have disrupted the global energy supply and thus affected fertilizer production costs due to increased energy costs [9]. Furthermore, these political and economic conflicts have increased risks to our nutrient supply and future food security. Hence, it is important to utilize recovery of P from waste streams throughout both the food production and consumption system [10]. This would allow us to close our phosphorus use–reuse cycle, to secure our food sources, and to improve overall sustainability. Major efforts and initiatives are being explored to recycle P from wastewaters such as in the European Sustainable Phosphorus Platform [11] and the United States Phosphorus Initiative [12].
Different technologies have been developed for removing and recovering P to address P sustainability and food security. Excellent reviews of these technologies are provided by several researchers [13,14,15,16,17]. These reviews showed diverse technological approaches to removing P, which can be broadly classified as physical, chemical, and biological. A few of these methods are briefly summarized and covered here.
In physical removal technologies, P can be removed based on size such as sand filtration and membrane filtration. For example, Wathugala et al. [18] used sand filtration with Phragmites australis to remove nitrogen, phosphorus, and COD. Yildiz [19] used fly ash in a crossflow microfiltration membrane unit to remove phosphate ions. Erickson et al. [20] used enhanced sand filtration with steel wool, calcareous sand, or limestone to remove dissolved phosphorus from storm water runoff. Leo et al. [21] used commercial nanofiltration membranes to treat phosphorus-rich wastewater solutions.
With the chemical removal of P, different approaches can also be used such as precipitation, flocculation, or adsorption methods. Precipitation techniques use metal salts to react with dissolved P, which produces insoluble precipitates [17]. For example, Clark et al. [22] used iron (II) sulfate heptahydrate solution on top of an aerated filter to remove P. In flocculation, metals or organic polymers are used to destabilize colloidal particles to produce aggregates. As an example, Ngo and Guo [23] developed a modified green bio flocculant for membrane fouling control and enhanced phosphorus removal in a conventional aerated submerged membrane bioreactor to treat wastewater. Lastly, adsorption utilizes a surface removal reaction on a solid material [13]. Adsorption has been reported for achieving low concentrations of ortho-phosphorus (OP); studies have shown this method consistently reaching OP removal of 0.01–0.1 mg/L [24,25,26]. However, one of the limitations of using adsorption as a technology is its ability to only remove primarily dissolved P.
Biological removal technologies involve P uptake by plants and microorganisms. A biological approach promotes P removal without the need for chemical precipitants. The enhanced biological phosphorus removal (EBPR) is accomplished through the activated sludge process by recirculating sludge through anaerobic and aerobic conditions [27]. Other biological P removal uses microalgal biofilms [28], halophytic plants [29], and polyphosphate-accumulating organisms [30]. Oehmen et al. [30] and Nielsen et al. [31] provide excellent overviews in this area of EBPR.
Other methods of P removal include struvite precipitation, which is a crystalline compound composed of Mg2+, NH4+, and PO43− (MgHN4PO4·6H2O) in equal molar amounts [32,33] that can target the removal and recovery of NH4+ or PO43− from wastewater [34,35,36,37]. Struvite precipitation occurs when ammonium, magnesium, and phosphate concentrations exceed the struvite saturation level [38]. Although effective at recovering P and N, wastewater treatment with struvite precipitation has its own challenges such as in continuous flow treatment processes and meeting the low-level requirements for discharge. Despite these challenges, struvite precipitation is still an attractive method for P removal and recovery, and details of the advances in this technology along with its environmental impacts are provided in review papers by several researchers [39,40,41].
Another possible approach to remove P from wastewater is to combine several methods to achieve the desired P effluent concentration. Kim et al. [42] used a hybrid adsorbent/membrane system dosed with alum and/or aluminum-based adsorbent, which reduced the OP to 0.25 mg/L in hybrid configuration. Mitchell and Ullman [43] used a combination of chemical precipitation and a series of sand filtration and ultra-filtration units to reduce their effluent P to 0.015 mg/L. Newcombe et al. [44] used reactive filtration, where iron salt solutions are injected to produce hydrous iron oxide-coated sand in a moving bed sand filter reactor, and produced an average P effluent of 0.011 mg/L. Other researchers have investigated the potential of biochar (BC) for removing P in wastewater as well as producing nutrient-enriched BC for soil amendment [45,46,47,48,49].
Hydrous ferric oxide reactive filtration (HFO-RF or RF) has been developed and refined over the past two decades by the research team at the University of Idaho (UI). The technology has been installed at water resource and recovery facilities (WRRFs) on three continents, including in South Korea as part of their countrywide Four Major Rivers Project for water quality [50]. The ongoing research on RF has enabled it to be used in different configurations such as RF with and without BC (i.e., Fe-BC-RF), with and without catalytic ozonation (i.e., Fe-CatOx-RF), and in a current full process configuration (i.e., Fe-CatOx-BC-RF). These configurations allow the water treatment process to be capable of nutrient removal and recovery as well as micropollutant destruction. The technology has produced several patents and publications on its water treatment process studies [44,47,51,52,53,54,55,56,57,58,59], along with its life cycle assessment (LCA) and techno-economic analysis (TEA) studies [53,60,61]. The overarching goal of this technology development is to use RF as a multi-operation platform and use BC to aid in P removal and recovery for wastewater treatment and agricultural drainage treatment while producing a product that has value as a recycled nutrient. Therefore, this paper’s objective is to conduct a review and analysis of reactive filtration (RF) used by our research team for tertiary wastewater treatment processes. This review paper will focus on (1) process performance in pilot- to large-scale water treatment, (2) emerging capabilities related to RF addressing phosphorus removal and recovery and micropollutant removal, and (3) a biochar-integrated technology modification for carbon-negative operations of reactive filtration explored in pilot-scale field trials and by LCA. This review is important to assess the progression of RF as a multi-functional platform. Furthermore, this also allows the community of researchers to recognize gaps and limitations in decades-long research on the re-engineering of sand filtration. Lastly, this review assists analysis to define a future direction of the related research to utilize BC for different applications such as agricultural, municipal, and food water treatment. This review demonstrates the value of LCA and TEA studies and how they can be refined, and the potential role of assessment of the socio-economic impact of the technology as an evolving tool to explore the viability of water treatment technologies.

2. Processes and Mechanisms of Reactive Filtration

2.1. Reactive Filtration (RF)

The general Fe-CatOx-BC-RF process diagram is shown in Figure 1, which outlines the overall process components. Full details of the reactive filtration process have been provided elsewhere [53,55,56,59]. For brevity in an explanation of the background, the general process operation is briefly described in this manuscript.
Influent water (Figure 1, element 1) is screened as it enters the mixing tank (Figure 1, element 2). Iron chloride (FeCl3) is mixed with the influent water as it enters the moving bed sand filter (Figure 1, element 3). In the sand filter, an airlift assembly continuously moves the sand particles into a washbox. The addition of FeCl3 produces highly reactive hydrous ferric oxide (HFO) coatings on the sand particles [44,51,52], which in turn adsorb P moieties. The motion of the sand through the counter-current sand bed and washbox removes the HFO coating and contaminants in the fluid through a reject assembly in the washbox. This process is repeated in the second sand filter (Figure 1, element 4a) and treated as serial RF. The reject streams (Figure 1, element 5b) return upstream to the plant’s primary/secondary treatment, with the effect of lowering the average contaminant concentration of secondary effluent water entering the tertiary reactive filtration process [55,56]. A few studies using this general process configuration have been conducted in laboratory-, pilot-, and full-scale scenarios, in select locations in USA and UK. Note that the overall process can incorporate catalytic oxidation by adding ozone (O3) and nutrient recovery by adding biochar. Furthermore, each trial conducted would have different RF system conditions, such as dosing rates and contact time, depending on the specific targets of the field test and the unique make-up of the water to be treated. The readers are referred to Baker et al. [53] for these specific details. In general, the operating parameters for pilot-scale field studies require adoption of dose rates, reaction times, and process flows developed from initial engineering studies and on-site process optimization trials that can create operations experience that is applied to maximize the information gained. This is a limitation in costly field study equipment mobilizations, often performed with ten metric tons of technology, where a full day of high flow testing is the minimum requirement for a single flow and dose data set.

2.2. RF with Catalytic Oxidation (Fe-CatOx-RF)

Reactive filtration with catalytic oxidation is one of the configurations of the technology to provide catalytic oxidation processes (i.e., CatOx) in treating water. Water treatment with CatOx is an advanced oxidation process (AOP) that uses metal salt reagent with ozone to generate reactive oxidants. Adding ozone enables CatOx destructive removal of micropollutants by generating reactive oxidants such as hydroxyl radical (●OH) and peroxyl radical (ROO●). These reactive oxidants play a role in advanced water treatment as they are nonselective in oxidizing and decomposing numerous hazardous compounds to oxidized metabolites or CO2 and inorganic ions [62,63,64,65]. In this approach, CatOx produces the hydroxyl radical by an ozone-based decomposition reaction that is initiated by Fe2+ in the bulk solution. These reaction pathways can be seen as [53,66,67]
F e I I I O H + O 3 F e I I I O 3 + O H
F e I I I + O 3 + O H F e I I + · O O H + O 2
F e I I I + O 3 + H 2 O F e I I I + O H + · O H + O 2
The formation of the hydroxyl radical with CatOx provides destructive removal of organic toxicants, pesticides, hormones, and pharmaceuticals in the wastewater. A few studies have been conducted with Fe-CatOx-RF configuration, such as in Moscow and Sandpoint in Idaho, USA, and Horwich, UK.

2.3. RF with Biochar (Fe-BC-RF)

Biochar can also be added to the RF system for pollutant removal and nutrient recovery capabilities. Adding BC provides another approach to treat wastewater as metal salts may not sufficiently remove micropollutants to desired levels [53]. Furthermore, an Fe-modified BC can provide a reactive substrate for P adsorption [57] to produce a nutrient-enriched biochar, which can be utilized as a soil amendment [45,46]. Studies with this soil amendment have shown increased plant productivity by 16% [68] and P availability factor of 4.6 [69] when BC is used as a soil amendment. Biochar can help improve the quality of soil by improving soil indicators such as organic matter content, trace element content, pH levels, and soil homogeneity [70]. Others have shown that BC can facilitate long-term carbon capture sequestration as it can persist in soils for several hundred years, thereby reducing the global warming potential of water treatment processes [53,71,72,73,74]. Thus, adding native or chemically modified BC in water treatment processes provides a unique position for RF in pollutant removal and nutrient recovery, in promoting plant growth and soil health enhancement, and in soil amendment production cost reduction. Biochar added in the RF process configuration can be seen as the red box in Figure 1. We have conducted reactive filtration with biochar studies in the laboratory and pilot studies at municipal WRRFs in the cities of Moscow, Troy, and Sandpoint in Idaho, USA.
Different biochar materials were used in the pilot-scale studies. In the Moscow, ID and Troy, ID pilot trials, a commercial coconut shell biochar product (Cool Planet biochar, National Carbon Technologies, Oakdale, MN, USA) was used. In the Sandpoint trials, Blacklite Pure pine biochar (Pacific Biochar, Santa Rosa, CA, USA) was used. A municipal biosolid biochar was also used (OurCarbon, Bioforcetech Corporation, Redwood City, CA, USA) in the Sandpoint trials. As research progressed, iron modifications were conducted on the biochar to increase its sorption capacity prior to the Sandpoint trials. Studies have shown that biochar modification with Fe increases its sorption capacity, which makes it an effective substrate for adsorptive P removal from wastewater [75].
Supporting work by Strawn et al. [57], shown in Figure 2, on biochar application in reactive filtration explains that phosphate sorption on biochar and activated carbon is initially high at low concentrations but decreases as concentration increases. The Freundlich isotherm model fits the data for Biochar Now (BN) biochar and activated carbon (AC), while the Langmuir model fits better for anaerobic digester (AD) biochar. Iron modification significantly enhances P sorption in BN biochar and AC but reduces it in anaerobic digester biochar due to blocking of amine functional groups. The paper also notes that sorption isotherms are useful for predicting sorbate concentrations but not for interpreting mechanistic processes.

2.4. RF for Mercury and Arsenic Removal

Arsenic (As) exposure is critical to monitor and remove in drinking water due to its carcinogenic potential and chronic As poisoning risk [76]. The United States Environmental Protection Agency (USEPA) decreased the drinking water standard from 50 to 10 μg/L to protect public health from As exposure [77]. On the other hand, mercury (Hg) contamination in the environment can pose a risk to human and ecological health. The ionic Hg or mercury(II) that occurs in the environment can be transformed into methylmercury (MeHg) by sulfate-reducing bacteria and other anaerobic bacteria in aquatic sediments, which is then accumulated in aquatic food webs and consumed by fish [78]. Humans and wildlife are at risk of exposure to toxic MeHg through fish consumption, which can impair reproduction and fetal development. USEPA has set the standard to 2 μg/L for drinking water [79] and 2–3 servings a week from fish low in mercury [80]. Thus, there is a need for cost-effective and efficient removal of As and Hg from drinking and surface waters.
Reactive filtration has been used to remove As and Hg in water. This is because RF combines three processes (e.g., filtration, adsorption, and co-precipitation) that are effective in removing As and Hg from wastewater. In a co-precipitation process, for example, a reagent such as ferric chloride is added to the influent, and As is then adsorbed by precipitated iron oxyhydroxide particles [52]. Fluidized bed reactors can facilitate the precipitation of iron (III) as a sand coating [81], and the iron-coated sand can adsorb As, effectively removing it from drinking water and wastewaters [82,83]. Similarly, Hg can be removed through filtration, adsorption, and chemical precipitation [84,85]. Mechanistically, the Hg-HFO reactive pathway modeling of surface complexation and surface precipitation can be shown as [86]
≡Fes/wOH0 + Hg2+ → ≡ Fes/wOHg+ + H+,
≡Fes/wOH0 + Hg2+ + H2O → ≡ Fes/wOH+ + ≡ Hgs/wOH2+ + H+
where s = major solid and w = dissolved solid. Surface complexation constants for (4) are Ks = 7.76 and Kw = 6.45, while surface complexation constants for (5) are KspFe = 2.5 and KwspHg = 3.88 [86]. Beutel et al. [58] used RF to remove Hg at four study sites (two pilot and two large-scale installations), with mean removal efficiencies from 53 to 97%, targeting maximum removal or regulatory permit levels, and the U.S. Great Lakes Initiative ultralow limit level of 1.3 ng/L. Newcombe et al. [52] used RF to adsorb As through an adsorption and coprecipitation process, which yielded a mean removal of 91.8% below the U.S. drinking water standard of 0.010 mg/L total arsenic.

2.5. RF for Denitrification

Wastewater treatment from WRRFs often has effluent discharge limits for nutrients such as total nitrogen. If discharge limits require nitrate to be removed, denitrifying the wastewater can be used to reduce the nitrate to nitrogen gas. Denitrification can reduce the total nitrogen as well as reduce suspended solids in the effluent. Hence, reducing the nitrogen compounds from effluent wastewater can help mitigate the HABs. For this to happen, ammonia in the wastewater needs to be oxidized to nitrite, and from nitrite to nitrate through nitrification. Denitrification, on the other hand, is a process in which facultative anaerobes reduce nitrates to gaseous nitrogen [87]. Some of these anaerobes are fungi, which can flourish in anoxic conditions because they break down oxygen-containing compounds (e.g., NO3) to obtain oxygen. Nitrogen can exist in several forms once introduced in an aquatic environment; these are dissolved nitrogen gas (N2), ammonia (NH4+ and NH3), nitrite (NO2), nitrate (NO3), and organic nitrogen as proteinaceous matter or in dissolved or particulate phases. The reaction pathway steps can be shown as [88]
6   NO 3 + 2   CH 3 OH   6   NO 2 + 2   CO 2 + 4   H 2 O ,
6   NO 2 + 3   CH 3 OH   3   N 2 + 3   CO 2 + 3   H 2 O + 6   OH
6   NO 3 + 5   CH 3 OH   5   CO 2 + 3   N 2 + 7   H 2 O + 6   OH
Studies have shown that nitrification/denitrification can enhance the effluent quality to meet stringent total nitrogen requirements. For example, Chan et al. [89] studied the impact of continuous backwash nitrifying sand filters as a tertiary treatment stage for ten sewage treatment works. These filters were chosen due to their advantages, such as compactness and simplicity of operation. Their work showed 3–6 mg/L NH3-N discharge content for a flow rate of 2.1–118 L/s. Lee et al. [90] reported a removal capacity of 3.4 g NH4-N m−3h−1 using pilot-scale biological rapid sand filters under varying influent ammonium concentrations. Moore [91] reported average ammonia effluent limits of 1.4 mg/L for summer and 2.9 mg/L for winter, using recirculating media filters for 36 publicly owned systems in Missouri, USA. Koopman et al. [92] evaluated a pilot-scale moving bed up-flow sand filter with methanol for influent NO2 + NO3N concentrations of up to 22 g/m3. Their work yielded an effluent of NO2 + NO3N ≤ 1.0 g/m3 at daily loadings of up to 2.7 kg/m3.
Reactive filtration with a carbon microbial energy source is capable of denitrification of wastewater. In RF, organic carbon compounds can be added to the wastewater pathway as feedstock to promote microbial denitrification and to aid the removal of nitrogen compounds from the wastewater within the reactor bed. Organic carbon compounds can be alcohol, a saccharide, a cellulose derivative, methanol, ethanol, ethylene glycol, glycerol, acetate, glycerin, glucose, galactose, maltose, fructose, hydroxyethyl cellulose, hydroxypropyl cellulose, or carboxymethyl cellulose [56]. In the commercial sector, Nexom’s Blue Nite® uses a continuous backwash up-flow sand filter to denitrify wastewaters with nitrate removal of <1 mg/L [93]. This can also be coupled with their Blue PRO® reactive filtration technology to provide additional nutrient removal [94].

2.6. Life Cycle Assessment (LCA) and Techno-Economic Analysis (TEA)

LCA and TEA have been conducted on this RF technology to evaluate its environmental impacts and its economic feasibility. These studies are important to identify societal demands for sustainable, cost-effective, and environmentally friendly technology solutions for advanced water treatment. Full details of LCA and TEA methodology, modeling, and case studies are provided by Taslakyan et al. [60,61]. This includes acquiring biochar inventory data to properly model biochar impact in the LCA studies. The key steps and findings of the LCA and TEA models are briefly summarized in this paper.
LCA and TEA studies on RF used 1 m3 influent wastewater as the functional unit to enable objective comparisons. LCA in RF studies was conducted with SimaPro® using the ReCiPe midpoint analysis method for impact assessment [60]. TEA studies were conducted with Crystal Ball (Oracle Corporation, Austin, TX, USA), which is a spreadsheet-based application used for predictive modeling, forecasting, simulation, and optimization. The TEA model was developed using a similar process model as in LCA studies, and input and output parameters were estimated from an extensive survey of available marketplace information using probability distributions. Table 1 shows the location where LCA and TEA parametrization studies were conducted for pilot-scale, full-scale, and conservative baseline (1 MGD) WRRFs. For the TEA studies, a 20-year life span and service period, a net present value at a conservative 6% interest rate, and one hundred Bayesian prior distributions were used to conduct the financial forecast analysis of the Fe-CatOx-BC-RF technology. Sensitivity analysis to identify the impact of flow rate and biochar dosage using 100,000 simulation runs was also conducted in that study [53,61].
An important variable presented in the TEA studies is the levelized cost of water (LCOW), which contains the capital expenditure (CAPEX) and operating expenditure (OPEX) for a unit amount of treated water. CAPEX consists of initial investment costs, while OPEX consists of processing and operational costs. The LCOW is the total cost of the water treatment technology to treat a certain quantity of water. This is shown as
L C O W = C A P E X + O P E X Q u a n t i t y   o f   w a t e r   t r e a t e d

2.7. RF Configurations

Different case studies, configurations, and applications of RF used in this review are summarized in Table 2. Full details of each wastewater treatment study, such as processes and mechanisms, are published by several authors for a few test sites [44,47,51,52,53,60,61]. As seen from Table 2, different configurations were used with RF as the base configuration. Furthermore, the table also shows RF and its additional modifications used for synthetic and municipal scenarios to quantify its potential in nutrient removal and recovery in laboratory, pilot, and large-scale applications. Here, we note that different biochars (raw and Fe-modified) were also used in the trials to determine their performance in nutrient recovery.
It is important to note that although RF is modifiable to accommodate catalytic oxidation and the biochar process capabilities shown in Table 2, it requires careful planning. Some of the operational challenges experienced running field trials for both pilot and large scale are initial stability of RF system, process optimization, and steady supply of biochar, ozone, and ferric chloride supply. For example, 2 days were used for process stabilization and optimization in Sandpoint pilot trials before the sampling experiments, and 18 months of near-continuous operation were used for stability and optimization for Horwich, UK trials. Field sampling, sample preservation, and laboratory analytical data obtained by standard methods used in regulatory water quality assessment are used in the studies. Biochar fouling in the RF system was not noted to pose a challenge in the trials, since process optimization within the time frames of the test trials did not observe challenges, although sand bed overloading by suspended solids is certainly possible. Beyond optimized dose rates, frangible BC that was injected into the sand bed is ball-milled and filtered by the quartz sand and discharged via the filter reject (Figure 1, element 5b) [47].

3. Results

3.1. P Removal from Laboratory Studies

Synthetic water studies provide insight into RF’s performance in removing P in a controlled environment scenario. Figure 3 shows the results [47] of the RF pilot study conducted in synthetic lake water (SLW) in Moscow, Idaho with (Fe-BC-RF) and without biochar (RF). In these initial pilot studies, the results highlight excellent TP removal performance of 94–96% using RF and Fe-BC-RF at TP concentration of 0.072 mg/L (Week 1). Even after increasing TP influent concentration to 0.208 mg/L (Week 2), the results show a high removal performance by RF technology of 98%. This shows the encouraging results of RF technology in removing P at different TP concentrations with or without biochar in an idealized scenario. The findings from these studies showed the potential of RF as a novel solution to improve water quality conditions and address SDG 6, Clean Water and Sanitation. The addition of biochar to the RF process having minimal impact on these initial pilot studies needs to be investigated further.

3.2. P Removal from Field Pilot-Scale Studies

The field pilot-scale studies assess RF technology in P removal and recovery in various influent conditions and configurations. Table 3 summarizes the pilot-scale studies conducted at several locations in the United States. There was excellent P removal of >83% for various wastewater flow rates, locations, and RF configurations. P removal performance is 94.3–96.4% with just RF, 86.9–88.3% with Fe-CatOx-RF, and 83.9–99.5% with Fe-CatOx-BC-RF. These findings show that the RF system phosphorus removal efficiency is stable, however, fluctuations in influent phosphorus concentrations can influence its treatment performance under variable wastewater conditions. LCA studies of Sandpoint, ID trials showed an overall carbon negative −1.21 kg CO2e/m3 for the Fe-CatOx-BC-RF pilot-scale process, where the negative contribution from biochar is −1.53 kg CO2e/m3 [61].
In Hg and As contaminant removal trials, the RF technology allows for effective As (91.8%) and Hg (>81%) removal for a few select locations such as in Hibbing and Virginia, Minnesota. The trace levels of mercury from the studies are impacted by the quality of the secondary effluent, including dissolved organic matter content entering RF systems [58]. For As removal trials, the research suggests that the formation and renewal of iron oxide-coated sand in the moving bed sand filter improves the As removal efficiency [52]. Overall, these pilot-scale trials showed that the RF could decrease the Hg and As concentrations to below 2 μg/L and 10 μg/L standards, respectively.
The results from these studies also show that the addition of O3 and BC did not hinder RF performance during the treatment process as observed in Moscow, Troy, and Sandpoint field trials. Adding O3 to the system configuration adds destruction of micropollutants through CatOx. In addition, adding BC provides a pathway for nutrient recycling, such as P, where the nutrient-upcycled biochar can be amended to soils. Thus, these two additional components provide micropollutant destruction and nutrient recovery, which are two technological advances needed for the next generation of water treatment to help achieve SDG 6 [95,96]. Their impacts in the RF treatment process can be seen in micropollutant removal and nutrient recovery sections.

3.3. Micropollutant Removal Performance from Field Pilot and Large-Scale Studies

Micropollutants were analyzed from the influent and effluent water to understand the micropollutant destruction and removal of the RF technology. Table 4 provides a summary of the detected compounds and removal performance for different RF configurations and trial locations. The table shows the removal performance, which uses a data heuristics approach to improve the accuracy of calculated compound removal efficiencies [97,98]. In this approach, only values greater than 5 × Limit of Quantification (LoQ) were used to report tertiary treatment data. This allows many detected micropollutants to be removed from further analysis, which improves data interpretation. Effluent concentrations below the 5 × LoQ were estimated to have concentrations of 0.5 × LoQ [99].
The results from the table show excellent removal performance of micropollutants with and without CatOx and with and without BC for most of the compounds in the water (>70%). The results demonstrate that despite the water quality variability in the influent conditions, RF can efficiently remove contaminants. The results also show that the addition and the type of biochar (i.e., native or modified BC) directly or indirectly affect the RF process in terms of micropollutant removal. The RF trials in Hayden, ID also showed good micropollutant removals in a large-scale scenario. Although the results show excellent removal performance, they do not reveal the mechanism of micropollutant removal. The results only show that the micropollutants were removed from the RF system influent. Potential removal pathways may include destructive removal via oxidative pathways, adsorption on system solids including iron oxides and biochar, and a combination of both. While this can be addressed in a separate investigation, the complexity of real-world wastewater used in field studies may confound the value of any detailed studies in these largely uncontrolled and highly variable water systems. The cost basis and degree of difficulty of mechanistic studies in pilot-scale field trials limit the exploration of our understanding of important questions of pathways and dynamics at the molecular scale.
Overall, the RF process and its variations demonstrate an effective approach for water treatment removal and recovery of nutrients with micropollutant destruction for various inflow conditions. This water treatment technology compares favorably to other micropollutant removal processes such as granular activated carbon (GAC) [100] and membrane-based filtrations [75].

3.4. Nutrient Recovery Performance from Field Pilot Studies

The goal of biochar addition to the RF process in water treatment is to provide a medium to capture nutrients in wastewater. Studies have shown that biochar is effective in capturing nutrients due to its unique properties such as large specific surface area, pH buffering capacity, and ion exchange capacity [101]. Initial attempts to integrate BC in RF treatment processes and configurations were conducted in Sandpoint pilot trials, with nutrient recovery analyses conducted in these trials. For these analyses, total and formic acid extraction experiments were conducted on the biochar studied to determine the nutrient contents and availability [47]. Table 5 provides a summary of the amount of P and N in native, recovered, and rejected biochar for different BC types used in Sandpoint trials.
The results from the nutrient analysis of these trials with different biochar suggest that biochar can be an effective medium to recover nutrients from wastewater. The results also suggest that an iron-modified BC (i.e., Fe-BC) performed better in nutrient recovery than its unmodified version. This is highlighted by the increase in P by 2.1× (757 to 1600 mg/kg P) and N by 3.8× (810 to 3040 mg/kg N) using Fe-BCP. For unmodified BC (i.e., BCP), it only increased by 1.2× (806 to 931 mg/kg) for P and 0.86× (790 to 680 mg/kg) for N. Biosolid-based BC showed no significant change in P from its native condition. Studies conducted by Sagar et al. [102] on the performance of the recovered biochar to plant growth showed that the Fe-modified biochar can supply adequate P to plants when used as fertilizer, supporting the use of nutrient-upcycled biochar as a biochar-based fertilizer. Thus, the combination of findings from these studies [47,102] helped address SDG 2, which aims to improve food security and advance agriculture sustainability.

3.5. P, Hg, Cu, and N Removal from Large-Scale Studies

The removal performance of RF technology in large-scale scenarios is summarized in Table 6. The P removal ranged from 77.8–99.9% using flow rates of 10–132 L/s. The results suggest that the RF process reduces P at high efficiency. The results also suggest minimal impact of influent variability and flow rate conditions on RF system performance. Even at the highest flow rate, 132 L/s, conducted at International Falls, Minnesota WRRF, reactive filtration managed to remove P and Hg at high efficiency (83.2% and 96.9%, respectively), meeting their regulatory discharge permit levels. This is because Fe is being used in the filtration process, which increases P removal from wastewater, and is also cost controlled in dosing when targeted to achieve permit limits rather than a more complete removal that may result in increased doses. The results also show the viability of the technology to remove other elements such as Hg, Cu, and N, and thus has the potential to meet strict regulations such as the Great Lakes Initiative standard, which includes a total Hg effluent discharge target of 1.3 ng/L [103]. Full-scale installations are typically operated to achieve discharge permit levels of contaminants rather than optimization for maximum removals.
The results of the large-scale study highlight the scalability of RF from its pilot-scale version (see Table 3), which had P removal efficiencies from 83.9 to 99.5%. However, it is challenging to do a cross-comparison of pilot-scale and full-scale performance with the same influent conditions, which can be project resource intensive. It can also be challenging due to the availability of the site where studies are conducted. Nevertheless, the results from both pilot-scale and full-scale studies show the robustness of the RF process.
The USEPA Enforcement Compliance History Online (ECHO) database [104] provides a detailed report of water resource recovery facility (WRRF) effluents. Example effluent charts are shown in Figure 4 and Figure 5 for total P and total N from 06/2020 to 06/2024 from Citronelle, AL WRRF. These charts highlight the ability of reactive filtration to meet weekly and monthly average limits. Note that some reported data have different limits, which are adjusted based on the season. Furthermore, some of the effluent readings are beyond the set limits, which resulted in resolved/unresolved violations that periodically occur in continuous operations such as in May 2022 [104]. Other reports and charts from different WRRFs can be generated from the database [104]. It is notable that at 0.022 mg/L total P, the Citronelle, AL WRRF, has the lowest TP discharge regulatory limit in the United States.
LCA studies conducted in Plummer, ID by Taslakyan et al. [60] showed a 0.02 kg CO2e global warming potential (GWP) per cubic meter of treated water by RF, where almost half of the impact is contributed from filter system concrete housing. They also concluded an overall freshwater eutrophication impact reduction of 99% with RF compared to a no water treatment scenario. The incorporation of biochar in the RF system transforms it into carbon-negative at −1.41 kg CO2e per cubic meter of treated water, and the GWP values are biochar dose-dependent [61]. Thus, the results indicate that reactive filtration in large-scale scenarios is an encouraging tertiary, carbon-negative, water treatment technology, which can address phosphorus recycling needs in comparison to other treatment technologies [105]. In addition, the results of the LCA studies helped demonstrate how RF technology is addressing SDGs 12 and 13, which are related to responsible and environment-friendly consumption of resources.

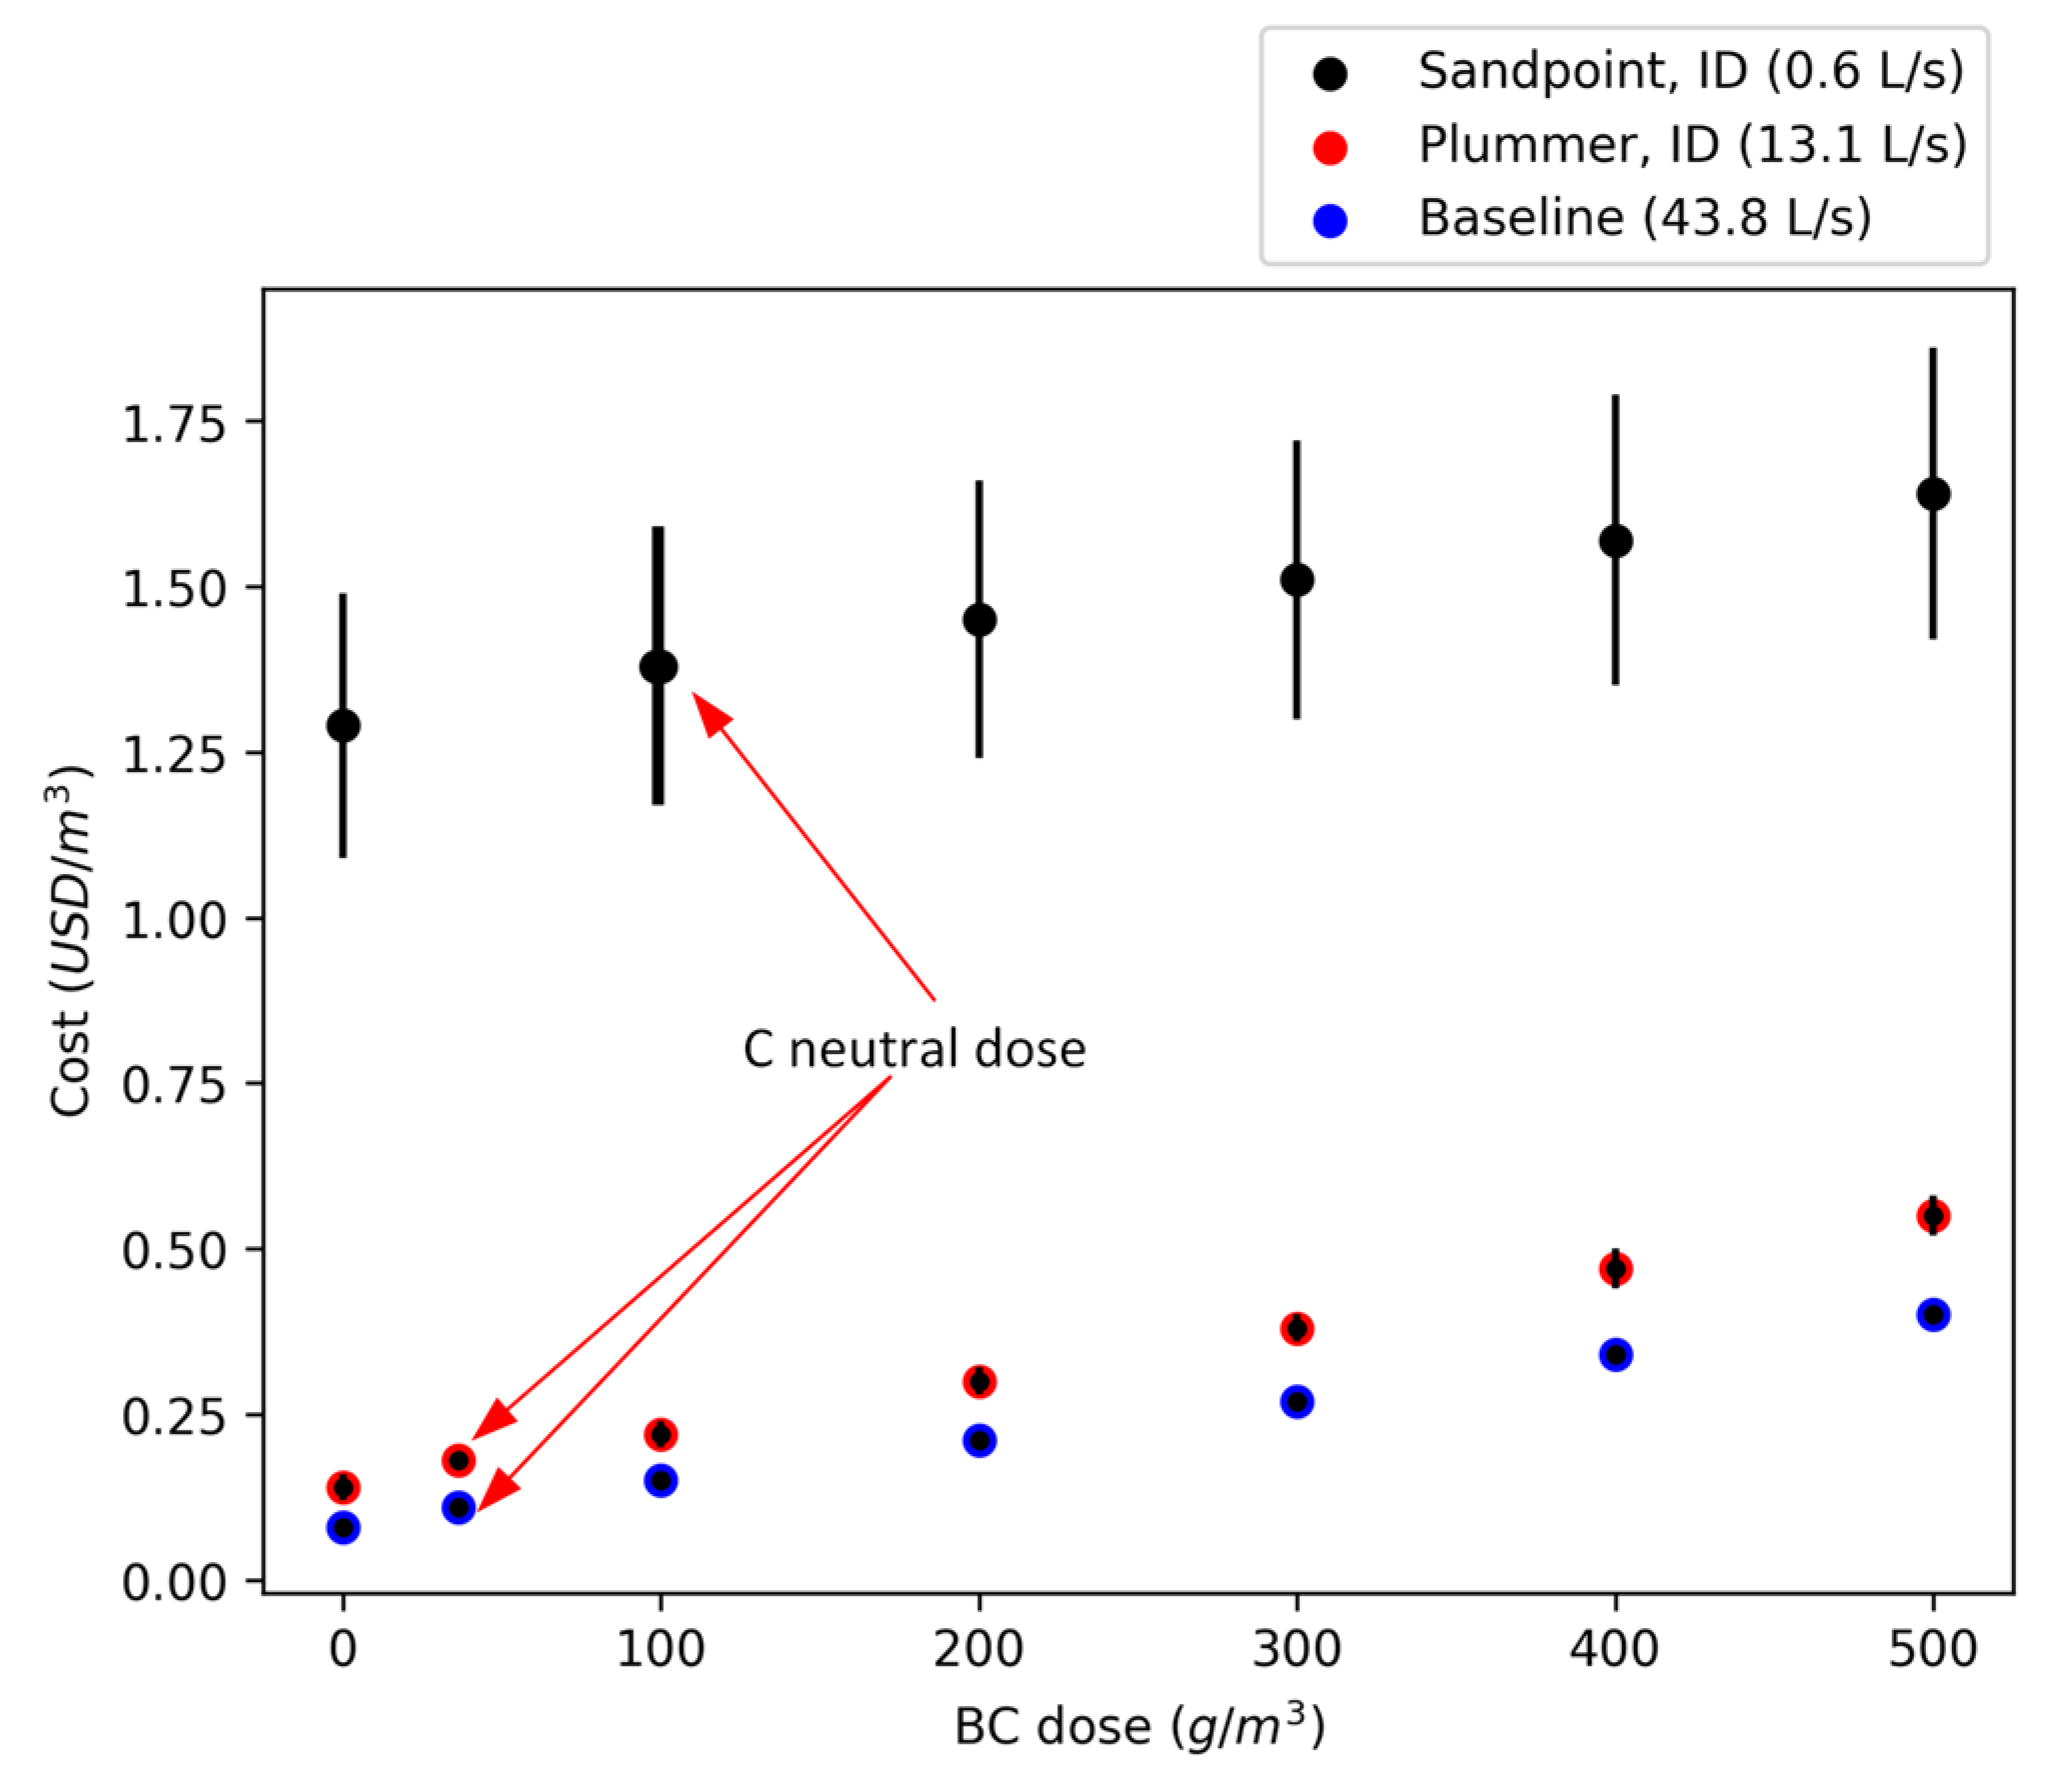
3.6. TEA Case Studies on RF at Different Flow Rates

Regarding the exploration of the economic feasibility of the Fe-CatOx-BC-RF treatment technology, TEA case studies of RF for different flow rates were conducted. Taslakyan et al. [61] provides details for conducting LCA and TEA on Fe-CatOx-BC-RF pilot studies, which are briefly summarized and adapted here. We first looked at the CAPEX and OPEX breakdown of the key components of the Fe-CatOx-BC-RF system, which are shown in Figure 6a,b. The result from CAPEX (Figure 6a) indicates that the ozone generator has the highest share of the total capital expenditure, contributing 41.6%. This is followed by a similar share of costs by components such as control systems, tanks and reservoirs, and volumetric feeder with 5–11%. All other components such as hoses and pipes make a minimal contribution to CAPEX with 2.7%. For OPEX (Figure 6b), Fe-CatOx-BC-RF uses chemicals such as FeCl3 and NaOH, biochar, electricity, labor, and maintenance costs. This study highlights that adding biochar only contributes 11.4% of OPEX. Furthermore, disposal costs in the TEA contribute to 22.0%, assuming a disposal cost of USD 0.44 per kilogram of solids and an average of 37.8 kg/d total solids [106].
The TEA cost model case studies of Fe-CatOx-BC-RF for Sandpoint, Plummer, and the baseline model are shown in Figure 7. The case studies consider the Fe-CatOx-BC-RF without BC addition and the addition of BC to the system at 100 g/m3 increments. The case studies by Taslakyan et al. [61] highlight that equipment and capital costs dominate at small flow rates, while consumables become more prominent at large flow rates. The TEA results showed that the carbon neutral cost per cubic meter of treated water is USD 1.38, USD 0.18, and USD 0.11 for 0.6 L/s, 13.1 L/s, and 43.8 L/s, respectively. Furthermore, TEA also shows that adding biochar after reaching carbon neutrality only provides more carbon sequestered with an associated cost of USD 0.07 per 100 g/m3.

4. Conclusions

The reactive filtration (RF) technology has been developed, commercialized, and improved over the past two decades by the research team at the University of Idaho for its potential to remove nutrients and recover them for reuse in various types of waters. In this work, we review the evolution of RF technology and evaluate its performance from laboratory scale to large-scale water treatment scenarios. The published results of several field pilot- to full-scale trials and installations are presented in this review.
The laboratory case studies were conducted on synthetic lake water to evaluate the performance of reactive filtration in a controlled environment. Studies were conducted with and without the addition of biochar for P removal. The results show excellent TP removal performance of 94–98% and 96–98% removal of OP for RF and RF-BC, respectively. Thus, in an idealized scenario, RF showed a promising pathway for P removal, and the impact of biochar on P removal efficiency was minimal.
Pilot-scale studies were conducted across North America using different RF configurations to test the performance of the technology in complex polluted waters. Pilot-scale results showed removal P efficiencies of 86.9–99.5%, demonstrating the capability of the technology to remove targeted nutrients at high efficiency. The results obtained from these studies showed that adding O3 and BC to reactive filtration does not impact P removal process, but provides new opportunities for the simultaneous destruction of micropollutants through CatOx and P recycling through P-enriched BC. The recovered BC in these trials can be amended to soils to support plant growth. Initial LCA studies modeling the pilot trials in Sandpoint, ID showed an overall carbon-negative −1.21 kg CO2e/m3 for the Fe-CatOx-BC-RF pilot-scale process, with the most negative contribution (positive environmental impact) from biochar at −1.53 kg CO2e/m3. The results from the pilot trials showed promising results in integrating BC into the RF technology, making the process a carbon-negative operation while promoting nutrient removal and recovery.
A review of the literature for large-scale RF water treatment shows excellent P removal performance of 77.8–99.9% from a range of flow rates of 10–132 L/s across different source waters and concentrations at WRRFs and other contaminated water sources [53,94]. The results from these studies also demonstrate the removal of other pollutants such as As, Hg, Cu, and N, with the potential to meet stringent regulations such as the Great Lakes Initiative ultralow mercury standard [85,103]. Initial LCA studies showed a 0.02 kg CO2e/m3 footprint of treated water by RF and −1.41 kg CO2e/m3 with a biochar configuration for Plummer, ID WRRF [60,61]. TEA studies showed that the RF technology can reach neutrality with BC integrated into the system at 98.5 g/m3 for a pilot study such as Sandpoint, ID, and decreases to 36.4 g/m3 when implemented in large-scale scenarios such as Plummer, ID [61]. Thus, this review provides evidence that RF with the integration of BC and CatOx has the potential to be a carbon-negative dose-dependent technology, with the capacity for nutrient removal and recovery and micropollutant destructive removal. While both CatOX-RF and BC-RF are early in the process development cycle for full scale installations, these modifications to the RF platform demonstrate the capability to help address UN SDGs in the arenas of water quality (SDG 6), food security (SDG 2), and climate change mitigation (SDG 12 and 13).

5. Future Directions

This retrospective and comprehensive review of published research from the past two decades shows the progression of RF from P removal to nutrient recovery with BC and micropollutant destructive removal with CatOx. It is shown that tertiary filtration aided by iron metal salt addition can reduce TP concentrations in the final effluent to ultra-low oligotrophic levels. A future direction for research should aim to utilize BC for different applications such as municipal, food, and agricultural water types. The aim of another potential study would be to determine the long-term impact of biochar adsorbed pollutant leaching risk when used in municipal wastewater treatment. Additionally, the LCA and TEA models must be refined and expanded to study other parameters such as catalytic oxidation contribution to energy demands in pilot and full–scale scenarios. Socio-economic assessment studies are encouraged to evaluate the viability of the RF technology. By addressing these targeted gaps, reactive filtration can be further assessed for sustainability potential, technology readiness in additional applications, and viability in climate change mitigation.

Author Contributions

Conceptualization, G.M.; methodology, G.M.; software, G.M.; validation, G.M.; formal analysis, G.M. and P.Y.; investigation, G.M.; resources, G.M.; data curation, P.Y., G.M. and M.C.B.; writing—original draft preparation, P.Y. and G.M.; writing—review and editing, P.Y., M.C.B., L.T., D.G.S. and G.M.; visualization, P.Y. and G.M.; supervision, G.M. and D.G.S.; project administration, G.M. and D.G.S.; funding acquisition, G.M. and D.G.S. All authors have read and agreed to the published version of the manuscript.

Funding

This research was funded by the U.S. Environmental Protection Agency (USEPA), Assistance Agreement No. 84008701, awarded to the University of Idaho, and under Agreement No. 2020-69012-31871, funded by the U.S. Department of Agriculture (USDA), National Institute of Food and Agriculture. This work is also supported by the Idaho Agricultural Experiment Station, USDA NIFA Project Number IDA0171. The Murdock Charitable Trust, WA, USA, and the Idaho Global Entrepreneurial Mission (IGEM), ID, USA also supported this work. This publication has not been formally reviewed by the funding agencies. The views expressed in this are solely those of the authors and do not necessarily reflect those of the funding agencies. These agencies do not endorse any products or commercial services mentioned in this publication.

Institutional Review Board Statement

Not Applicable.

Informed Consent Statement

Not Applicable.

Data Availability Statement

The data and other resources used in this report are available in the cited publications.

Conflicts of Interest

Gregory Möller and Daniel Strawn are inventors of the University of Idaho assigned patents related to reactive filtration (G.M.), catalytic oxidation (G.M.), and biochar water treatment (G.M., D.S.). The remaining authors declare that the research was conducted in the absence of any commercial or financial relationships that could be construed as a potential conflict of interest.

Abbreviations

The following abbreviations are used in this manuscript:
BCBiochar
CatOxCatalytic Oxidation
CAPEXCapital Expenditure
ECHOEnforcement Compliance History Online
EBPREnhanced Biological Phosphorus Removal
GACGranulated Activated Carbon
GWPGlobal Warming Potential
HABHarmful Algal Blooms
HFO-RFHydrous Ferric Oxide Reactive Filtration
LCALife Cycle Assessment
LCOWLevelized Cost of Water
LoQLimits of Quantification
MGDMillion Gallons per Day
OPOrtho-Phosphorus
OPEXOperating Expenditure
RFReactive Filtration
SGDSustainable Development Goals
SLWSynthetic Lake Water
TEATechno-Economic Analysis
TPTotal Phosphorus
UIUniversity of Idaho
USEPAUnited States Environmental Protection Agency
WRRFWater Resource and Recovery Facilities

References

  1. The 17 Goals-Sustainable Development. Available online: https://sdgs.un.org/goals (accessed on 6 November 2023).
  2. Śniatała, B.; Kurniawan, T.A.; Sobotka, D.; Mąkinia, J.; Othman, M.H.D. Macro-nutrients recovery from liquid waste as a sustainable resource for production of recovered mineral fertilizer: Uncovering alternative options to sustain global food security cost-effectively. Sci. Total Environ. 2023, 856, 159283. [Google Scholar] [CrossRef] [PubMed]
  3. Head, B.W. The Rise of ‘Wicked Problems’—Uncertainty, Complexity and Divergence. In Wicked Problems in Public Policy: Understanding and Responding to Complex Challenges; Springer: Berlin/Heidelberg, Germany, 2022; pp. 21–36. [Google Scholar] [CrossRef]
  4. Davis, J.; Horwitz, P. PLOS Water: A bridge and a voice for the water sectors. PLOS Water 2022, 1, e0000018. [Google Scholar] [CrossRef]
  5. Hallegraeff, G.M.; Anderson, D.M.; Cembella, A.D.; Enevoldsen, H.O. Manual on Harmful Marine Microalgae; UNESCO: Paris, France, 2004. [Google Scholar]
  6. Almanassra, W.; McKay, G.; Kochkodan, V.; Atieh, M.A.; Al-Ansari, T. A state of the art review on phosphate removal from water by biochars. Chem. Eng. J. 2021, 409, 128211. [Google Scholar] [CrossRef]
  7. Rock, P. United States Geological Survey. 2023. Available online: https://pubs.usgs.gov/periodicals/mcs2022/mcs2022-phosphate.pdf (accessed on 5 December 2023).
  8. Qadir, M.; Drechsel, P.; Jiménez Cisneros, B.; Kim, Y.; Pramanik, A.; Mehta, P.; Olaniyan, O. Global and regional potential of wastewater as a water, nutrient and energy source. In Natural Resources Forum; Wiley Online Library: Hoboken, NJ, USA, 2020; Volume 44, pp. 40–51. [Google Scholar] [CrossRef]
  9. Daramola, D.A.; Hatzell, M.C. Energy Demand of Nitrogen and Phosphorus Based Fertilizers and Approaches to Circularity. ACS Energy Lett. 2023, 8, 1493–1501. [Google Scholar] [CrossRef]
  10. Cordell, D.; Rosemarin, A.; Schröder, J.J.; Smit, A. Towards global phosphorus security: A systems framework for phosphorus recovery and reuse options. Chemosphere 2011, 84, 747–758. [Google Scholar] [CrossRef]
  11. European Sustainable Phosphorus Platform. Available online: https://phosphorusplatform.eu/ (accessed on 13 November 2023).
  12. Sustainable Phosphorus Alliance. Available online: https://phosphorusalliance.org/ (accessed on 13 November 2023).
  13. Loganathan, P.; Vigneswaran, S.; Kandasamy, J.; Bolan, N.S. Removal and recovery of phosphate from water using sorption. Crit. Rev. Environ. Sci. Technol. 2014, 44, 847–907. [Google Scholar] [CrossRef]
  14. Di Capua, F.; de Sario, S.; Ferraro, A.; Petrella, A.; Race, M.; Pirozzi, F.; Fratino, U.; Spasiano, D. Phosphorous removal and recovery from urban wastewater: Current practices and new directions. Sci. Total Environ. 2022, 823, 153750. [Google Scholar] [CrossRef]
  15. Kumar, P.S.; Korving, L.; van Loosdrecht, M.C.; Witkamp, G.-J. Adsorption as a technology to achieve ultra-low concentrations of phosphate: Research gaps and economic analysis. Water Res. X 2019, 4, 100029. [Google Scholar] [CrossRef]
  16. Zheng, Y.; Wan, Y.; Zhang, Y.; Huang, J.; Yang, Y.; Tsang, D.C.; Wang, H.; Chen, H.; Gao, B. Recovery of phosphorus from wastewater: A review based on current phosphorous removal technologies. Crit. Rev. Environ. Sci. Technol. 2023, 53, 1148–1172. [Google Scholar] [CrossRef]
  17. Sedlak, R. Phosphorus and Nitrogen Removal from Municipal Wastewater: Principles and Practice; CRC Press: Boca Raton, FL, USA, 2018. [Google Scholar]
  18. Wathugala, G.; Suzuki, T.; Kurihara, Y. Removal of nitrogen, phosphorus and COD from waste water using sand filtration system with Phragmites australis. Water Res. 1987, 21, 1217–1224. [Google Scholar] [CrossRef]
  19. Yildiz, E. Phosphate removal from water by fly ash using crossflow microfiltration. Sep. Purif. Technol. 2004, 35, 241–252. [Google Scholar] [CrossRef]
  20. Erickson, J.; Gulliver, J.S.; Weiss, P.T. Enhanced sand filtration for storm water phosphorus removal. J. Environ. Eng. 2007, 133, 485–497. [Google Scholar] [CrossRef]
  21. Leo, P.; Chai, W.; Mohammad, A.; Qi, Y.; Hoedley, A.; Chai, S.-P. Phosphorus removal using nanofiltration membranes. Water Sci. Technol. 2011, 64, 199–205. [Google Scholar] [CrossRef] [PubMed]
  22. Clark, T.; Stephenson, T.; Pearce, P. Phosphorus removal by chemical precipitation in a biological aerated filter. Water Res. 1997, 31, 2557–2563. [Google Scholar] [CrossRef]
  23. Ngo, H.-H.; Guo, W. Membrane fouling control and enhanced phosphorus removal in an aerated submerged membrane bioreactor using modified green bioflocculant. Bioresour. Technol. 2009, 100, 4289–4291. [Google Scholar] [CrossRef]
  24. Awual, M.R.; Shenashen, M.; Jyo, A.; Shiwaku, H.; Yaita, T. Preparing of novel fibrous ligand exchange adsorbent for rapid column-mode trace phosphate removal from water. J. Ind. Eng. Chem. 2014, 20, 2840–2847. [Google Scholar] [CrossRef]
  25. Luo, X.; Wang, X.; Bao, S.; Liu, X.; Zhang, W.; Fang, T. Adsorption of phosphate in water using one-step synthesized zirconium-loaded reduced graphene oxide. Sci. Rep. 2016, 6, 39108. [Google Scholar] [CrossRef]
  26. Genz, A.; Kornmüller, A.; Jekel, M. Advanced phosphorus removal from membrane filtrates by adsorption on activated aluminium oxide and granulated ferric hydroxide. Water Res. 2004, 38, 3523–3530. [Google Scholar] [CrossRef]
  27. Barnard, J.L. Biological nutrient removal without the addition of chemicals. Water Res. 1975, 9, 485–490. [Google Scholar] [CrossRef]
  28. Boelee, N.; Temmink, H.; Janssen, M.; Buisman, C.; Wijffels, R. Nitrogen and phosphorus removal from municipal wastewater effluent using microalgal biofilms. Water Res. 2011, 45, 5925–5933. [Google Scholar] [CrossRef]
  29. Buhmann, A.; Papenbrock, J. Biofiltering of aquaculture effluents by halophytic plants: Basic principles, current uses and future perspectives. Environ. Exp. Bot. 2013, 92, 122–133. [Google Scholar] [CrossRef]
  30. Oehmen, A.; Lemos, P.C.; Carvalho, G.; Yuan, Z.; Keller, J.; Blackall, L.L.; Reis, M.A. Advances in enhanced biological phosphorus removal: From micro to macro scale. Water Res. 2007, 41, 2271–2300. [Google Scholar] [CrossRef] [PubMed]
  31. Nielsen, P.H.; McIlroy, S.J.; Albertsen, M.; Nierychlo, M. Re-evaluating the microbiology of the enhanced biological phosphorus removal process. Curr. Opin. Biotechnol. 2019, 57, 111–118. [Google Scholar] [CrossRef]
  32. Korchef, A.; Saidou, H.; Amor, M.B. Phosphate recovery through struvite precipitation by CO2 removal: Effect of magnesium, phosphate and ammonium concentrations. J. Hazard. Mater. 2011, 186, 602–613. [Google Scholar] [CrossRef]
  33. Saidou, H.; Moussa, S.B.; Amor, M.B. Influence of airflow rate and substrate nature on heterogeneous struvite precipitation. Environ. Technol. 2009, 30, 75–83. [Google Scholar] [CrossRef]
  34. Siciliano, A.; Limonti, C.; Mehariya, S.; Molino, A.; Calabrò, V. Biofuel production and phosphorus recovery through an integrated treatment of agro-industrial waste. Sustainability 2018, 11, 52. [Google Scholar] [CrossRef]
  35. Fattah, K.P.; Mavinic, D.S.; Koch, F.A.; Jacob, C. Determining the feasibility of phosphorus recovery as struvite from filter press centrate in a secondary wastewater treatment plant. J. Environ. Sci. Health Part A 2008, 43, 756–764. [Google Scholar] [CrossRef]
  36. Shih, Y.-J.; Abarca, R.R.M.; de Luna, M.D.G.; Huang, Y.-H.; Lu, M.-C. Recovery of phosphorus from synthetic wastewaters by struvite crystallization in a fluidized-bed reactor: Effects of pH, phosphate concentration and coexisting ions. Chemosphere 2017, 173, 466–473. [Google Scholar] [CrossRef]
  37. Suzuki, K.; Tanaka, Y.; Kuroda, K.; Hanajima, D.; Fukumoto, Y.; Yasuda, T.; Waki, M. Removal and recovery of phosphorous from swine wastewater by demonstration crystallization reactor and struvite accumulation device. Bioresour. Technol. 2007, 98, 1573–1578. [Google Scholar] [CrossRef]
  38. Fattah, K.; Sabrina, N.; Mavinic, D.; Koch, F. Reducing operating costs for struvite formation with a carbon dioxide stripper. Water Sci. Technol. 2008, 58, 957–962. [Google Scholar] [CrossRef]
  39. Siciliano, A.; Limonti, C.; Curcio, G.M.; Molinari, R. Advances in struvite precipitation technologies for nutrients removal and recovery from aqueous waste and wastewater. Sustainability 2020, 12, 7538. [Google Scholar] [CrossRef]
  40. Wu, H.; Vaneeckhaute, C. Nutrient recovery from wastewater: A review on the integrated Physicochemical technologies of ammonia stripping, adsorption and struvite precipitation. Chem. Eng. J. 2022, 433, 133664. [Google Scholar] [CrossRef]
  41. Sena, M.; Seib, M.; Noguera, D.R.; Hicks, A. Environmental impacts of phosphorus recovery through struvite precipitation in wastewater treatment. J. Clean. Prod. 2021, 280, 124222. [Google Scholar] [CrossRef]
  42. Kim, J.; Deng, Q.; Benjamin, M.M. Simultaneous removal of phosphorus and foulants in a hybrid coagulation/membrane filtration system. Water Res. 2008, 42, 2017–2024. [Google Scholar] [CrossRef]
  43. Mitchell, S.M.; Ullman, J.L. Removal of phosphorus; BOD, and pharmaceuticals by rapid rate sand filtration and ultrafiltration systems. J. Environ. Eng. 2016, 142, 06016006. [Google Scholar] [CrossRef]
  44. Newcombe, R.L.; Rule, R.A.; Hart, B.K.; Möller, G. Phosphorus removal from municipal wastewater by hydrous ferric oxide reactive filtration and coupled chemically enhanced secondary treatment: Part I-performance. Water Environ. Res. A Res. Publ. Water Environ. Fed. 2008, 80, 238–247. [Google Scholar] [CrossRef]
  45. Hagemann, N.; Joseph, S.; Schmidt, H.P.; Kammann, C.I.; Harter, J.; Borch, T.; Young, R.B.; Varga, K.; Taherymoosavi, S.; Elliott, K.W.; et al. Organic coating on biochar explains its nutrient retention and stimulation of soil fertility. Nat. Commun. 2017, 8, 1089. [Google Scholar] [CrossRef]
  46. Shepherd, J.G.; Sohi, S.P.; Heal, K.V. Optimising the recovery and re-use of phosphorus from wastewater effluent for sustainable fertiliser development. Water Res. 2016, 94, 155–165. [Google Scholar] [CrossRef]
  47. Yu, P.; Baker, M.C.; Crump, A.R.; Vogler, M.; Strawn, D.G.; Möller, G. Biochar integrated reactive filtration of wastewater for P removal and recovery, micropollutant catalytic oxidation, and negative CO2e: Process operation and mechanism. Water Environ. Res. 2023, 95, e10926. [Google Scholar] [CrossRef]
  48. Nobaharan, K.; Novair, S.B.; Lajayer, B.A.; van Hullebusch, E.D. Phosphorus removal from wastewater: The potential use of biochar and the key controlling factors. Water 2021, 13, 517. [Google Scholar] [CrossRef]
  49. Bakshi, S.; Laird, D.A.; Smith, R.G.; Brown, R.C. Capture and release of orthophosphate by Fe-modified biochars: Mechanisms and environmental applications. ACS Sustain. Chem. Eng. 2021, 9, 658–668. [Google Scholar] [CrossRef]
  50. Bashar, R.; Gungor, K.; Karthikeyan, K.; Barak, P. Cost effectiveness of phosphorus removal processes in municipal wastewater treatment. Chemosphere 2018, 197, 280–290. [Google Scholar] [CrossRef] [PubMed]
  51. Newcombe, R.L.; Strawn, D.G.; Grant, T.M.; Childers, S.E.; Möller, G. Phosphorus removal from municipal wastewater by hydrous ferric oxide reactive filtration and coupled chemically enhanced secondary treatment: Part II—Mechanism. Water Environ. Res. 2008, 80, 248–256. [Google Scholar] [CrossRef] [PubMed]
  52. Newcombe, R.L.; Hart, B.K.; Möller, G. Arsenic removal from water by moving bed active filtration. J. Environ. Eng. 2006, 132, 5–12. [Google Scholar] [CrossRef]
  53. Baker, M.C.; McCarthy, D.; Taslakya, L.; Henchion, G.; Mannion, R.; Strawn, D.G.; Gregory, M. Iron-Ozone Catalytic Oxidation Reactive Filtration of Municipal Wastewater at Field Pilot and Full-Scale with High-Efficiency Pollutant Removal and Potential Negative CO2e with Biochar. Water Environ. Res. 2023, 95, e10876. [Google Scholar] [CrossRef]
  54. Möller, G.; Baker, M.; Dunkel, C.; Shrestha, D.S.; Strawn, D.G. New Tech™: Resource Recovery in a Novel Functionalized Biochar, Catalytic Oxidation, Reactive Filtration Water Treatment for N/P Removal/Recovery and Pathogen/Priority Substance Destruction. In Proceedings of the 10th European Waste Water Management Conference, Manchester, UK, 11–12 October 2016; Available online: https://www.aquaenviro.co.uk/wp-content/uploads/2017/03/Gregory-M%C3%B6ller-paper.pdf (accessed on 8 January 2024).
  55. Möller, G.; Brackney, K.M.; Korus, R.A.; Keller, M.K., Jr.; Hart, B.K.; Newcombe, R.L. Reactive Filtration. U.S. Patent 7,399,416; B2 Patent, Appl. 10/727,963, 13 November 2008. [Google Scholar]
  56. Möller, G.; Strawn, D. Biochar Water Treatment. U.S. Patent 10,351,455; B2 Patent, Appl. 14/549,342, 28 May 2015. [Google Scholar]
  57. Strawn, D.G.; Crump, A.R.; Peak, D.; Garcia-Perez, M.; Möller, G. Reactivity of Fe-amended biochar for phosphorus removal and recycling from wastewater. PLoS Water 2023, 2, e0000092. [Google Scholar] [CrossRef]
  58. Beutel, M.W.; Dent, S.R.; Newcombe, R.L.; Möller, G. Mercury removal from municipal secondary effluent with hydrous ferric oxide reactive filtration. Water Environ. Res. 2018, 91, 132–143. [Google Scholar] [CrossRef]
  59. Möller, G.; Newcombe, R.L. Water Treatment Method. U.S. Patent 8,080,163 B2, 20 December 2011. [Google Scholar]
  60. Taslakyan, L.; Baker, M.C.; Shrestha, D.S.; Strawn, D.G.; Möller, G. CO2e footprint and eco-impact of ultralow phosphorus removal by hydrous ferric oxide reactive filtration: A municipal wastewater LCA case study. Water Environ. Res. 2022, 94, e10777. [Google Scholar] [CrossRef]
  61. Taslakyan, L.; Baker, M.; Strawn, D.G.; Möller, G. Biochar-integrated reactive filtration of tertiary wastewater for P removal and recovery, micropollutant catalytic oxidation, and negative CO2e: Life cycle assessment and techno-economic Analysis. Water Environ. Res. 2023, 95, e10926. [Google Scholar] [CrossRef]
  62. Garca-Montao, J.; Prez-Estrada, L.; Oller, I.; Maldonado, M.I.; Torrades, F.; Peral, J. Pilot plant scale reactive dyes degradation by solar photo-Fenton and biological processes. J. Photochem. Photobiol. A Chem. 2008, 195, 205–214. [Google Scholar] [CrossRef]
  63. Pera-Titus, M.; Garc, V.; Baos, M.A.; Gimnez, J.; Esplugas, S. Degradation of chlorophenols by means of advanced oxidation processes: A general review. Appl. Catal. B Environ. 2004, 47, 219–256. [Google Scholar] [CrossRef]
  64. Shin, S.; Yoon, H.; Jang, J. Polymer-encapsulated iron oxide nanoparticles as highly efficient Fenton catalysts. Catal. Commun. 2008, 10, 178–182. [Google Scholar] [CrossRef]
  65. Wang, J.L.; Xu, L.J. Advanced oxidation processes for wastewater treatment: Formation of hydroxyl radical and application. Crit. Rev. Environ. Sci. Technol. 2012, 42, 251–325. [Google Scholar] [CrossRef]
  66. Yan, L.; Bing, J.; Wu, H. The behavior of ozone on different iron oxides surface sites in water. Sci. Rep. 2019, 9, 14752. [Google Scholar] [CrossRef]
  67. Pestovsky, O.; Stoian, S.; Bominaar, E.L.; Shan, X.; Münck, E.; Que, L., Jr.; Bakac, A. Aqueous FeIV=O: Spectroscopic Identification and Oxo-Group Exchange. Angew. Chem. Int. Ed. 2005, 44, 6871–6874. [Google Scholar] [CrossRef]
  68. Dai, Y.; Zheng, H.; Jiang, Z.; Xing, B. Combined effects of biochar properties and soil conditions on plant growth: A meta-analysis. Sci. Total Environ. 2020, 713, 136635. [Google Scholar] [CrossRef]
  69. Glaser, B.; Lehr, V.I. Biochar effects on phosphorus availability in agricultural soils: A meta-analysis. Sci. Rep. 2019, 9, 9338. [Google Scholar] [CrossRef]
  70. Miroshnichenko, D.; Zhylina, M.; Shmeltser, K. Modern uses of biochar in various technologies and industries. A review. Chem. Chem. Technol. 2024, 18, 232–243. [Google Scholar] [CrossRef]
  71. Das, O.; Sarmah, A.K.; Bhattacharyya, D. Structure—Mechanics property relationship of waste derived biochars. Sci. Total Environ. 2015, 538, 611–620. [Google Scholar] [CrossRef]
  72. Dunkel, C. GHG Emissions and Energy Usage Assessment of Phosphorus Recovery from Municipal Wastewater Systems Utilizing Biochar-Catalytic Oxidation-Reactive Filtration; University of Idaho: Moscow, ID, USA, 2016. [Google Scholar]
  73. Perez-Mercado, L.F.; Lalander, C.; Berger, C.; Dalahmeh, S.S. Potential of biochar filters for onsite wastewater treatment: Effects of biochar type, physical properties and operating conditions. Water 2018, 10, 1835. [Google Scholar] [CrossRef]
  74. Leng, L.; Huang, H.; Li, H.; Li, J.; Zhou, W. Biochar stability assessment methods: A review. Sci. Total Environ. 2019, 647, 210–222. [Google Scholar] [CrossRef] [PubMed]
  75. Khanzada, N.K.; Farid, M.U.; Kharraz, J.A.; Choi, J.; Tang, C.Y.; Nghiem, L.D.; Jang, A.; An, A.K. Removal of organic micropollutants using advanced membrane-based water and wastewater treatment: A review. J. Membr. Sci. 2020, 598, 117672. [Google Scholar] [CrossRef]
  76. Arsenic. World Health Organization. Available online: https://www.who.int/news-room/fact-sheets/detail/arsenic (accessed on 14 December 2023).
  77. USEPA. Drinking Water Arsenic Rule History. Available online: https://www.epa.gov/dwreginfo/drinking-water-arsenic-rule-history (accessed on 10 June 2024).
  78. Hall, B.; Bodaly, R.; Fudge, R.; Rudd, J.; Rosenberg, D. Food as the dominant pathway of methylmercury uptake by fish. Water Air Soil Pollut. 1997, 100, 13–24. [Google Scholar] [CrossRef]
  79. USEPA. National Primary Drinking Water Regulations. Available online: https://www.epa.gov/ground-water-and-drinking-water/national-primary-drinking-water-regulations (accessed on 10 June 2024).
  80. USEPA. Guidelines for Eating Fish That Contain Mercury. Available online: https://www.epa.gov/mercury/guidelines-eating-fish-contain-mercury (accessed on 10 June 2024).
  81. Diz, H.R.; Novak, J.T. Fluidized bed for removing iron and acidity from acid mine drainage. J. Environ. Eng. 1998, 124, 701–708. [Google Scholar] [CrossRef]
  82. Thirunavukkarasu, O.S.; Viraraghavan, T.; Subramanian, K. Removal of arsenic in drinking water by iron oxide-coated sand and ferrihydrite—Batch studies. Water Qual. Res. J. 2001, 36, 55–70. [Google Scholar] [CrossRef]
  83. Lo, S.-L.; Jeng, H.-T.; Lai, C.-H. Characteristics and adsorption properties of iron-coated sand. Water Sci. Technol. 1997, 35, 63–70. [Google Scholar] [CrossRef]
  84. Henneberry, Y.K.; Kraus, T.E.; Fleck, J.A.; Krabbenhoft, D.P.; Bachand, P.M.; Horwath, W.R. Removal of inorganic mercury and methylmercury from surface waters following coagulation of dissolved organic matter with metal-based salts. Sci. Total Environ. 2011, 409, 631–637. [Google Scholar] [CrossRef] [PubMed]
  85. Urgun-Demirtas, M.; Gillenwater, P.; Negri, M.C.; Lin, Y.; Snyder, S.; Doctor, R.; Pierce, L.; Alvarado, J. Achieving the Great Lakes Initiative mercury limits in oil refinery effluent. Water Environ. Res. 2013, 85, 77–86. [Google Scholar] [CrossRef]
  86. Dzombak, D.A.; Morel, F.M. Surface Complexation Modeling: Hydrous Ferric Oxide; John Wiley & Sons: Hoboken, NJ, USA, 1991. [Google Scholar]
  87. USEPA. Wastewater Technology Fact Sheet Denitrification Filters. Available online: https://nepis.epa.gov/Exe/ZyPURL.cgi?Dockey=P100IL79.txt (accessed on 26 March 2024).
  88. Metcalf, L.; Eddy, H.P.; Tchobanoglous, G. Wastewater Engineering: Treatment, Disposal, and Reuse; McGraw-Hill: New York, NY, USA, 1991. [Google Scholar]
  89. Chan, T.; Koodie, T.; Sloper, M.; Wiggam, R. Harnessing the power in nitrifying sand filters. In Proceedings of the 11th European Waste Water Management Conference, Leeds, UK, 3–4 October 2017; Available online: https://www.aquaenviro.co.uk/wp-content/uploads/2018/03/201711thEWWM-Chan_TF_et_al-NSF.pdf (accessed on 10 April 2024).
  90. Lee, C.O.; Boe-Hansen, R.; Musovic, S.; Smets, B.; Albrechtsen, H.-J.; Binning, P. Effects of dynamic operating conditions on nitrification in biological rapid sand filters for drinking water treatment. Water Res. 2014, 64, 226–236. [Google Scholar] [CrossRef]
  91. Moore, K. Optimizing Recirculating Media Filters for Ammonia Treatment. Available online: https://dnr.mo.gov/document-search/optimizing-recirculating-media-filters-ammonia-treatment-pub2737/pub2737 (accessed on 2 February 2024).
  92. Koopman, B.; Stevens, C.M.; Wonderlick, C.A. Denitrification in a moving bed upflow sand filter. Res. J. Water Pollut. Control. Fed. 1990, 62, 239–245. Available online: https://www.jstor.org/stable/25043827 (accessed on 2 February 2024).
  93. BlueNite Biological Denitrification. Available online: https://nexom.com/bluenite/ (accessed on 6 June 2024).
  94. Reactive Filtration for Ultra-Low Phosphorus & Metals. Available online: https://nexom.com/bluepro-3/ (accessed on 20 November 2023).
  95. Chang, C.-C.; DiGiovanni, K.; Mei, Y.; Research, W.E. Sustainability. Water 2019, 91, 1129–1149. [Google Scholar] [CrossRef]
  96. Osman, A.I.; Fawzy, S.; Farghali, M.; El-Azazy, M.; Elgarahy, A.M.; Fahim, R.A.; Maksoud, M.A.; Ajlan, A.A.; Yousry, M.; Saleem, Y.; et al. Biochar for agronomy, animal farming, anaerobic digestion, composting, water treatment, soil remediation, construction, energy storage, and carbon sequestration: A review. Environ. Chem. Lett. 2022, 20, 2385–2485. [Google Scholar] [CrossRef] [PubMed]
  97. Choubert, J.-M.; Ruel, S.M.; Miege, C.; Coquery, M. Rethinking micropollutant removal assessment methods for wastewater treatment plants–how to get more robust data? Water Sci. Technol. 2017, 75, 2964–2972. [Google Scholar] [CrossRef] [PubMed]
  98. Little, T. Method validation essentials, limit of blank, limit of detection, and limit of quantitation. BioPharm Int. 2015, 28. Available online: https://www.biopharminternational.com/view/method-validation-essentials-limit-blank-limit-detection-and-limit-quantitation (accessed on 13 March 2024).
  99. Helsel, R. Less than obvious-statistical treatment of data below the detection limit. Environ. Sci. Technol. 1990, 24, 1766–1774. [Google Scholar] [CrossRef]
  100. Altmann, J.; Rehfeld, D.; Trder, K.; Sperlich, A.; Jekel, M. Combination of granular activated carbon adsorption and deep-bed filtration as a single advanced wastewater treatment step for organic micropollutant and phosphorus removal. Water Res. 2016, 92, 131–139. [Google Scholar] [CrossRef]
  101. Marciczyk, M.; Ok, Y.S.; Oleszczuk, P. From waste to fertilizer: Nutrient recovery from wastewater by pristine and engineered biochars. Chemosphere 2022, 306, 135310. [Google Scholar] [CrossRef]
  102. Laxmisagara Sagar, K.; Strawn, D.G.; Crump, A.R.; Baker, M.; Möller, G. Availability of Recycled Phosphorus on Biochar Reacted with Wastewater to Support Growth of Lactuca sativa. Soil Syst. 2024, 8, 93. [Google Scholar] [CrossRef]
  103. USEPA. Water Quality Guidances for the Great Lakes System: Supplementary Information Document (SID). Available online: https://www.epa.gov/sites/default/files/2018-10/documents/water-quality-great-lakes-sid.pdf (accessed on 2 February 2024).
  104. USEPA. Echo Data Base—Effluent Charts. Available online: https://echo.epa.gov/effluent-charts#AL0060887 (accessed on 10 June 2024).
  105. Ragsdale, D. Advanced Wastewater Treatment to Achieve Low Concentration of Phosphorus; EPA Region 10; United States Environmental Protection Agency (EPA), Office of Water and Watersheds: Seattle, WA, USA, 2007. Available online: https://www.epa.gov/sites/default/files/2019-02/documents/advanced-wastewater-treatment-low-concentration-phosphorus.pdf (accessed on 14 December 2023).
  106. Seiple, T.E.; Skaggs, R.L.; Fillmore, L.; Coleman, A.M. Municipal wastewater sludge as a renewable, cost-effective feedstock for transportation biofuels using hydrothermal liquefaction. J. Environ. Manag. 2020, 270, 110852. [Google Scholar] [CrossRef]
Figure 1. Schematic of the overall Fe-CatOx-BC-RF process. Red lines indicate removable components to change RF configuration (i.e., Fe-CatOx-RF, Fe-BC-RF). Black numbered circles represent major process components.
Sustainability 17 05799 g001
Figure 2. Sorption isotherms for raw and modified biochar. Adapted from Strawn et al. [57].
Sustainability 17 05799 g002
Figure 3. Mean TP log effluent concentration and percent removal in synthetic lake water studies. (a) RF only. (b) Fe-BC-RF. Week 1 influent TP is ~0.072 mg/L. Week 2 influent TP is ~0.208 mg/L. Error bars are too small to be shown. Adapted from Yu et al. [47].
Sustainability 17 05799 g003
Figure 4. Total P effluent from Citronelle, AL, USA WRRF. -- = 0.022 mg/L TP discharge limit. = Average measurements without violations. = Measurements with resolved violations. = Effluent measurement with violations. The effluent chart is from 8 June 2020 to 7 June 2024. Data and figure from [104].
Sustainability 17 05799 g004
Figure 5. Total N effluent (as total ammonia) from Citronelle, AL wastewater treatment plant in USA. = Effluent measurements with violations. The effluent chart is from 14 June 2019 to 7 June 2024. Data and figures from [104].
Sustainability 17 05799 g005
Figure 6. Breakdown of CAPEX and OPEX components for Fe-CatOx-BC-RF (in percentage) of total forecasted levelized cost of water: (a) CAPEX; (b) OPEX. Adapted and modified from Taslakyan et al. [61].
Sustainability 17 05799 g006
Figure 7. Forecasted Fe-CatOx-BC-RF treatment levelized cost per cubic meter of water [$/m3]. The C100 carbon neutral dose rate for the pilot-scale determined from the LCA is 98.5 g/m3 and 36.4 g/m3 for the Plummer WRRF. The Plummer dose rate is assumed for the 43.8 L/s cost estimate. All currency values are in USD. Calculations assume the same dose rate of Fe and O3 for all three scales of the process model and the same carbon-neutral BC dose level for 43.8 L/s as the 13.1 L/s municipal Plummer site. Error bars were small in Plummer, ID and baseline model compared to Sandpoint, ID. Adapted and modified from Taslakyan et al. [61].
Sustainability 17 05799 g007
Table 1. LCA and TEA simulation studies for Sandpoint, ID and Plummer, ID and baseline conservative model WRRFs.
WRRFFlow Rate (L/s)Biochar Dose (g/m3)
Sandpoint, ID, USA0.60, 100, 200, 300, 400, 500
Plummer, ID, USA13.10, 100, 200, 300, 400, 500
Baseline model43.80, 100, 200, 300, 400, 500
Table 2. Summary of reactive filtration studies at different scales and applications. Flow rates presented here are the mean influent to the RF system. Serial-RF indicates a treatment path that uses two reactive filters plumbed in series. Years indicate when studies were conducted.
ConfigurationSiteApplicationFlow Rate (L/s)Type of StudyYear
RFFruitland, ID, USAMunicipal0.63Pilot [52]2006
RFHayden, ID, USAMunicipal11Full-scale installation
[44,51,58]
2008
RFMarlborough, MA, USAMunicipal127.3Full-scale installation [94]2012
RFHibbing, MN, USAMunicipal1.57Pilot [58]2018
RFVirginia, MN, USAMunicipal1.57Pilot [58]2018
RFInt. Falls, MN, USAMunicipal132Full-scale installation [58]2018
Serial-RFPlummer, ID, USAMunicipal13.89Full-scale installation, LCA, TEA [60,61]2022
RFSandpoint, ID, USAMunicipal0.55–0.59Pilot [47]2023
RFMoscow, ID, USASynthetic0.032–0.063Laboratory [47]2023
Serial-RFCitronelle, AL, USAMunicipal17.53Full-scale installation [94]2016
RFBloomer, WI, USAMunicipal16.17Full-scale installation [94]2021
RFBurrillville, RI, USAMunicipal65.72Full-scale installation [94]2017
RFIndian Head, MD, USAMunicipal26.29Full-scale installation [94]2011
Fe-BC-RFMoscow, ID, USASynthetic0.032–0.063Laboratory [47]2023
Fe-CatOx-RFMoscow, ID, USAMunicipal0.41–0.45Pilot [53]2023
Fe-CatOx-RFHorwich, UKMunicipal10–16Full-scale installation [53]2023
Fe-CatOx-RFSandpoint, ID, USAMunicipal0.55–0.59Pilot [47]2023
Fe-CatOx-BC-RFMoscow, ID, USAMunicipal0.6–1.0Pilot [47,54]2016, 2023
Fe-CatOx-BC-RFTroy, ID, USAMunicipal0.6–1.0Pilot [47,54]2016, 2023
Fe-CatOx-BC-RFSandpoint, ID, USAMunicipal0.55–0.59Pilot, LCA, TEA [47,54,61]2023
Table 3. Field pilot-scale P, As, and Hg and their removal percentage at different trials. Effluent values reported are mean values. P effluent values are total phosphorus.
ConfigurationSiteApplicationFlow Rate (L/s)TargetEffluent (mg/L)Removal (%)
RFFruitland, ID, USAMunicipal0.63As0.003391.8
RFHibbing, MN, USAMunicipal1.57Hg1.9 × 10−695.6
RFHibbing, MN, USAMunicipal1.57P0.0896.4
RFVirginia, MN, USAMunicipal1.57Hg8 × 10−781.0
RFVirginia, MN, USAMunicipal1.57P0.0394.3
RFSandpoint, ID, USAMunicipal0.55–0.59P0.1096.4
Fe-CatOx-RFMoscow, ID, USAMunicipal0.41–0.45P0.0386.9
Fe-CatOx-RFSandpoint, ID, USAMunicipal0.55–0.59P0.4488.3
Fe-CatOx-BC-RFMoscow, ID, USAMunicipal0.6–1.0P0.0283.9
Fe-CatOx-BC-RFTroy, ID, USAMunicipal0.6–1.0P0.0399.5
Fe-CatOx-BC-RFSandpoint, ID, USAMunicipal0.55–0.59P0.18–0.5188.8–95.2
Table 4. Micropollutant removal performance of detected compounds for different Fe-CatOx-BC-RF configurations. ❶ = Moscow (Fe-CatOx-RF). ❷ = Sandpoint (RF). ❸ = Sandpoint (Fe-CatOx-BC-RF; 4% Iron Pacific Biochar). ❹ = Sandpoint (Fe-CatOx-BC-RF; Native Pacific Biochar). ❺ = Sandpoint (Fe-CatOx-BC-RF; Biosolid Biochar). ❻ = Moscow (Fe-CatOx-BC-RF; 0.5% Iron Modified Cool Planet Biochar). ❼ = Hayden (RF). Adapted and modified from Yu et al. [47].
Excellent (>90%)Good (70–90%)Fair (40–70%)Low (20–40%)Poor (<20%)
Analytes
Acetaminophen❺❼
Androstenedione
Bisphenol A❶❷❸❹❺❻❼
Caffeine❶❷❸❹❺❻❼
Carbamazepine❶❷❸❹❺❻
DEET❶❸❹❺❻
Diclofenac❶❷❸❹❺❻
Dilantin❶❷❸❹❻
Estrone❷❸❹❺❻
Fluoxetine❶❷❸❹❺❻
Gemfibrozil❶❷❸❹❺❻❼
Hydrocodone❶❷❸❹❺❻
Ibuprofen❶❷❸❹❻❼
Meprobamate❶❸❻❷❹
Methadone❶❷❸❹❻
Naproxen❶❷❸❹❺❻❼
Oxybenzone❷❸❹
Salicylic Acid
Sulfamethoxazole❶❷❸❹❻❼
Trimethoprim❶❷❸❹❺❻
Table 5. P extractable nutrient content of native, recovered, and reject biochar in Sandpoint, ID field pilot trials (n = 1–2). Fe-BCP = 4% Fe-amended Pacific biochar; BCP = native Pacific biochar; BCB = biosolid biochar. Adapted and modified from Yu et al. [47]. (-) = Not determined.
P (mg/kg BC)N (mg/kg BC)
TotalFormic Acid Extractable PTotalKCI Extractable NO3
Fe-BCPNative7571881014
Recovered1600 (2.1×)206 (11.4×)3040 (3.8×)510 (36.4×)
Reject7510 (9.9×)199 (11×)4030 (5.0×)413 (29.5×)
BCPNative80612479016
Recovered931 (1.2×)434 (3.5×)680 (0.86×)111 (6.9×)
Reject14,200 (17.6×)300 (2.4×)4910 (6.2×)146 (9.1×)
BCBNative46,400636029,000-
Recovered45,900 (0.99×)4480 (0.70×)27,600 (0.95×)-
Table 6. Full-scale removal of P, Hg, Cu, and N and removal percentages at different site trials. Effluent values reported are mean values. P effluent values are total phosphorus; N effluent values are total nitrogen. (-) = not specified. Full-scale installations are typically operated to achieve discharge permit levels of contaminants rather than optimization for maximum removals. Data extracted from [53,94].
ConfigurationSiteApplicationFlow Rate (L/s)TargetEffluent (mg/L)Removal (%)
RFHayden, ID, USAMunicipal11Hg4.6 × 10−753
RFHayden, ID, USAMunicipal11P0.0398.7
RFMarlborough, MA, USAMunicipal127.3P0.7–1.077.8–93
RFInt. Falls, MN, USAMunicipal132Hg2.7 × 10−696.9
RFInt. Falls, MN, USAMunicipal132P0.5983.2
Serial-RFPlummer, ID, USAMunicipal13.89P0.0597.5
Serial-RFCitronelle, AL, USAMunicipal17.53P0.02299.0–99.9
RFBloomer, WI, USAMunicipal16.17P0.07590.6
RFBurrilleville, RI, USAMunicipal65.72Cu0.007550
RFBurrilleville, RI, USAMunicipal65.72P0.0884–94.7
RFIndian Head, MD, USAMunicipal26.29N1.5-
RFIndian Head, MD, USAMunicipal26.29P0.30-
Fe-CatOx-RFHorwich, UKMunicipal10–16P0.1990
Disclaimer/Publisher’s Note: The statements, opinions and data contained in all publications are solely those of the individual author(s) and contributor(s) and not of MDPI and/or the editor(s). MDPI and/or the editor(s) disclaim responsibility for any injury to people or property resulting from any ideas, methods, instructions or products referred to in the content.

