Abstract
In order to elucidate the factors regulating nutrient dynamics in plant–soil interactions across various latitudes within the karst climax community, this study focused on the karst forest climax community in Guizhou Province, Southwest China. We analyzed and compared the differences in carbon, nitrogen, and phosphorus content, as well as stoichiometry, in plant leaves and soils under various growing conditions. Additionally, redundancy analyses were conducted to investigate the stoichiometric correlations between plants and soil. The research findings indicate the following: (1) Leaf carbon content (LCC) and the carbon-to-nitrogen ratio (LCN) exhibit significant differences across various latitudes, with the lowest values observed in high-latitude regions. (2) Soil organic carbon (SOC) and the carbon-to-nitrogen ratio (SCN) also show significant variations across latitudes, with the lowest concentrations found in high-latitude regions and the highest in low-latitude regions. (3) The variability in leaf nutrient element ratios among karst region climax communities is greatest in low-latitude areas. This study found that the carbon content (LCC), nitrogen content (LNC), and carbon-to-nitrogen ratio (LCN) of leaves in karst climax community plants decrease as latitude increases. This suggests that plants regulate the nutrient utilization efficiency of carbon content (LCC), nitrogen content (LNC), and phosphorus content (LPC) in their leaves to maintain the nutrients necessary for their growth and development along the latitudinal gradient. The sensitivity of soil organic carbon (SOC), carbon-to-nitrogen (SCN), and carbon-to-phosphorus (SCP) ratios to latitudinal changes were particularly pronounced in the karst climax community. Additionally, plant leaf stoichiometry was significantly influenced by soil phosphorus content (SPC) in mid- and high-latitude regions, while factors other than soil nitrogen content (SNC) had a more substantial impact on plant leaf stoichiometry in low-latitude areas. The findings of this study are highly significant for guiding nutrient management in karst forest ecosystems and for the restoration of degraded karst forest vegetation.
1. Introduction
Ecological stoichiometry is the study of the balance of multiple chemical elements—primarily carbon (C), nitrogen (N), and phosphorus (P)—in ecosystem processes. It is a crucial method for examining the equilibrium and interactions among different components of ecosystems. Currently, the ecological stoichiometry of C, N, and P is a prominent area of ecological research [1]. This approach has been extensively applied in various contexts, including the succession of plant communities, individual growth, the identification of limiting nutrients, and the analysis of ecosystem stability [2]. Understanding the nutrient regulatory factors that govern plant–soil interactions through the lens of ecological stoichiometry is of significant practical importance. It aids in revealing the coupling relationships and covariance patterns of elements in ecological processes, thereby facilitating the sustainable use of natural resources [3]. With the rapid advancement of ecological chemometrics, an increasing number of scholars are focusing on various aspects of this technique. Previous authors have reported on the eco-chemometric characteristics of soils in different karst ecosystems [4,5]. Recently, a researcher conducted a study on ecological stoichiometry in karst regions and demonstrated that the growth of plant communities in these areas can influence the variations in ecological stoichiometry [6]. It is well known that carbon (C), nitrogen (N), and phosphorus (P) are essential elements that sustain life, with nitrogen and phosphorus having a particularly significant impact on terrestrial ecosystems on Earth [7]. Their concentrations can influence the composition of plant communities and productivity levels, while their biogeochemical processes regulate systemic nutrient cycling [8]. Therefore, exploring the roles of carbon, nitrogen, and phosphorus in plants and soil is crucial for gaining a deeper understanding of community species diversity, plant functional characteristics, and ecological dynamics [9]. Clarifying the intrinsic relationships among these biogeochemical elements in terrestrial ecosystems can enhance our understanding of nutrient cycling and the sustainability of these ecosystems.
Karst regions are characterized by high heterogeneity, vulnerability, and complexity. It is essential to study the genesis of plant communities in these areas in response to habitat heterogeneity and the adaptation of plant traits. The latitudinal gradient, which encompasses multiple environmental factors, is crucial for examining the latitudinal patterns of species diversity. This exploration clarifies plant responses to environmental changes and enhances our understanding of plant community biodiversity in the context of global climate change [10]. Due to human interference and degradation, karst forests in Southwest China have suffered varying degrees of damage, making the restoration of these degraded forest ecosystems a significant focus within restoration ecology [11]. Existing studies have examined plant ecological strategies [12], species richness and community structure [13], as well as biodiversity and soil multifunctionality [14] in the context of vegetation restoration in degraded karst forests. However, there is a paucity of research focusing on the eco-chemometrics of carbon, nitrogen, and phosphorus in plant leaves and soil within the climax community across different latitudinal distributions. Additionally, a comprehensive and systematic understanding of nutrient utilization mechanisms during the restoration of karst vegetation remains lacking. Therefore, this paper investigates the karst climax community in Southwest China, aiming to explore the relationship between the nutrient characteristics of plant leaves and soil C, N, and P of the dominant species within this community, as well as the plant leaf–soil stoichiometry across varying latitudinal gradients. We propose two scientific hypotheses: (1) Do latitudinal differences significantly affect plant and soil stoichiometry? (2) Is there a correlation between plant–soil stoichiometry at different latitudes? This study seeks to elucidate the nutrient regulation mechanisms of plant–soil interactions in karst forest climax communities and provide a theoretical foundation for the growth and nutrient management of karst forest vegetation.
2. Materials and Methods
2.1. Study Area
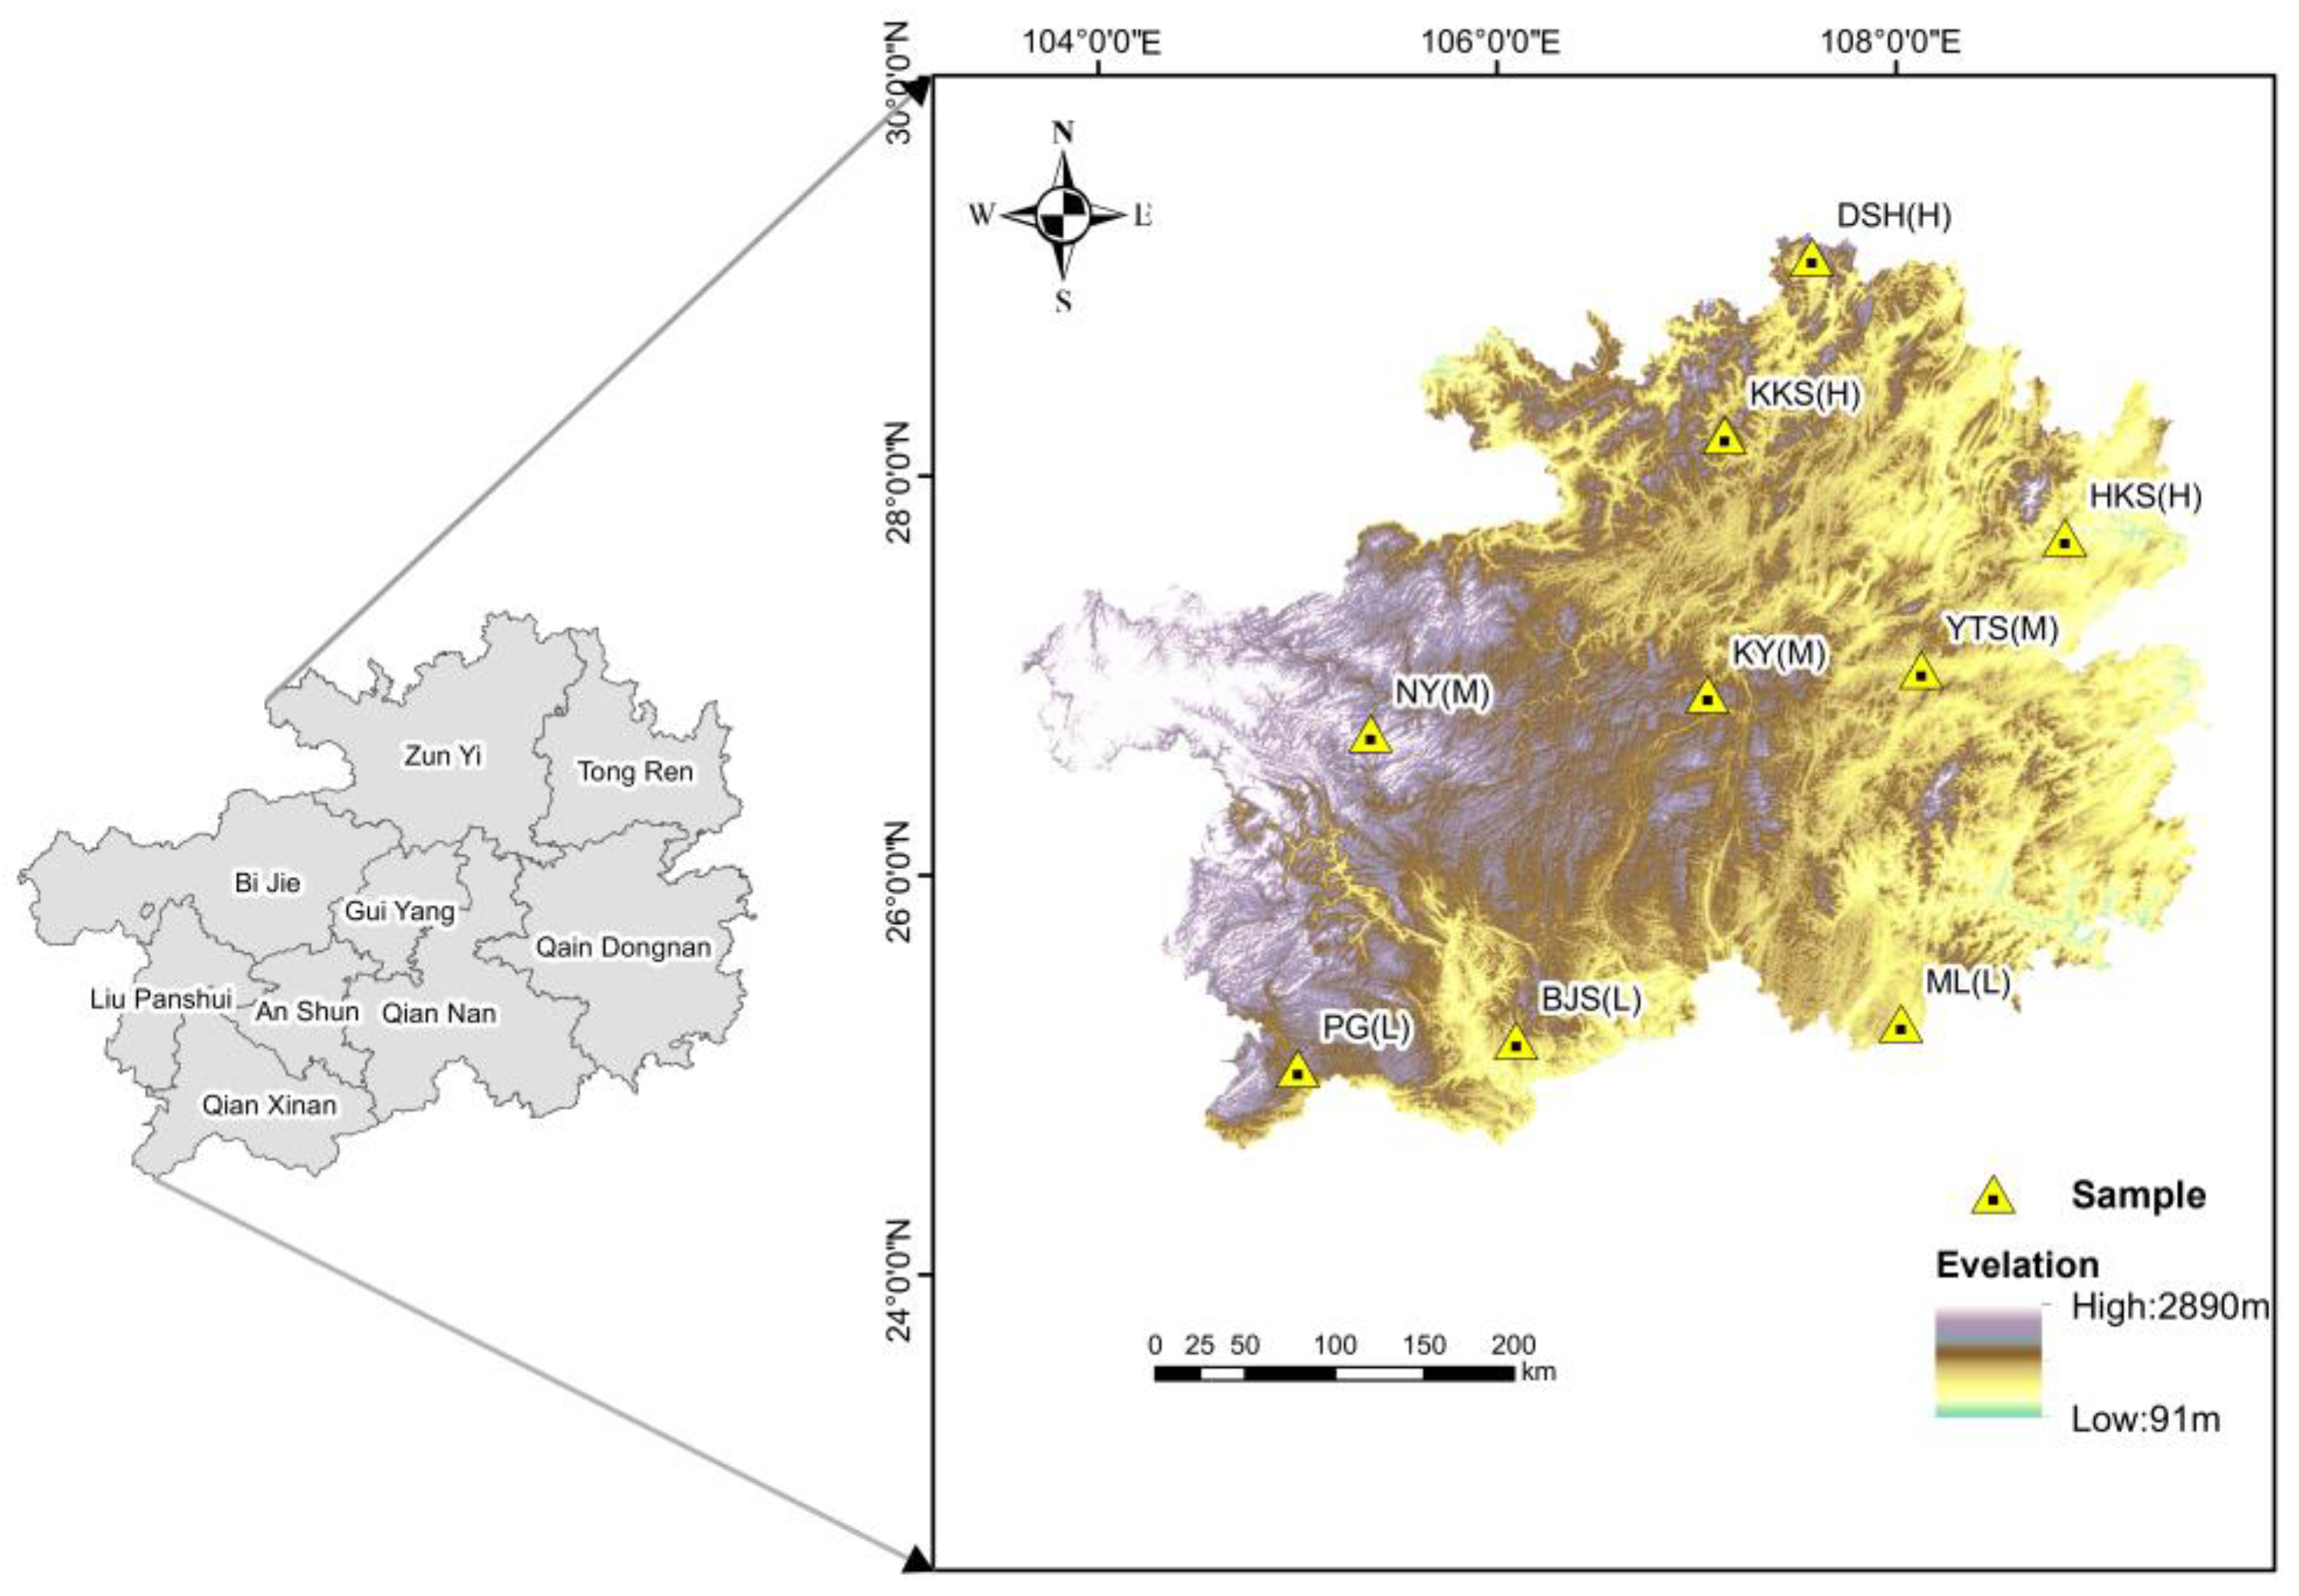
In this study, nine climax plant communities in Guizhou Province, China, were selected as study samples (Figure 1). The sample plot we selected is situated within a nature reserve, where it experiences relatively minimal human interference. The external characteristics of the plants are prominent, primarily consisting of trees. Through consultations with relevant staff in the nature reserves, we surveyed the study area in the field and used it as a sample site for this study.

Figure 1.
Sample point diagram in the study area. “L”denotes the low-latitude plant apex community region, “M” signifies the mid-latitude plant apex community region, and “H” indicates the high-latitude plant apex community region. All definitions of latitude used in this study are relative concepts and do not have absolute meanings. They apply exclusively to our study area and are not representative of broader definitions. For the purposes of our research, we categorize the different latitudes of our study area into high latitude, middle latitude, and low latitude.
Due to the fragility of habitats in karst regions and the sporadic distribution of plant species, we determined that the area of the selected plot was 900 m2 (30 m × 30 m). To ensure ecological significance, three sample plots (three replicates) were selected for each sampling point, with a distance of approximately 100 m between the plots. Subsequently, the study area was established, and the diversity of plant communities was investigated. Plant leaves and soil samples were collected from the study area during the peak growth season.
2.2. Sample Setting
Refer to Fang Jingyun [15] and other methods for investigating community composition. Each sample plot was divided into nine 10 m × 10 m subplots, with each subplot designated for surveys of trees, shrubs, and herbs. The survey area for the shrub quadrants is 4 m × 4 m, while the survey area for the herb quadrants is 2 m × 2 m.
2.3. Sample Collection and Processing
In each karst climax community sample, 3 to 5 healthy plants were randomly selected. Healthy leaves with relatively consistent ages were collected from four different directions, marked accordingly, and placed in envelopes for storage. Simultaneously, soil samples were collected at each site using the five-point method along a diagonal line. Three soil samples were taken from a depth of 0–20 cm within the sample square. Due to the thin layer, the depth may be less than 20 cm, and the actual thickness should be recorded. The samples were marked and placed in self-sealing bags, and their fresh weight was measured for soil bulk density and water content determination. Additionally, approximately 1 kg of soil samples from each layer was collected, placed in self-sealing bags, and labeled for elemental analysis. The plant samples were deactivated at 105 °C for 30 min, then dried at 65 °C for 48 h, and ground through a 0.15 mm sieve using a mixing ball mill (MM400, Retsch, Germany). The soil samples were placed in an oven at 105 °C and dried to a constant weight. After removing the impurities, they were stored in a ventilated area to dry in the shade. Once ground, the soil samples were passed through a 0.15 mm sieve for storage (Table 1).

Table 1.
Sample plot basic information table.
2.4. Determination of Plant Functional Characteristics and Soil Samples
Determination of plant and soil organic carbon with reference to Bao [12]. For the analysis of plant samples, digestion was performed using the H2SO4-H2O2 method. Total nitrogen was measured using the Indophenol Blue colorimetric method, while total phosphorus was assessed using the Molybdenum–Antimony colorimetric method [16]. For soil samples, total nitrogen was determined by the Kjeldahl method, and total phosphorus was measured using the NaOH-fused–Molybdenum–Antimony colorimetric method [17,18].
2.5. Data Processing
The One-Sample Kolmogorov–Smirnov Test, commonly referred to as the K-S test, was employed to assess the normal distribution of the data. If the data does not conform to a normal distribution, the Kruskal–Wallis (K-W) test, a rank-sum test, is utilized. Conversely, if the data adheres to a normal distribution, one-way analysis of variance (one-way ANOVA) is applied to compare the differences in various stoichiometric contents of plant leaves and soil across low-latitude, mid-latitude, and high-latitude communities. When conducting multiple comparisons, it is essential to first test for the homogeneity of data variances. If the variances are homogeneous, the least significant difference (LSD) method is employed for multiple comparisons. If the variances are not homogeneous, Tamhané’s T2 method is used. To further elucidate the relationships between leaf–soil chemical ratios in karst forests across various latitude gradients, this study employed redundancy analysis (RDA). Initially, the data were normalized, followed by trend-corrected correspondence analysis (DCA). The maximum values of the four sorting axis gradient lengths (LGA) for leaf chemical ratios in low-latitude, mid-latitude, and high-latitude communities were 1.32, 2.56, and 1.99, respectively, all of which were below 3. Consequently, RDA was utilized to analyze the relationship between plant leaves and soil chemical metrics. RDA allows for the simultaneous representation of leaf and soil chemical metrics on a single graph, providing a more intuitive visualization of the relationship between the two. Values are expressed as mean ± standard deviation. This study utilizes packages(“reshape2”, “patchwork”, “ggpubr”, “ggsci”, “grDevices”, “ggplot2”) such as in R version 4.3.2 to perform box plot analysis. The package(“Vegan”) was employed to conduct redundancy analysis (RDA) of leaves and soil. All statistical analyses and visualizations were completed using R version 4.3.2.
3. Results
3.1. Chemometric Characteristics of Leaves Across Different Latitude Gradients
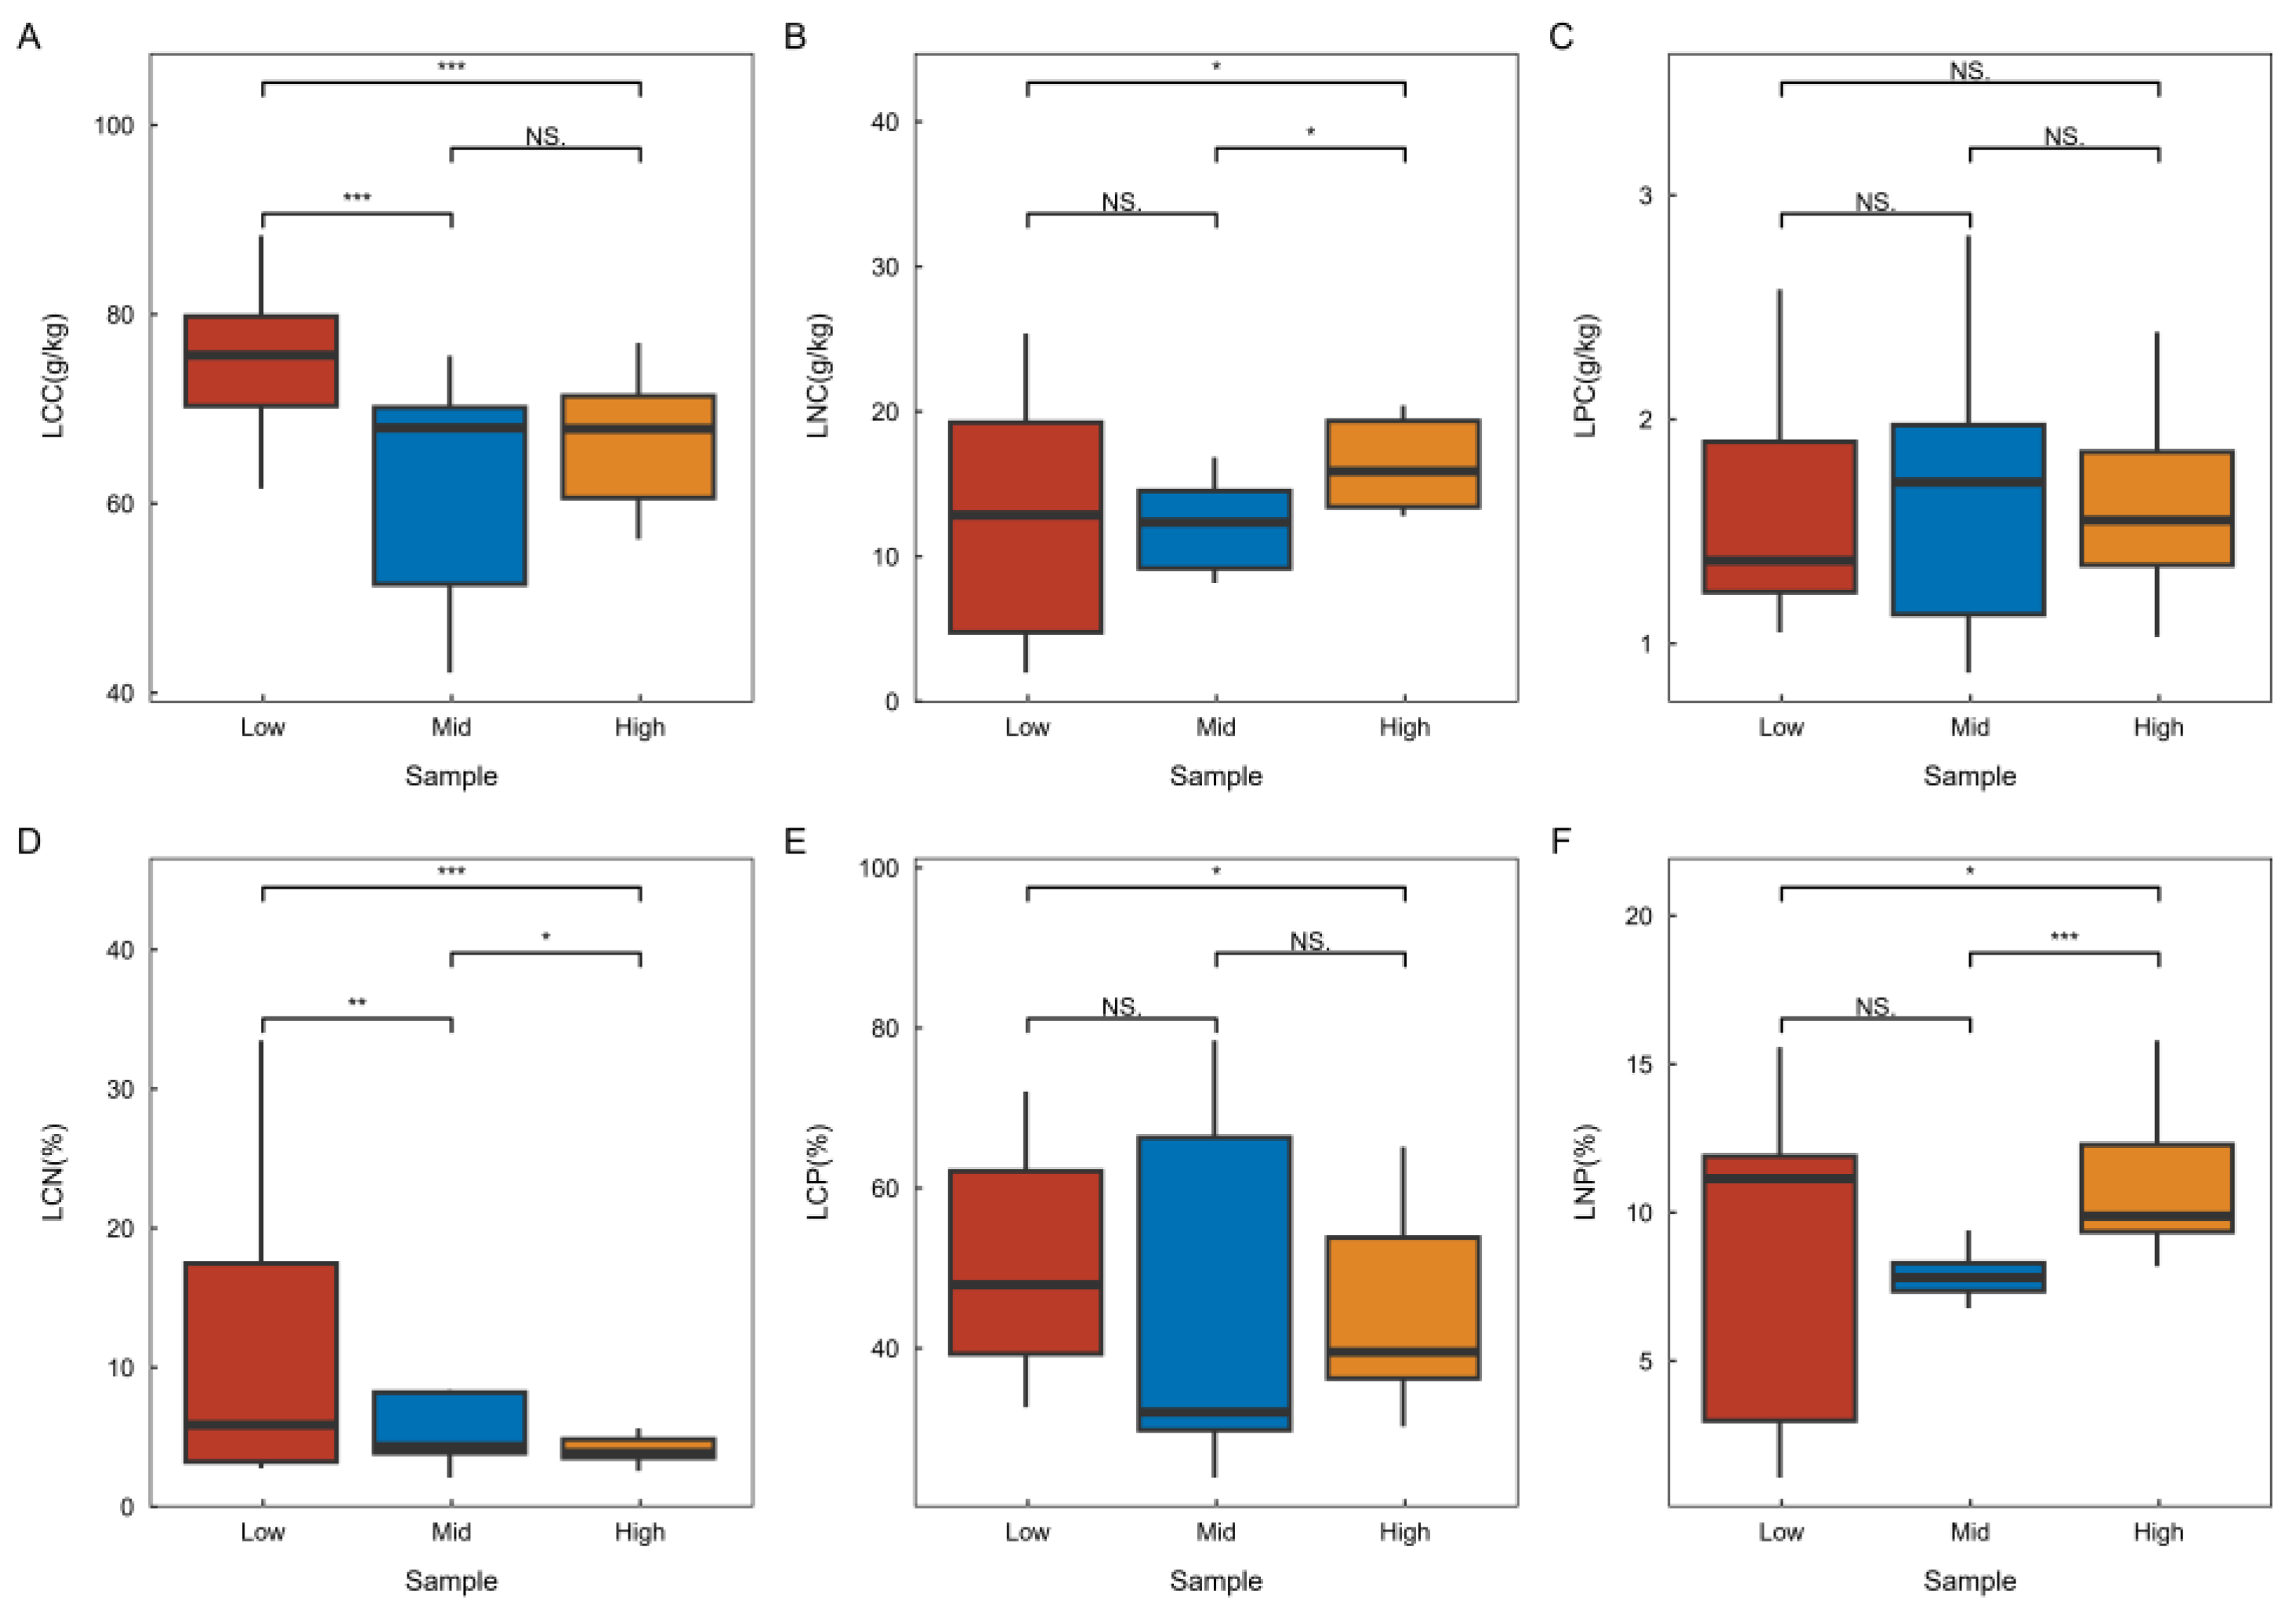
Refer to Figure 2 for the chemometric characteristics of plant leaves across various latitudes in the karst climax community. The research findings indicate that leaf carbon and the carbon-to-nitrogen ratio exhibit significant differences at different latitudes, with the lowest values observed at high latitudes and the highest at low latitudes. This trend suggests a gradual decrease in these parameters with increasing latitude. Conversely, leaf nitrogen and the nitrogen-to-phosphorus ratio show significant differences across latitudes, with the highest values found at high latitudes and the lowest at low latitudes, indicating a gradual increase with increasing latitude. Additionally, there were no significant differences in leaf phosphorus across latitudes, nor were there significant differences in the leaf C:P ratio between adjacent latitudes.

Figure 2.
Characteristics of chemometric changes in plant leaves at varying latitudes. “Low” denotes the low-latitude plant apex community region, “Mid” signifies the mid-latitude plant apex community region, and “High” indicates the high-latitude plant cliamx community region. In the statistical domain, one-way ANOVA was employed for comparative analyses. An asterisk (*) indicates a significant difference (p < 0.05), two asterisks (**) indicate a highly significant difference (p < 0.01), three asterisks (***) indicate a highlest significant difference (p < 0.001) and no significant difference, indicating a lack of ecological statistical significance.
3.2. Soil Stoichiometry Characteristics Across Different Latitude Gradients
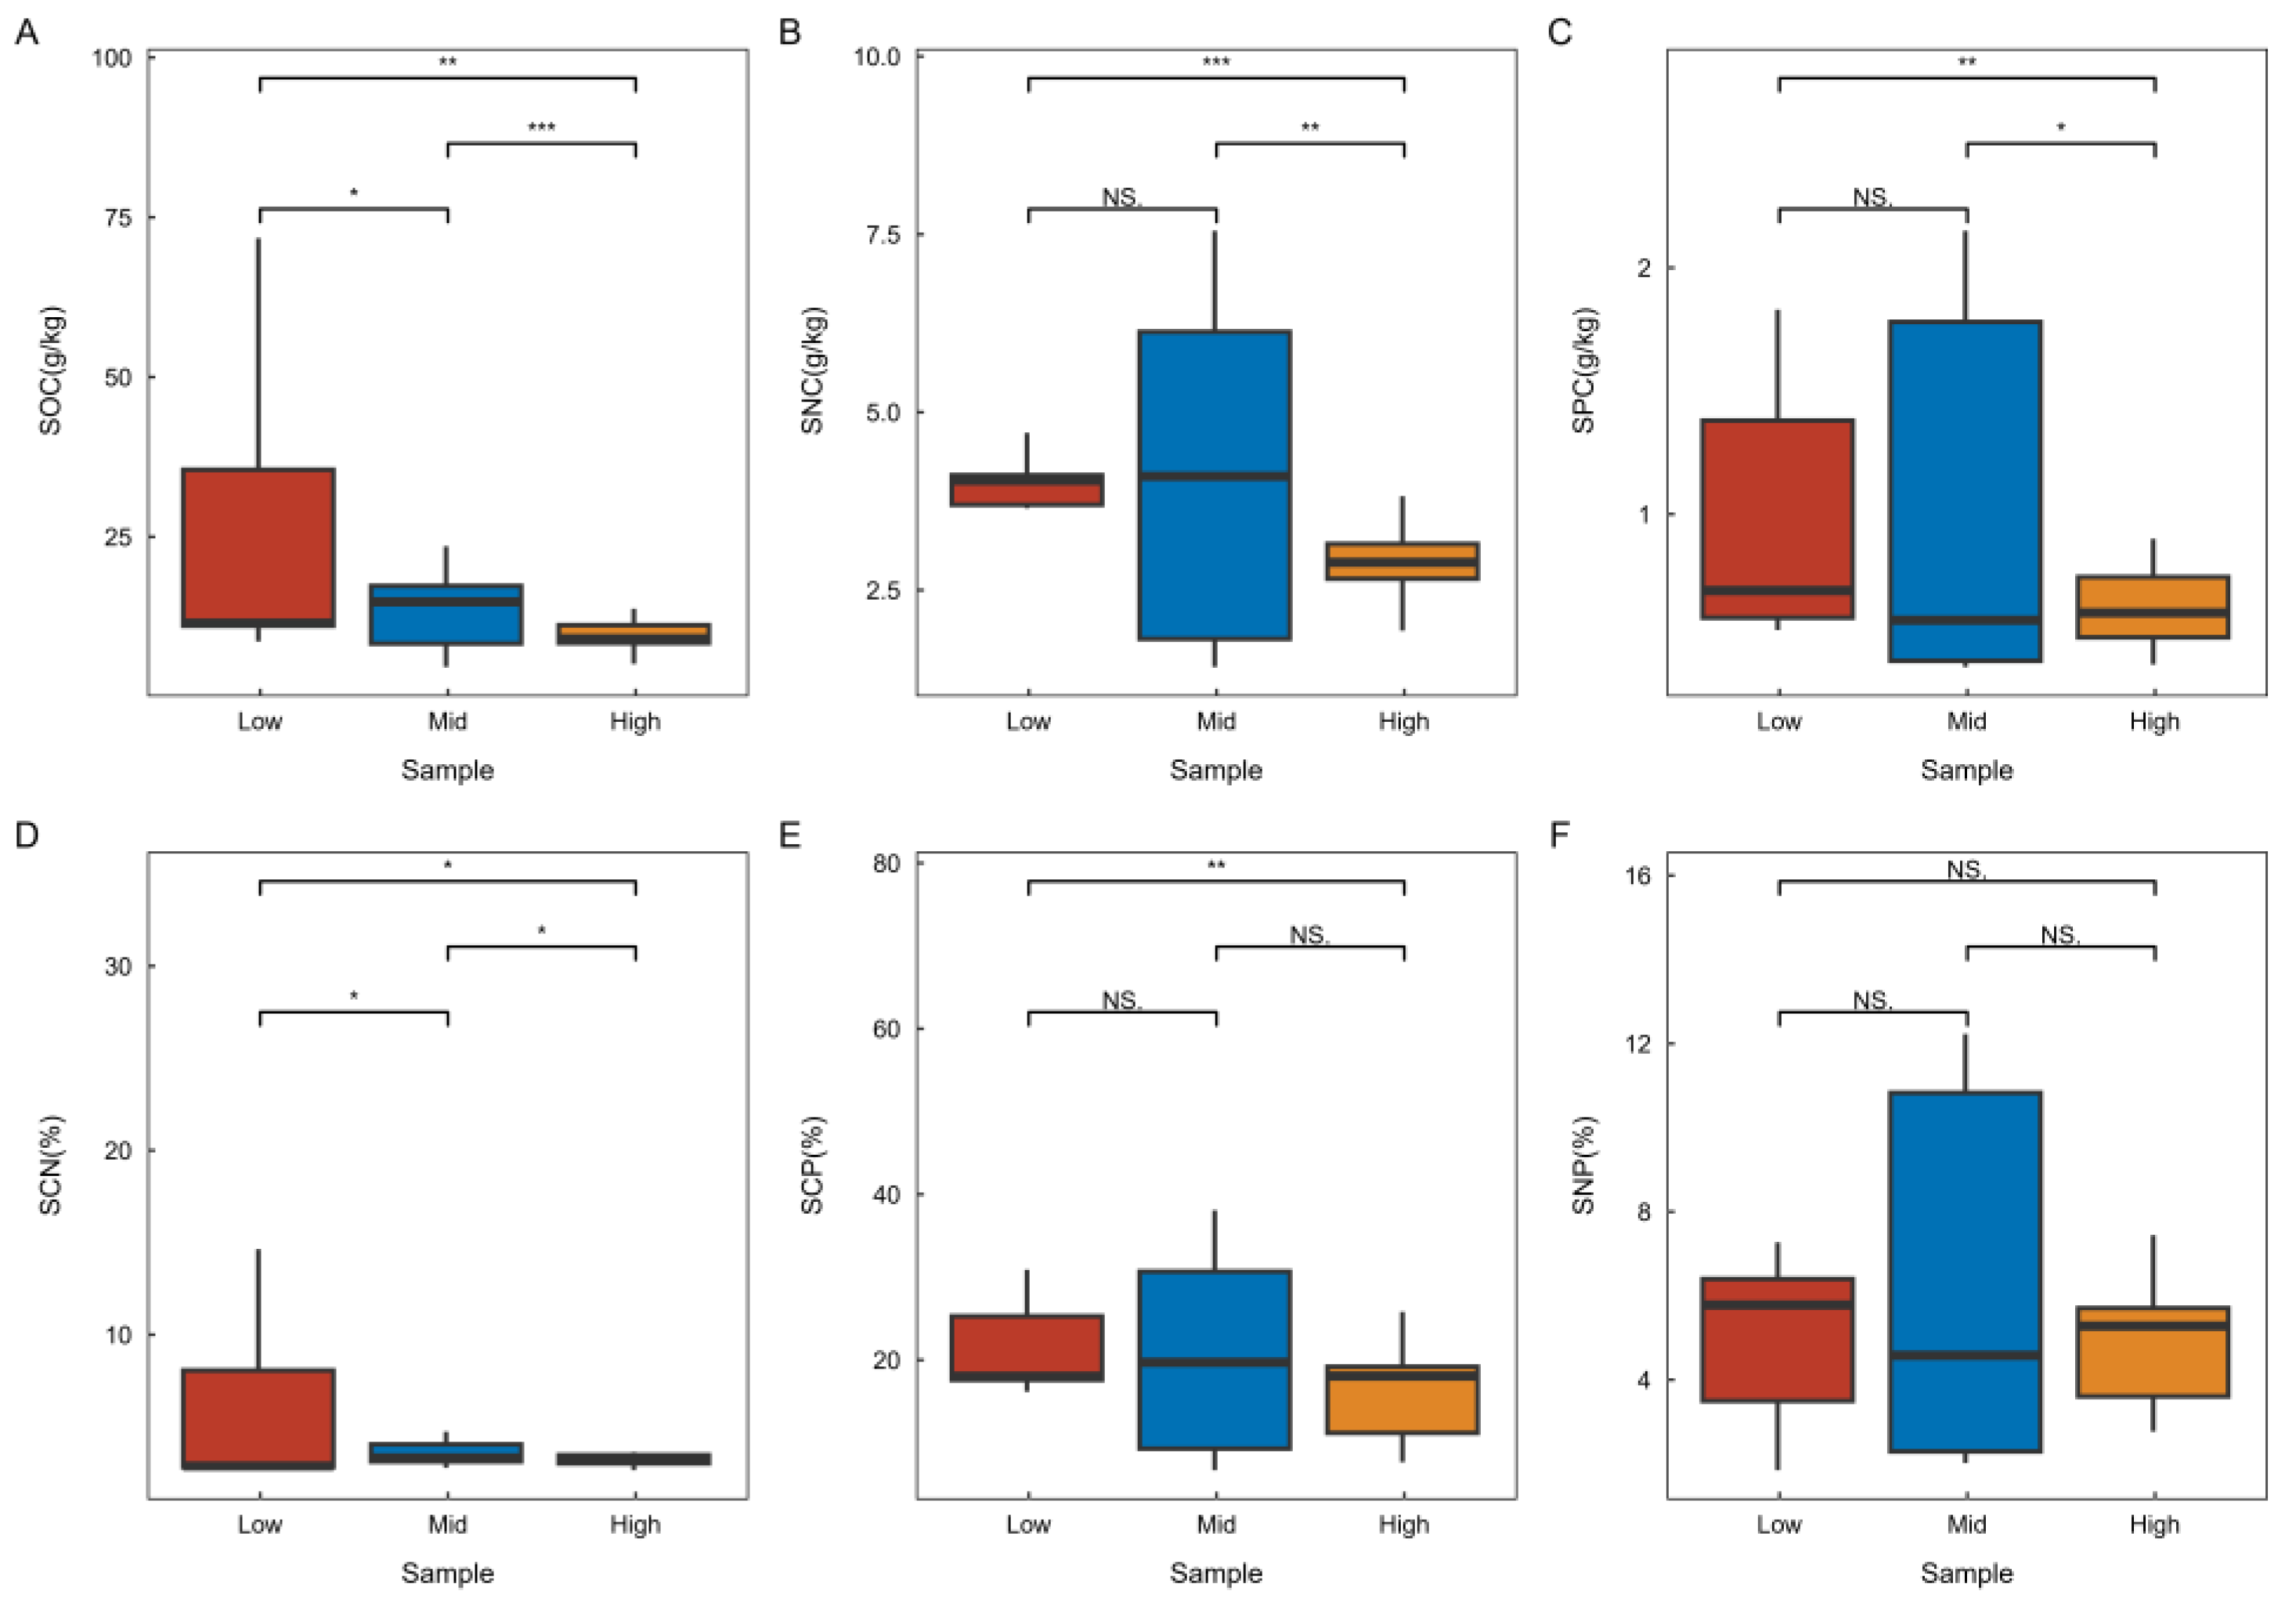
Refer to Figure 3 for the soil stoichiometry characteristics across various latitudes in karst climax communities. The research findings indicate that soil carbon and the carbon-to-nitrogen ratio exhibit significant variations at different latitudes, with the lowest values observed in high latitudes and the highest in low latitudes. This trend suggests that both parameters gradually decrease with increasing latitude. Conversely, soil nitrogen and phosphorus show significant differences across latitudes, with the highest concentrations found in high latitudes and the lowest in low latitudes, indicating that these nutrients gradually increase with increasing latitude. Additionally, the soil nitrogen-to-phosphorus ratio did not demonstrate significant differences across latitudes, nor did the soil carbon-to-phosphorus ratio show significant differences between adjacent latitudes.
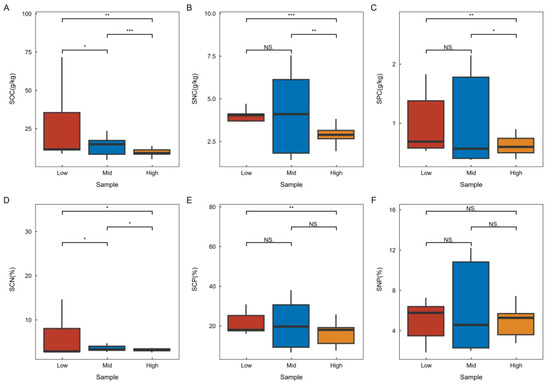
Figure 3.
Characteristics of soil stoichiometry changes at different latitudes. SOC—Soil Organic Carbon, SNC—Soil Total Nitrogen Content, SPC—Soil Total Phosphorus Content, SCN—Soil Carbon-Nitrogen Ratio, SCP—Soil Carbon-Phosphorus Ratio, SNP—Soil Nitrogen-Phosphorus Ratio. The legend and the necessary labeling can be found in Figure 2.
3.3. Variation in Leaf and Soil Stoichiometry Across Different Latitude Gradients
The research results presented in Table 2 indicate that the variance factor of leaf character stoichiometry in the climax community of karst areas is highest in low-latitude regions, measuring 14.55 times that of LNP, while it is lowest in high-latitude areas, at 1.37 times that of LCC. The maximum variance change was observed in the middle-latitude region, with a value of 19.59 for LCP, whereas the minimum variance change occurred in high-latitude areas, recorded at 0.37 for LPC. Additionally, the maximum coefficient of variation was found in low latitudes, at 80.35 for LCN, while the minimum coefficient of variation was noted in high latitudes, at 9.71 for LCC. Furthermore, the variance factor of soil stoichiometry in the climax community of karst areas was also highest in low latitudes, measuring 9.64 times that of SCN, and lowest in high latitudes, at 1.37 times that of SCN. The maximum variance change in soil stoichiometry occurred in low latitudes, with a value of 21.34 for SOC, while the minimum variance change was recorded in high latitudes, at 0.28 for SCN. The maximum coefficient of variation for soil stoichiometry was found in low latitudes, at 99.85 for SCN, whereas the minimum coefficient of variation was observed in high latitudes, at 8.64 for SCN.
Table 2.
Variations in leaf and soil stoichiometry at different latitude gradients.
3.4. Correlation Between Leaf and Soil Stoichiometry Across Different Latitude Gradients
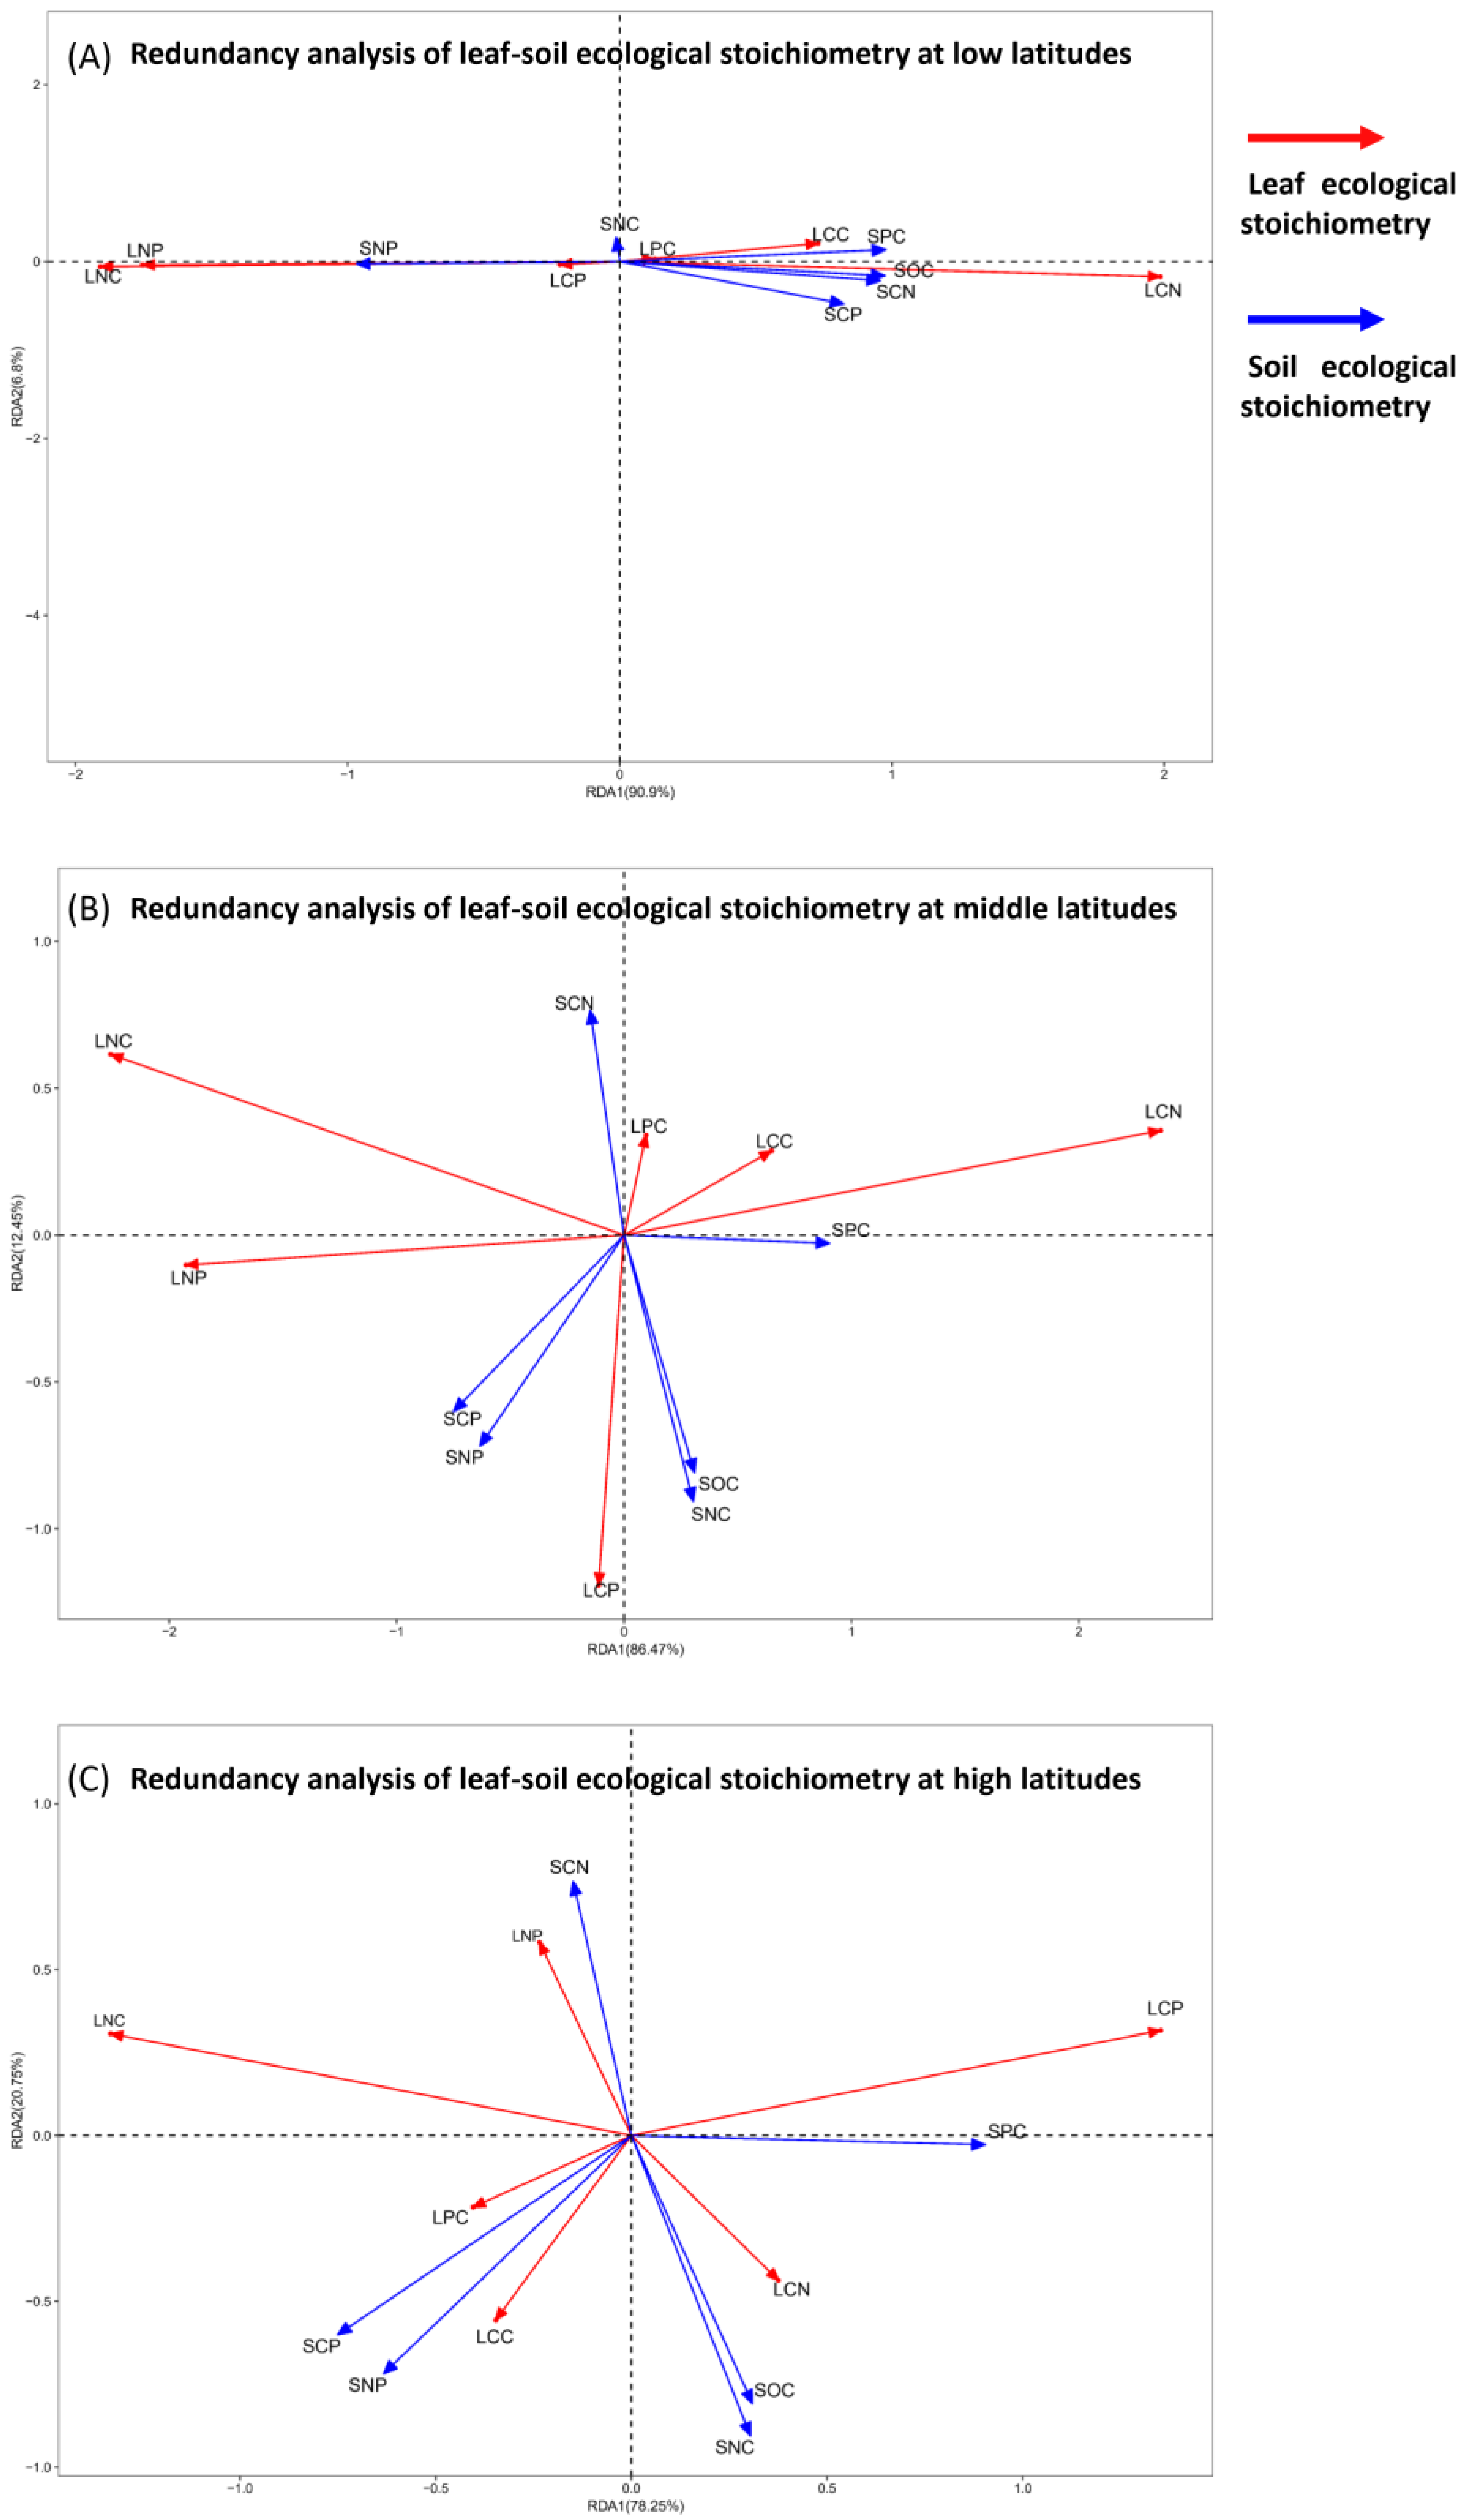
The RDA ranking results of the plant leaf–soil stoichiometry are presented in Figure 4. The interpretation percentages of plant leaf–soil stoichiometry at different latitudes are 97.70%, 98.92%, and 99.00%, indicating that the first two axes effectively explain the relationship between leaf stoichiometry and soil chemical elements, with the first axis serving as the primary axis. Therefore, the ranking results are scientifically valid. In plant communities located in low-latitude areas, with the exception of SNC, other environmental factors significantly influence plant functional traits. LCC, LPC, and LCN are positively correlated with SOC, SPC, SCN, and SCP, while they are negatively correlated with SNP. Conversely, LNC, LNP, and LCP show a positive correlation with SNP. In mid-latitude plant communities, SPC exerts the greatest influence on plant functional traits, whereas SCN has the least impact. LNC, LCC, and LPC are positively correlated with SPC and negatively correlated with SCP and SNP. Additionally, LNC and LNP are positively correlated with SCN, SCP, and SNP, while being negatively correlated with SPC. LCP is positively correlated with SCP, SNP, SOC, and SNC, but negatively correlated with SCN. In high-latitude plant communities, SPC again has the most significant impact on plant functional traits, while SCN has the least effect. LCP and SPC are positively correlated, but negatively correlated with SCP and SNP. LNP and SCN are positively correlated, while being negatively correlated with SOC and SNC. Finally, LPC and LCC are positively correlated with SCP and SNP, and LCN is positively correlated with SOC and SNC.

Figure 4.
RDA ranking diagram of plant leaf–soil stoichiometry at different latitudes. Note: The red arrow indicates leaf stoichiometry, while the blue arrow represents soil stoichiometry. The angle between the two arrows reflects the correlation between leaf and soil stoichiometry; an acute angle indicates a positive correlation, whereas an obtuse angle signifies a negative correlation. (A) represents the low-latitude area, (B) represents the middle-latitude area, and (C) represents the high-latitude area.
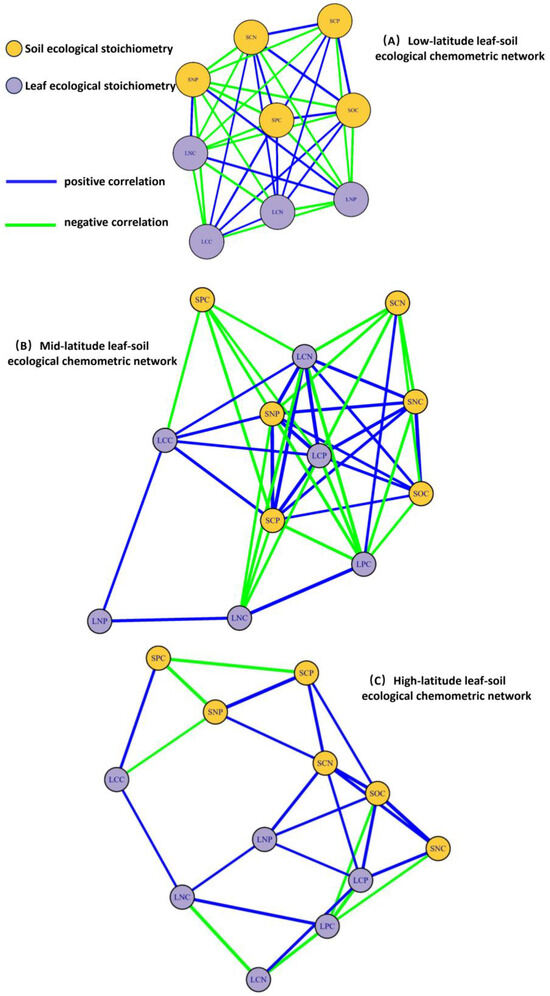
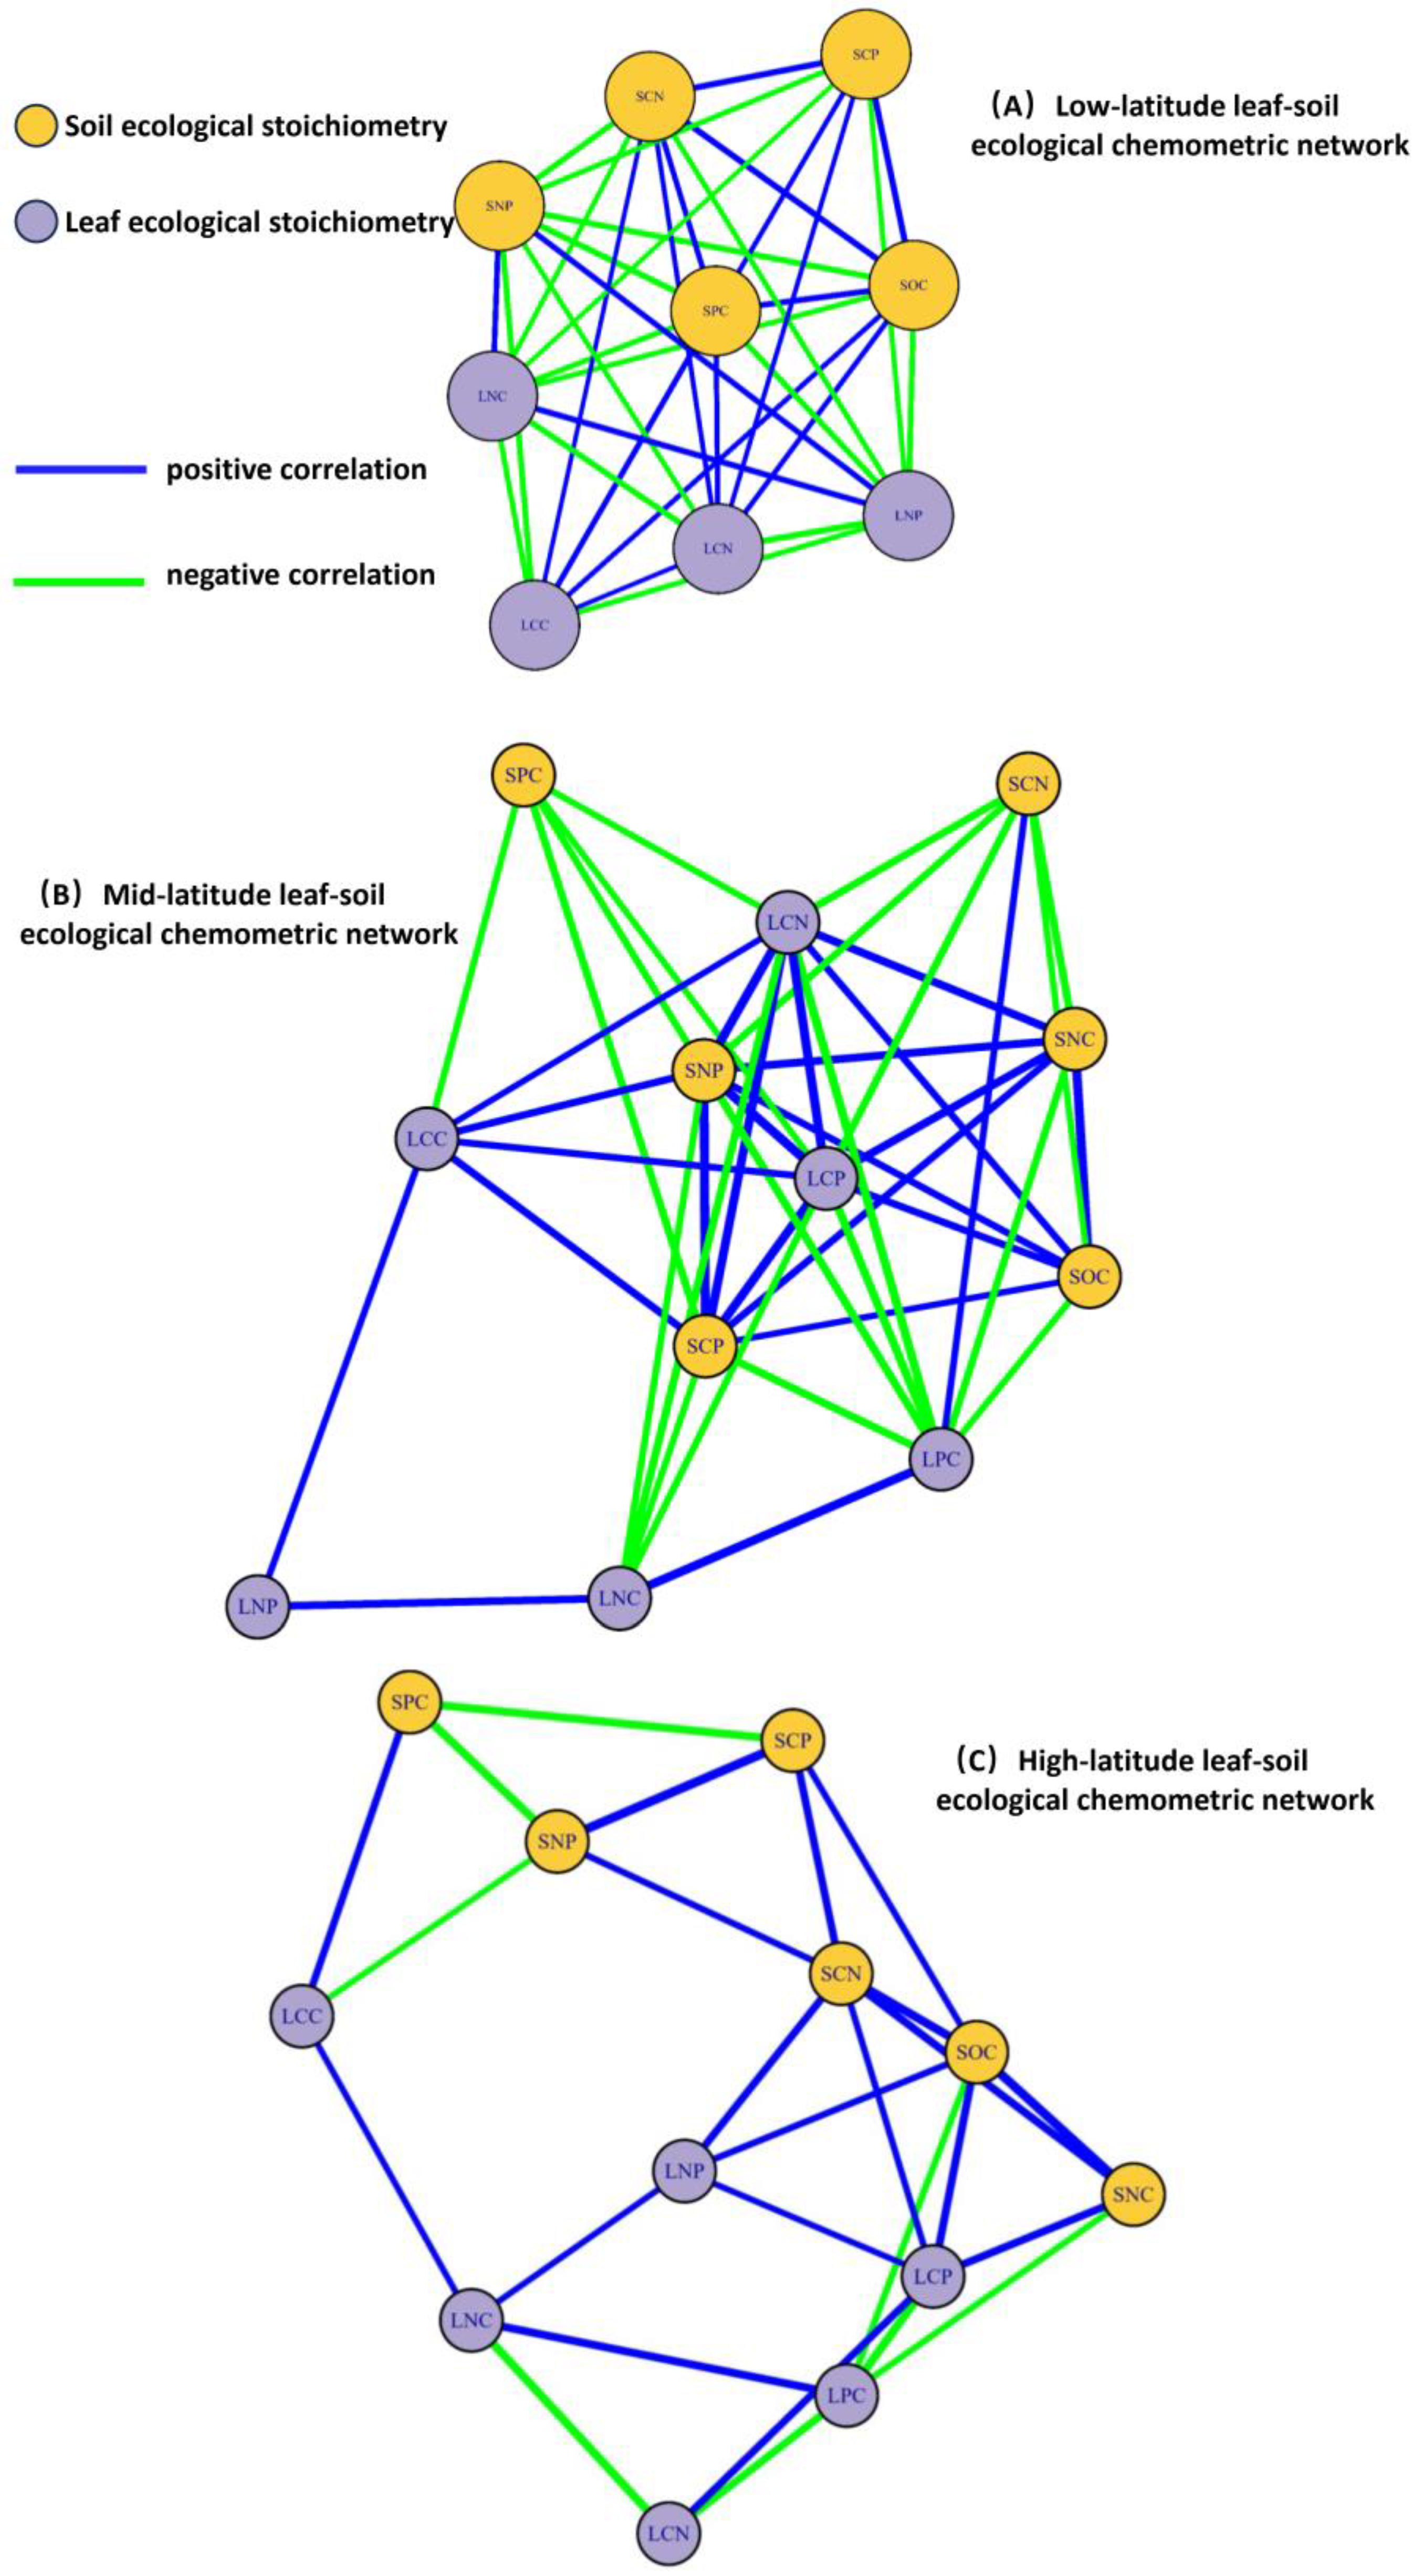
As illustrated in the Figure 5, a correlation network analysis of leaf-soil ecological chemical metrics was conducted for plant communities across different latitudes. Measurement data with a p-value of less than 0.05 were connected by correlation lines. Overall, as latitude increases, the number of network connections between leaf and soil chemical metrics gradually decreases. Specifically, plant communities in low-latitude regions exhibit the highest number of connections, totaling 43. SNC, LPC, and LCP show no correlation with other factors, while SPC occupies a central position in the network, indicating that SPC is more sensitive to changes in other factors. In mid-latitude plant communities, the number of connections between leaf and soil ecological chemical metrics is the second highest, at 37. SNP, SCP, LCP, and LCN hold central positions in the network, suggesting that these four metrics are significant ecological chemical indicators in mid-latitude regions. Conversely, the number of connections between leaf and soil ecological chemical metrics in plant communities in high-latitude regions is the lowest, at 26. SOC occupies a central position in the network, indicating that SOa crucial ecological chemical metric in high-latitude plant communities.
4. Discussion
4.1. Nutrient Uptake and Utilization by Plant Leaves Across Different Latitude Gradients
Leaf carbon (C) content is primarily influenced by the photosynthetic physiological characteristics of plants, while leaf nitrogen (N) and phosphorus (P) content are associated with their absorption and assimilation capabilities [19]. Some studies have indicated that a high C content in leaves suggests that plants exhibit slow growth but possess a strong ability to endure unfavorable external conditions [20]. Significant differences in leaf C content have been observed in karst climax communities across various latitude gradients, with higher levels found in low-latitude regions (Figure 2, Table 1). This suggests that the organic matter content in karst climax communities at lower latitudes is greater, implying that this ecosystem may have a high carbon storage capacity [21]. This phenomenon primarily occurs in peak communities located in low latitudes. To adapt to arid environments, plants increase the proportion of tissues with high carbon content, such as lignin, to protect themselves from damage. Consequently, the carbon content in leaves also rises. Simultaneously, the nitrogen content in plant leaves at low latitudes is lower than the average values observed at both mid and high latitudes (Table 1). This discrepancy may be associated with the relatively low temperatures in these regions.
In the temperature–biogeochemistry hypothesis proposed by Reich and Oleksyn [22], low temperatures affect certain physical characteristics of plants, such as the permeability of cell membranes. This, in turn, influences a series of metabolic processes, leading to reduced nitrogen absorption from the soil and resulting in lower nitrogen content in plant leaves. In this study, the phosphorus (P) content in leaves was found to be the lowest in high-latitude areas (Table 2). This phenomenon may primarily be attributed to the relatively weak weathering of rocks and soil in these regions, which is influenced by the coverage of humus layers from the climax community. The phosphorus present in the soil is mainly derived from the weathering of rock parent materials, which is exacerbated by the insufficient supply of phosphorus in the soil. Furthermore, the degree of leaf carbon-to-nitrogen (C:N) variation in low-latitude areas is significantly higher than in other regions, indicating that these areas are more affected by environmental heterogeneity. Consequently, there is greater competition for light, nutrients, and water resources among plants [23]. The study showed that vegetation growth was mainly limited by nitrogen when N:P < 14, by phosphorus when N:P > 14, and by both nitrogen and phosphorus when 14 < N:P < 16 [24]. At the national level, the average N:P ratio of leaves is 14.4, while on a global scale, it ranges from 11 to 11.8. In this study, the leaf N:P ratios of three climax communities at different latitudes are 8.53 (low latitude), 8.16 (middle latitude), and 10.81 (high latitude), respectively. These values are lower than both the global and national averages, as well as lower than the N: P ratios reported for the China grassland ecosystem (15.3), eastern China (13.5), and the areas surrounding Beijing (13.9) [25]. This indicates that karst forests are more susceptible to nitrogen limitation.
4.2. Changes in Soil Stoichiometry Across Different Latitude Gradients
In this study, we found that soil organic carbon, total nitrogen, nitrogen-to-phosphorus ratio, and carbon-to-phosphorus ratio, along with plant carbon, nitrogen, and phosphorus, gradually decreased with increasing latitude. This finding aligns with the results reported by numerous scholars [26,27], further elucidating the close relationship between the chemical element content in plants and that in the soil. Zhang Xiangru et al. [28] noted in their study on the ecological stoichiometry of soil in Robinia pseudoacacia forests on the Loess Plateau that both soil organic carbon and total nitrogen contents decreased exponentially with increasing latitude, while the total phosphorus content in the soil remained relatively unchanged. This observation closely resembles the results of the current study. The similarities in environmental conditions between the karst region and the Loess Plateau may contribute to comparable effects on plant nutrient utilization and recycling.
The changes in soil organic carbon (SOC) and total nitrogen (SNC) contents influenced by latitude exhibit similar characteristics (Figure 3). The input of carbon into the ecosystem promotes the accumulation of nitrogen and maintains the synchronous variation in carbon and nitrogen [10]. The primary source of both elements in the soil is plant residues, which decline due to the gradual reduction in the biomass of karst climax communities and surface plant litter as latitude increases. Conversely, total soil phosphorus content (SPC) tends to increase with latitude. SPC is primarily influenced by climate and soil type. Specifically, climate affects the rate of soil weathering and the leaching intensity of nutrient elements [10]. As latitude increases, temperatures in the study area rise, and elevated temperatures accelerate the leaching rate of SPC. Therefore, one would expect SPC to decrease, which is clearly consistent with the findings of this study [29,30].
Therefore, the variation in total soil phosphorus content (SPC) in karst climax communities with latitude should be understood as being influenced by soil types. While the nitrogen-to-phosphorus (N:P) ratio does not change significantly with latitude, both the N:P and carbon-to-phosphorus (C:P) ratios decrease as latitude increases [21]. In humid and warm regions, changes in water availability and temperature due to latitude effects enhance productivity and subsequently increase soil C:P content. Consequently, the N:P and C:P ratios decline; Reich et al. [22] noted that nitrogen is the primary limiting factor in soils at high latitudes, leading to a decrease in total nitrogen-to-total phosphorus (N:P) ratios with increasing latitude. The observed changes in soil N:P and C:P ratios in karst climax communities should be interpreted as indicative of nitrogen limitation in these soils. Changes in environmental factors with latitude significantly influence the characteristics of plant tissues [31]. For instance, variations in latitude may impair the function of plant cells by altering enzyme activities, which in turn affects the metabolic processes of plants. Additionally, latitude impacts soil organic matter through decomposition and mineralization, which can either increase or decrease the availability of nitrogen (N) and phosphorus (P) in the soil, thereby restricting plant growth and development. Both of these effects ultimately manifest as changes in the chemometric characteristics of plant tissues, specifically carbon (C), nitrogen (N), and phosphorus (P). From these findings, it can be inferred that latitude plays a crucial role in influencing changes in soil organic carbon (SOC) as well as the C:N and C:P ratios [32].
4.3. Chemometric Relationships Between Plant Leaves and Soil Across Different Latitude Gradients
Soil serves as the primary source of essential nutrient elements for plants. Variations in the carbon (C), nitrogen (N), and phosphorus (P) content of plants, as well as their stoichiometric ratios, reflect how plants respond to their soil environment. The stoichiometry of soil C, N, and P significantly influences the ecological chemistry of plant leaves. Metrology plays a crucial role in this context [20]. In this study, the interpretation rates of soil stoichiometry on leaf stoichiometry in climax communities at low, middle, and high latitudes were found to be 97.70%, 98.92%, and 99.00%, respectively. Notably, soil stoichiometry exhibited the highest interpretation rate on plant leaf stoichiometry at high latitudes, indicating that the stoichiometry of plant leaves in these regions is most strongly influenced by soil stoichiometry. This finding aligns with the research results of Bagedeng et al. [20]. The carbon-to-nitrogen (C:N) and carbon-to-phosphorus (C:P) ratios of plant leaves indicate the ability of plants to absorb nutrients and assimilate carbon, which reflects their nutrient utilization efficiency [33]. These ratios are positively correlated with soil C:P and N:P ratios at middle and low latitudes (Figure 4A,B). This suggests that soil characteristics at these latitudes have a significant impact on the nutrient utilization efficiency of plants. Furthermore, the correlation coefficient between the leaf C, N, and P stoichiometric ratios and the soil C, N, and P stoichiometric ratios is greater than that between the C, N, and P content. This indicates that the influence of soil nutrient content on plants is primarily regulated by ecological stoichiometric ratios [34,35].
The relationship between leaf and soil ecological stoichiometry became more pronounced with increasing latitude (Figure 5). In low-latitude regions, habitat characteristics resulted in plants exhibiting a reduced capacity for carbon sequestration. Most carbon elements necessary for growth were absorbed from the soil, leading to a positive correlation between soil organic carbon (SOC) and leaf carbon content (LCC) (Figure 4A), which aligns with the findings of Nie et al. [36]. In contrast, high-latitude regions demonstrated a stronger capacity for carbon sequestration, consistent with our observations (Figure 5). Additionally, leaves exhibited lower leaf carbon content (LCP), resulting in a positive correlation between soil carbon content (SCP) and leaf phosphorus content (LPC), while showing a negative correlation with LCP. Plants in mid-latitude regions had lower soil nitrogen content (SNC) but higher nitrogen demand, which restricted plant growth and resulted in lower leaf nitrogen content (LNC); consequently, soil nitrogen content (SCN) was negatively correlated with LNC. These results indicate that as latitude increases, soil ecological stoichiometry gradually shifts from phosphorus content to organic carbon content, while leaf ecological stoichiometry transitions from phosphorus content to nitrogen content.
5. Conclusions
(1) The concentrations of carbon (C), nitrogen (N), and the C:N ratio in plant leaves within karst climax communities all decreased with increasing latitude. This trend indicates that plants regulate the nutrients essential for their growth and development by adjusting their nutrient utilization efficiency for C, N, and phosphorus (P) along the latitude gradient. From the perspective of leaf N:P ratios, karst forest plants appear to be more vulnerable to nitrogen (N) limitations.
(2) The sensitivity of soil organic carbon (SOC), carbon-to-nitrogen (C:N), and carbon-to-phosphorus (C:P) ratios to latitudinal changes in the soils of the karst top pole community was more pronounced. Under the influence of habitat heterogeneity, which is based on soil variability. Plant leaf stoichiometry was significantly influenced by conductivity (SPC) at middle and high latitudes, while other soil factors, excluding soil nitrogen content (SNC), had a more substantial impact on plant leaf stoichiometry at low latitudes.
Author Contributions
Conceptualization, Y.W.; methodology, Y.W.; software, Y.W.; formal analysis, Y.W.; investigation, Z.F.; data curation, Z.F., T.T. and Y.D.; writing—original draft preparation, Y.W.; writing—review and editing, H.Z.; visualization, Y.W.; project administration, Y.W.; funding acquisition, Y.W. All authors have read and agreed to the published version of the manuscript.
Funding
This research was funded by the Guizhou Provincial Science and Technology Program, grant number: Qiankehejichu-ZK [2024] General 601; the Joint Fund of Science and Technology Bureau of Bijie City, Guizhou Province, China, grant number: Bikelianhe [2025] 21; the Guizhou Key Laboratory of Plateau Wetland Conservation and Restoration, grant number: Qiankehe Platform Talents [2025]015; Dongfeng Lake and Liuchong River Basin of Observation and Research Station of Guizhou Province, grant number: QKHPT YWZ [2025]002.
Institutional Review Board Statement
Not applicable.
Informed Consent Statement
Not applicable.
Data Availability Statement
The original contributions presented in the study are included in the article; further inquiries can be directed to the corresponding author.
Conflicts of Interest
The authors declare no conflicts of interest.
References
- Wang, M.; Gong, Y.; Lafleur, P.; Wu, Y. Patterns and drivers of carbon, nitrogen and phosphorus stoichiometry in Southern China’s grasslands. Sci. Total Environ. 2021, 785, 147201. [Google Scholar] [CrossRef]
- Fernández-Martínez, M.; Preece, C. Bryophyte C: N: P stoichiometry, biogeochemical niches and elementome plasticity driven by environment and coexistence. Ecol. Lett. 2021, 24, 1375–1386. [Google Scholar] [CrossRef]
- Xie, Y.Y.; Liu, X.Y.; Jin, Q.; Huang, J.F.; Hei, J.; Lin, S.Y.; Huang, Z.; Hou, N.; Wang, W.Q. Characteristics of soil carbon, nitrogen, phosphorus and their ecological stoichiometric ratios in different habitats of East Lake Wetland, Fuzhou. Sci. Soil Water Conserv. 2023, 21, 79–90. [Google Scholar]
- Wang, L.J.; Wang, P.; Sheng, M.Y. Stoichiometry characteristics of soil nutrient elements and its influencing factors in typical in karst rocky desertification ecosystems, southwest China. Acta Ecol. Sin. 2018, 38, 6580–6593. [Google Scholar]
- Yang, D.L.; Yu, Y.H.; Qin, S.Y.; Zhong, X.P. Contents and ecological stoichiometry characteristics of soil nutrients under different land utilization forms in stony desertification area. Southwest China J. Agric. Sci. 2018, 31, 1875–1881. [Google Scholar]
- Liu, N.; Yu, L.F.; Zhao, Q.; Wu, Y.N.; Yan, L.B. C: N: P stoichiometry of leaf-litter-soil continuum in secondary forests of the rocky desertification regions of the karst plateau. Chin. J. Appl. Environ. Biol. 2020, 26, 681–688. [Google Scholar]
- Han, W.; Fang, J.; Guo, D.; Zhang, Y. Leaf nitrogen and phosphorus stoichiometry across 753 terrestrial plant species in China. New Phytol. 2005, 168, 377–385. [Google Scholar] [CrossRef]
- Wang, S.Q.; Yu, G.R. Ecological stoichiometry characteristics of ecosystem carbon, nitrogen and phosphorus elements. Acta Ecol. Sin. 2008, 28, 3937–3947. [Google Scholar]
- Guittar, J.; Goldberg, D.; Klanderud, K.; Telford, R.J.; Vandvik, V. Can trait patterns along gradients predict plant community responses to climate change? Ecology 2016, 97, 2791–2801. [Google Scholar] [CrossRef]
- Zeng, C.; Li, T.; He, B.; Feng, M.; Liang, K. Effects of vegetation succession on topsoil C, N, and P contents and stoichiometry following agricultural abandonment in a representative karst trough valley. Ecol. Eng. 2023, 192, 106989. [Google Scholar] [CrossRef]
- Wang, S.J.; Li, Y.B.; Li, R.L. Karst rocky desertification: Formation background, evolution and comprehensive taming. Quat. Sci. 2003, 23, 657–666. [Google Scholar]
- Bao, S.D. Soil Agrochemical Analysis, 3rd ed.; Agricultural Press: Beijing, China, 2005; pp. 45–52. [Google Scholar]
- Zhao, Y.Q.; Yan, X.Y.; Xie, J.Q.; Hou, M.T.; Chen, D.M.; Zang, L.P.; Liu, Q.F.; Sui, M.Z.; Zhang, G.Q. Species diversity and community assembly of woody plants at different life history stages during the natural restoration of degraded karst forests. Biodiv. Sci. 2024, 32, 72–83. [Google Scholar] [CrossRef]
- Long, F.; Zhou, G.; Zu, L.; Chen, D.; Zhang, G.; Sui, G.; He, Y.; Liu, Q. Multi-Trophic Species Diversity Contributes to the Restoration of Soil Multifunctionality in Degraded Karst Forests through Cascading Effects. Forests. 2024, 15, 559. [Google Scholar] [CrossRef]
- Fang, J.; Wang, X.; Shen, Z.; Tang, Z.; He, J.; Yu, D.; Jiang, Y.; Wang, Z.; Zheng, C.; Zhu, J.; et al. Methods and protocols for plant community inventory. Biodiv. Sci. 2009, 17, 533–548. [Google Scholar]
- NY/T 2017-2011; Determination of Nitrogen, Phosphorus and Potassium in Plants. Ministry of Agriculture: Beijing, China, 2011.
- LY/T1228-2015; Determination of Nitrogen in Forest Soil. Ministry of Agriculture: Beijing, China, 2015.
- LY/T 1232-2015; Phosphorus Determination Methods of Forest Soils. Ministry of Agriculture: Beijing, China, 2015.
- Agren, G.I. The C: N: P stoichiometry of autotrophs–theory and observations. Ecol. Lett. 2004, 7, 185–191. [Google Scholar] [CrossRef]
- Ba, G.D.; Wang, W.D.; Xu, Z.L.; Jin, Y.Y.; Bai, Y.Y. C, N, P stoichiometric characteristics of tree, shrub, herb leaves and soil in Kanas natural forests of Xinjiang, China. Acta Ecolo. Sin. 2023, 43, 8749–8758. [Google Scholar]
- Ren, S.J.; Yu, G.R.; Jiang, C.M.; Fang, H.J.; Sun, X.M. Stoichiometric characteristics of leaf carbon, nitrogen, and phosphorus of 102 dominant species in forest ecosystems along the North-South Transect of East China. Chin. J. Appl. Ecol. 2012, 23, 581–586. [Google Scholar]
- Reich, P.B.; Oleksyn, J. Global patterns of plant leaf N and P in relation to temperature and latitude. Proc. Natl. Acad. Sci. USA 2004, 101, 11001–11006. [Google Scholar] [CrossRef]
- Dong, N.; Prentice, I.C.; Wright, I.J.; Evans, B.J.; Togashi, H.F.; Caddy-Retalic, S.; Mclnerney, F.A.; Sparrow, B.; Leitch, E.; Lowe, A.J. Components of leaf-trait variation along environmental gradients. New Phytol. 2020, 228, 82–94. [Google Scholar] [CrossRef]
- Koerselman, W.; Meuleman, A.F.M. The vegetation N:P ratio: A new tool to detect the nature of nutrient limitation. J. Appl. Ecol. 1996, 33, 1441–1450. [Google Scholar] [CrossRef]
- Tian, D.; Yan, Z.; Niklas, K.J.; Han, W.; Kattge, J.; Rich, P.; Luo, Y.; Chen, Y.; Tang, Z.; Hu, H.; et al. Global leaf nitrogen and phosphorus stoichiometry and their scaling exponent. Natl. Sci. Rev. 2018, 5, 728–739. [Google Scholar] [CrossRef]
- Li, Y.; Reich, P.B.; Schmid, B.; Shrestha, N.; Feng, X.; Lyu, T.; Maitner, B.S.; Xu, X.; Li, Y.; Zou, D.; et al. Leaf size of woody dicots predicts ecosystem primary productivity. Ecol. Lett. 2020, 23, 1003–1013. [Google Scholar] [CrossRef] [PubMed]
- Wu, T.; Yu, M.; Geoff Wang, G.; Dong, Y.; Cheng, X.R. Leaf nitrogen and phosphorus stoichiometry across forty-two woody species in Southeast China. Biochem. Syst. Ecol. 2012, 44, 255–263. [Google Scholar] [CrossRef]
- Zhang, X.; Mam, L.; Chen, Y.; Yang, J.; An, S. Ecological stoichiometry characteristics of robinia pseudoacacia forest soil in different latitudes of loess plateau. Acta Pedologica Sin. 2013, 50, 818–825. [Google Scholar]
- He, J.S.; Wang, L. Leaf nitrogen: Phosphorus stoichiometry across Chinese grassland biomass. Oecologia 2008, 155, 301–310. [Google Scholar] [CrossRef]
- Han, W.X.; Wu, Y.; Tang, L.Y.; Chen, Y.H.; Li, L.P.; He, J.S.; Fang, J.Y. Leaf carbon, nitrogen and phosphorus stoichiometry across plant species in Beijing and its periphery. Acta Sci. Nat. Univ. Pekin. 2009, 45, 855–860. [Google Scholar]
- Zeng, Q.; Li, X.; Dong, Y.; Li, Y.; Cheng, M.; An, S. Ecological stoichiometry characteristics and physical-chemical properties of soils at different latitudes on the loess plateau. J. Nat. Resou. 2015, 30, 870–879. [Google Scholar]
- Elser, J.J.; Fagan, W.F.; Denno, R.F.; Dobberfuhl, D.R.; Folarin, A.; Huberty, A.; Interlandi, S.; Kilham, S.S.; McCauley, E.; Schulz, K.L.; et al. Nutritional constraints in terrestrial and freshwater food webs. Nature 2000, 408, 578–580. [Google Scholar]
- Guo, Z.W.; Chen, S.L.; Yang, Q.P.; Li, Y.C. Effects of stand density on Oligostachyum lubricum leaf carbon, nitrogen, and phosphorus stoichiometry and nutrient resorption. Chin. J. Appl. Ecol. 2013, 24, 893–899. [Google Scholar]
- Xie, J.; Chang, S.L.; Zhang, Y.T.; Wang, H.J.; Song, C.C.; He, P.; Sun, X.J. Plant and soil ecological stoichiometry with vertical zonality on the northern slope of the middle Tianshan Mountains. Acta Ecolo. Sin. 2016, 36, 4363–4372. [Google Scholar]
- Gong, W.; Hu, T.; Wang, J.; Gong, Y.; Luo, C. Seasonal variation of soil nitrogen pools and microbes under natural evergreen broadleaved forest and its artificial regeneration forests in Southern Sichuan Province, China. Acta Ecolo. Sin. 2011, 31, 1763–1771. [Google Scholar]
- Nie, M.; Shen, Y.; Lu, Y.; Wang, K.; Zhang, X. Ecostoichiometric characteristics of dominant plant leaves-soil ecology in different communities of desert steppe in Yanchi county, Ningxia. Acta Agrectir. Sin. 2021, 29, 131–140. [Google Scholar]
Disclaimer/Publisher’s Note: The statements, opinions and data contained in all publications are solely those of the individual author(s) and contributor(s) and not of MDPI and/or the editor(s). MDPI and/or the editor(s) disclaim responsibility for any injury to people or property resulting from any ideas, methods, instructions or products referred to in the content. |
© 2025 by the authors. Licensee MDPI, Basel, Switzerland. This article is an open access article distributed under the terms and conditions of the Creative Commons Attribution (CC BY) license (https://creativecommons.org/licenses/by/4.0/).