Article

Analysing the Market Value of Land Accommodating Logistics Facilities in the City of Cape Town Municipality, South Africa

by
Masilonyane Mokhele
Faculty of Informatics and Design, Cape Peninsula University of Technology, Cape Town 8000, South Africa
Sustainability 2025, 17(13), 5776; https://doi.org/10.3390/su17135776
Submission received: 21 April 2025 / Revised: 10 June 2025 / Accepted: 18 June 2025 / Published: 23 June 2025
(This article belongs to the Special Issue Sustainable Transport and Land Use for a Sustainable Future)

Abstract

The world is characterised by the growing volumes and flow of goods, which, amid benefits to economic development, result in negative externalities affecting the sustainability of cities. Although numerous studies have analysed the locational patterns of logistics facilities in cities, further research is required to examine their real estate patterns and trends. The aim of the paper is, therefore, to analyse the value of land accommodating logistics facilities in the City of Cape Town municipality, South Africa. Given the lack of dedicated geo-spatial data, logistics firms were searched on Google Maps, utilising a combination of aerial photography and street view imagery. Three main attributes of land parcels hosting logistics facilities were thereafter captured from the municipal cadastral information: property extent, street address, and property number. The latter two were used to extract the 2018 and 2022 property market values from the valuation rolls on the municipal website, followed by statistical, spatial, and geographically weighted regression (GWR) analyses. Zones near the central business district and seaport, as well as areas with prime road-based accessibility, had high market values, while those near the railway stations did not stand out. However, GWR yielded weak relationships between market values and the locational variables analysed, arguably showing a disconnect between spatial planning and logistics planning. Towards augmenting sustainable logistics, it is recommended that relevant stakeholders strategically integrate logistics into spatial planning, and particularly revitalise freight rail to attract investment to logistics hubs with direct railway access.

1. Introduction

The world is characterised by the growing volumes and flow of goods [1], which are primarily driven by the proliferation of e-commerce [2,3] and international trade [4]. Hesse and Rodrigue [5] argue that the fundamental consideration in this contemporary economic environment pertains not only to the nature, origin, and destination of freight but also to how freight is moved and stored across different geographical scales, underscoring the significance of logistics. Central to the vitality of cities [6], logistics processes play an essential role in facilitating the flow of goods between points of origin and consumption globally [1,7]. The logistics industry encompasses, inter alia, transportation, warehousing, handling, circulation, processing, and delivery of goods [8]. Tare et al. [9] argue that the growing geographical separation between production and consumption activities has resulted in a higher demand for logistics. Therefore, a well-integrated and efficient logistics sector can boost economic competitiveness and, in toto, augment economic development [10,11]. Jaller, Zhang, and Qian [12] warn that although freight, a crucial component of logistics, is important for economic development, it also induces emissions, noise, congestion, and other negative externalities, which adversely affect the sustainability of cities.
Historically, logistics was the subject of analysis in various disciplines or fields of study, including operations management, marketing management, engineering, and management accounting [13]. Notably, after being relatively overlooked by human geography and associated fields of study, Hesse [14] acknowledges that the geography of logistics has recently gained well-deserved scholarly attention. Numerous studies accordingly provide insights into the locational patterns of logistics facilities, and, in some cases, the factors driving those patterns. The interest in the geography or locational patterns of logistics facilities is exemplified by a strong focus in the literature on the notion of logistics sprawl and its multifaceted ramifications. As relevant individual empirical and review publications are too numerous to list, Special journal editions, like Dablanc and Browne [15], exemplify the widespread interest in logistics sprawl.
Despite the increasing scholarly interest in logistics, there is a relative lack of research analysing logistics facilities real estate patterns and trends. This analysis can offer insights for informing the development of spatial planning policies and strategies for placing logistics facilities within cities and broader regions. As emphasised by He et al. [16], when deciding the optimum location of logistics nodes, spatial planners and relevant stakeholders should comprehensively understand and consider the impact of, among others, land rent. To extend the literature, the paper aims to analyse the patterns and trends of the market value of land used for logistics facilities or activities within the City of Cape Town municipality, South Africa. The market values are analysed against the municipality’s spatial structure/organisation, transport infrastructure, urban development policy initiatives, and fiscal incentives. As discussed further in the Background Section, these are some of the main factors influencing the placement of logistics facilities. Rodrigue [17] posits that the concept of spatial organisation has two dimensions: on the one hand, there is an element of spatial differentiation, which denotes the characteristics of, among others, location, size, and density of a certain phenomenon; and on the other, there is a notion of spatial interactions, referring to the attributes of places of origin and destination. Transportation significantly impacts spatial organisation by structuring space at various scales, and also, conversely, space shapes transport, reflecting a reciprocity between the two elements [17]. The paper focuses largely on the connections between land value and spatial structure and transport infrastructure due to this fundamental reciprocity. Furthermore, the urban development policy initiatives and fiscal incentives explored in the paper also hinge on accessibility (see the Methods Section). Against this backdrop, the study tested the following null hypothesis: there is no positive relationship between the market value of land accommodating logistics facilities and proximity to the airport, seaport, CBD, development corridors, major intersections, development nodes, railway stations, and urban development zones.
The paper’s contribution is three-fold: first, it provides property value-related insights for strategically informing the spatial distribution of logistics facilities; secondly, it offers a methodological contribution for developing a database of land accommodating logistics facilities in the context of a lack of dedicated geo-spatial logistics-related data; and thirdly, it contributes to the application of geographically weighted regression (GWR) modelling to logistics research. The remainder of the paper is structured as follows: Section 2 provides an overview of the literature to contextualise the study. Section 3 details the research design and methods adopted to test the null hypothesis and achieve the overarching study’s aim. Section 4 presents the findings. Section 5 discusses the findings relative to the literature. Section 6 concludes the paper.

2. Background

To contextualise the study, this section overviews the literature on the factors influencing the location choice of logistics firms, real estate valuation methods, and the factors affecting logistics property market values.

2.1. Factors Influencing the Location Choice of Logistics Firms

Identifying factors influencing the location of logistics facilities can provide insights for formulating appropriate logistics-related land-use policies and guidelines [18]. Understanding the location choices of logistics facilities is, therefore, crucial for both logistics real estate developers and policymakers, whose aim is to guide logistics development in a way that minimises negative environmental and social externalities [4]. Factors that influence the location-choice decisions of logistics firms are diverse and could encompass land availability and affordability, availability of transport infrastructure, level of economic development, availability of labour, and land-use planning [1].
As noted in the Introduction, the paper focuses largely on land cost or affordability relative to the city’s spatial structure/organisation and transport infrastructure. The literature has argued that accessibility plays a crucial role in influencing the location of logistics firms [1,19,20]. Good transport infrastructure is important for, among others, expanding the market for logistics establishments and improving their efficiency. Due to their dependence on large-scale transportation infrastructure, logistics firms tend to locate in the vicinity of railway stations, seaports, and airports [21].
Regarding land affordability, the literature argues that as land in the urban core is in high demand, the hotspots of logistics facility development have shifted from central urban areas to the outskirts [22]. Verhetsel et al. [1] assert that logistics firms can only afford smaller land rents than offices and retail projects can pay. Therefore, logistics operators or their real estate investors search for zones with cheap land, which is typically found at the edges of urban areas [23]. This shows that at the micro level, land price becomes a crucial location driver, favouring areas outside of the dense centres [23]. In this regard, peripheral nodes near airports, for instance, attract space-intensive activities such as warehouses [24].
In the Sao Paulo Metropolitan Region (SPMR) in Brazil, Guerin et al. [25] found that zones with the highest number of warehouses were those with the lowest real estate values. In another study, De Oliveira et al. [26] found that land cost was one of the significant factors influencing the warehouse location decisions in Belo Horizonte, Brazil. In the study exploring, among others, the hypothesis that the location of warehouses was closely related to the land/rent values of logistics facilities, De Oliveira, Dablanc, and Schorung [27] found statistically significant evidence that the location of warehouses and average rent prices were dependent. In a related study, De Oliveira, Schorung, and Dablanc [28] found, among others, that the warehouse rent prices depended on location in metropolitan areas and the warehouse rent prices were influenced by the concentration of logistics facilities. Tare et al. [4,9] investigated the impact of various factors, including land price, on various types and sizes of logistics development in the Netherlands, and found that the impact of land price varied with the type and size of logistics development. Whether or not logistics establishments were willing to pay high land prices depended on how attractive they considered the local benefits that induced the high land prices. Notably, locations with higher land values were found to experience a higher likelihood of development of large retail and a lower likelihood of development of transport and logistics. These findings suggest that locations that are more central were preferred more by large retail development and less for the other types of logistics [9].
A recent trend of logistics facilities locating in central areas has been noted in the literature. Rai et al. [29] acknowledge that cities are expensive, their development is highly regulated, and full of establishments that potentially resent freight activities in their backyard. The new trend shows that higher levels of service for urban goods delivery are now required in cities, overcoming the cost associated with operating such facilities in dense urban environments [29].
Development and land-use policies are also crucial factors influencing the location of logistics companies. Governments or public agencies can support the placement of freight-related firms in certain areas to maximise freight efficiencies and minimise negative externalities [22]. Despite the proclaimed importance of spatial or land-use planning, Mokhele and Fisher-Holloway [30] found that spatial plans in the Cape functional region, South Africa, did not acknowledge or include guidelines and strategies relating to the placement of warehousing and logistics generally.
Against this backdrop, the paper intends to analyse the property values of land accommodating logistics facilities in different parts of a metropolitan area and test the following assertions: one, that market values in the outskirts of urban areas are relatively low, attracting the development of space-intensive logistics facilities like warehouses; two, there is a trend of logistics facilities locating in the dense city centres despite the high property costs in such areas; three, logistics facilities (or land accommodating logistics facilities in the context of the paper) tend to cluster around large-scale transport infrastructure and nodes; and four, the placement of land accommodating logistics facilities (and the associated market values) are influenced by spatial planning policies and strategies.

2.2. Real Estate Valuation Methods

Since the paper is concerned about the market value of land accommodating logistics facilities, it is necessary to expound on the concept of land value and the associated valuation methods. This discussion will put the data collection methods used in the study into perspective. Land value is influenced by various factors, including physical, economic, social, environmental, and legal considerations [31]. Thontteh [32] expounded that the factors affecting a property’s financial worth include location, size, condition, and type of construction, the type and security of tenure, permitted land use, and the overall state of the economy. Additionally, the equilibrium between demand and supply, along with purchasing power, influences property prices [33].
As the paper is based on secondary sources of property valuation data, it is important to discuss land valuation processes. Land valuation is the process of estimating the value of land, which can be expressed in relative or absolute terms [31]. The process is thus intended to provide a neutral assessment of a property to determine its value [34]. Valuation can be performed manually or through automated methods. The latter involves collecting market values that serve as a sample, which is calibrated to develop a numerical valuation model for an area [31].
Mass valuations are widely used worldwide, as components of land administration systems or as part of fiscal systems that utilise land cadastre data for taxation and other purposes [35]. Consequently, mass valuation models form part of a property attribute system, such as a cadastre or land registry, which is used for various land management purposes beyond valuation [36]. Mass valuation is a systematic assessment of a large number of properties performed on a specific date using standardised procedures and statistical analyses, in contrast to individual valuations, which focus on determining the value of individual property units [35]. Mass valuations are utilised when a large number of properties have to be valued simultaneously on a single date rather than generating individual valuations under current market conditions. This approach relies on standardised procedures, common sets of data, usually derived from a property attribute system, and statistical models of the relationship between value and property characteristics. These involve estimating the relationship between the market price (the dependent variable) and the attributes of properties that determine the price [36].
As expounded in the Methods Section, the paper utilised secondary data from the City of Cape Town municipality, collected through mass valuation processes. The municipality uses these property values to calculate the rates charged to landowners per the rates policy [37]. This ultimate use of the mass valuation output provides confidence in the municipality’s information.

2.3. Logistics Real Estate and Economic Shocks

As the paper analyses the patterns and trends of the value of land used for logistics facilities over time, it is essential to review the literature on factors affecting logistics real estate, either positively or negatively. Oyedeji [38] assessed real estate supply, demand, and rental value in Lagos, Nigeria, during the COVID-19 pandemic. Among others, the study found that warehouses were the most available class for occupation in the study area, it had the highest demand rate, experienced the highest increase in sale value, and also had the highest rental value. This was the case because social distancing had forced more consumers to use e-commerce, and warehouses became a sought-after commercial property class [38].
Similarly, Kaklauskas et al. [39] add that in 2020, investors flocked to industrial properties, and, for the first time, the spending on American warehouses overtook that of office buildings. Warehouses were regarded as a more resilient property group during the COVID-19 pandemic—they became significant in ensuring the flow of supply chains [39].
The paper, therefore, intends to assess whether the pattern of warehousing (or logistics generally) being resilient to shocks was also true for the land parcels accommodating logistics facilities in the City of Cape Town municipality.

3. Study Area, Design, Materials and Methods

This section introduces the study area and presents the research design, as well as the data collection and analysis methods employed.

3.1. Study Area

The study focused on the City of Cape Town municipality in the Western Cape province, South Africa. Among the significant transport infrastructure, the study area accommodates the Port of Cape Town, the second-busiest port in South Africa, and Cape Town International Airport, the second-busiest airport in terms of the number of passengers and volume of air cargo processed. According to Wesgro [40], sea freight constitutes the bulk of world trade transportation in the Western Cape province—wherein approximately 60% of the exports are facilitated via the seaport, while air transport accounts for 11%. In addition to the airport and seaport, the City of Cape Town is home to road infrastructure of regional and national significance, as well as an expansive rail network (Figure 1), which is predominantly used for passenger transportation. It is, however, important to note that, as a microcosm of a national challenge, freight rail is underutilised in the Western Cape province and City of Cape Town specifically [41]. Despite this underutilisation, diverse transport infrastructure makes the City of Cape Town attractive to logistics establishments and, therefore, an ideal study area for examining the patterns and trends of the market value of land used for logistics facilities.
Regarding the City of Cape Town’s spatial structure and space economy, it is worth noting that the Cape Town CBD and its environs have maintained economic dominance, albeit nodes in suburban areas have gained a share of new economic activity [42]. According to City of Cape Town municipality [43], the municipal spatial plan/development framework is anchored by a hierarchical system of nodes and development corridors (Figure 1). Development corridors are zones of high-intensity mixed-use development, centred on rail and road accessibility. Relatedly, nodes are points of highest accessibility and exposure, acting as spatial anchor points that promote the clustering of economic activities [43]. Figure 1 also portrays the location of the urban development zones (UDZs) within the municipality. UDZs are a tax incentive intended to encourage development by the private sector wherein businesses within designated zones benefit from tax savings for building development [44].

3.2. Research Design

The paper is based on a quantitative design to analyse the patterns and trends of the land used for logistics facilities in the City of Cape Town municipality. As elaborated in the Methods Section, the design centred on the statistical analysis conducted in IBM’s statistical package for social sciences (SPSS), spatial analysis conducted in the geographic information system (GIS) programme of QGIS 3.32.0, and geographically weighted regression modelling in Python 3.13.
The study’s units of analysis were the land parcels accommodating logistics facilities within the City of Cape Town municipality. Therefore, the number of land parcels identified and analysed in the study should not be conflated with the number of logistics facilities. In some instances, a single land parcel would accommodate different establishments (logistics-related or otherwise); and in other rare cases, the components of a single logistics facility/establishment would be located in multiple adjoining land parcels.
Land parcels housing any of the following categories of logistics facilities or activities were considered in the study: warehousing, storage, distribution (including shipping container yards/depots), truck depots, courier services, freight forwarding, and e-commerce pick-up points, excluding parcel lockers.

3.3. Data Collection and Analysis Methods

3.3.1. Data Collection

According to Heitz, Launay, and Beziat [45], a growing body of research highlights the acute lack of geo-spatial data on freight in most cities, resulting in a lack of dedicated databases on the geography of logistics facilities [23]. Due to this deficiency, alternative approaches were employed à la Heitz, Launay, and Beziat [45], Heitz et al. [23], and Mokhele [46] to identify the applicable land parcels in preparation for the analysis of the property market value patterns and trends.
The process of identifying logistics facilities involved searching logistics companies on Google Maps, double-checking the company names on the signage in street view, and verifying their locations on the respective business websites where available. Notably, street view imagery (SVI) is increasingly heralded as a rich data source in urban studies [47].
As not all companies were listed on Google Maps, several visual indicators per Heitz, Launay, and Beziat [45] were also crucial in identifying, on the aerial photography, land accommodating logistics infrastructure like warehouses, terminals, and shipping container yards or depots. These included the building shape and size, expansive parking and manoeuvring areas for trucks [45] (Figure 2), and the rectangular shape and distinctly small size of shipping containers (Figure 3). It is, however, important to acknowledge that parking and manoeuvring space, as depicted in Figure 2, may be for manufacturing plants rather than logistics premises; hence it was essential to triangulate the aerial photograph with Street View and company website information.
While the City of Cape Town’s Google Maps aerial images were, in most instances, dated 2024 and 2025, some of the street view images dated back to 2022. Therefore, premises that showed logistics facilities in the old street view images, which could, however, not be confirmed through company websites, were omitted from the dataset. Although the approach followed carried a risk of inadvertently omitting some of the new premises not reflected in the street view or company websites, there was confidence that at least the land parcels included in the database were accurate.
Following the identification of land accommodating logistics facilities above, unique property details of each identified land parcel were searched on the City of Cape Town’s cadastral GIS shapefile, which was overlaid on Google Satellite in QGIS 3.32.0 and triangulated with the municipality’s online Map Viewer. Two key attributes were obtained from the cadastral shapefile and the Map Viewer: street address and property number, which were thereafter used to extract the 2018 and 2022 property market values from the City of Cape Town’s valuation roll, available on the municipal website. The City of Cape Town utilises a computer-assisted mass appraisal (CAMA) system to generate market property values across the municipality [37] (also refer to the Background Section). The valuation roll page on the website made provision for the property market values, allowing users to search values using the unique property reference, sectional title, street address, and erf (property/parcel) number. The manual and laborious data collation for the identified land parcels was conducted from 1 December 2024 to 31 March 2025.
To facilitate a geographically disaggregated statistical analysis of the market value patterns across the municipality, the identified land parcels were organised per the applicable economic node, industrial area, or neighbourhood, captured on separate tabs of a Microsoft Excel file. Once the data collation process was complete, the information from all the tabs was combined into a single spreadsheet, with the following variables: node, property number, street address, 2018 market value, 2022 market value, company name, and company website address where available.
It should be noted that logistics facilities on the airport and seaport premises were excluded from the study. Airport authorities typically release land on a leasehold basis, whose value is not necessarily directly related to the entire property’s market value. As a result, making a connection between the placement of logistics facilities and the value of airport or seaport land would not be logical.

3.3.2. Data Analysis

Three forms of analysis were conducted in the study. Firstly, following the data collection process, the consolidated Microsoft Excel spreadsheet was inputted into SPSS, version 29. The subsequent analysis in SPSS included basic statistical analysis to explore the patterns and trends of property values of land parcels accommodating logistics facilities in the City of Cape Town municipality. To disaggregate the findings, the data were split in SPSS to allow the presentation of statistical analysis results by the applicable industrial area, economic node, or neighbourhood.
Secondly, spatial analysis was conducted in QGIS 3.32.0 to spatially depict the distribution of the land parcels used for logistics across the City of Cape Town municipality. To prepare for the analysis, the attribute table of the cadastral shapefile from the City of Cape Town Open Data Portal was edited in QGIS to include the market values for 2018 and 2022 collated in the study. Per the spreadsheet mentioned in Section 3.3.1, the property numbers were used to identify the relevant entries and manually transfer the market values to the attribute table.
Thirdly, geographically weighted regression (GWR) was used to model the relationship between the property market value of land parcels accommodating logistics facilities and various explanatory variables. GWR, which models relationships of variables that vary spatially [48,49] has been heralded as an effective tool for investigating non-stationarity [50]. Furthermore, the main attribute of the technique is that compared to equations or models that posit parameters that are spatially invariant, GWR’s parameters correspond to a focal point [50]. It analyses changes to the relationship between dependent and independent variables over space. GWR models a dependent variable through a linear function of a set of independent variables [49].
The independent variables (listed in Table 1) related to transport infrastructure and accessibility (train stations, airport, seaport, and major intersections), policy directives (nodes and development corridors), and development incentives (urban development zones). As highlighted in the Background Section, these are some of the main factors influencing the placement of logistics facilities; and the null hypothesis that the study tested was that there is no positive relationship between the property market value and these variables.
The data containing property values of the logistics firms, which were in the form of land parcel polygons, were transformed into point data. The newly generated data were then used to calculate the distances from the independent variable (the centre point of each land parcel) to the centre points of the independent variables. The distances were calculated using the ‘distance to nearest hub’ tool in QGIS, which considers distances from multiple points to multiple points. The data were checked and cleaned in QGIS, after which the shapefiles, containing distances from all land parcels to all independent variables were inputted to Python (PyCharm Environment) where the GWR was performed. Multiscale GWR (MGWR), which is a Python package, uses an optimisation algorithm to select the most suitable bandwidth. In other words, it automatically generates the bandwidth based on the distribution of the data. With 305 valid data points for the 2018 data, the optimal bandwidth was determined to be 94. For 2022, there were 313 data points and the optimal bandwidth was 260.
The MGWR package ran both the GWR and Global Regression/Ordinary Least Squares (OLS) Regression. The OLS assumes spatial stationarity as opposed to the GWR, which, as indicated earlier, assumes non-stationarity of data. The spatial kernel used was an adaptive bi-square kernel, which was embedded in the model. Furthermore, the p-value was calculated to determine the statistical significance of each independent variable. The output, including maps and numerical values, was generated from Python.
The values of R-squared range from 0 to 1, where 0 indicates no relationship and 1 indicates a perfect relationship. R-squared is a measure of the goodness of fit of the model, indicating how well the independent variables can explain the variation in the dependent variable (property market values).

4. Results

This section presents the results of the patterns and trends of market property values of land accommodating logistics facilities in 2018 and 2022 in the City of Cape Town municipality.

4.1. Land Parcels Hosting Logistics Facilities

A total of 326 land parcels hosting logistics facilities or activities in the City of Cape Town municipality were identified in 2018 and 330 in 2022 through the process outlined in the Methods Section. The difference in the four years between the two valuation points was only four properties, which, as noted earlier in the paper, should not be conflated with the number of logistics facilities. The identified land parcels (as depicted in Figure 4) were in the 28 industrial and economic nodes or neighbourhoods across the municipality. Alphabetically, these were Airport environs, Atlantic Hills, Atlantis, Beaconvale/Elsiesrivier, Blackheath, Brackenfell, Cape Town CBD, Epping, Fisantekraal, Goodwood, Killarney, Kraaifontein, Kuilsrivier, Macassar, Maitland, Montague Gardens/Milnerton, Richmond Park, Ottery/Hill Star, Paarden Eiland, Parow Industria, Philippi, Rivergate, Sacks Circle/Bellville South Industria, Stellenbosch Farms, Stikland/Brackenfell, Triangle Farm, Westlake, and Woodstock/Salt River. Most of these areas are major industrial zones in the City of Cape Town municipality, showing a connection between the industrial landscape and the placement of logistics facilities. The only non-industrial zone is the Cape Town CBD, which accommodates a range of mixed activities.
It is observed in Figure 4 and Table 2 that a large number of the land parcels accommodating logistics facilities were in the environs of Cape Town International Airport, in Paarden Eiland near the Port of Cape Town, and Epping, positioned in a central area with easy access to roads of national and regional significance. Other concentrations were observable near the junctions of main roads, such as Brackenfell. Lower numbers were observed in, among others, Atlantis, to the far north of the municipality, Cape Town CBD, Stellenbosch Farms, and Westlake to the south of the municipality. It is also observed, in Figure 4, that most land parcels are outside development nodes and corridors (as identified in the municipal spatial development framework), and the urban development zones.

4.2. Market Property Value Patterns in 2018 and 2022

4.2.1. Overall Market Value Patterns in 2018 and 2022

The 2018 and 2022 property market value descriptive statistics for the industrial zones, economic nodes, or neighbourhoods hosting logistics facilities in the City of Cape Town are displayed in Table 3. The value for some land parcels could not be confirmed, as denoted by the ‘missing’ column in the tables. These were largely in instances where the land parcel delineation or description on the City of Cape Town cadastre shapefile and online municipal Map Viewer did not correspond with the property description on the valuation roll.
The results of the statistical analysis showed that in 2018, the land parcel with the highest value, at ZAR 604 million, was located in the Montague Gardens/Milnerton industrial area (see Table 3), closely followed by a land parcel in the Cape Town CBD, at just above ZAR 602 million, a land parcel in Stikland/Brackenfell followed at around ZAR 330 million, Sacks Circle/Bellville South Industrial at ZAR 300 million, and Philippi at ZAR 289 million, among others. The land parcel with the highest value near Cape Town International Airport was ZAR 256 million, while the highest in Paarden Eiland, near the Port of Cape Town, was just below ZAR 145 million.
The land parcel with the lowest value was in Paarden Eiland, at ZAR 17,960, followed by Ottery/Hill Star at ZAR 1.25 million, Woodstock/Salt River at about ZAR 1.4 million, Fisantekraal at ZAR 1.5 million, Killarney at ZAR 1.7 million, and Macassar at ZAR 1.8 million, among others. The land parcel with the lowest value in the Cape Town CBD was ZAR 389 million.
The mean property value was highest in the Cape Town CBD, at approximately ZAR 495 million, followed by the Montague Gardens/Milnerton area at about ZAR 119 million, Parow Industria at just below ZAR 62 million, Philippi at ZAR 62 million, and Richmond Park at about ZAR 47 million. Airport environs had a mean of ZAR 32 million. The 2018 standard deviation for the land accommodating logistics facilities in the City of Cape Town municipality shows that the figures ranged significantly above and below the mean, implying the moderate to high variability of the market property values.
In 2022, the land parcel with the highest value, at ZAR 712 million, was, similar to the 2018 results, in the Montague Gardens/Milnerton area (Table 3), followed by a land parcel in the Stikland/Brackenfell industrial area, at ZAR 686 million, Woodstock/Salt River at ZAR 676 million, and the Cape Town CBD at ZAR 630 million (Table 3). The land parcel with the highest value in the environs of Cape Town International Airport was at ZAR 312 million, and the vicinity of Fisantekraal Airport was at just below ZAR 38 million. Notably, a land parcel in Atlantis, to the far north of the municipality, had the lowest maximum value of ZAR 5.3 million.
The land parcel with the lowest value was in the Ottery/Hill Star area at ZAR 1.1 million, followed by Woodstock/Salt River at ZAR 1.7 million, Killarney at ZAR 1.9 million, Fisantekraal at ZAR 2 million, and Atlantis at ZAR 3.2 million (Table 3). Notably, the property with the lowest value in the Cape Town CBD was at a staggering ZAR 372 million, higher than the maximum values of some zones in the municipality.
The 2022 mean property values were highest in the Cape Town CBD at ZAR 501 million, Montague Gardens/Milnerton at ZAR 121 million, and Richmond Park at ZAR 98 million. Atlantis had the lowest mean of ZAR 4.3 million, Stellenbosch Farms at ZAR 6.8 million, Goodwood at ZAR 8.5 million, and Fisantekraal at ZAR 14.3 million.
In 2022, Montague Gardens had the widest range of ZAR 706 million, followed by Stikland at ZAR 684 million, Woodstock/Salt River at just under ZAR 694 million. Atlantis had the narrowest range of ZAR 2 million, and Stellenbosch Farms had a range of ZAR 3.4 million (Table 3). The 2022 standard deviation shows that the figures ranged significantly above and below the mean, implying the moderate to high variability of the market property values of land hosting logistics facilities or activities.

4.2.2. Average Property Market Values

In 2018, regarding the property value relative to extent, the mean was highest in the Cape Town CBD at ZAR 99,037/m2, Westlake at ZAR 7456/m2, and Paarden Eiland at ZAR 5 606/m2. The mean in the vicinity of Cape Town International Airport was ZAR 2833/m2. Stellenbosch Farms had the lowest mean of ZAR 136/m2, followed by Atlantis at ZAR 700/m2.
Similarly, in 2022, the mean was highest in the Cape Town CBD at ZAR 98,814/m2, Westlake at ZAR 7713/m2, and Paarden Eiland at ZAR 6505/m2. The mean average in the vicinity of Cape Town International Airport had increased slightly to ZAR 2855/m2. Stellenbosch Farms had the lowest mean of ZAR 160/m2, followed by Atlantis whose mean had decreased from ZAR 700/m2 in 2018 to ZAR 563/m2 (Table 4).

4.3. Market Property Value Changes Between 2018 and 2022

The majority of the industrial zones, economic nodes, or neighbourhoods analysed had at least one land parcel experience a decline in market value between 2018 and 2022. The land parcel with the most significant decline was in Goodwood, at −64.15%, followed by those in Kraaifontein (−48.62%), Brackenfell (−46.94%), and Woodstock/Salt River (−45.09%). Five zones did not have land parcels that experienced a decline in the market value between the two years. The land parcel with the largest increase was in Paarden Eiland, which was a property that did not have a value assigned in 2018.
Against the decline of at least one land parcel in most zones, at an aggregated level, the majority of the industrial zones, economic nodes, or neighbourhoods experienced a property market value increase between 2018 and 2022 (Table 5). Environs of the airport experienced an aggregated increase of 1721%, which was also due to a land parcel that did not have a value assigned in 2018.

4.4. Relationship Between Property Market Values and Location Attributes

As indicated in the Methods Section, GWR’s R-squared of 0 indicates no relationship between the independent and independent variables while 1 indicates a perfect relationship. R-squared is a measure of the goodness of fit of the model, indicating how well the variation in property values can be explained by the independent variables. The outcome of the GWR model indicates that there were weak relationships in 2018 and 2022 between property market values and the land parcels’ proximity to various location attributes (independent variables) across the City of Cape Town municipality.
For 2018, the R-squared result was 0.49, whereas the OLS had an R2 of 0.113. The GWR performed relatively better than the Global Regression/OLS because it accounted for the local regression. Although R-squared (aggregated and disaggregated in Table 6 and Figure 5) reflected weak relationships, there were variables with a p-value less than 0.05, reflecting statistical significance. The p-value findings partially rejected the null hypothesis, and showed that proximity to the airport, CBD, development corridors, and port had a positive effect on the property market values of land accommodating logistics facilities. However, the p-value or statistical significance should be read with caution [51] because it does not measure the size of the impact of independent variables on the dependent variable.
The non-significant variables in Table 6 were removed from the GWR model, after which the R-squared decreased from 0.49 to 0.327. This suggests that other independent variables, even though not statistically significant, helped explain some of the variation in the dependent variable. The GWR R-squared for the significant variables was also greater than the OLS R-squared, which was 0.094.
For the 2022 data, the GWR R-squared was 0.184 whereas the global (OLS) R–squared was 0.087. This suggests that the GWR was able to explain the variation in the data better than the OLS. Similar to the 2018 results, in 2022, although the R-squared showed weak relationships between the dependent and independent variables (Table 7 and Figure 6), the variables airport, CBD, development corridors, and seaport had a p-value less than 0.05, reflecting statistical significance. However, as argued earlier, statistical significance does not measure the size of the effect of these variables on the property market values of land accommodating logistics facilities.
After removing the 2022 non-significant variables from the model, the R-squared increased from 0.184 to 0.1969. This could indicate that other variables were noisy and had a negative impact on the fitness of the model. The GWR R-squared for the significant variables was also greater than the OLS R-squared, which was 0.073.

5. Discussion

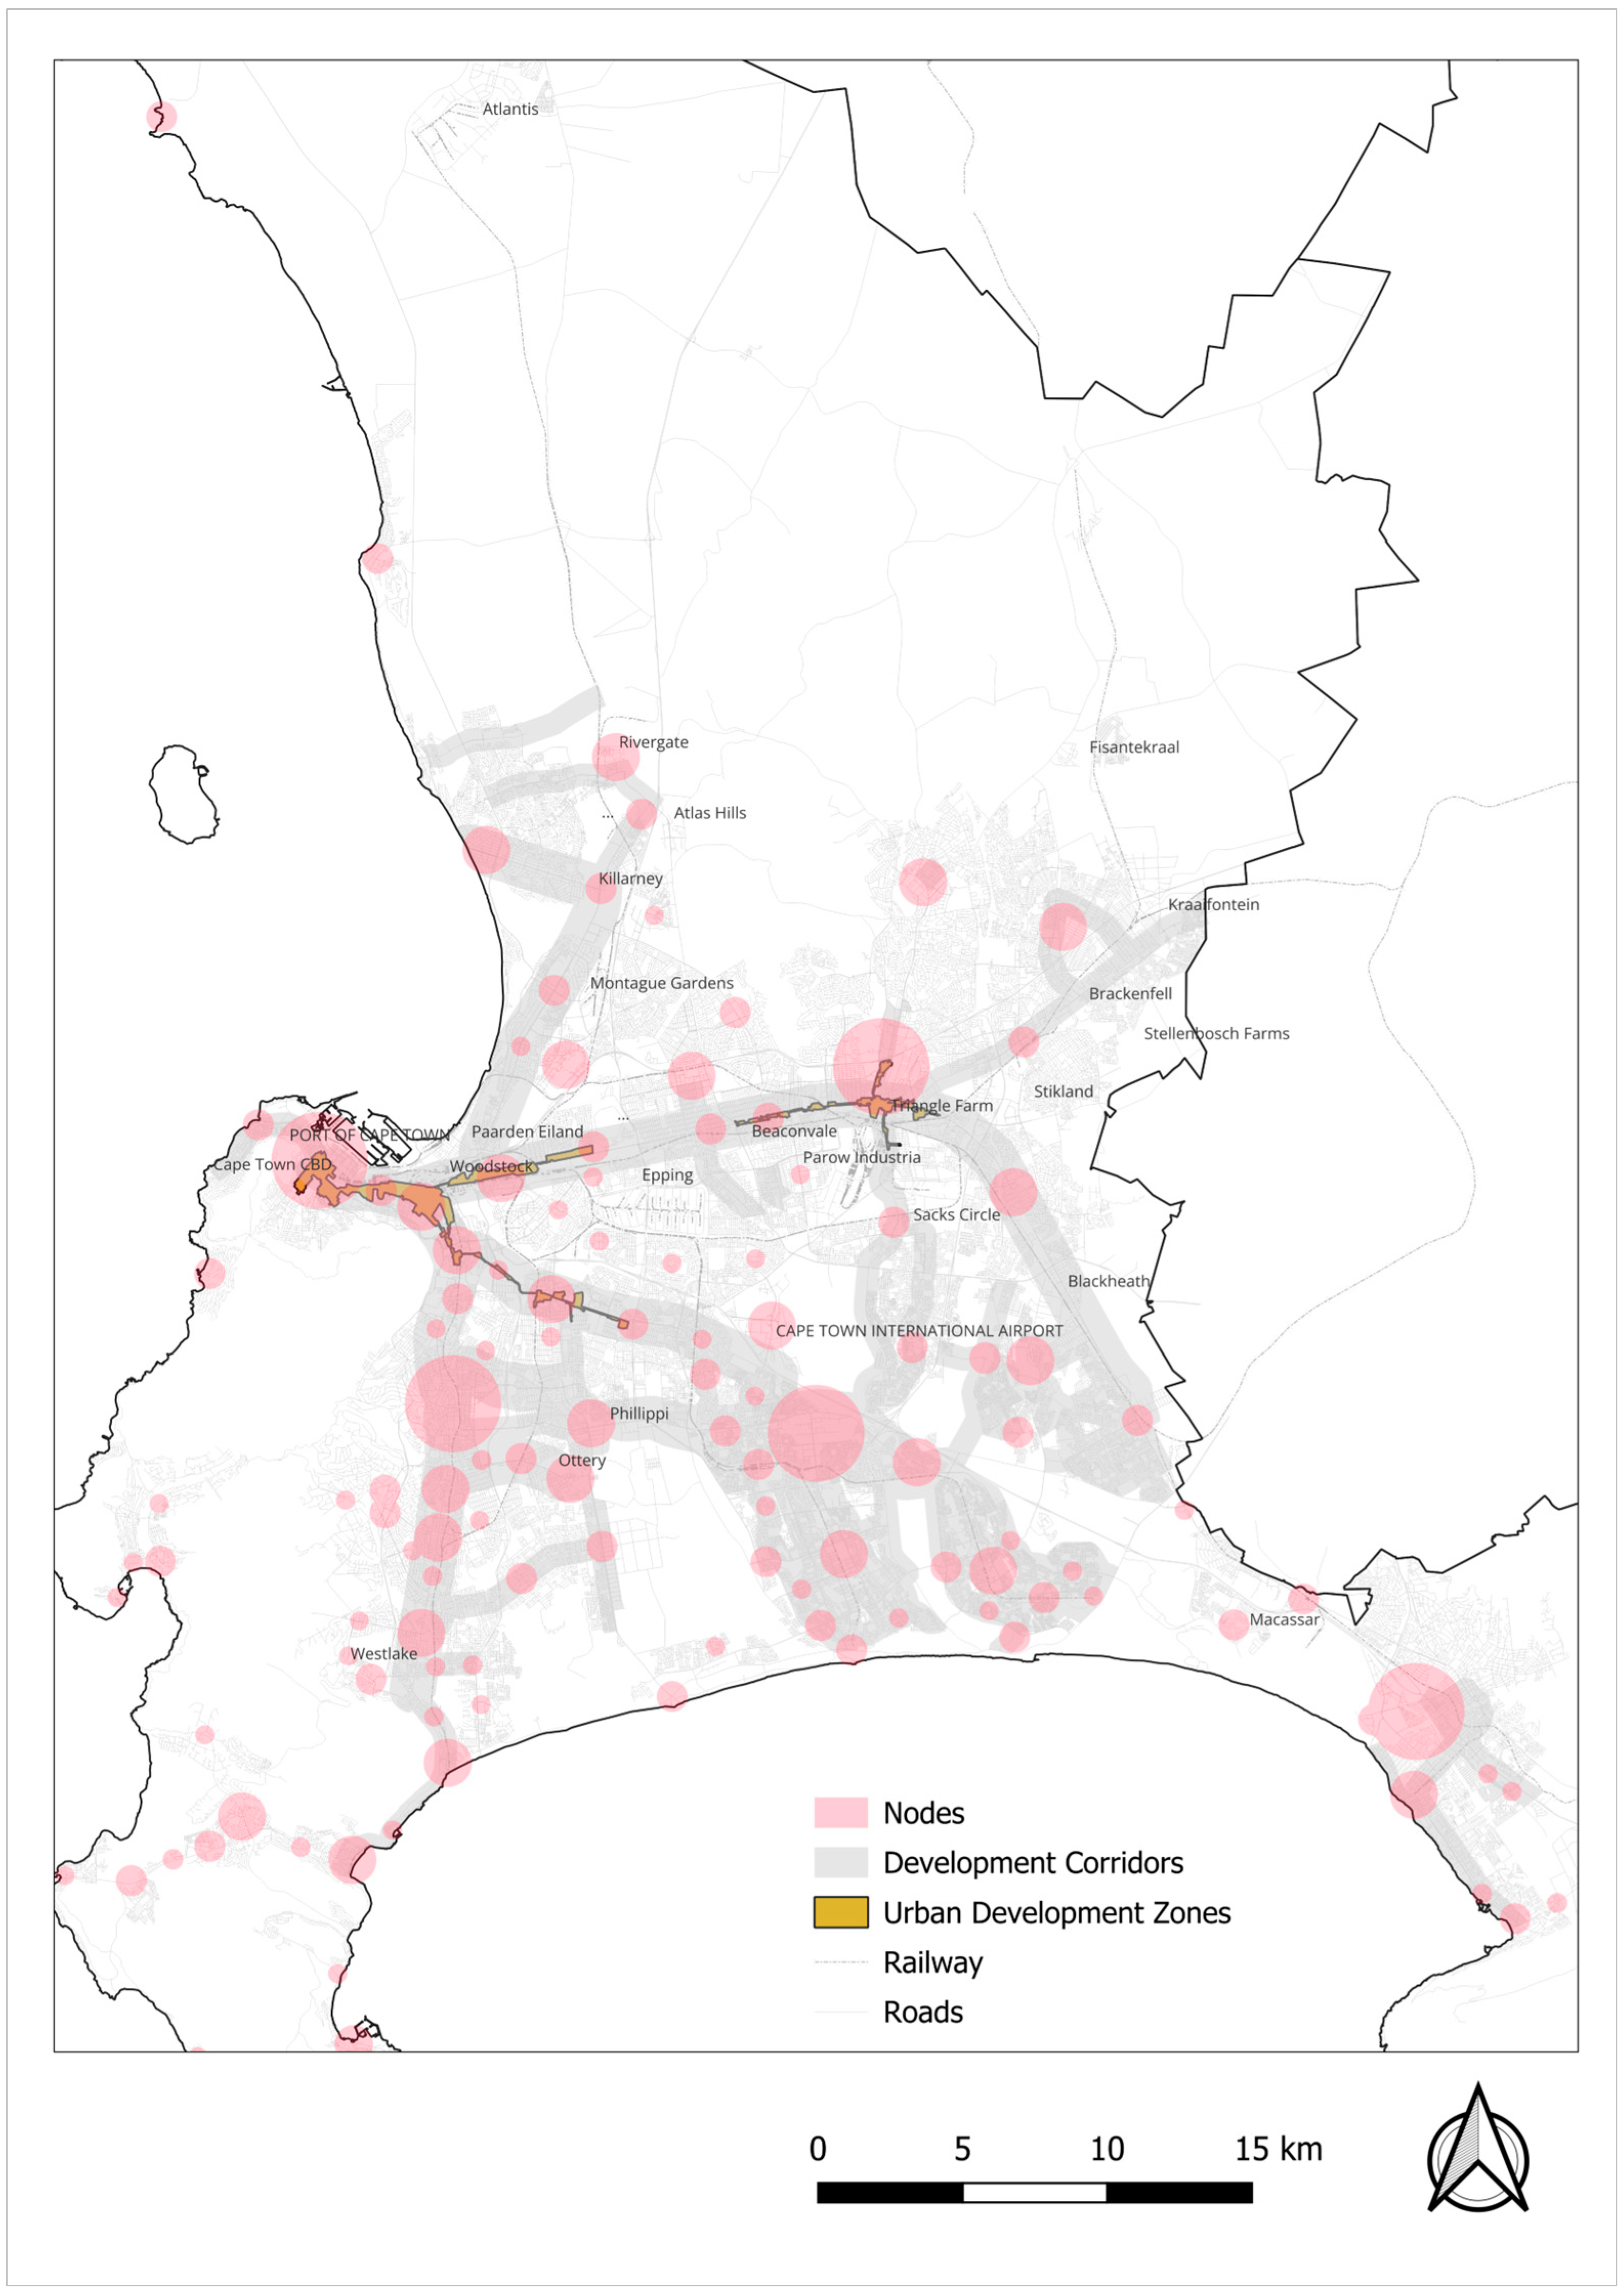
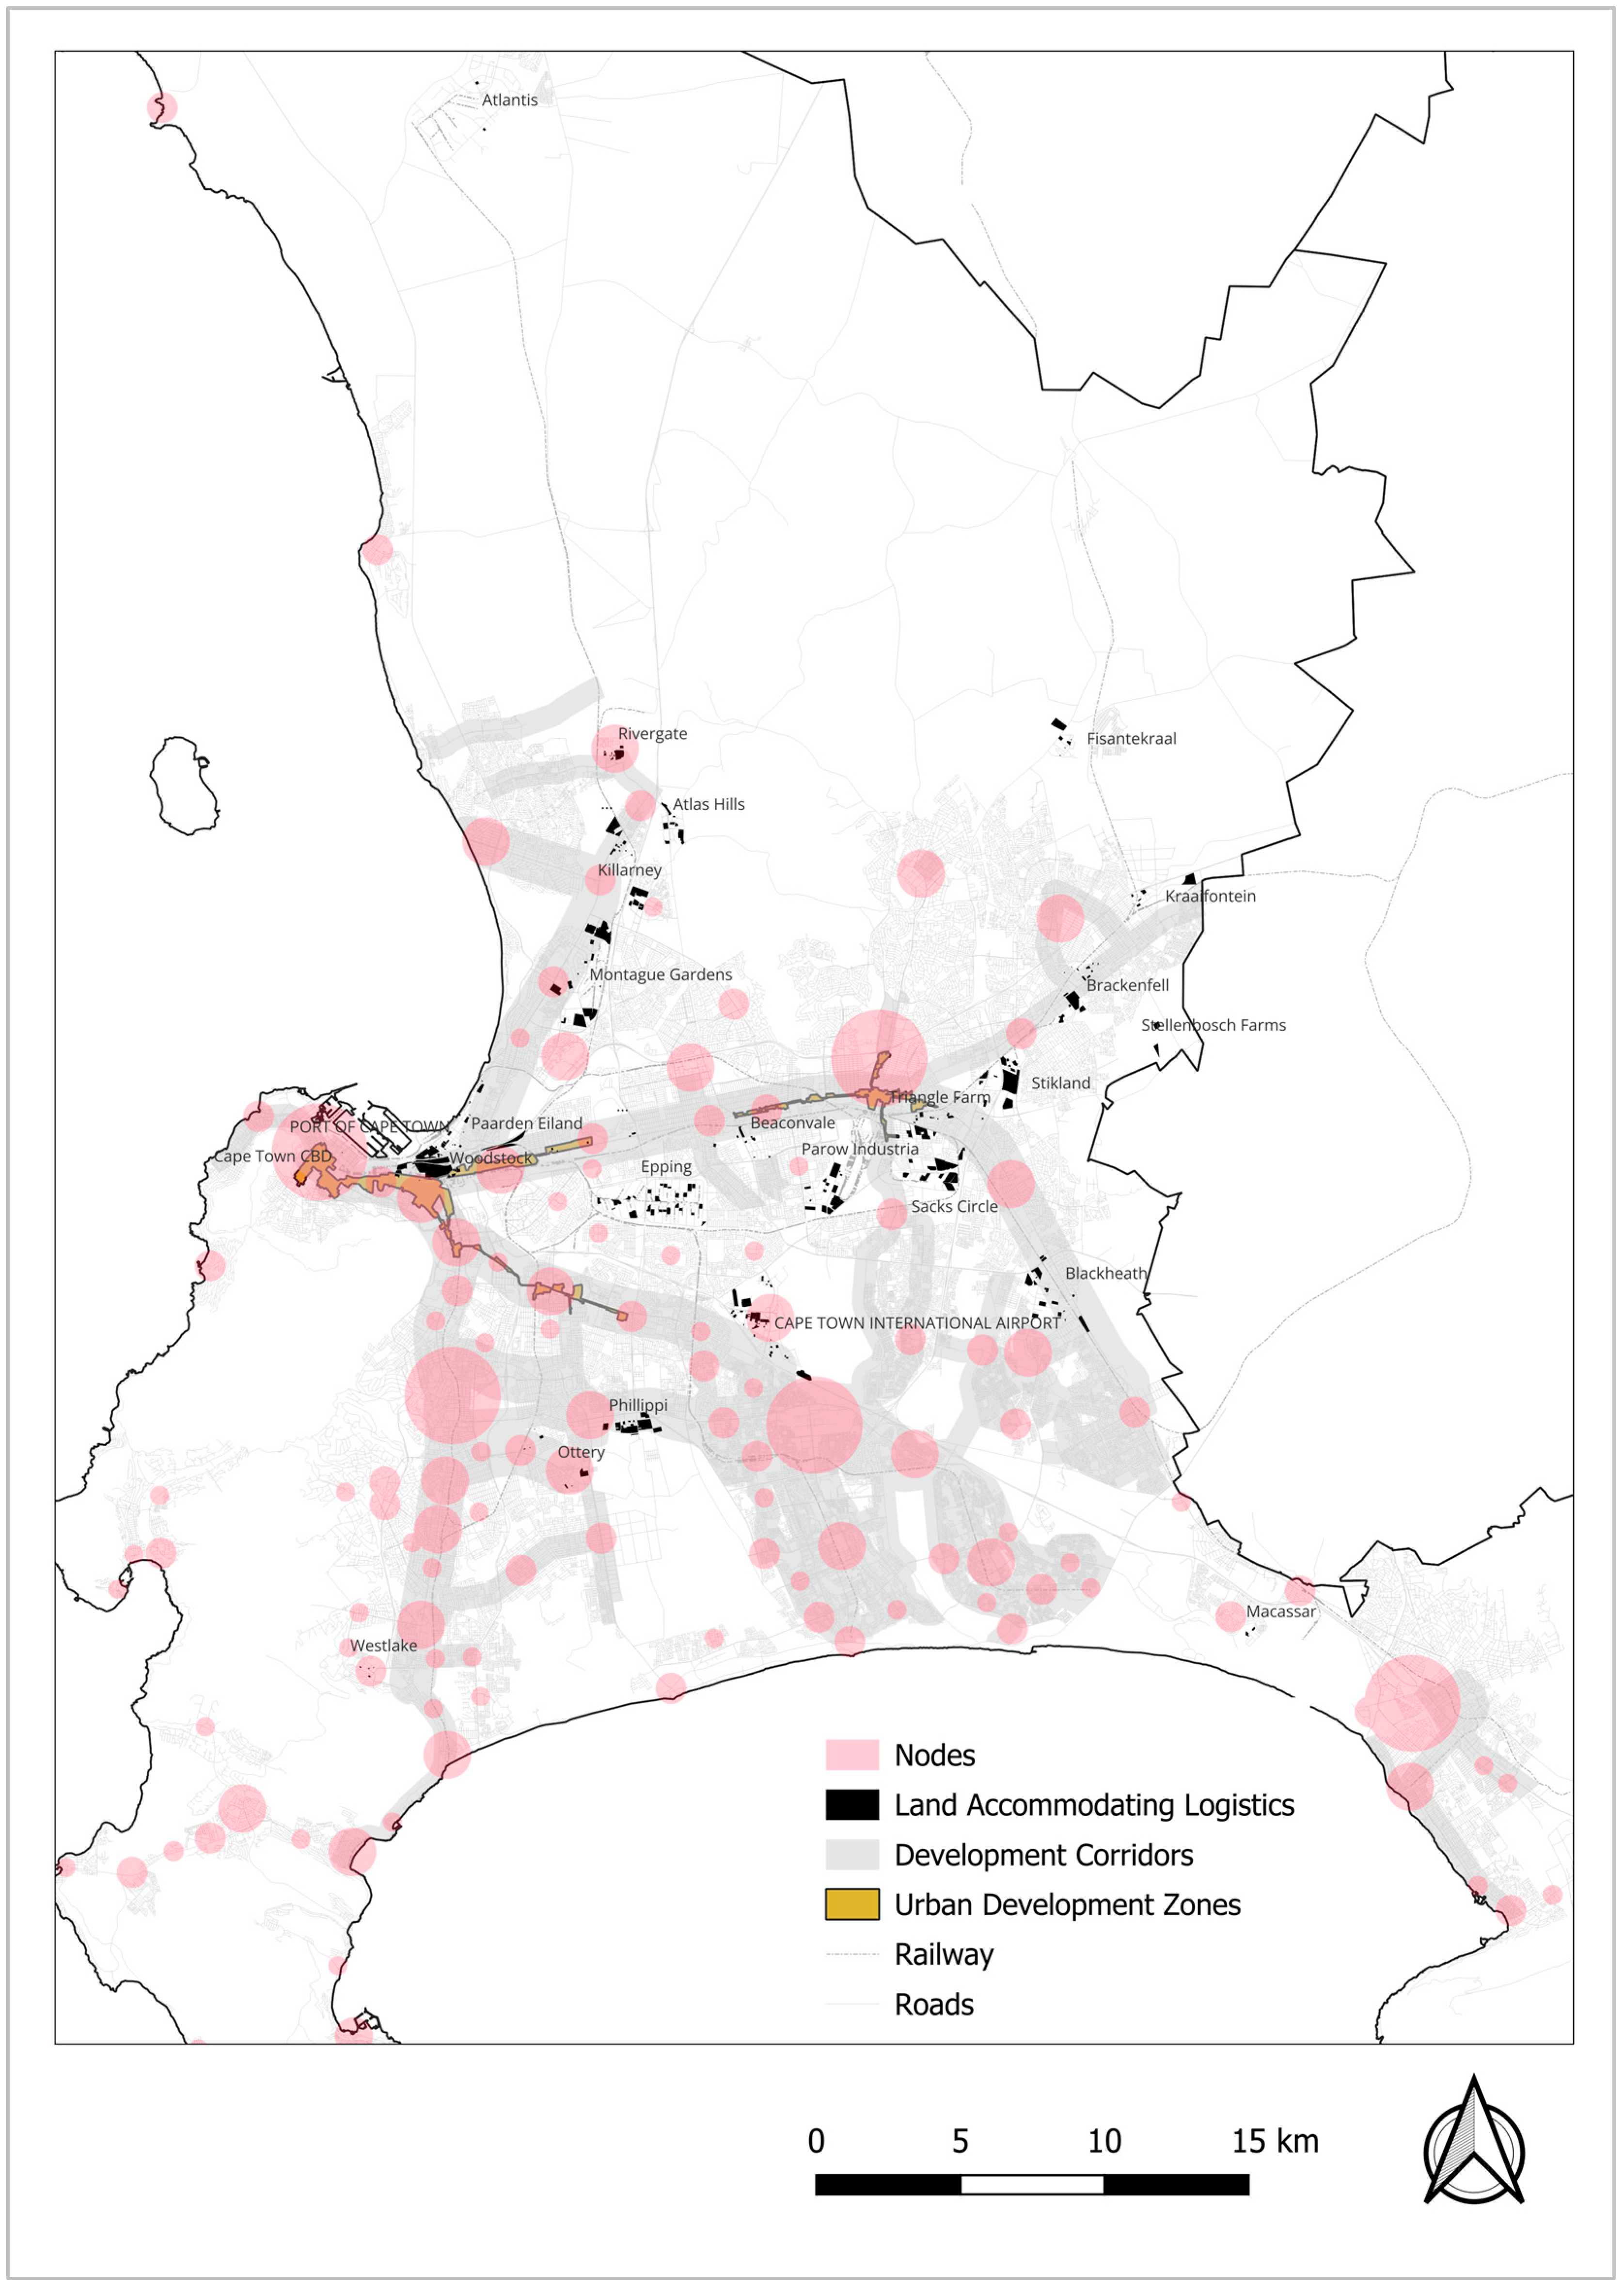
Reflecting a close connection between the City of Cape Town’s industrial/manufacturing landscape and logistics facilities placement, the findings presented in the previous section showed that the land parcels accommodating logistics facilities or activities were predominantly in the industrial areas, with a limited number in the Cape Town CBD. The largest number of land parcels were in the vicinity of the airport, the seaport, and major road infrastructure. The land parcel with the highest market value was in the Montague Gardens/Milnerton industrial area, valued at ZAR 604 million in 2018 and a staggering ZAR 712 million in 2022. The area is in one of the most accessible zones in the municipality, positioned near the junction of two national roads, the N1 and N7, and approximately 10 km to the Port of Cape Town, 14 km to the Cape Town CBD, and 19 km to Cape Town International Airport. In the 2000s, Montague Gardens was recorded as the fastest-growing industrial area in the City of Cape Town since 1985 [52]. The findings attest that the area has managed to attract investment, significantly impacting market land values and continuing the trend from the 1980s.
In terms of the average market value, the Cape Town CBD had the highest average of ZAR 99,037/m2 in 2018 and ZAR 98,814/m2 in 2022, which appeared to be an extreme outlier compared to the rest of the industrial zones, economic nodes, or neighbourhoods in the municipality. This finding aligns the work of Rai et al. [29], who argued that higher levels of service for urban goods delivery are now required, overcoming the high cost of operating freight facilities in dense urban environments like city centres [29]. Given the comparatively high market values in the CBD, it is essential to mention the nature of the logistics facilities within the two land parcels in the area: one is a service point for a multinational shipping company, and the other is a collection point for an e-commerce provider. Both of these facilities are located within mixed-use multi-storey buildings.
Paarden Eiland, near to and largely contiguous with the Port of Cape Town, had the third-highest average of ZAR 5606/m2 in 2018 and ZAR 6505/m2 in 2022, albeit it did not have properties with the highest overall value. This, in part, shows that the land parcels in Paarden Eiland are relatively small. The area is positioned in a unique or prime zone in the vicinity of the seaport and about 4 km from the Cape Town CBD and proximate to the N1 national road. Notably, in 1996, Paarden Eiland had a prime industrial rental rate about three percent higher than the municipal average [53]. The area appears to have maintained relatively high property market values or rent, specifically average values as per the study’s findings.
Previous research has acknowledged that major transport infrastructure nodes such as Cape Town International Airport and the Port of Cape Town attracted warehousing development from the 1990s [54], as also reflected by the high number of land parcels identified in this study. However, unlike the environs of the port that stood out in terms of the average values, the market values in the vicinity of the airport did not stand out, either at the highest or lowest end of the spectrum. The land parcel with the highest value near the airport was at ZAR 256 million in 2018 and ZAR 312 million in 2022. The highest average value was, however, relatively more noteworthy at ZAR 5108/m2 in 2018 and ZAR 5960/m2 in 2022.
In 2018, the land parcels with the lowest average value were ZAR 313/m2 in Blackheath, and ZAR 330/m2 in 2022 in Atlantis. As noted by Grant, Carmody, and Murphy [55], Atlantis came into existence as a so-called new town in the 1970s, which was planned to be, among others, a significant future industrial zone beyond the city. Despite the various forms of investment put into Atlantis, the area has not reached the expectation of attracting major industrial establishments [55]. In the context of logistics, this is reflected in the low average market values above. Regarding other zones with low average values, historically, in 1979, Blackheath was characterised by an industrial structure dominated by the production of non-metallic minerals and fabricated metal products [54].
Across the different industrial or logistics clusters in the City of Cape Town municipality, there was a drop in the values of some land parcels between 2018 and 2022, albeit an increase was experienced at an aggregated level across the nodes and neighbourhoods. The drop can, at least in part, be attributed to the impact of COVID-19 on property values. Notably, the study’s findings did not support the literature arguing that the value of logistics facilities, particularly warehousing, significantly increased during the COVID-19 era.
From the study’s findings, a discernible pattern identified is that, unlike areas with road-based accessibility and, to some extent, seaport and airport, zones near the railway stations, such as Woodstock, Blackheath, Parow Industria, and Goodwood, did not stand out in terms of the market property values, particularly averaged per the land parcel extent.
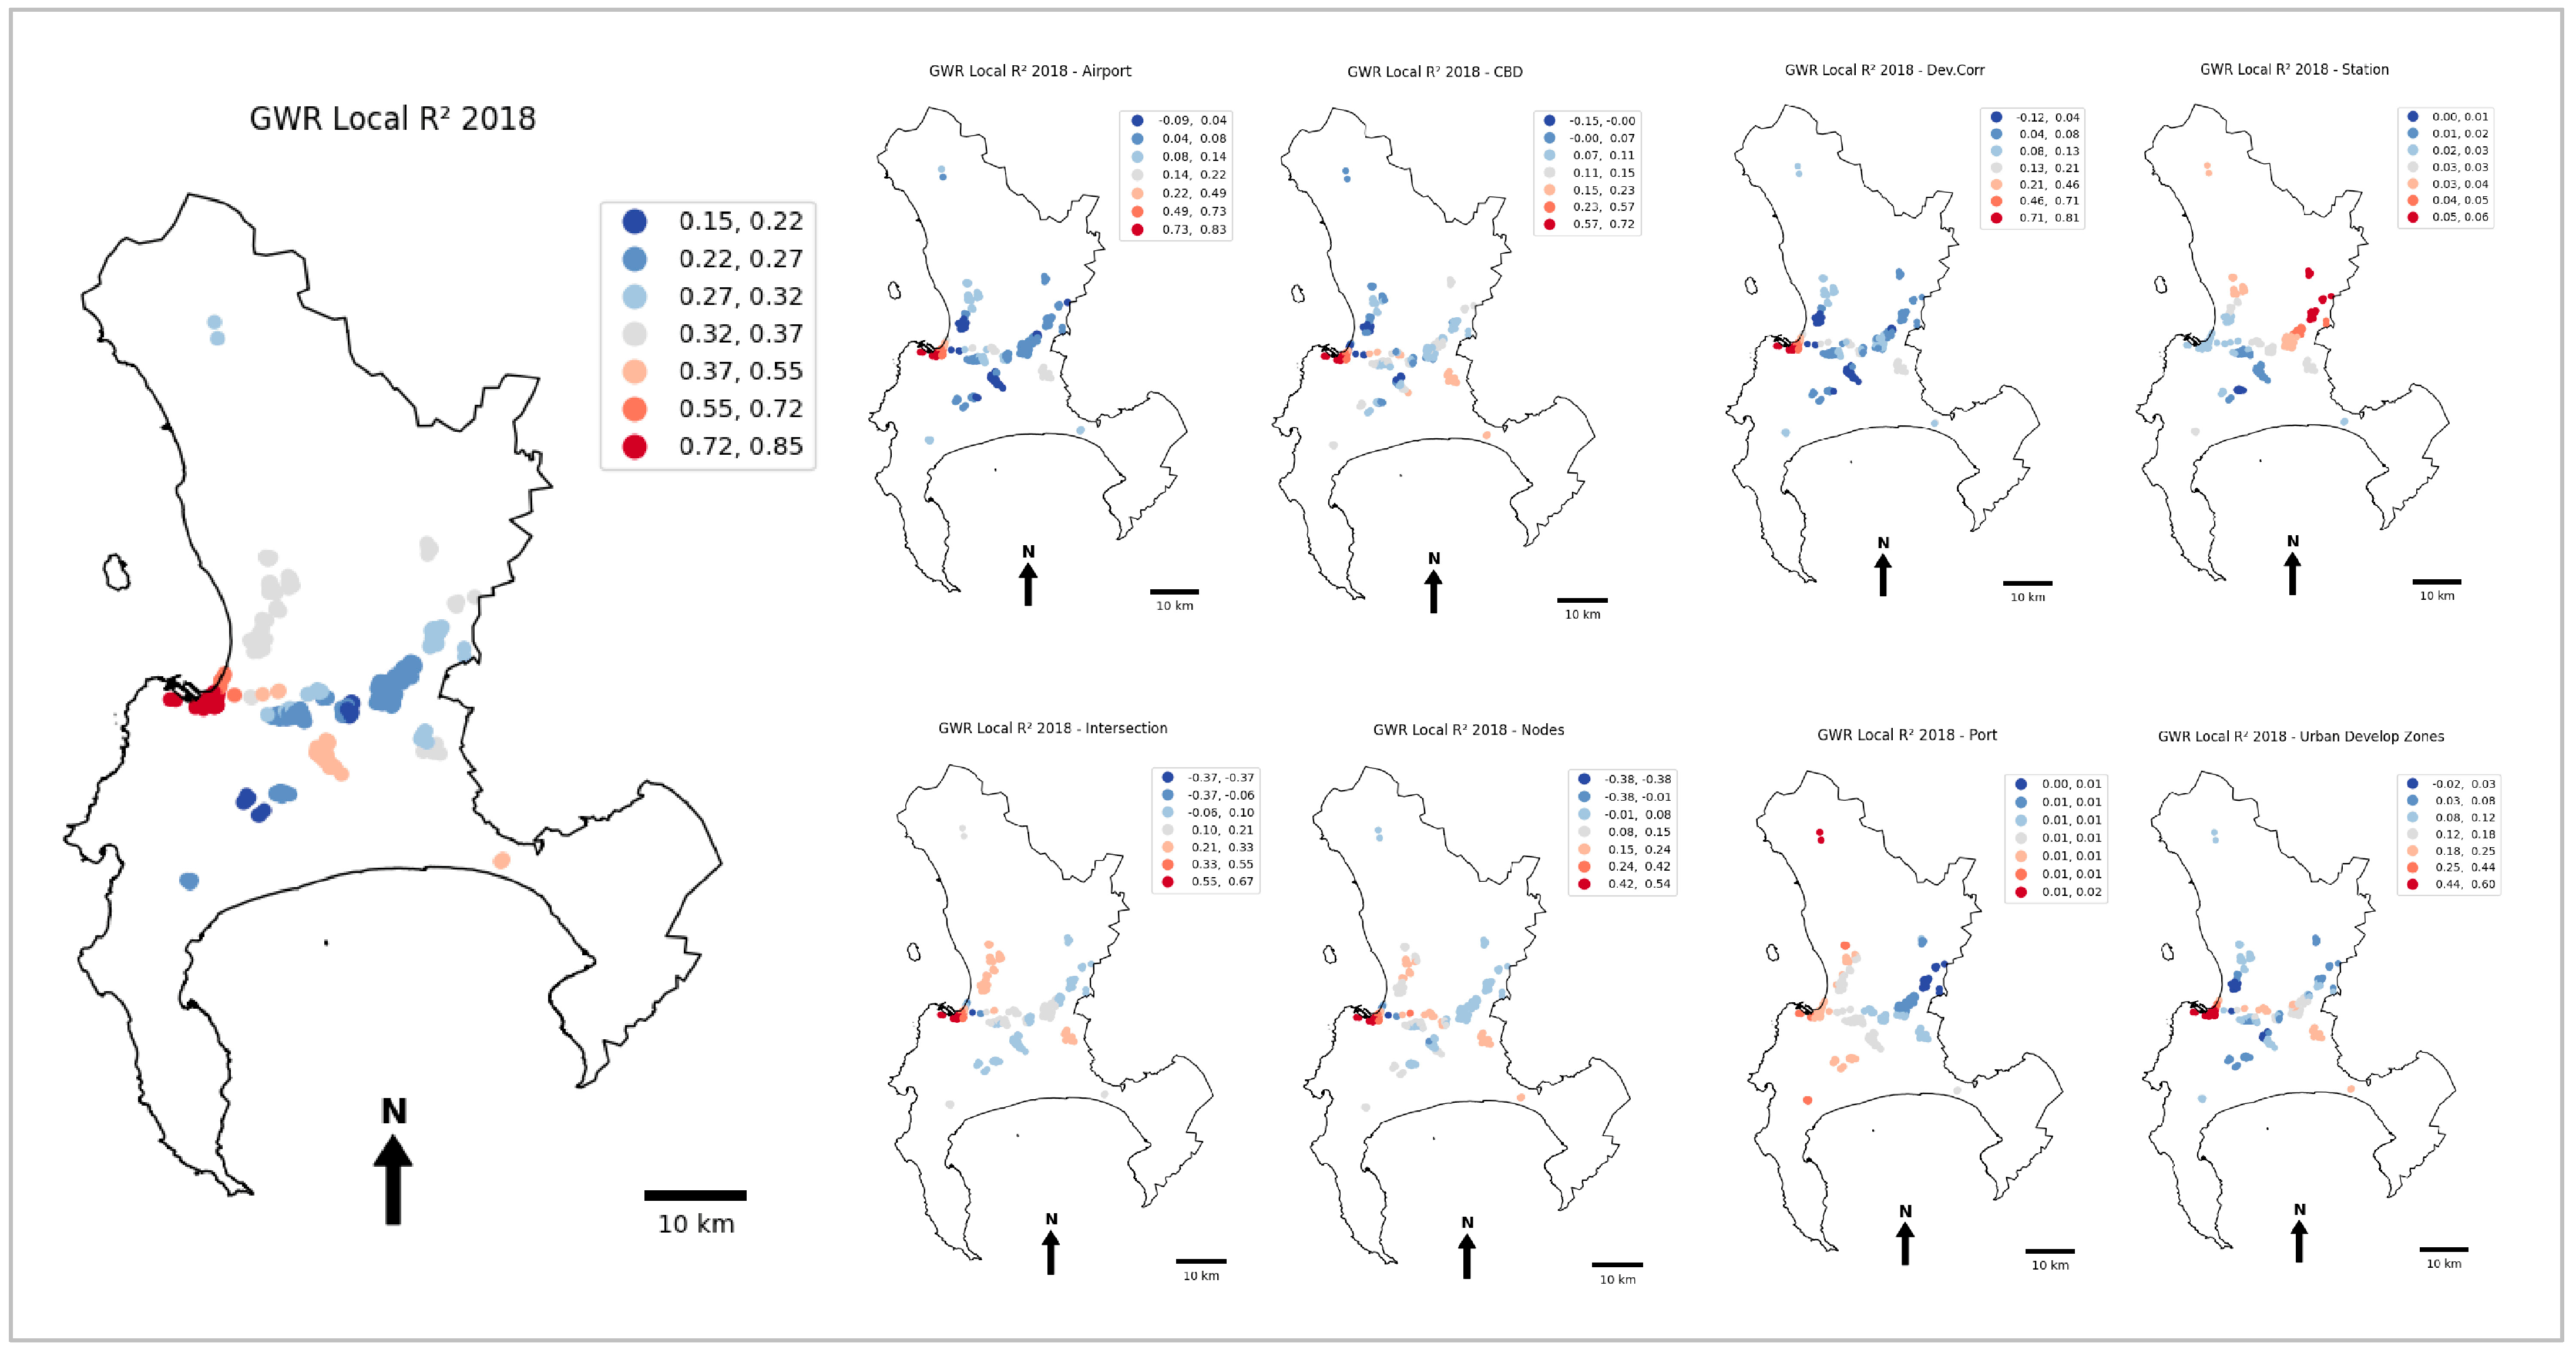
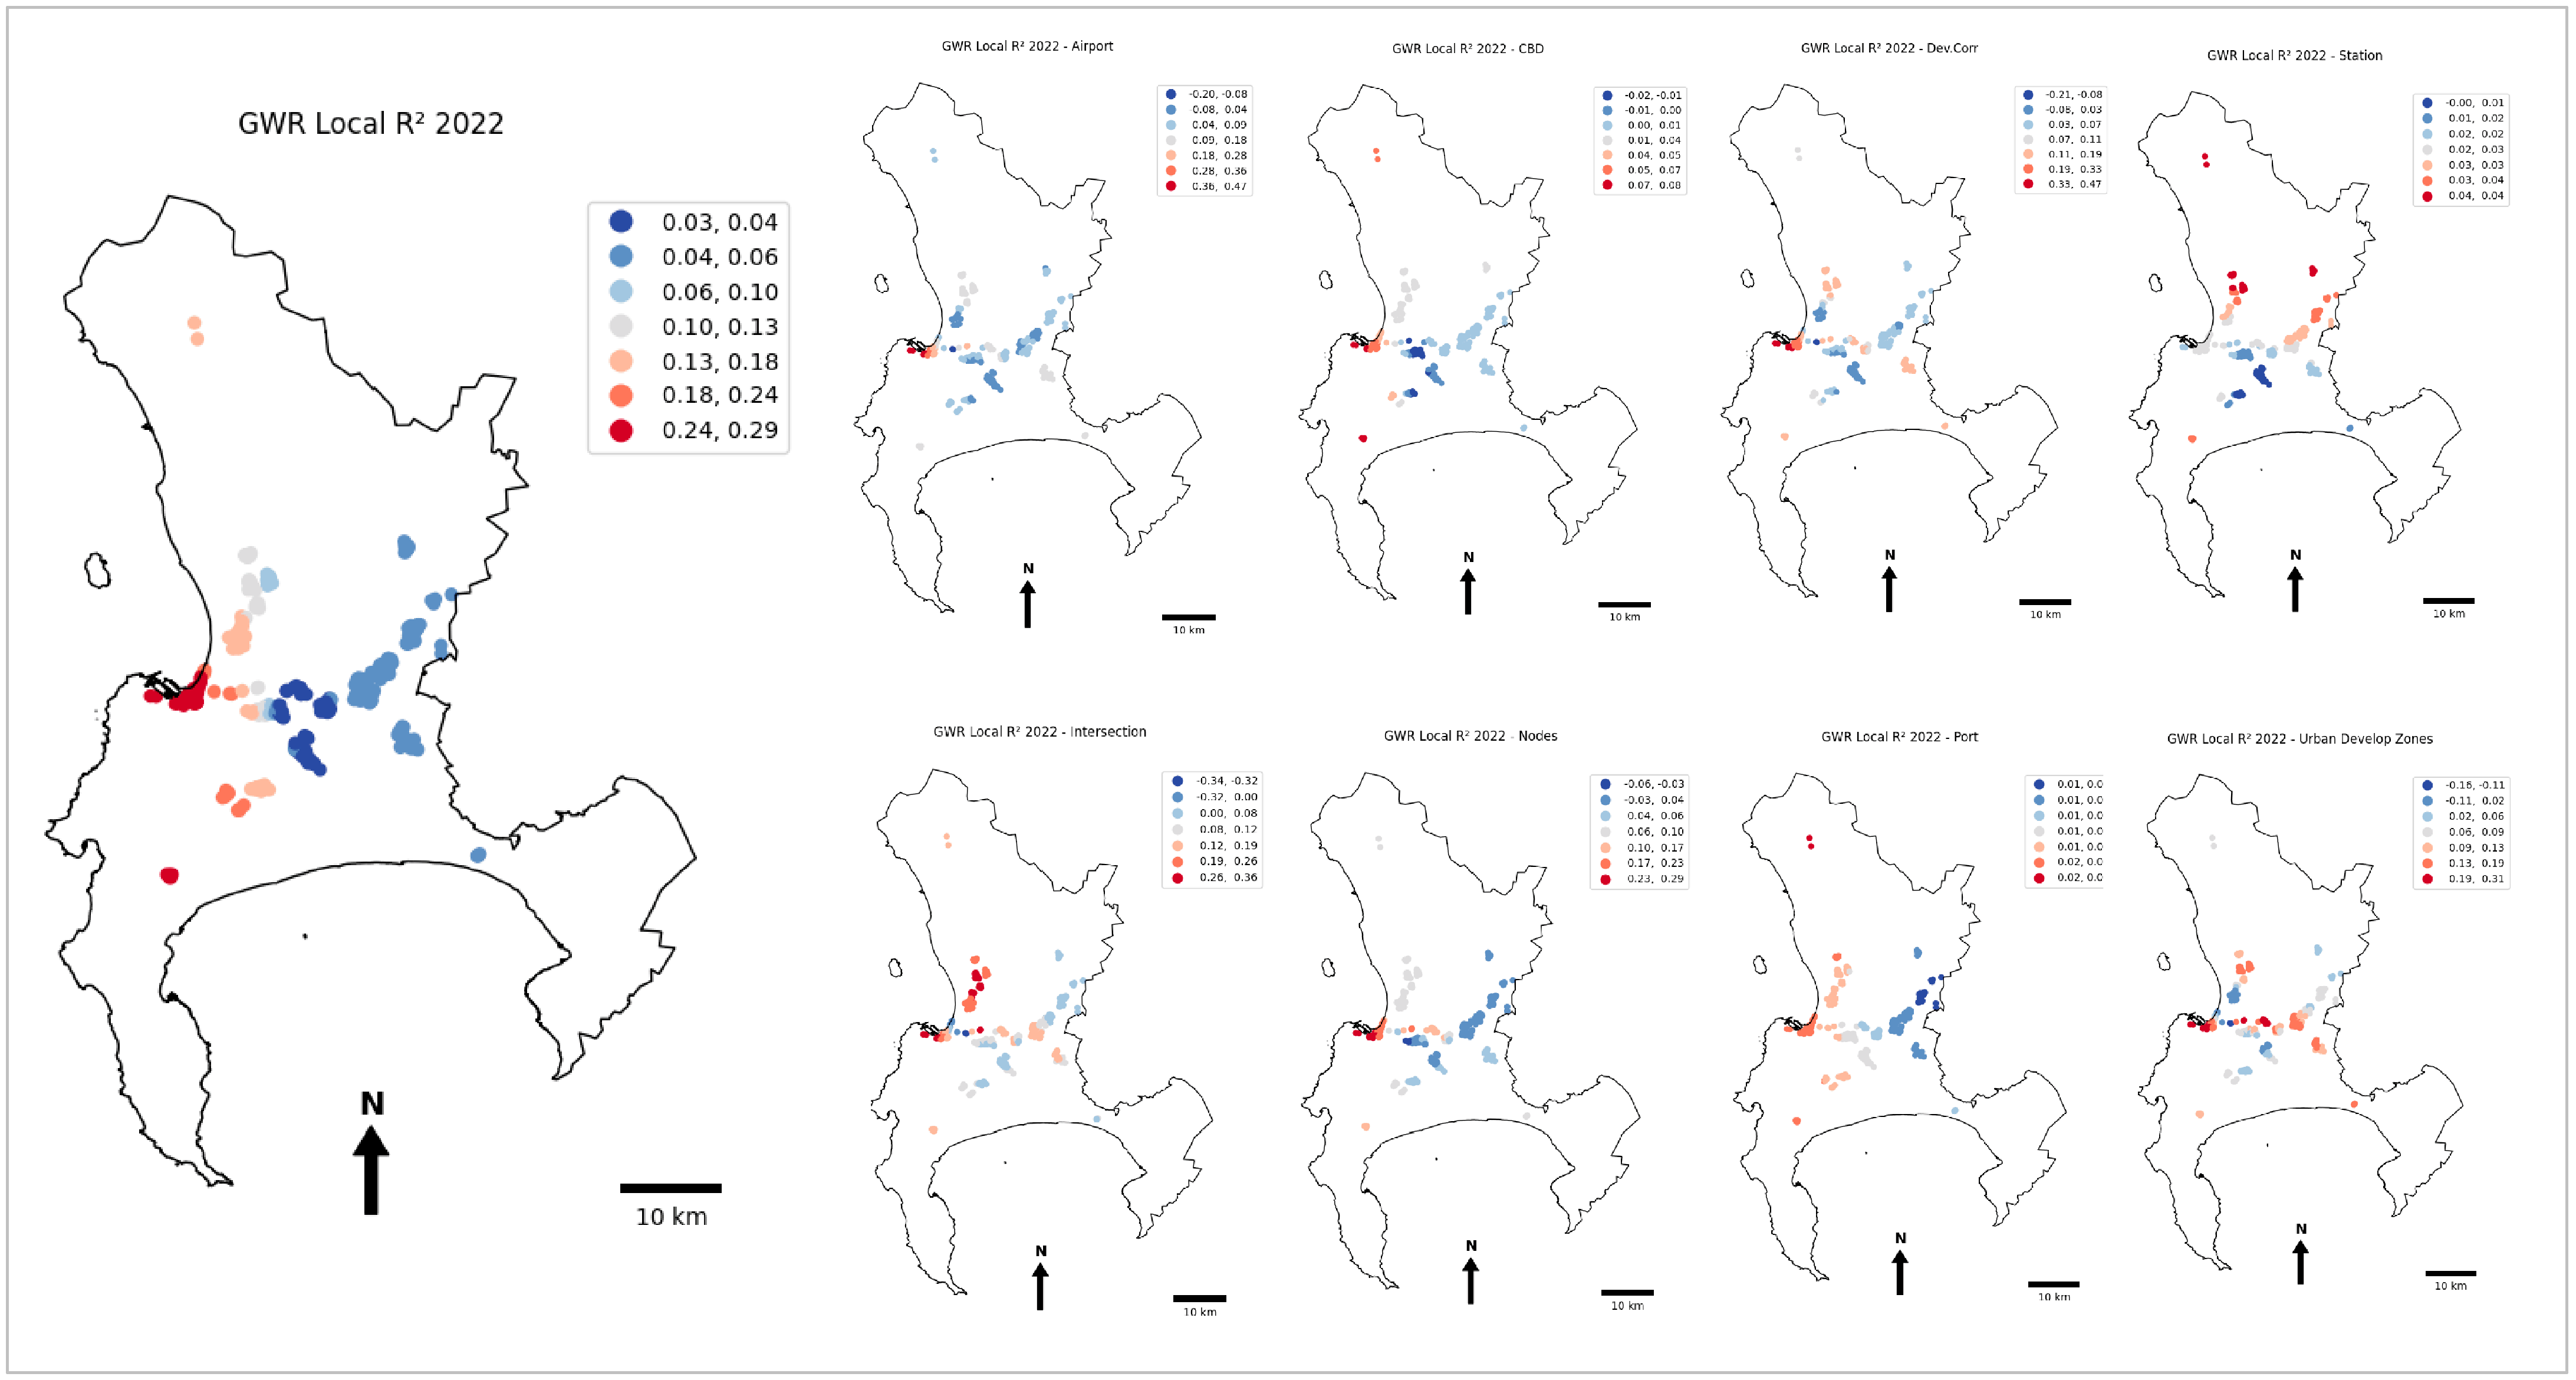
More telling findings came from the geographically weighted regression model, which yielded weak relationships between the 2018 and 2022 property market values of land accommodating logistics facilities and proximity to the CBD, nearest train station, Cape Town International Airport, major intersections, Port of Cape Town, economic nodes, development corridors, and urban development zones. These are some of the factors that the literature highlights as influential in the location choice of logistics facilities. However, partially rejecting the null hypothesis that there was no positive relationship between the dependent and independent variables, the p-values for the airport, CBD, development corridors, and seaport were statistically significant in both 2018 and 2022. Major intersections, development nodes, railway stations, and urban development zones were not statistically significant. Given the inconclusive p-value and R-squared results, the findings did not provide sufficient evidence of the positive impact of the location attributes on the property market value of land accommodating logistics facilities in the City of Cape Town municipality. It is, therefore, argued that the findings highlight the disconnect between the placement of logistics facilities and spatial planning efforts in the municipality. This aligns with the findings of Mokhele and Fisher-Holloway [54], who discovered that warehousing and distribution were not explicitly mentioned in the planning policy, and spatial planners did not understand the significance and dynamics of logistics processes in the contemporary economy. The geographical patterns of logistics facilities appear to be left mainly to an invisible hand, which, however, is not in sync with crucial locational attributes across the municipality.

6. Conclusions

This explorative paper analysed the patterns and trends of property market values of land parcels accommodating logistics facilities in the City of Cape Town municipality, South Africa. Using the 2018 and 2022 secondary data collated by the municipality through mass valuation processes, it was observed that most land parcels accommodating logistics facilities were within the so-called industrial areas, with a limited number within the dense city centre area. It was found that land parcels in the Cape Town CBD and the vicinity of the Port of Cape Town had the highest average market value, while the property with the highest market value was located in the neighbouring Montague Gardens/Milnerton. These areas are in the highly accessible sections of the municipality, with, among others, easy access to the N1 and N7 national roads. The zones near the railway line across the municipality did not portray high values (with Blackheath reflecting some of the lowest averages) compared to those with just road-based accessibility. Although the market values in the airport’s environs did not stand out either at the highest or lowest end of the spectrum, they were still noteworthy compared to the other zones analysed. In an attempt to provide a detailed interpretation of the patterns, it was found that, overall, despite the statistical significance of some locational attributes, weak relationships existed between the market value of land accommodating logistics facilities and accessibility, fiscal incentives, and spatial planning initiatives in the municipality.
In light of the study’s findings, it is recommended that relevant stakeholders strategically integrate logistics into spatial planning to improve efficiencies by promoting logistics in areas that the policy prioritises for investment. Specifically, it is recommended that the use of rail freight be revitalised in the municipality. This would potentially attract significant investment to the new and existing logistics hubs with railway access, such as the environs of Belcon inland port (in the vicinity of Parow Industrial) and Blackheath. In turn, the municipality would reap the economic benefits in terms of the rates or taxes based on market property values, while, most importantly, promoting sustainable logistics processes within the municipality. This revitalisation will be crucial in reducing logistics costs and, accordingly, averting the negative environmental impacts of logistics processes, particularly the externalities from the over-reliance on trucks for freight delivery.
As largely explorative, the paper has several limitations that warrant further research on the connections between property market values and the placement of logistics facilities:
  • Firstly, the analyses were aggregated at the land parcel level, wherein, in some cases, a single parcel accommodated multiple establishments, logistics- and non-logistics-related. Further research could, therefore, establish if there are differences in the market value of mixed-use premises compared to those used exclusively for logistics purposes;
  • Secondly, and relatedly, the analysis did not consider the heterogeneity of logistics facilities within the land parcels analysed. Therefore, future research could investigate the connections and relationships between different types of logistics facilities or logistics spaces and property market values;
  • Thirdly, further research is required to establish a tailor-made valuation approach for land accommodating logistics facilities. This would address the potential shortcomings of the mass valuation data relied upon by this study, and thereby improving the robustness of the knowledge on the relationship between locational attributes and the market value of land accommodating logistics facilities.

Funding

This research received no external funding.

Institutional Review Board Statement

Not applicable.

Informed Consent Statement

Not applicable.

Data Availability Statement

The raw data supporting the conclusions of this article will be made available by the author on request.

Conflicts of Interest

The author declares no conflicts of interest.

Abbreviations

The following abbreviations are used in this manuscript:
CBDCentral Business District
GWRGeographically Weighted Regression
OLSOrdinary Least Squares
SPSSStatistical Package for Social Sciences

References

  1. Verhetsel, A.; Kessels, R.; Goos, P.; Zijlstra, T.; Blomme, N.; Cant, J. Location of logistics companies: A stated preference study to disentangle the impact of accessibility. J. Transp. Geogr. 2015, 42, 110–121. [Google Scholar] [CrossRef]
  2. Kim, H.K.; Lee, C.W. Development of a cost forecasting model for air cargo service delay due to low visibility. Sustainability 2019, 11, 4390. [Google Scholar] [CrossRef]
  3. Yang, Z.; Chen, X.; Pan, R.; Yuan, Q. Exploring location factors of logistics facilities from a spatiotemporal perspective: A case study from Shanghai. J. Transp. Geogr. 2022, 100, 103318. [Google Scholar] [CrossRef]
  4. Tare, A.; Nefs, M.; Koomen, E.; Verhoef, E. Spatial drivers of logistics development in the Netherlands. J. Transp. Geogr. 2024, 121, 104047. [Google Scholar] [CrossRef]
  5. Hesse, M.; Rodrigue, J.-P. The transport geography of logistics and freight distribution. J. Transp. Geogr. 2004, 12, 171–184. [Google Scholar] [CrossRef]
  6. O’Connor, K.; Derudder, B.; Witlox, F. Logistics services: Global functions and global cities. Growth Change 2016, 47, 481–496. [Google Scholar] [CrossRef]
  7. Li, X. Operations management of logistics and supply chain: Issues and directions. Discret. Dyn. Nat. Soc. 2014, 2014, 1–7. [Google Scholar] [CrossRef]
  8. Lan, S.; Yang, C.; Huang, G.Q. Data analysis for metropolitan economic and logistics development. Adv. Eng. Inform. 2017, 32, 66–76. [Google Scholar] [CrossRef]
  9. Tare, A.; Nefs, M.; Koomen, E.; Verhoef, E. Mapping logistics development in the Netherlands. Agil. GISci. Ser. 2023, 4, 45. [Google Scholar] [CrossRef]
  10. Khadim, Z.; Batool, I.; Lodhi, M.B. China-Pakistan economic corridor, logistics developments and economic growth in Pakistan. Logistics 2021, 5, 35. [Google Scholar] [CrossRef]
  11. Gao, Y.; Chang, D.; Luo, T. The correlation between logistics industry and other industries: An evaluation of the empirical evidence from China. Asian J. Shipp. Logist. 2018, 34, 27–32. [Google Scholar] [CrossRef]
  12. Jaller, M.; Qian, X.; Zhang, X. Distribution facilities in California: A dynamic landscape and equity considerations. J. Transp. Land Use 2022, 15, 755–778. [Google Scholar] [CrossRef]
  13. Karatas-Cetin, C.; Denktas-Sakar, G. Logistics research beyond 2000: Theory, method and relevance. Asian J. Shipp. Logist. 2013, 29, 125–144. [Google Scholar] [CrossRef]
  14. Hesse, M. Logistics: Situating flows in a spatial context. Geogr. Comp. 2020, 14, e12492. [Google Scholar] [CrossRef]
  15. Dablanc, L.; Browne, M. Introduction to special section on logistics sprawl. J. Transp. Geogr. 2020, 88, 102390. [Google Scholar] [CrossRef]
  16. He, M.; Shen, J.; Wu, X.; Luo, J. Logistics space: A literature review from the sustainability perspective. Sustainability 2018, 10, 2815. [Google Scholar] [CrossRef]
  17. Rodrigue, J.-P. The Geography of Transport Systems, 6th ed.; Routledge: New York, NY, USA, 2024. [Google Scholar]
  18. Sakai, T.; Beziat, A.; Heitz, A. Location factors for logistics facilities: Location choice modelling considering activity categories. J. Transp. Geogr. 2020, 85, 102710. [Google Scholar] [CrossRef]
  19. Xiao, Z.; Yuan, Q.; Sun, Y.; Sun, X. New paradigm of logistics space reorganization: E-commerce, land use, and supply chain management. Transp. Res. Interdiscip. Perspect. 2021, 9, 100300. [Google Scholar] [CrossRef]
  20. Holl, A.; Mariotti, I. The geography of logistics firm location: The role of accessibility. Netw. Spat. Econ. 2018, 18, 337–361. [Google Scholar] [CrossRef]
  21. Tchang, G. The impact of highway proximity on distribution centres’ rents. Urban Stud. 2016, 53, 2834–2848. [Google Scholar] [CrossRef]
  22. Holguin-Veras, J.; Ramirez-Rios, D.; Ng, J.; Wojtowicz, J.; Haake, D.; Lawson, C.T.; Calderón, O.; Caron, B.; Wang, C. Freight-efficient land uses: Methodologies, strategies, and tools. Sustainability 2021, 13, 3059. [Google Scholar] [CrossRef]
  23. Heitz, A.; Dablanc, L.; Olsson, J.; Sanchez-Diaz, I.; Woxenius, J. Spatial patterns of logistics facilities in Gothenburg, Sweden. J. Transp. Geogr. 2018, 88, 102191. [Google Scholar] [CrossRef]
  24. Fernández, J.R.; Caralt, J.S.; Valcarce, E.V. The economic effects associated with airport cities. The case of the Josep Tarradellas—Barcelona—El Prat. Investig. Reg.—J. Res. 2023, 56, 51–68. [Google Scholar]
  25. Guerin, L.; Vieira, J.G.V.; de Oliveira, R.L.M.; de Oliveira, L.K.; Vieira, H.E.D.M.; Dablanc, L. The geography of warehouses in the Sao Paulo metropolitan region and contributing factors to this spatial distribution. J. Transp. Geogr. 2021, 91, 102976. [Google Scholar] [CrossRef]
  26. De Oliveira, L.K.; Lopes, G.P.; de Oliveira, R.L.M.; Bracarense, L.D.S.F.P.; Pitombo, C.S. An investigation of contributing factors for warehouse location and the relationship between local attributes and explanatory variables of warehouse freight trip generation. Transp. Res. A 2022, 162, 206–219. [Google Scholar] [CrossRef]
  27. De Oliveira, R.L.M.; Dablanc, L.; Schorung, M. Changes in warehouse spatial patterns and rental prices: Are they related? Exploring the case of US metropolitan areas. J. Transp. Geogr. 2022, 104, 103450. [Google Scholar] [CrossRef]
  28. De Oliveira, R.; Schorung, M.; Dablanc, L. Relationships Among Urban Characteristics, Real Estate Market, and Spatial Patterns of Warehouses in Different Geographic Contexts; Research Report; Universite Gustave Eifel: Champs-sur-Marne, France, 2021. [Google Scholar]
  29. Rai, H.B.; Kang, S.; Sakai, T.; Tejada, C.; Yuan, Q.; Conway, A.; Dablanc, L. ‘Proximity logistics’: Characterizing the development of logistics facilities in dense, mixed-use urban areas around the world. Transp. Res. A 2022, 166, 41–61. [Google Scholar]
  30. Mokhele, M.; Fisher-Holloway, B. Inclusion of warehousing and distribution in the Cape functional region’s spatial plans. Town. Reg. Plan. 2022, 80, 66–76. [Google Scholar] [CrossRef]
  31. Bencure, J.C.; Tripathi, N.K.; Miyazaki, H.; Ninsawat, S.; Kim, S.M. Development of an Innovative Land Valuation Model (iLVM) for Mass Appraisal Application in Sub-Urban Areas Using AHP: An Integration of Theoretical and Practical Approaches. Sustainability 2019, 11, 3731. [Google Scholar] [CrossRef]
  32. Thontteh, E.O. An appraisal of the extent of market maturity in Nigeria property market. IOSR J. Res. Method Educ. (IOSR-JRME) 2013, 3, 1–6. [Google Scholar] [CrossRef]
  33. Demetriou, D. The assessment of land valuation in land consolidation schemes: The need for a new land valuation framework. Land Use Policy 2016, 54, 487–498. [Google Scholar] [CrossRef]
  34. Wentzel, M.J.; van der Merwe, A. A dynamic decision-making model in property valuation in South Africa. Int. J. Bus. Manag. Invent. 2024, 13, 200–208. [Google Scholar]
  35. UNECE. Land (Real Estate) Mass Valuation Systems for Taxation Purposes in Europe; Federal Land Cadastra Service of Russia: Moscow, Russia, 2001. [Google Scholar]
  36. Grover, R. Mass valuations. J. Prop. Invest. Financ. 2016, 34, 191–204. [Google Scholar] [CrossRef]
  37. City of Cape Town. General and Supplementary Valuations and Property Rates. FAQs. 2024. Available online: https://resource.capetown.gov.za/documentcentre/Documents/Procedures%2C%20guidelines%20and%20regulations/GeneralAndSupplementaryValuationsFAQs.pdf (accessed on 25 February 2025).
  38. Oyedeji, J.O. The impact of COVID-19 on real estate transaction in Lagos, Nigeria. Int. J. Real Estate Stud. INTREST 2020, 14, 107–112. [Google Scholar] [CrossRef]
  39. Kaklauskas, A.; Zavadskas, E.K.; Lepkova, N.; Raslanas, S.; Dauksys, K.; Vetloviene, I.; Ubarte, I. Sustainable Construction Investment, Real Estate Development, and COVID-19: A Review of Literature in the Field. Sustainability 2021, 13, 7420. [Google Scholar] [CrossRef]
  40. Wesgro. Air Freight Flows to and from the Western Cape. 2021. Available online: https://www.wesgro.co.za/uploads/files/Air-freight.pdf (accessed on 12 January 2025).
  41. Havenga, J.H.; De bod, A.; Simpson, Z.P.; Swartz, S.; Witthöf, I.E. A Proposed Freight and Passenger Road-to-Rail Strategy for South Africa; UNU-WIDER: Helsinki, Finland, 2021. [Google Scholar]
  42. Sinclair-Smith, K.; Turok, I. The changing spatial economy of cities: An exploratory analysis of Cape Town. Dev. S. Afr. 2012, 29, 391–417. [Google Scholar] [CrossRef]
  43. City of Cape Town Municipality. Municipal Spatial Development Framework; Chapter 1–6 and Technical Supplement A; City of Cape Town Municipality: Cape Town, South Africa, 2023; Volume 1. [Google Scholar]
  44. The Urban Development Zone. Available online: https://www.capetown.gov.za/work%20and%20business/doing-business-in-the-city/business-support-and-guidance/urban-development-zones (accessed on 25 May 2025).
  45. Heitz, A.; Launay, P.; Beziat, A. Rethinking data collection on logistics facilities. New approach for determining the number and spatial distribution of warehouses and terminal in metropolitan areas. Transp. Res. Rec. 2017, 2609, 67–76. [Google Scholar] [CrossRef]
  46. Mokhele, M. Data related challenges towards analysing the spatial economic attributes of airport-centric developments. In Proceedings of the Academic Track of the AfricaGEO 2018 Conference, Gauteng, South Africa, 17–19 September 2018. [Google Scholar]
  47. Biljecki, F.; Ito, K. Street view imagery in urban analytics and GIS: A review. Landsc. Urban. Plann. 2021, 215, 10427. [Google Scholar] [CrossRef]
  48. Lu, B.; Charlton, M.; Harris, P.; Fotheringham, A.S. Geographically weighted regression with a non-Euclidean distance metric: A case study using hedonic house price data. Int. J. Geogr. Inf. Sci. 2014, 28, 660–681. [Google Scholar] [CrossRef]
  49. Yeong, Y.-Y.; Yue, J.C. A modification to geographically weighted regression. Int. J. Health. Geogr. 2017, 16, 11. [Google Scholar]
  50. Paez, A. Anisotropic variance functions in geographically weighted regression models. Geog. Anal. 2004, 36, 299–314. [Google Scholar] [CrossRef]
  51. Wasserstein, R.L.; Lazar, N.A. The ASA statement on p-values: Context, process and purpose. Am. Stat. 2016, 70, 129–133. [Google Scholar] [CrossRef]
  52. Mokhele, M. Spatial economic evolution of the airport-centric developments of Cape Town and OR Tambo international airports in South Africa. Town Reg. Plan. 2017, 70, 26–36. [Google Scholar] [CrossRef]
  53. City of Cape Town Municipality. MSDF Review/New City SDF. Phase 1: Spatial Analysis, Trends and Implications; City of Cape Town Municipality: Cape Town, South Africa, 2002. [Google Scholar]
  54. Mokhele, M.; Fisher-Holloway, B. Characterising the evolution of the urban form of zones that accommodate warehousing clusters in the City of Cape Town municipality. S. Afr. J. Geomat. 2024, 13, 251–268. [Google Scholar] [CrossRef]
  55. Grant, R.; Carmody, P.; Murphy, J.T. A green transition in South Africa? Sociotechnical experimentation in the Atlantis special economic zone. J. Mod. Afr. Stud. 2020, 58, 181–211. [Google Scholar] [CrossRef]
Figure 1. City of Cape Town municipality.
Sustainability 17 05776 g001
Figure 2. Example of logistics-related building shape and space for trucks. Source: Google Maps.
Sustainability 17 05776 g002
Figure 3. Example of the unique shape and size of shipping containers. Source: Google Maps.
Sustainability 17 05776 g003
Figure 4. Land accommodating logistics facilities in the City of Cape Town.
Sustainability 17 05776 g004
Figure 5. Aggregated and disaggregated R2 for 2018.
Sustainability 17 05776 g005
Figure 6. Aggregated and disaggregated R2 for 2022.
Sustainability 17 05776 g006
Table 1. Dependent and independent variables analysed.
Dependent VariableIndependent/Explanatory Variable
Land accommodating logistics facilitiesDistance to the nearest train station
Distance to the airport
Distance to the nearest major intersections
Distance to the CBD
Distance to the seaport
Distance to the nearest nodes
Distance to nearest development corridors
Distance to the nearest urban development zone
Table 2. Identified land parcels across various zones.
Industrial/Economic
Node/Neighbourhood
Number of Identified Land Parcels
20182022
Airport environs3435
Atlantic Hills710
Atlantis22
Beaconvale/Elsiesrivier1010
Blackheath1515
Brackenfell2121
Cape Town CBD22
Epping3030
Fisantekraal66
Goodwood55
Killarney1616
Kraaifontein89
Kuilsrivier66
Macassar43
Maitland11
Montague Gardens1616
Richmond Park55
Ottery/Hill Star88
Paarden Eiland2121
Parow Industria1515
Philippi1515
Rivergate1010
Sacks Circle/Bellville South Industria1616
Stellenbosch Farms22
Stikland/Brackenfell1717
Triangle Farm1515
Westlake44
Woodstock/Salt River1515
Total 326330
Table 3. Descriptive statistics.
Economic NodeAirportAtlantic HillsAtlantisBeaconvale/Elsiesrivier IndustriaBlackheathBrackenfellCape Town CBD
Year20182022201820222018202220182022201820222018202220182022
NValid34357102210101515212122
Missing10301111000000
Mean32,268,176.4740,861,428.5744,351,428.5733,771,0005,460,0004,310,00014,163,70014,114,00023,397,60033,464,133.3330,521,428.5732,043,809.52495,797,500501,285,000
Median15,681,50012,600,00025,400,00012,650,0005,460,0004,310,0009,800,00010,000,00016,801,00016,800,0008,000,0008,650,000495,797,500501,285,000
Mode1,135,000 b5,100,0003,960,000 b3,970,000 b4,720,000 b3,270,000 b3,851,000 b2,800,000 b2,800,000 b2,800,000 b8,000,0009,350,000389,475,000 b372,200,000 b
Std. Deviation49,524,103.6670,709,615.653,889,508.744,444,452.61,046,518.041,470,782.1113,969,446.116,153,436.621,335,207.641,784,87472,582,190.984,440,909150,362,721182,553,758
Range254,865,000308,900,000151,790,000142,380,0001,480,0002,080,00047,149,00053,800,00068,300,000161,000,000334,240,000392,340,000212,645,000258,170,000
Minimum1,135,0003,300,0003,960,0003,970,0004,720,0003,270,0003,851,0002,800,0002,800,0002,800,0002,160,0002,160,000389,475,000372,200,000
Maximum256,000,000312,200,000155,750,000146,350,0006,200,0005,350,00051,000,00056,600,00071,100,000163,800,000336,400,000394,500,000602,120,000630,370,000
Economic NodeEppingFisantekraalGoodwoodKillarneyKraaifonteinKuilsrivierMacassar
Year20182022201820222018202220182022201820222018202220182022
NValid303066551616896643
Missing00000000100001
Mean46,580,00047,866,666.6710,856,666.6714,315,00013,358,500.88,596,00015,694,62513,741,87539,525,00029,096,666.6741,469,00052,000,0005,926,50012,300,000
Median42,150,00038,300,0004,205,00010,875,00010,507,5509,330,0006,775,0006,615,0005,390,0005,760,00026,146,00035,000,0004,622,50014,200,000
Mode7,400,000 b7,100,000 b1,560,0002,090,000 b5,610,000 b4,430,000 b1,700,0001,970,000 b3,780,0002,140,0006,889,000 b16,400,000 b1,800,000 b2,600,000 b
Std. Deviation32,421,878.536,082,94414,172,69314,024,676.510,134,570.72,488,720.5617,584,50513,735,777.786,599,377.357,261,290.1545,454,95142,945,127.85,069,100.418,903,370.15
Range124,900,000138,100,00035,740,00035,810,00025,350,0006,670,00056,300,00049,290,000250,120,000177,160,000124,211,000114,700,00010,861,00017,500,000
Minimum7,400,0007,100,0001,560,0002,090,0005,610,0004,430,0001,700,0001,970,0002,280,0002,140,0006,889,00016,400,0001,800,0002,600,000
Maximum132,300,000145,200,00037,300,00037,900,00030,960,00011,100,00058,000,00051,260,000252,400,000179,300,000131,100,000131,100,00012,661,00020,100,000
Economic NodeMontague Gardens/MilnertonRichmond ParkOttery/Hill StarPaarden EilandParow IndustriaPhilippiRivergate
Year20182022201820222018202220182022201820222018202220182022
NValid161645882121151513151010
Mission00100011002000
Mean119,124,375121,575,00046,930,00098,420,00022,672,25021,896,25035,362,521.945,474,761.962,780,666.6763,033,333.3362,050,307.6959,013,333.3318,280,50020,630,000
Median42,000,00039,100,00037,945,00055,400,00012,990,50011,900,00017,150,00021,475,00053,021,00062,500,00018,260,00023,000,0004,307,5006,990,000
Mode6,200,000 b5,900,000 b32,000,000 b28,500,000 b1,250,000 b1,120,000 b17,960 b4,670,000 b4,748,000 b5,500,000 b1,850,000 b5,000,000 b0 b2,030,000 b
Std. Deviation155,057,111.1177,920,868.222,184,164110,842,53235,370,272.130,069,065.239,418,731.949,161,567.454,807,083.753,345,32698,267,181.784,977,68540,454,194.640,531,385.4
Range597,800,000706,100,00047,830,000266,200,000106,847,00090,880,000144,902,040150,730,000216,791,000200,500,000287,150,000305,000,000132,755,000132,970,000
Minimum6,200,0005,900,00032,000,00028,500,0001,250,0001,120,00017,9604,670,0004,748,0005,500,0001,850,0005,000,00002,030,000
Maximum604,000,000712,000,00079,830,000294,700,000108,097,00092,000,000144,920,000155,400,000221,539,000206,000,000289,000,000310,000,000132,755,000135,000,000
Economic NodeSacks Circle/Bellville SouthStellenbosch FarmsStiklandTriangle FarmWestlakeWoodstock/Salt River
Year201820222018202220182022201820222018202220182022
NValid15152217171515441515
Missing110000002200
Mean75,899,133.3379,220,0005,765,0006,800,00065,196,058.8278,585,294.1225,297,973.3324,036,666.6717,272,00017,412,00038,389,039.883,346,000
Median54,400,00053,500,0005,765,0006,800,00030,560,00021,700,00021,037,00023,400,00015,024,00014,174,00016,350,00017,030,000
Mode54,400,00056,400,0004,730,000 b5,100,000 b2,592,000 b1,900,000 b2,880,000 b3,100,0003,840,000 b5,300,000 b1,386,290 b1,710,000 b
Std. Deviation72,147,420.577,696,471.71,463,711.042,404,163.0693,684,633164,580,48023,417,862.818,355,229.613,542,98813,392,148.551,648,548.3176,957,715
Range282,300,000290,600,0002,070,0003,400,000327,538,000684,450,00078,620,00050,700,00031,360,00030,700,000186,643,710674,790,000
Minimum18,000,00020,000,0004,730,0005,100,0002,592,0001,900,0002,880,0003,100,0003,840,0005,300,0001,386,2901,710,000
Maximum300,300,000310,600,0006,800,0008,500,000330,130,000686,350,00081,500,00053,800,00035,200,00036,000,000188,030,000676,500,000
b. Multiple modes exist. The smallest value is shown.
Table 4. Market property values relative to land parcel extent.
NodeYearNMinimumMaximumSumMean
Airport201834307.505108.2396,342.782833.6111
202235598.505960.4499,936.202855.3201
Atlantic Hills20187815.153557.0112,605.521800.7885
202210817.213014.1818,688.101868.8099
Atlantis20182477.39923.171400.56700.2816
20222330.74796.611127.34563.6712
Beaconvale/Elsiesrivier Industria2018101034.353678.6319,737.471973.7474
202210741.293984.7018,189.211818.9206
Blackheath201815313.313572.9322,825.771521.7181
202215509.353609.0225,649.331709.9551
Brackenfell201821767.575069.4753,255.622535.9818
202221711.095745.4051,761.022464.8102
CBD2018291,368.74106,705.48198,074.2299,037.1100
2022295,655.54101,972.60197,628.1498,814.0707
Epping2018301192.665543.6879,595.932653.1976
2022301085.634428.8377,831.102594.3699
Fisantekraal20186203.541560.006287.031047.8380
20226206.813683.7412,016.692002.7823
Goodwood201851395.896137.5917,865.293573.0582
202251097.955116.8212,478.222495.6436
Killarney201816594.263293.0230,938.031933.6268
202216525.203200.0030,584.561911.5352
Kraaifontein20188278.595264.6217,517.642189.7053
20229488.762980.5013,141.951460.2172
Kuilsrivier20186256.162153.988995.291499.2155
202261466.772565.7211,350.871891.8121
Macassar20184807.661206.844061.111015.2780
202231325.852319.144998.541666.1790
Montague Gardens201816896.324093.1437,912.722369.5453
202216817.893235.2935,062.472191.4044
Richmond Park201841365.122277.867822.861955.7141
202251445.383001.0810,729.502145.8990
Ottery/Hill Star201881507.848695.6526,584.533323.0661
202281351.039656.2229,571.473696.4342
Paarden Eiland2018210.9517,322.41117,729.125606.1484
2022211202.2817,979.58136,611.736505.3204
Parow Industria201815991.043885.1734,859.572323.9713
2022151224.573901.2434,275.002284.9998
Philippi201813155.884005.6730,215.062324.2355
202215421.304675.7939,602.982640.1989
Rivergate2018100.008988.4443,349.864334.9865
2022101533.669624.2848,534.924853.4921
Sacks Circle/Bellville South Industria201815802.913470.2926,782.491785.4996
202215801.504135.3826,784.521785.6345
Stellenbosch Farms20182111.12161.70272.81136.4066
20222119.81202.12321.93160.9647
Stikland/Brackenfell201817797.546770.2946,466.482733.3225
202217584.624404.1537,602.652211.9204
Triangle Farm2018151057.822823.6725,917.761727.8504
202215709.652641.3226,472.161764.8106
Westlake201843840.0010,092.8929,824.997456.2479
202245300.0010,092.8930,852.957713.2381
Woodstock/Salt River201815356.7410,277.7844,062.822937.5215
202215667.7114,783.6558,408.093893.8726
Table 5. Market value changes between 2018 and 2022.
NodeNMinimumMaximumSumStd. Deviation
Airport34−36.001838.331721.64316.83406
Atlantic Hills7−18.1152.1920.5825.30366
Beaconvale/Elsiesrivier Industria10−37.5017.59−108.2920.33095
Blackheath15−5.95628.00735.43161.01153
Brackenfell21−46.94105.3616.4032.14303
CBD2−4.444.690.266.45391
Epping30−23.1061.54−4.6318.76970
Fisantekraal61.61162.82498.3470.79378
Goodwood5−64.1519.39−103.7729.62963
Killarney16−41.9454.794.0019.51054
Kraaifontein8−48.6275.44−61.1843.80237
Kuilsrivier60.00901.60904.57367.83328
Macassar312.16187.14243.7493.11822
Montague Gardens/Milnerton16−20.9617.88−111.2711.86175
Richmond Park4−11.0654.9738.8531.20067
Ottery/Hill Star8−14.8951.2867.2524.63404
Paarden Eiland21−6.12805,412.25805,579.71175,753.53543
Parow Industria15−29.6134.7944.2518.60832
Philippi13−27.80170.27295.1846.34401
Rivergate91.6324.2668.587.25776
Sacks Circle/Bellville South Industria15−23.1469.6614.9822.90944
Stellenbosch Farms27.8225.0032.8212.14639
Stikland/Brackenfell17−37.18107.90−167.7036.30363
Triangle Farm15−33.9989.9251.1333.90973
Westlake4−8.7638.0231.5320.64777
Woodstock/Salt River15−45.091037.172106.00361.79475
Table 6. GWR model results for 2018.
Variablep-Value Significance r-Squared Coefficients
Intercept −760,691,990.5556
Airport 0.000Significant 0.306103,753.6361
CBD 0.000Significant 0.299255,447.6301
Development Corridors 0.000Significant 0.303−97,251.5043
Intersections 0.125Not significant 0.333−21,167.6655
Nodes 0.255Not significant 0.2592573.3008
Port 0.000Significant 0.014−242,714.7523
Station 0.897Not Significant 0.036−8991.7116
Urban Development Zones 0.079Not Significant 0.26810,055.3586
Table 7. GWR model results for 2022.
Variablep-Value Significance r-Squared Coefficients
Intercept 257,728,262.1070
Airport 0.001Significant 0.20844,622.7010
CBD 0.000Significant 0.051−30,153.0796
Development Corridors 0.001Significant 0.208−47,731.8788
Intersections 0.158Not significant 0.231−3655.8303
Nodes 0.601Not significant 0.148−5514.5284
Port 0.000Significant 0.01919,203.3247
Station 0.418Not significant 0.0375442.2077
Urban Development Zones 0.076Not significant 0.1768692.2274
Disclaimer/Publisher’s Note: The statements, opinions and data contained in all publications are solely those of the individual author(s) and contributor(s) and not of MDPI and/or the editor(s). MDPI and/or the editor(s) disclaim responsibility for any injury to people or property resulting from any ideas, methods, instructions or products referred to in the content.

