Abstract
The current research examines the issue of social inclusivity in the context of digitalization of smart city governance and explores ways to overcome the digital divide, which impedes equal access to online services for vulnerable population groups (elderly people, people with disabilities, low-income individuals, and residents of remote areas). Based on a literature review, the study outlines three generations of the digital divide: access, digital skills, and the ability to derive socio-economic benefits. A methodology is proposed that combines cluster analysis of 27 European cities using 11 integrated indicators, aimed at identifying typical development profiles while accounting for infrastructure, air quality, and levels of digital literacy. The results revealed four clusters: “Digital Leaders with Environmental Awareness”, “Mid-Level Cities with Development Potential”, “Opportunities with Environmental Challenges”, and “Advanced Digital Hubs with High Quality of Life”. The study confirms the hypothesis regarding the effectiveness of a comprehensive approach that integrates infrastructure investment, educational programs, and inclusive planning. The article’s conclusions emphasize the need to apply universal design principles, subsidize internet access, and regularly monitor digital inclusion indices to achieve SDGs 11 and 16.
1. Introduction
The rapid development of the smart city concept presents significant opportunities for advancing urban areas and improving citizens’ quality of life through the digitalization of municipal services, ensuring environmental sustainability, optimizing infrastructure, and enhancing the management of urban resources. However, alongside technological progress, the issue of the digital divide, meaning unequal access of different social groups to the benefits offered by modern digital solutions, is becoming increasingly pressing. Particularly vulnerable in this context are the elderly, people with disabilities, low-income citizens, and residents of remote areas, for whom technological innovations may not become a tool for integration, but an additional barrier.
Social inclusiveness is a defining principle of the ethical and sustainable development of smart cities. Smart cities should aim to ensure benefits for all residents, regardless of their origin, abilities, or socio-economic status. The relevance of researching social inclusivity in the digitalized urban space stems from the accelerated pace of digital technology implementation in all areas of urban life, which has become especially evident during the post-pandemic recovery period. The transition to online services, remote work, and e-learning, which was initially seen as a temporary measure, has become a permanent feature of modern urban life and has created new challenges for social cohesion.
“Social inclusiveness” is understood as the process of ensuring equal opportunities for all citizens to participate fully in public life (access to quality education, social rights, cultural preservation, economic development, and political engagement), regardless of their socio-economic status, age, health condition, or other factors. Government policies and programs aimed at promoting social inclusion seek to reduce inequality and foster the effective participation of all citizens in society [1,2,3]. In the context of smart cities, inclusivity is understood as improving the quality of life for all residents, regardless of their background, abilities, and socio-economic status, by using emerging technologies and data-driven solutions.
A significant barrier to achieving social inclusiveness in digitalized smart city governance is the digital divide. The digital divide is viewed as inequality in access to, use of, and the impact of information and communication technologies among different population groups [4,5,6,7]. More broadly, the digital divide should be considered as a consequence of the realization of human rights and social justice, including access to key remote services in a smart city (education, healthcare, transportation, job search, etc.) [8,9,10,11,12]. In smart cities, the digital divide can manifest as a lack of digital skills among citizens or those living in areas with insufficient internet connectivity. It is important to emphasize that the digital divide reflects and exacerbates existing social, economic, and cultural inequalities and may deepen as smart city innovations are implemented if they are not inclusive.
The aim of this study is to explore social inclusiveness and develop innovative solutions to bridge the digital divide within the context of a smart urban environment.The research is based on open data and focuses on the following questions:
- What factors most significantly influence the digital divide in modern European cities?
- What measures are most effective in overcoming digital inequality?
- How can the principles of social inclusiveness be integrated into smart city planning?
The research hypothesis is that in European cities with varying levels of digital maturity, effective reduction of the digital divide is achieved through a targeted combination of investments in digital infrastructure, digital skills development programs, and inclusive governance practices tailored to the socio-economic profile of each specific city. Isolated measures (e.g., providing internet access alone) are considered insufficient, and success depends on the synergy of diverse strategies.
2. Literature Review
The conceptualization of social inclusivity in smart cities is multifaceted, encompassing not only access to technology but also the ability to use it effectively and to participate in the digital urban environment. Inclusivity in smart cities is understood as enhancing the quality of life for all residents—regardless of their background, abilities, or socioeconomic status—through technology and data-driven solutions. There is growing recognition that smart cities are increasingly seen as processes of social innovation aimed at achieving sustainable and urban development.
Inclusivity as a global priority is reflected in the Sustainable Development Goals, particularly Goal 11, which focuses on creating inclusive, safe, and sustainable urban environments. Currently, around 1.1 billion people live in slums or similar conditions, and this number is expected to increase by another two billion over the next three decades. However, many cities are unprepared for rapid urbanization, which outpaces the development of housing infrastructure and services, leading to deteriorating living conditions. Uncontrolled urban sprawl, declining air quality, and a shortage of public spaces are also being observed [13].
The issue of unequal access to public transportation and open urban spaces remains critical in addressing the problem of digital inclusion, particularly in the context of the broader urban divide. In many low- and middle-income countries, limited mobility infrastructure directly reduces citizens’ ability to access digital services, including education, healthcare, and e-government platforms. Furthermore, insufficient access to public spaces (essential for community building and informal digital learning environments) can further deteriorate the quality of life for vulnerable populations. According to 2020 data from 1365 cities in 187 countries, only 44% of urban residents live within 400 m of public spaces, with this figure rising to 60–70% in high-income countries. [14].
Studies [15,16] show that the digital divide reflects and amplifies existing social, economic, and cultural inequalities based on factors such as gender, age, race, income, and opportunity. There are growing concerns that smart city innovations may deepen the digital divide if they are not implemented with inclusivity in mind.
The concept of the digital divide has evolved over recent decades, and contemporary researchers identify three generations in the understanding of this phenomenon. The first-generation divide, as noted by Ragnedda and Ruiu (2020), focuses on inequalities in physical access to digital technologies and the internet [17]. This is the most visible form of digital inequality, often measured by internet connectivity, availability of devices, and infrastructure quality.
The second-generation digital divide concerns differences in digital skills and competencies. In Jan van Dijk’s study (2020), the concept is expanded by identifying operational, informational, communicational, and strategic skills that determine how effectively individuals engage with digital technologies [18]. This level of divide can remain significant even after access barriers have been addressed.
The third-generation digital divide, which has received increasing attention in recent years, goes beyond access and skills and focuses on the ability to derive tangible socio-economic benefits from the use of technology. Scholars emphasize that this aspect has the most profound implications for social inequality, as it relates to opportunities for improving quality of life through digital means [19,20,21].
Smart cities’ focus on maximizing profit through data accumulation may lead to the exclusion of citizens with lower levels of digital literacy. Ineffective policies in technological urban governance may limit large segments of the population from accessing the benefits of digital technologies. Technological barriers, such as the absence of accessibility standards in procurement and integration processes, present serious challenges. Moreover, concerns about data privacy, security, and potential misuse may disproportionately affect vulnerable populations.
Research on social inclusivity in the context of smart cities has gained particular relevance in recent years [22,23]. In many countries, smart cities are being developed to ensure equal access to essential urban services such as education, healthcare, sanitation, drinking water, and mobility. Local governments expect that the use of various smart ICTs can significantly improve operational and managerial efficiency, citizen participation in co-producing services, and quality of life [24,25].
In practice, however, smart governance is often characterized by a supply-driven, technocratic approach to city management. According to some authors, such technocratic “smart” governance obscures urban challenges, conflicts, and contradictions that cannot be adequately represented through digital tools and data analytics [26,27]. Meijer and Bolívar (2016) argue that smart governance should enable new forms of human collaboration through the use of ICTs to achieve better outcomes and more transparent governance processes [28]. Researchers suggest that greater emphasis should be placed on social inclusion, social capital, and sustainable development.
Smart urban governance represents a sociotechnical approach to city management in the smart era, beginning with core urban problems, promoting demand-driven governance models, and shaping technological intelligence in a more socially responsive manner by taking local context into account [29,30,31]. A similar approach, which views smart technologies as working in tandem with other urban interventions such as changes in social, economic, and environmental policy, participatory planning, and community development, is outlined in Kitchin (2021) and Sharma et al. (2023) [32,33].
Despite attempts to reframe the smart city as “citizen-oriented”, smart urbanism remains rooted in pragmatic, instrumental, and paternalistic discourses and practices, rather than in those of social rights, political citizenship, and the common good [34].
Social origin and cultural practices shape the foundation of how digital technologies are perceived. The concept of social capital emphasizes that networks of trust, social norms, and interpersonal connections influence citizens’ willingness to engage with digital initiatives. The importance of digital capital is highlighted, as it determines the extent to which specific groups possess the experience and confidence necessary to master ICT [35]. When analyzing the digital divide, it is appropriate to take into account cultural differences, biases toward technology, and the specifics of local learning practices, particularly mentoring models that have proven effective for vulnerable groups [36,37].
The quality of public institutions, transparency, and trust in government are key determinants of the success of e-governance and other digital initiatives. Building a reliable digital ecosystem requires not only technical infrastructure but also a high level of citizen trust in public services, guaranteed data security, and the inclusion of citizens in service design processes. At the same time, in many EU countries, shortcomings in transparency and weak institutional oversight may undermine the effectiveness of large-scale investments in digital networks, especially when citizens lack confidence in the security and legitimacy of the processes involved [38]. Therefore, quantitative analysis of digital inclusion should be complemented by governance quality indices, trust indicators, and measures of citizen engagement in collaborative processes in order to identify mechanisms of political support or barriers to the implementation of digital initiatives.
Economic inequality and the level of material resources influence both access to devices and internet connectivity, as well as the ability to invest time in developing digital skills. The capability-based approach demonstrates that access to digital resources should be viewed as a component of individuals’ “empowerment,” where material goods are necessary but not sufficient; taking into account differences in the ability to realize potential helps explain why, even with technical access, some groups do not use it effectively [39,40]. Models of digital inequality should include indicators of economic instability, as well as indices of connection costs and the cost of devices, in order to adjust the outcomes of such models. This will allow for a more accurate diagnosis of the economic conditions that restrict citizens in the digital sphere and help identify where targeted support programs should be directed.
The concept of inclusivity plays a central role in the structure of the Sustainable Development Goals (SDGs), adopted by the United Nations [41,42]. This is clearly reflected in the wording of several key SDGs: Goal 8 calls for “inclusive and sustainable economic growth”, Goal 11 aims to make “cities and human settlements inclusive, safe, resilient and sustainable”, while Goal 16 aspires to “promote peaceful and inclusive societies as a foundation for sustainable development”.
An inclusive smart city should genuinely support all its residents with disabilities, not only those with physical impairments. This involves not only the development of assistive technologies but also policy changes and societal shifts toward inclusivity. Smart city planning must incorporate principles of universal design to create spaces, buildings, and services accessible to everyone [43,44]. The research suggests rethinking the very essence of the smart city by placing human needs—not technological capabilities—at its core.
Various methodologies for assessing digital accessibility in urban environments have produced several conceptual models. According to studies [45], digital inclusion assessment encompasses four fundamental aspects: access, skills development, usage characteristics, and enabling environments. The first component entails universal access to fixed and mobile internet networks as well as telecommunication services. The second focuses on digital competencies that allow individuals to maximize the benefits of technology and minimize the potential risks of digital interaction. Usage patterns represent the third critical element of digital inclusion. While the presence of technological infrastructure and its active application are undoubtedly important, without a conducive environment for safe and effective ICT use, marginalized groups will remain excluded from the digital space. It is the enabling environment that constitutes the fourth dimension, which requires systematic measurement to form a comprehensive understanding of the situation in a given region [46].
An alternative approach proposed by Thomas et al. (2021) views digital inclusion through the lens of three parameters: availability, affordability, and digital ability [47]. In contrast, the study by Jia et al. (2024) expands the concept to five dimensions: Access, Skills, Use, Adoption, and Impact [48]. Access remains the priority dimension across all digital inclusion indexes. Skills and Use are often underestimated due to methodological limitations in measurement tools. The dimensions that receive the least attention in both academic research and practical assessments are Adoption and Impact.
Conducting maturity assessments requires specific tools, mostly represented by maturity models [49]. The study by Aragão et al. (2023) implements the multi-criteria TOPSIS method (“Technique for Order of Preference by Similarity to Ideal Solution”), structured as a mathematical tool for measuring “smartness” in the Smart City Maturity Model across healthcare, environment, sustainability, technology, and urban planning domains [50]. The authors adapted TOPSIS to create a synthetic indicator called the smart index, which determines a specific city’s maturity level [48]. In Topuz et al. (2022), a digital maturity model based on the Best-Worst Method is proposed for municipalities to assess urban “smartness” and adapt their development in line with the smart city concept [51].
Digital Government Maturity Models (DGMMs) are generally designed as stage-based or measurable frameworks. At the same time, there is a growing need to develop inclusive DGMMs that align digital transformation strategies with the actual needs of citizens [52].
An important criterion of a “smart city” is the ability to report urban maintenance issues online, including platforms that allow for real-time complaint analysis and the automation of tasks within municipal services [53]. The availability of free public Wi-Fi in communal spaces is considered a condition for digital inclusion and is positively correlated with increased citizen engagement in online services. At the same time, monitoring the speed and reliability of internet connectivity is crucial: standardized indicators facilitate the comparison of cities and help assess whether the infrastructure meets the minimum requirements for stable e-services [54]. Mobile access to real-time traffic congestion information through official applications or integration with navigation services is becoming a key criterion for responsive traffic management and environmental monitoring [55]. Online services for business registration streamline administrative procedures, stimulate economic activity, and reduce the time required to start entrepreneurial operations [56].
Urban ecosystem indicators and air quality criteria are based on a network of urban sensors and open data, which are integrated with mobile applications. Inclusive development and good governance help mitigate the negative impact of poor air quality [57]. Thus, the theoretical framework emphasizes that the set of criteria must encompass both digital services (such as online notifications, e-services for transportation and business) and infrastructural and environmental indicators (e.g., Wi-Fi availability, internet speed, transport systems, ecosystem data), all integrated within a comprehensive “smart city” model.
The literature offers various strategies and policies aimed at bridging the digital divide and fostering social inclusivity in smart cities. An analysis of international experiences reveals a diversity of approaches to addressing the digital divide. If the digital divide is understood as a multidimensional concept encompassing disparities in access, use, and effective utilization of online services by citizens, then public policy must take into account the different factors contributing to exclusion and inequality [58].
The European Commission has introduced a comprehensive set of strategic directions, initiatives, and policy programs designed to accelerate digital transformation. The concept of the “European Digital Decade: digital targets for 2030” reflects the Commission’s strategic vision for Europe’s digital evolution over the current decade, which is elaborated in a series of official publications issued between 2021 and 2023 [59]. To implement this vision, the EC developed the “Digital Compass 2030” for the digitalization of the EU, encompassing four key areas of impact: digital skills, digital infrastructure, digital transformation of businesses, and digital public services. In the first area, which is directly linked to overcoming the second and third levels of the digital divide, the EU has set an ambitious goal: by 2030, 80% of the population should possess at least basic digital skills [60].
The New European Bauhaus (NEB) initiative, launched by the European Commission in 2020, merges inclusivity with digital transformation, ecology, and aesthetics [61]. The goal of the New European Bauhaus is to promote aesthetics, sustainable development, and inclusivity within the policies of digital cities and beyond the built environment [61]. In accordance with the pioneering ideas and interdisciplinary initiatives of the original Bauhaus, the creation of a sustainable, inclusive, and beautiful living environment is achieved through the integration of design, culture, art, science, and technology. To realize a sustainable and inclusive future within the NEB framework, investments and financial flows must be redirected toward tangible projects and activities capable of supporting societal transformation and delivering positive change [61].
A fundamental tool for evaluating digital transformation in the EU is the Digital Economy and Society Index (DESI). The DESI indicator “Digital public services for citizens” measures “the extent to which online services or information about services are accessible to citizens through government portals”. The indicator “e-Government users” reflects “the share of individuals who used the internet to interact with public authorities over the past 12 months” [62].
Despite a significant body of research dedicated to the digital divide in smart cities, several critical gaps can be identified. First, most studies focus on individual aspects of the issue (technological, social, or educational), while a comprehensive approach is insufficiently represented. The study by Raihan et al. (2025) emphasizes that the interaction of various factors creates the most complex barriers to digital inclusivity [63].
Furthermore, there is a lack of interdisciplinary research that integrates methodological approaches from sociology, urban studies, computer science, and other fields. Studies underscore the need to combine different perspectives to better understand the multidimensional nature of the digital divide [64].
In light of the identified gaps, our research aims to develop a comprehensive, interdisciplinary approach to ensuring social inclusivity in a digitalized urban environment, taking into account local context and focusing on the long-term effects of proposed strategies.
3. Research Methodology
The research methodology is based on a mixed approach, combining quantitative data analysis with theoretical synthesis of literature sources. The study is grounded in the principles of interdisciplinarity, integrating approaches from sociology, urban studies, and information technologies to gain a comprehensive understanding of the issue. The main focus was on identifying key factors contributing to the digital divide, assessing the effectiveness of strategies for overcoming it, and developing recommendations for integrating principles of inclusivity into smart city planning.
The analysis used open data collected from official sources, including the Inclusive Internet Index [65], OECD data (2018) on inequality in metropolitan regions, EU statistics on the digital economy and society [66], and indicators from the IMD Smart City Index [67]. Additional data on transport, urban ecosystems, and air quality were drawn from relevant indices [68,69].
To identify typical urban development profiles, a clustering of 27 European cities was conducted. Cities were selected based on criteria of geographic diversity, level of economic development, and degree of digital infrastructure. The modern development of smart cities is inseparable from both digital and environmental dimensions. The inclusion of environmental indicators in the clustering reflects an expanded understanding of the enabling environment for digital inclusion, as evidenced by the models of the Smart City Maturity Index. The clustering utilized 11 composite indicators reflecting various aspects of the smart urban environment, including: online reporting of city maintenance problems, availability of free public Wi-Fi, ability to book medical appointments online, online scheduling and ticketing for public transport, mobile access to traffic congestion information, online services for business registration, internet speed and reliability, online public access to city finances, and indicators on transportation, urban ecosystem, and air quality. Aggregated data for the period 2023–2025 available in open-access sources were used in the study [67,69].
These indicators were correlated with the three generations of the digital divide: the first generation (access)—internet infrastructure and connection speed; the second generation (skills)—online services and digital literacy; and the third generation (benefits)—access to economic, social, and environmental advantages.
To identify typical urban development profiles, the K-means algorithm was applied with a predefined number of clusters (k = 4). The approach was based on data standardization to eliminate scale effects, hierarchical cluster analysis to justify the optimal number of clusters, and validation criteria. To assess the robustness of the findings with respect to the time frame, a sensitivity analysis was conducted based on separate calculations for each individual year.
The methodology is grounded in the concept of the three generations of the digital divide [17] and the digital inclusion model, which considers four dimensions: access, skills, usage, and enabling environment [45]. This allowed for the classification of cities by their level of digital inclusion, systematic assessment of barriers for vulnerable groups (the elderly, people with disabilities, low-income populations), and the development of comprehensive solutions.
Thus, the methodology enabled a comprehensive understanding of the mechanisms behind the digital divide and provided tools for shaping a more equitable and inclusive smart city.
4. Results
The digital divide in modern cities is shaped by the interplay of several key factors, which can be classified into three generations of the digital divide, as outlined in the literature review: access, skills, and the ability to benefit. Global indices such as the Inclusive Internet Index [53] break these aspects down into four categories: availability, affordability, relevance, and readiness. Availability encompasses the quality and breadth of infrastructure, including internet speed and usage levels, which are critical for the first-generation divide. Affordability assesses the cost of access relative to income, which also affects physical access, especially for low-income groups.
In 2022, a comprehensive analysis of the Inclusive Internet Index (3i) was conducted, measuring countries’ potential to leverage the global network for both individual and collective development. Despite significant progress in making the internet more inclusive across all studied countries, “digital inequality” remains a pressing issue, although its nature has evolved. While limited network coverage previously posed the main barrier to internet access in low- and lower-middle-income countries, since 2017, there has been substantial expansion in coverage. However, the growth rate of internet users lags behind the pace of network infrastructure expansion, leading to a gap in actual network usage [65]. Figure 1 presents the Inclusive Internet Index for the EU countries in which the cities used in this study are located.
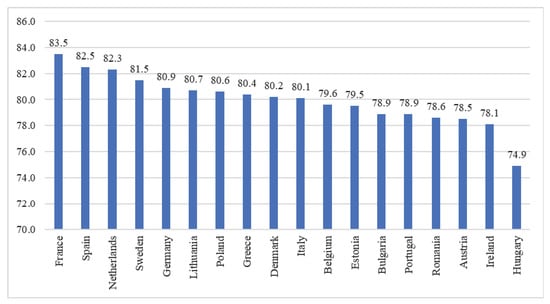
Figure 1.
The Inclusive Internet Index for EU countries [65].
Urban centers offer substantial opportunities for the development of technology, education, employment, and social engagement. However, their expansion is accompanied by serious challenges: a shortage of affordable housing, transportation gridlock, and pronounced social inequality, which becomes especially acute in megacities. The inability to ensure inclusive economic growth undermines social cohesion, fuels conflict, and erodes public trust in democratic institutions. Although major agglomerations typically demonstrate higher development indicators compared to other regions, they are often marked by the most severe social disparities. In three-quarters of the 24 OECD countries, capital regions exhibit higher levels of inequality than national averages. Urban inequality is multifaceted and extends beyond income differences. Residents of deprived neighborhoods typically face limited access to quality housing, employment opportunities, and public services. According to the Gini index, capital regions exceed the national average in 18 out of the 24 OECD countries studied [70] (Figure 2).
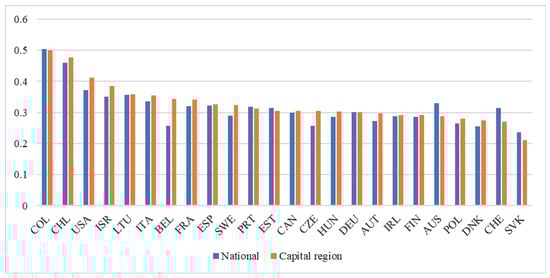
Figure 2.
Comparison of social inequality in metropolitan regions with the country [70].
The European Manifesto on Digital Freedoms and Principles of the Digital Era [71] proclaimed “digitalization that will not exclude any social group. It should serve everyone, ensuring gender equality and inclusiveness, including elderly citizens, rural populations, people with disabilities, and marginalized groups...”. As of 2024, Denmark, Luxembourg, the Netherlands, Ireland, Sweden, Belgium, Malta, and Germany demonstrated almost identical levels of internet coverage in both rural and urban areas. The most significant gap between urban and rural internet access was observed in Greece and Bulgaria, where the difference reached 15 percentage points (p.p.) in 2024 [66] (Figure 3).
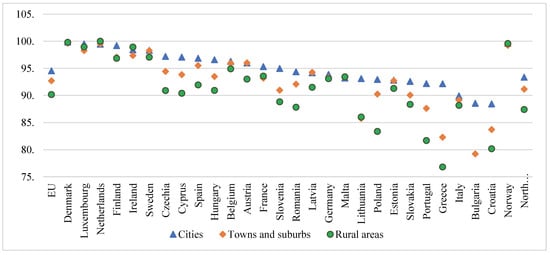
Figure 3.
Statistics of the digital economy and society, households, and individuals [66].
The level of digital skills corresponding to the second-generation divide is reflected in the category of readiness, which includes skills, cultural acceptability, and supportive policies. For example, data from the IMD Smart City Index [67] show that cities with low levels of digital literacy among elderly people often have a higher digital divide, even if the infrastructure is available. The relevance of content, related to the third-generation divide, is an important factor, especially for migrants and people who speak non-dominant native languages. The IMD Smart City Index offers a balanced focus on the economic and technological aspects of smart cities on one hand, and the ‘human dimensions’ of smart cities (quality of life, environment, and inclusivity) on the other.
In this study, a clustering of 27 European cities was carried out according to 11 integral indicators of sustainable urban development. The aim of the analysis was to identify typical urban development profiles reflecting the advantages and challenges of specific urban systems. The data were standardized and processed using the K-means algorithm with a predetermined number of clusters (k = 4), justified by the dendrogram of hierarchical cluster analysis. Feature standardization was used prior to clustering (Zero mean, unit variance) to avoid the influence of measurement scales (Figure 4). The sensitivity-based assessment of temporal robustness showed that the main conclusions remained statistically significant across all annual subsamples. To determine the weights of the 11 selected indicators, one of the most widely used approaches was applied—the entropy-based weighting method. The results of the entropy analysis revealed a relatively uniform distribution of weights, which justifies the use of average weights across indicators with a high degree of confidence. The inclusion of the entropy method in the sensitivity analysis confirmed the robustness of the main results to the choice of weighting technique, which further reinforces the rationality of the selected approach.
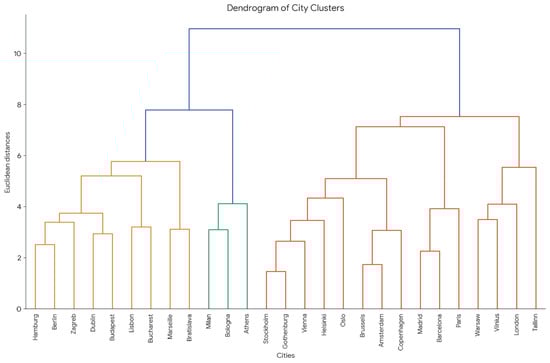
Figure 4.
Dendrogram of hierarchical cluster analysis.
Cluster analysis allowed for the identification of four groups of cities with similar characteristics regarding the implementation of online services, development of transportation infrastructure, state of the urban ecosystem, and air quality (Table 1). Cluster 0 represents cities with a high level of development in various digital services and environmental awareness. Cluster 1 shows cities with an average level of digital service development and some issues with online access to finance and air quality. Cluster 2 stands out with high scores in certain online services but has significant shortcomings in internet connection quality and air quality. Cluster 3 combines cities with the most developed digital infrastructure and a high quality of life based on the considered indicators.

Table 1.
General Characteristics of Clusters.
According to the results, Cluster 0 reflects a high level of online service implementation and relatively good environmental indicators. The cities in this cluster demonstrate quite high levels of online service implementation, especially in the areas of public transport and medical services. They also have a high level of satisfaction with internet connectivity and a very well-developed transport infrastructure. The indicators of the urban ecosystem and air quality are also relatively high. It can be said that this is a group of cities with a well-developed digital infrastructure and ecological awareness. However, online access to city finances here is somewhat lower compared to other aspects.
Cluster 1 demonstrates average performance across multiple aspects, indicating potential for improvement, particularly in online financial access and air quality. The cities in this cluster have average indicators for the implementation of online services, somewhat lower than Cluster 0, especially regarding online appointment scheduling for medical visits and services for businesses. They also demonstrate a high level of development in the transportation system and relatively good indicators for the urban ecosystem. However, online access to city finances here is the lowest among all clusters. Air quality is also somewhat lower than in Cluster 0.
Cluster 2 highlights a high level of certain online services but faces serious issues regarding internet quality and air quality. This cluster shows an interesting combination of characteristics. They have higher average values for online reporting of urban service issues and online medical appointment booking. The development of online services for public transport and businesses is at an average level. It is worth noting the significantly lower satisfaction with internet speed and reliability, as well as the lowest air quality score among all clusters. The transport infrastructure is well developed, and the urban ecosystem is at a relatively high level.
Cluster 3 exhibits the highest level of digital service development and favorable quality of life indicators. The cities in this cluster demonstrate the highest average indicators for the implementation of many online services, including free public Wi-Fi, online appointments for medical consultations, online timetables, and ticket sales for public transportation, as well as online services for starting a new business. They also have the highest satisfaction levels with internet speed and reliability, as well as one of the highest air quality indicators. The development of transport infrastructure is also very high, and the urban ecosystem is at a good level. Online access to municipal finances is also higher here than in other clusters. It can be said that this is a group of cities with the most developed digital infrastructure and a high quality of life based on the examined parameters.
The results of the conducted interviews demonstrate the necessity of overcoming the digital divide among specific citizen groups (particularly by fostering essential skills among low-income populations and enhancing inclusiveness) on civic participation web platforms in Brussels [72]. Another sociological survey reveals considerable skepticism and dissatisfaction with institutional systems for air quality monitoring in Dublin (46% of respondents), as well as a significant lack of awareness about such monitoring in Turin (31% of respondents) [73]. A large-scale survey conducted in 20 cities across 11 European countries on transport usage highlights differences stemming from each city’s economic profile, residents’ need for flexibility, and the growing availability and use of online healthcare and public services [74]. These cases illustrate that interviews with representatives of different subgroups provide valuable explanations for varied responses to the implementation of online services, transport innovations, and environmental measures, and they partly complement the findings revealed through regression analysis.
As an example, we consider Tallinn and Vilnius (cluster 3), justified by their high levels of digital services and active adult learning policies. Additionally, Athens (cluster 2) is included for comparison, demonstrating adequate infrastructure but significant gaps in digital skills among the adult population, especially in older age groups, which limits the effective use of these opportunities. The comparative analysis uses indicators defined in the methodology (Figure 5), as well as studies on practices of digital inclusion for elderly citizens [36,37,38] (UNECE, 2020; UNECE, 2021; FRA, 2023). The indicator of basic digital skills among the 65–74 age group is distributed as follows according to the countries where the cities are located: Estonia—22.67%, Lithuania—15.15%, and Greece—12.84%, while the level of above-basic digital skills is 5.87% in Estonia, 3.69% in Lithuania, and 2.04% in Greece [75].
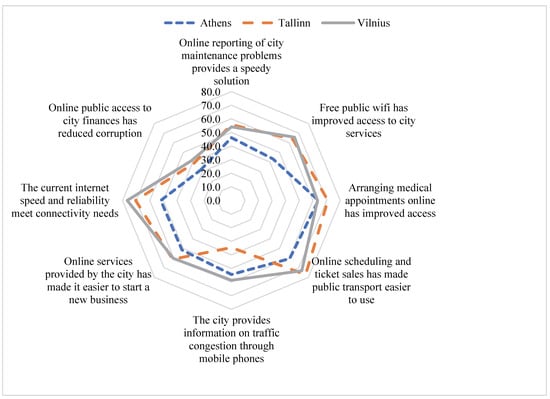
Figure 5.
Comparison of indicators reflecting different aspects of the smart urban environment of Athens, Tallinn, and Vilnius.
Tallinn and Vilnius actively integrate infrastructure investments with educational initiatives. In Tallinn, within the framework of e-service policies, not only is extensive high-speed internet coverage ensured, but also a digital literacy training program is provided through municipal libraries, offering broad support to citizens. Vilnius implements regular training sessions on basic digital skills and online security, targeting elderly populations, in partnership with universities and civil society organizations. This approach facilitates technology adoption and enhances trust in online services. Both cities are characterized by a high level of citizen engagement in collaborative work on platforms and feature real-time feedback mechanisms, enabling the adjustment of programs to meet specific user needs [76].
In Athens, investments in network infrastructure and digital services exist; however, the low level of digital skills among elderly and less motivated learning groups leads to an underutilization of this potential. According to DESI, only a portion of the adult population regularly uses e-services due to a lack of basic security skills and orientation in the online environment. Specialized educational initiatives targeting older adults and people with disabilities (such as the Digital Disability Card) are beginning to reduce the gap in adapting to and safely using these services [76] (European Commission, 2023). This demonstrates that infrastructure projects must be combined with targeted educational programs: without a comprehensive approach, the effectiveness of investments remains limited.
The dynamics of the Smart City Index over the 2023–2025 period show the following trends. Vilnius rose from 65th to 34th position, Tallinn improved from 32nd to 22nd place, while Athens dropped from 113th to 129th [67]. An analysis of the results of urban digital space development policies in Vilnius and Tallinn reveals significant progress in the following indicators over the period in question: online reporting of city maintenance issues, availability of free public Wi-Fi, the option to book medical appointments online, digital planning and ticketing for public transport, mobile access to traffic congestion information, online business registration services, internet speed and reliability, and public access to municipal financial data. In contrast, in Athens, the passive implementation of political decisions resulted in a significantly slower development across these domains.
Comparative analysis shows that successful digital inclusion integrates infrastructure with tailored educational initiatives, particularly for older age groups (e.g., Tallinn, Vilnius). Athens can enhance the efficiency of IT service usage by implementing digital mentoring programs, partnerships with universities, and volunteer initiatives that lower barriers to entry. Such an approach improves not only individual skills but also general trust in digital services, thereby increasing social cohesion and the resilience of urban systems.
Research indicates that a comprehensive approach, combining technological solutions, educational programs, and urban planning, is the most effective for overcoming digital inequality. Case analyses from high-ranking cities confirm this hypothesis.
The integration of social inclusivity principles into smart city planning requires considering the needs of all citizens from the outset. The IMD Smart City Index [67] highlights that the combination of inclusivity and digitalization is a challenge for all cities, necessitating attention to talent strategies, education, and openness. This includes creating digital services that are accessible to people with various abilities, such as through multilingual interfaces and adaptations for individuals with disabilities.
The analysis provided can be used by city authorities to compare their performance with other cities, identify strengths and weaknesses, and develop strategies for further development.
5. Discussion
The digital divide significantly limits the ability of certain social groups to fully participate in urban life, access necessary services, and benefit from digital transformation. Insufficient attention to bridging the digital divide could lead to increased social inequality and the marginalization of vulnerable groups in urban populations.
Research indicates that access to the internet and devices is a priority for the inclusivity of smart cities. It is likely that digital literacy programs also receive significant support, particularly for the elderly. Smart cities use technology to improve quality of life, but the digital divide may exclude vulnerable groups, such as low-income individuals, the elderly, and people with disabilities. Overcoming this divide is key to inclusivity, but priorities may vary depending on the region and demographics.
It should be noted that there are limitations in the mentioned study. Data indicators were collected over different years (2021–2024), which may have caused temporal discrepancies. There is also varying detail in the statistical data, given that some indicators were not disclosed by certain authorities. Secondary data may contain individual inaccuracies, considering different methods of data collection. In the final composite index analysis, average weights were chosen, ensuring simplicity in interpreting aggregated scores, transparency and reproducibility of results for practical application (especially in public administration), and reduced risk of bias associated with potential instability of entropy-based weights when updating the dataset.
The results of the study on social inclusivity in the digitized urban space are supported by a range of scientific studies that analyze factors of the digital divide, the effectiveness of strategies to overcome it, and the importance of integrating inclusivity principles in smart city planning.
The Digital Future Society (2019) study identifies four key dimensions of digital inclusion (access, skills, usage, supportive environment), which align fully with the methodology of our research [46]. The authors emphasize that without considering all four dimensions, the digital divide cannot be effectively addressed, especially among vulnerable population groups. A similar approach is found in [48], where five dimensions of digital inclusion (access, skills, usage, adoption, impact) are proposed, complementing our conclusions about the multidimensional nature of the digital divide. The researchers note that ignoring adoption and long-term impact of technology may lead to uneven development in cities.
The digital maturity model developed by [51] demonstrates that cities with a high level of digital inclusion have synergy between technological solutions and social policies. This supports our hypothesis about the importance of a comprehensive approach to overcoming the digital divide. Research on inclusive models of digital governance highlights that digital transformation strategies should meet the needs of citizens, particularly vulnerable groups [52,77], which aligns with our recommendations for engaging communities in smart city planning. Principles of universal design proposed by the authors [45] confirm the need to create accessible urban services for all citizens, including people with disabilities. This thesis supports our conclusions about the importance of adapting digital services to different social groups.
At the same time, there are studies that question the generalizability of the findings or methodological approaches. A systematic review found that different technological interventions (e.g., ICT and video conferencing) can improve social connections and reduce loneliness in elderly people. This suggests that certain technological tools may be effective for achieving specific positive outcomes (improving social connections, reducing loneliness in the elderly), challenging the assertion of their inherent insufficiency, at least in certain contexts or for narrowly defined goals [78,79]. This contradicts some of our study’s conclusions, where it is stated that partial measures (e.g., merely providing internet access) are insufficient.
This study presents digital inclusion and overcoming the digital divide as primarily positive goals aimed at ensuring benefits for all residents. However, in Kacar and De Luca (2024), an opposite viewpoint is proposed [80]. Achieving digital access and literacy may also expose individuals and society to significant risks and negative consequences (misinformation, social isolation), thus questioning the notion that digital inclusion strategies inevitably lead to positive societal outcomes without careful consideration of these drawbacks.
The results confirm that the digital divide is a multidimensional problem that can only be overcome through the synergy of technological, educational, and planning initiatives. However, the limitations related to the use of secondary data and generalizing the results point to the need for further localized research. Thus, while our conclusions align with most scientific studies, they need to be supplemented with analysis of long-term effects and consideration of regional specifics.
Overall, the results show that the digital divide in cities is multidimensional and overcoming it requires comprehensive strategies. Access, skills, and the relevance of content are key factors, and their significance varies depending on the context. The effectiveness of strategies such as infrastructure investments and educational programs is supported by cases from leading cities, but further attention must be paid to long-term effects, as noted in the literature review. Integrating inclusivity in planning requires a systematic approach, including community engagement and regular evaluation, which can ensure sustainable changes.
The hypothesis of the study, which argued that a comprehensive approach can significantly reduce the digital divide, was confirmed by the obtained results. Isolated measures, such as merely ensuring internet connectivity, were found to be insufficient for achieving true social inclusivity. Success depends on the synergy of technological, educational, and planning initiatives that account for the diversity of citizens’ needs and promote their active participation in the digital urban environment.
Based on the results obtained, potential ways to bridge the digital divide are identified:
- -
- Ensuring accessibility of online public services and integrating inclusivity principles at all stages of smart city development, involving vulnerable groups in decision-making and the implementation of digital technologies;
- -
- Implementing programs to subsidize internet access and supporting affordable digital devices for low-income populations;
- -
- Developing broadband internet infrastructure in all urban areas;
- -
- Technology developers need to create digital services adapted to the needs of different population groups and special solutions for people with disabilities;
- -
- Educational institutions should develop targeted programs for enhancing digital skills, aimed at vulnerable categories, to ensure their full participation in the digital society;
- -
- Conducting informational campaigns to raise awareness of the benefits of digital technologies and foster a positive attitude towards their use.
6. Conclusions
The study dedicated to social inclusivity in the digitized urban space emphasizes that the digital divide is a complex, multi-dimensional issue arising from the interaction of key factors such as internet access, digital skills, the relevance of digital content, and citizens’ socio-economic status. These factors particularly affect vulnerable population groups, such as the elderly, people with disabilities, low-income individuals, and residents of remote areas, for whom technological innovations can both serve as an opportunity for integration and an additional barrier.
The study confirmed that the digital divide in smart cities is a multi-dimensional phenomenon encompassing physical access (first generation), skills (second generation), and the ability to derive socio-economic benefits from ICT (third generation). A cluster analysis of 27 European cities identified four typical development profiles (“environmentally conscious leaders”, “medium-level cities”, “contrasting digital environments”, and “advanced digital centers”), which illustrate that even in cities with developed infrastructure, significant barriers may still exist for specific social groups, such as the elderly and low-income populations.
The main hypothesis—the need for an integrated approach combining infrastructure investments, educational programs, and inclusive planning—has been empirically confirmed. Leader cities (cluster 0 and 3) demonstrate the strongest social inclusivity where, alongside the deployment of broadband internet, targeted programs for eco-monitoring systems, electric transport, and universal urban design have been implemented. At the same time, isolated measures, such as just providing physical access to networks, have proven insufficient for achieving sustainable reduction of inequality.
The research revealed that the digital divide does not exist in isolation—it is closely linked to socio-economic inequality. High-income cities (e.g., cluster 3) show better inclusivity indicators, while in cities with medium or low development levels (clusters 1 and 2), inequality is exacerbated by insufficient investments in infrastructure and education. This underscores the role of government policy in ensuring the equitable distribution of resources across regions and social groups.
A key conclusion is the need to integrate universal design principles into all stages of smart urban service development. This involves not only the technical adaptation of interfaces but also representatives from vulnerable groups in decision-making and prototype testing. Policymakers must consider contextual differences, as the effectiveness of educational initiatives or subsidies may vary depending on the social structure and trust levels of the population.
Therefore, in order to overcome the digital divide and ensure social inclusivity in smart cities, it is necessary to:
- Combine the development of digital infrastructure with programs to enhance digital skills and subsidize access to devices;
- Implement digital maturity models that take into account four or five dimensions of inclusion (access, skills, usage, enabling environment, impact);
- Ensure a multidisciplinary approach in planning by involving sociologists, urban planners, IT specialists, and community representatives;
- Establish regular monitoring and comparative analysis of urban cluster indicators to adjust policies in real time.
Thus, the outcome of the study confirms that only the synergy of technological, educational, and planning initiatives can ensure equal participation of all citizens in the digital urban space and achieve sustainable development for SDGs 11 and 16.
In future research, the sample size will be expanded, and the tracking of digital inclusion indicators will be conducted using panel data models, which will enhance the reliability and validity of the results. At the same time, it is important to incorporate an interdisciplinary approach combining both qualitative and quantitative methods to deepen the study of sociocultural, political, and economic factors of the digital divide and their interactions. The development of personalized strategies for different types of cities should be shaped as a comprehensive model for building “smart cities”, which will contribute to achieving the global sustainable development goals.
Author Contributions
Conceptualization, V.K. and J.D.; methodology, V.K.; validation, V.K. and J.D.; formal analysis, J.D.; investigation, V.K.; resources, J.D.; data curation, V.K.; writing—original draft preparation, V.K.; writing—review and editing, J.D.; visualization, V.K.; supervision, J.D.; project administration, J.D. All authors have read and agreed to the published version of the manuscript.
Funding
This research received no external funding.
Institutional Review Board Statement
Not applicable.
Informed Consent Statement
Not applicable.
Data Availability Statement
Data are contained within the article.
Acknowledgments
During the preparation of this work the author(s) used ChatGPT 4o in order to improve the language and the readability. After using this tool/service, the author(s) reviewed and edited the content as needed and take(s) full responsibility for the content of the publication.
Conflicts of Interest
The authors declare no conflicts of interest.
References
- Denkewicz, P. Social Inclusion and Social Exclusion: A Necessary Conceptual Discussion; Seven Editora: São José dos Pinhais, Brazil, 2024; pp. 971–984. Available online: https://sevenpublicacoes.com.br/editora/article/view/4180 (accessed on 27 May 2025).
- Civinskas, R.; Dvorak, J. Exploring the content of blindness rehabilitation programmes in Lithuania: Models and approaches. Social Policy Issues 2024, 66, 1–22. [Google Scholar]
- Nwachi, L. Relationship between Participation and Social Inclusion. Open J. Soc. Sci. 2021, 9, 46–77. [Google Scholar] [CrossRef]
- Burksiene, V.; Dvorak, J. E-Communication of ENGO’s for Measurable Improvements for Sustainability. Adm. Sci. 2022, 12, 70. [Google Scholar] [CrossRef]
- Chipeva, P.; Cruz-Jesus, F.; Oliveira, T.; Irani, Z. Digital divide at individual level: Evidence for Eastern and Western European countries. Gov. Inf. Q. 2018, 35, 460–479. [Google Scholar] [CrossRef]
- Hidalgo, A.; Gabaly, S.; Morales-Alonso, G.; Urueña, A. The digital divide in light of sustainable development: An approach through advanced machine learning techniques. Technol. Forecast. Soc. Chang. 2020, 150, 119754. [Google Scholar] [CrossRef]
- Kong, F.; Chen, S.; Gou, J. How Does Differential Public Participation Influence Outcome Justice in Energy Transitions? Evidence from a Waste-to-Energy (WTE) Project in China. Sustainability 2023, 15, 16796. [Google Scholar] [CrossRef]
- Hamid, O.H. The Social, Economic, and Sustainability Agenda of Smart Cities in the Kingdom of Bahrain. In The Emerald Handbook of Smart Cities in the Gulf Region: Innovation, Development, Transformation, and Prosperity for Vision 2040; Emerald Publishing Limited: Leeds, UK, 2024; pp. 363–377. [Google Scholar]
- Mills, D.; Pudney, S.; Pevcin, P.; Dvorak, J. Evidence-Based Public Policy Decision-Making in Smart Cities: Does Extant Theory Support Achievement of City Sustainability Objectives? Sustainability 2022, 14, 3. [Google Scholar] [CrossRef]
- Sanders, C.K.; Scanlon, E. The Digital Divide Is a Human Rights Issue: Advancing Social Inclusion Through Social Work Advocacy. J. Hum. Rights Soc. Work. 2021, 6, 130–143. [Google Scholar] [CrossRef]
- Wolniak, R.; Gajdzik, B.; Grebski, M.; Danel, R.; Grebski, W.W. Business Models Used in Smart Cities—Theoretical Approach with Examples of Smart Cities. Smart Cities 2024, 7, 1626–1669. [Google Scholar] [CrossRef]
- Yang, S.; Su, Y.; Yu, Q. Smart-City Policy in China: Opportunities for Innovation and Challenges to Sustainable Development. Sustainability 2024, 16, 6884. [Google Scholar] [CrossRef]
- United Nations. Goal 11: Make Cities Inclusive, Safe, Resilient and Sustainable. 2023. Available online: https://www.un.org/sustainabledevelopment/cities/ (accessed on 27 May 2025).
- United Nations. The Sustainable Development Goals Report 2024. 2024. Available online: https://unstats.un.org/sdgs/report/2024/ (accessed on 27 May 2025).
- Dvorak, J.; Kruhlov, V. Ethical Approaches to Gender Communications in Public Administration at Ukraine. In Ethics and Innovation in Public Administration; Springer: Berlin/Heidelberg, Germany, 2024; pp. 47–64. [Google Scholar]
- Jonek-Kowalska, I.; Wolniak, R. Smart Cities in Poland: Towards Sustainability and a Better Quality of Life? Taylor & Francis: Hoboken, NJ, USA, 2023. [Google Scholar]
- Ragnedda, M.; Ruiu, M.L. Digital Capital: A Bourdieusian Perspective on the Digital Divide; Emerald Publishing Limited: Leeds, UK, 2020. [Google Scholar] [CrossRef]
- Van Dijk, J. The Digital Divide; Polity Press: Cambridge, UK, 2020. [Google Scholar]
- Chang, S.; Smith, M.K. Residents’ Quality of Life in Smart Cities: A Systematic Literature Review. Land 2023, 12, 876. [Google Scholar] [CrossRef]
- Potluka, O. Why and how to use the quality of life as an evaluation criterion? Eval. Program Plan. 2023, 100, 102342. [Google Scholar] [CrossRef]
- Scheerder, A.J.; van Deursen, A.J.; van Dijk, J.A. Taking advantage of the Internet: A qualitative analysis to explain why educational background is decisive in gaining positive outcomes. Poetics 2020, 80, 101426. [Google Scholar] [CrossRef]
- Vahidnia, M.H. Citizen participation through volunteered geographic information as equipment for a smart city to monitor urban decay. Environ. Monit. Assess. 2023, 195, 181. [Google Scholar] [CrossRef]
- Vitálišová, K.; Rigová, Z.; Vanova, A.; Škvareninová, D. Small smart cities–vision or reality? Transform. Gov. People Process Policy 2025, 19, 316–337. [Google Scholar]
- Burbulytė-Tsiskarishvili, G.; Dvorak, J.; Žernytė, A. Savivaldybių funkcijų ir galių kaita Lietuvoje 1994-2016 metais. Viešoji Politika ir Administravimas 2018, 17, 399–420. [Google Scholar]
- Vitálišová, K.; Dvořák, J. Differences and Similarities in Local Participative Governance in Slovakia and Lithuania. In Participatory and Digital Democracy at the Local Level: European Discourses and Practices; Springer International Publishing: Cham, Switzerland, 2023; pp. 125–146. [Google Scholar]
- Bina, O.; Inch, A.; Pereira, L. Beyond techno-utopia and its discontents: On the role of utopianism and speculative fiction in shaping alternatives to the smart city imaginary. Futures 2020, 115, 102475. [Google Scholar] [CrossRef]
- Gracias, J.S.; Parnell, G.S.; Specking, E.; Pohl, E.A.; Buchanan, R. Smart Cities—A Structured Literature Review. Smart Cities 2023, 6, 1719–1743. [Google Scholar] [CrossRef]
- Meijer, A.; Bolívar, M.P.R. Governing the smart city: A review of the literature on smart urban governance. Int. Rev. Adm. Sci. 2016, 82, 392–408. [Google Scholar] [CrossRef]
- Drapalova, E.; Wegrich, K. Who governs 4.0? Varieties of smart cities. Public Manag. Rev. 2020, 22, 668–686. [Google Scholar] [CrossRef]
- Jiang, H.; Geertman, S.; Witte, P. Smart urban governance: An alternative to technocratic “smartness”. GeoJournal 2020, 87, 1639–1655. [Google Scholar] [CrossRef] [PubMed]
- Kruhlov, V.; Dvorak, J.; Moroz, V.; Tereshchenko, D. Revitalizing Ukrainian Cities: The Role of Public-Private Partnerships in Smart Urban Development. Cent. Eur. Public Adm. Rev. 2024, 22, 85–107. [Google Scholar] [CrossRef]
- Kitchin, R. Decentering the Smart City. 2021. Available online: https://www.semanticscholar.org/paper/Decentering-the-smart-city-Kitchin/eb9117f370c8e939103b2ec6c364ac229d7399e2 (accessed on 27 May 2025).
- Sharma, N.K.; Hargreaves, T.; Pallett, H. Social justice implications of smart urban technologies: An intersectional approach. Build. Cities 2023, 4, 315–333. [Google Scholar] [CrossRef]
- Cardullo, P.; Kitchin, R. Smart urbanism and smart citizenship: The neoliberal logic of ‘citizen-focused’ smart cities in Europe. Environ. Plan. C Politics Space 2019, 37, 813–830. [Google Scholar] [CrossRef]
- Rodríguez-Camacho, J.A.; Linder, M.; Jütte, D.; Hennig-Thurau, T. Digital capital: Importance for social status in contemporary society and antecedents of its accumulation. Computers in Human Behavior 2024, 159, 108316. [Google Scholar] [CrossRef]
- UNECE. Ageing in Sustainable and Smart Cities. Policy Brief on Ageing No. 24. 2020. Available online: https://unece.org/fileadmin/DAM/pau/age/Policy_briefs/ECE_WG-1_35.pdf (accessed on 16 June 2025).
- UNECE. Ageing in the Digital Era. Policy Brief on Ageing No. 26. 2021. Available online: https://unece.org/sites/default/files/2023-03/PB26-ECE-WG.1-38_E.pdf (accessed on 16 June 2025).
- FRA. Fundamental Rights of Older People: Ensuring Access to Public Services in Digital Societies. 2023. Available online: https://fra.europa.eu/en/publication/2023/older-people-digital-rights (accessed on 16 June 2025).
- Anrijs, S.; Mariën, I.; De Marez, L.; Ponnet, K. Excluded from essential internet services: Examining associations between digital exclusion, socio-economic resources and internet resources. Technol. Soc. 2023, 73, 102211. [Google Scholar] [CrossRef]
- Passey, D.; Ntebutse, J.G.; Ahmad, M.Y.A.; Cochrane, J.; Collin, S.; Ganayem, A.; Somasi, S. Populations Digitally Excluded from Education: Issues, Factors, Contributions and Actions for Policy, Practice and Research in a Post-Pandemic Era. Technol. Knowl. Learn. 2024, 29, 1733–1750. [Google Scholar] [CrossRef]
- United Nations. The 17 Goals. 2023. Available online: https://sdgs.un.org/goals (accessed on 28 May 2025).
- Sharifi, A.; Allam, Z.; Bibri, S.E.; Khavarian-Garmsir, A.R. Smart cities and sustainable development goals (SDGs): A systematic literature review of co-benefits and trade-offs. Cities 2024, 146, 104659. [Google Scholar] [CrossRef]
- Makkonen, T.; Inkinen, T. Inclusive smart cities? Technology-driven urban development and disabilities. Cities 2024, 154, 105334. [Google Scholar] [CrossRef]
- Sancino, A.; Hudson, L. Leadership in, of, and for smart cities–case studies from Europe, America, and Australia. Public Manag. Rev. 2020, 22, 701–725. [Google Scholar] [CrossRef]
- Sheila, A.A.; Fahmi, F.Z. Digital Inclusion in Rural Areas: A Case Study in Two Indonesian Villages. IOP Conf. Ser. Earth Environ. Sci. 2024, 1318, 012012. [Google Scholar] [CrossRef]
- Digital Future Society. Measuring the Margins: A Global Framework for Digital Inclusion. 2019. Available online: https://digitalfuturesociety.com/report/un-marco-para-medir-la-inclusion-digital-a-nivel-mundial/ (accessed on 28 May 2025).
- Thomas, J.; Barraket, J.; Parkinson, S.; Wilson, C.; Holcombe-James, I.; Kennedy, J.; Mannell, K.; Brydon, A. Australian Digital Inclusion Index: 2021; RMIT, Swinburne University of Technology, and Telstra: Melbourne, Australia, 2021; Available online: https://researchbank.swinburne.edu.au/file/ab6218ee-55f3-4d84-9174-76ca9ec877be/1/2021-thomas-measuring_australias_digital.pdf (accessed on 28 May 2025).
- Jia, S.; Du, J.T.; Yan, H. Towards a comprehensive framework for digital inclusion: A comparison of international measurements. Aslib J. Inf. Manag. 2024. [Google Scholar] [CrossRef]
- Nerima, M.; Ralyté, J. Towards a Digital Maturity Balance Model for Public Organizations. In Research Challenges in Information Science. RCIS 2021. Lecture Notes in Business Information Processing; Cherfi, S., Perini, A., Nurcan, S., Eds.; Springer: Cham, Switzerland, 2021; Volume 415. [Google Scholar] [CrossRef]
- Aragão, F.V.; Chiroli, D.M.d.G.; Zola, F.C.; Aragão, E.V.; Marinho, L.H.N.; Correa, A.L.C.; Colmenero, J.C. Smart Cities Maturity Model—A Multicriteria Approach. Sustainability 2023, 15, 6695. [Google Scholar] [CrossRef]
- Topuz, E.; Coşkun, Ö.; Tütek, Y.; Çakır, Ö.; Temur, G.T.; & Sivri, Ç. An Innovative Digital Maturity Assessment Model for Smart Cities. In Advances in Best-Worst Method. BWM 2021. Lecture Notes in Operations Research; Rezaei, J., Brunelli, M., Mohammadi, M., Eds.; Springer: Cham, Switzerland, 2022. [Google Scholar] [CrossRef]
- Waara, Å. Examining Digital Government Maturity Models: Evaluating the Inclusion of Citizens. Adm. Sci. 2025, 15, 73. [Google Scholar] [CrossRef]
- Allam, Z.; Jones, D.S. Future (post-COVID) digital, smart and sustainable cities in the wake of 6G: Digital twins, immersive realities and new urban economies. Land Use Policy 2021, 101, 105201. [Google Scholar] [CrossRef]
- Anthopoulos, L.G. Understanding Smart Cities: A Tool for Smart Government or an Industrial Trick? In Public Administration and Information Technology; Springer: Cham, Switzerland, 2017; Volume 22, pp. 1–293. [Google Scholar] [CrossRef]
- Singh, S.; Singh, J.; Goyal, S.B.; Sehra, S.S.; Ali, F.; Alkhafaji, M.A.; Singh, R. A novel framework to avoid traffic congestion and air pollution for sustainable development of smart cities. Sustain. Energy Technol. Assess. 2023, 56, 103125. [Google Scholar] [CrossRef]
- Das, A.; Das, S.S. E-Government and Entrepreneurship: Online Government Services and the Ease of Starting Business. Inf. Syst. Front. 2022, 24, 1027–1039. [Google Scholar] [CrossRef]
- Erum, N.; Musa, K.; Sari, R.N.; Sanusi, Z.M.; Said, J. Correction: Quality of governance and urbanization as moderators in the relationship between air quality, inclusive development, and life expectancy. Air Qual. Atmos. Health 2025. [Google Scholar] [CrossRef]
- Morte-Nadal, T.; Esteban-Navarro, M.Á. Recommendations for digital inclusion in the use of European digital public services. Humanit. Soc. Sci. Commun. 2025, 12, 273. [Google Scholar] [CrossRef]
- European Commission. Europe’s Digital Decade: Digital Targets for 2030. 2024. Available online: https://cutt.ly/VeNVcHM5 (accessed on 28 May 2025).
- European Commission. 2030 Digital Compass: The European way for the Digital Decade. 2021. Available online: https://cutt.ly/FeNVI0Wi (accessed on 28 May 2025).
- European Commission. Commission Staff Working Document. New European Bauhaus Investment Guidelines. 2024. Available online: https://new-european-bauhaus.europa.eu/system/files/2024-07/NEB%20Investment%20Guidelines.pdf (accessed on 16 June 2025).
- European Commission. Digital Economy and Society Index (DESI) 2022. Thematic Chapters. 2022. Available online: https://ec.europa.eu/newsroom/dae/redirection/document/88764 (accessed on 28 May 2025).
- Raihan, M.M.H.; Subroto, S.; Chowdhury, N.; Koch, K.; Ruttan, E.; Turin, T.C. Dimensions and barriers for digital (in)equity and digital divide: A systematic integrative review. Digit. Transform. Soc. 2025, 4, 111–127. [Google Scholar] [CrossRef]
- UNDP. From Access to Empowerment: Digital Inclusion in a Dynamic World; UNDP Policy Centre: Oslo, Norway, 2024; Available online: https://www.undp.org/sites/g/files/zskgke326/files/2024-05/undp_digital_inclusion_in_a_dynamic_world.pdf (accessed on 29 May 2025).
- Economist Impact. The Inclusive Internet Index 2022: Executive Summary. 2022. Available online: https://impact.economist.com/projects/inclusive-internet-index/downloads/3i-executive-summary.pdf (accessed on 29 May 2025).
- Eurostat. Digital Economy and Society Statistics—Households and Individuals. 2024. Available online: https://ec.europa.eu/eurostat/statistics-explained/index.php?title=Digital_economy_and_society_statistics_-_households_and_individuals (accessed on 29 May 2025).
- IMD. Smart City Index 2025. 2025. Available online: https://www.imd.org/smart-city-observatory/home/ (accessed on 29 May 2025).
- European Commission. Urban Environment and Social Inclusion Index. 2021. Available online: https://composite-indicators.jrc.ec.europa.eu/explorer/scoreboards/uesi/urban-environment-and-social-inclusion-index (accessed on 29 May 2025).
- Data-Driven EnviroLab. The Urban Environment and Social Inclusion Index. 2024. Available online: https://uesi.datadrivenlab.org/ (accessed on 29 May 2025).
- OECD. Divided Cities: Understanding Intra-urban Inequalities; OECD Publishing: Paris, France, 2018. [Google Scholar] [CrossRef]
- European Commission. European Declaration on Digital Rights and Principles for the Digital Decade. 2023. Available online: https://eur-lex.europa.eu/legal-content/EN/TXT/PDF/?uri=CELEX:32023C0123(01) (accessed on 29 May 2025).
- Pak, B.; Chua, A.; Vande Moere, A. FixMyStreet Brussels: Socio-demographic inequality in crowdsourced civic participation. J. Urban Technol. 2017, 24, 65–87. [Google Scholar] [CrossRef]
- Salimbene, O.; Baeza-Romero, M.T.; Pilla, F.; Čok, G. Air Quality Awareness—Empirical Evidence from a Comparative Perspective between Two European Cities. Urban Sci. 2024, 8, 133. [Google Scholar] [CrossRef]
- Christidis, P.; Cawood, E.N.; Fiorello, D. Challenges for urban transport policy after the Covid-19 pandemic: Main findings from a survey in 20 European cities. Transp. Policy 2022, 129, 105–116. [Google Scholar] [CrossRef] [PubMed]
- European Commission. DESI Indicators. 2024. Available online: https://digital-decade-desi.digital-strategy.ec.europa.eu/datasets/desi/charts/desi-indicators?period=desi_2024&indicator=desi_dsk_ab&breakdown=y65_74&unit=pc_ind&country=EE,EL,LT (accessed on 16 June 2025).
- European Commission Country Reports—Digital Decade Report 2023. 2023. Available online: https://digital-strategy.ec.europa.eu/en/library/country-reports-digital-decade-report-2023 (accessed on 16 June 2025).
- Sidor, M.; Abdelhafez, D. NGO–Public Administration Relationships in Tackling the Homelessness Problem in the Czech Republic and Poland. Adm. Sci. 2021, 11, 24. [Google Scholar] [CrossRef]
- Balki, E.; Hayes, N.; Holland, C. Effectiveness of technology interventions in addressing social isolation, connectedness, and loneliness in older adults: Systematic umbrella review. JMIR Aging 2022, 5, e40125. [Google Scholar] [CrossRef]
- de Lange, M.; Ruijer, E.; & Varró, K. 11. Doing Inclusion: Negotiation and Co-creation for People-centric Smart Cities. In Governing the Digital Society; Amsterdam University Press: Amsterdam, The Netherlands, 2025; p. 191. [Google Scholar]
- Kacar, M.; De Luca, L. Digital Inclusion for a Good Digital Society: Leveraging the Benefits and Mitigating the Dark Side; The British Academy: London, UK, 2024. [Google Scholar]
Disclaimer/Publisher’s Note: The statements, opinions and data contained in all publications are solely those of the individual author(s) and contributor(s) and not of MDPI and/or the editor(s). MDPI and/or the editor(s) disclaim responsibility for any injury to people or property resulting from any ideas, methods, instructions or products referred to in the content. |
© 2025 by the authors. Licensee MDPI, Basel, Switzerland. This article is an open access article distributed under the terms and conditions of the Creative Commons Attribution (CC BY) license (https://creativecommons.org/licenses/by/4.0/).