Article

The Possibilities of Using Non-Traditional Raw Materials for Fertilizing Products

by
Goda Gudinskaitė
* and
Rasa Paleckienė
Department of Physical and Inorganic Chemistry, Kaunas University of Technology, Radvilėnų pl. 19, LT-50254 Kaunas, Lithuania
*
Author to whom correspondence should be addressed.
Sustainability 2025, 17(13), 5710; https://doi.org/10.3390/su17135710
Submission received: 13 May 2025 / Revised: 17 June 2025 / Accepted: 18 June 2025 / Published: 20 June 2025

Abstract

In recent years, the Green Deal has become a cornerstone of the European Union’s development strategy, aiming to establish a sustainable, innovative and environmentally friendly economy. One of its primary goals is to reduce the negative impact of intensive farming by promoting sustainable agricultural practices. These practices include replacing synthetic fertilizers with more natural alternatives and substituting chemical plant protection products with biological solutions. A noteworthy prospect in this context is the growing insect farming industry, which opens up new possibilities for the food industry via waste processing. In Lithuania, insect farming is also expanding rapidly, with companies producing several hundred tons of frass (insect excrement and residues from growing media) every year. As insect farming is projected to increase rapidly over the next decade, the amount of frass produced will also increase. Therefore, it is necessary to find sustainable ways to use this byproduct. Frass is emerging as an important area of research and practical innovation with great potential for fertilizer production. Initial studies show that frass can contain up to 6% nitrogen, 2% phosphorus and 3% potassium, making it a valuable alternative to synthetic fertilizers. The chitin content (nearly 14%) in frass not only improves the soil but also improves plant resistance to disease. In addition, its organic composition improves soil structure and microbiological activity, contributing in the long term to increasing soil fertility. This paper analyses different samples of frass, assesses their physical and chemical properties and discusses the possible applications of these products in the context of sustainable agriculture. The studies show that frass can be a valuable raw material for fertilizer production, potentially reducing the need for synthetic fertilizers and contributing to the reduction in agricultural waste. By combining economic benefits with ecological sustainability, this research contributes to wider sustainable agricultural innovation.

1. Introduction

1.1. The Development and Trends of Sustainability Awareness

The development trends of the fertilizer sector in recent decades are closely related to the goals and objectives of the European Commission. According to the objectives of the Green Deal, the goal is to reduce the use of non-renewable resources in fertilizer production by 30% [1,2]. In order to avoid the negative consequences of intensive farming, various options for sustainable agriculture are often proposed, for example, partially replacing synthetic fertilizers or replacing chemical plant protection products with biological ones. Residues from other industries or agricultural sectors can be used as an alternative raw material for fertilizer production. Large amount of waste is generated in the agricultural and food industry sectors. Therefore, the recycling and use of this waste is an important issue today. These waste materials are rich in their composition and valuable bioactive compounds that can be extracted from them during processing [3]. New, innovative technologies and special scientific research is needed to select methods of obtaining useful materials from processing various kinds of waste [3,4]. The use of biological organic waste has been a known and frequently applied solution for many years to create alternative fertilizer products [2]. There is an ever-increasing attention being dedicated to solving this problem worldwide.

1.2. The Expansion of the Insect Market

The future of food production and agriculture is closely linked to the ever-increasing human population. According to FAO data [5,6], the world population is expected to increase to 9–10 billion by 2050. Therefore, alternative food resources are being sought after. One such solution of meeting the food demand is the use of insects as a promising source of protein. Edible insects are attracting much attention due to their high nutritional value, i.e., a particularly high level of protein and essential amino acids [6]. The relevance of using edible insects as an alternative for food and animal feed is obvious, but it is necessary to assess not only nutritional but also legal, environmental and bio-functional aspects [7,8].
The abundance of scientific publications [9] suggests that research into the cultivation and use of insects is relevant to both scientists and entrepreneurs. More and more specialized growers are emerging who are engaged in mass cultivation of insects. Novel food legislation allows the consumption of edible insects, which is encouraging the development of this specialized industry. Commercial insect farming is a rapidly growing sector of the economy. Various species of insects are being farmed, but the most popular specimen are Hermetia illucens (BSF) and Tenebrio molitor (yellow mealworms) [9].
In 2024, the global insect farming market was valued at approximately $1.4 billion and is projected to exceed $3 billion by 2030, growing at an annual rate of 25% [10,11]. Since 2021, the yellow mealworm Tenebrio molitor L. (Coleoptera: Tenebrionidae) has been approved as an alternative protein source for animals [12] and humans [13]. This has led to even greater interest and development of applications. These insects are widely studied and attract the attention of scientists in various fields. Both the cultivation and use of T. molitor larvae as a source of protein in the food industry and the potential opportunities in the field of waste management are being analyzed [14,15,16,17]. The use of by-products (waste) generated by the cultivation of these insects is also important. The insect farming sector provides the prerequisites for the production of a number of biotechnological products obtained from the bioprocessing of insects, such as biofertilizers, animal feeds, edible foods, biopolymers, bioenzymes and biodiesel [18].

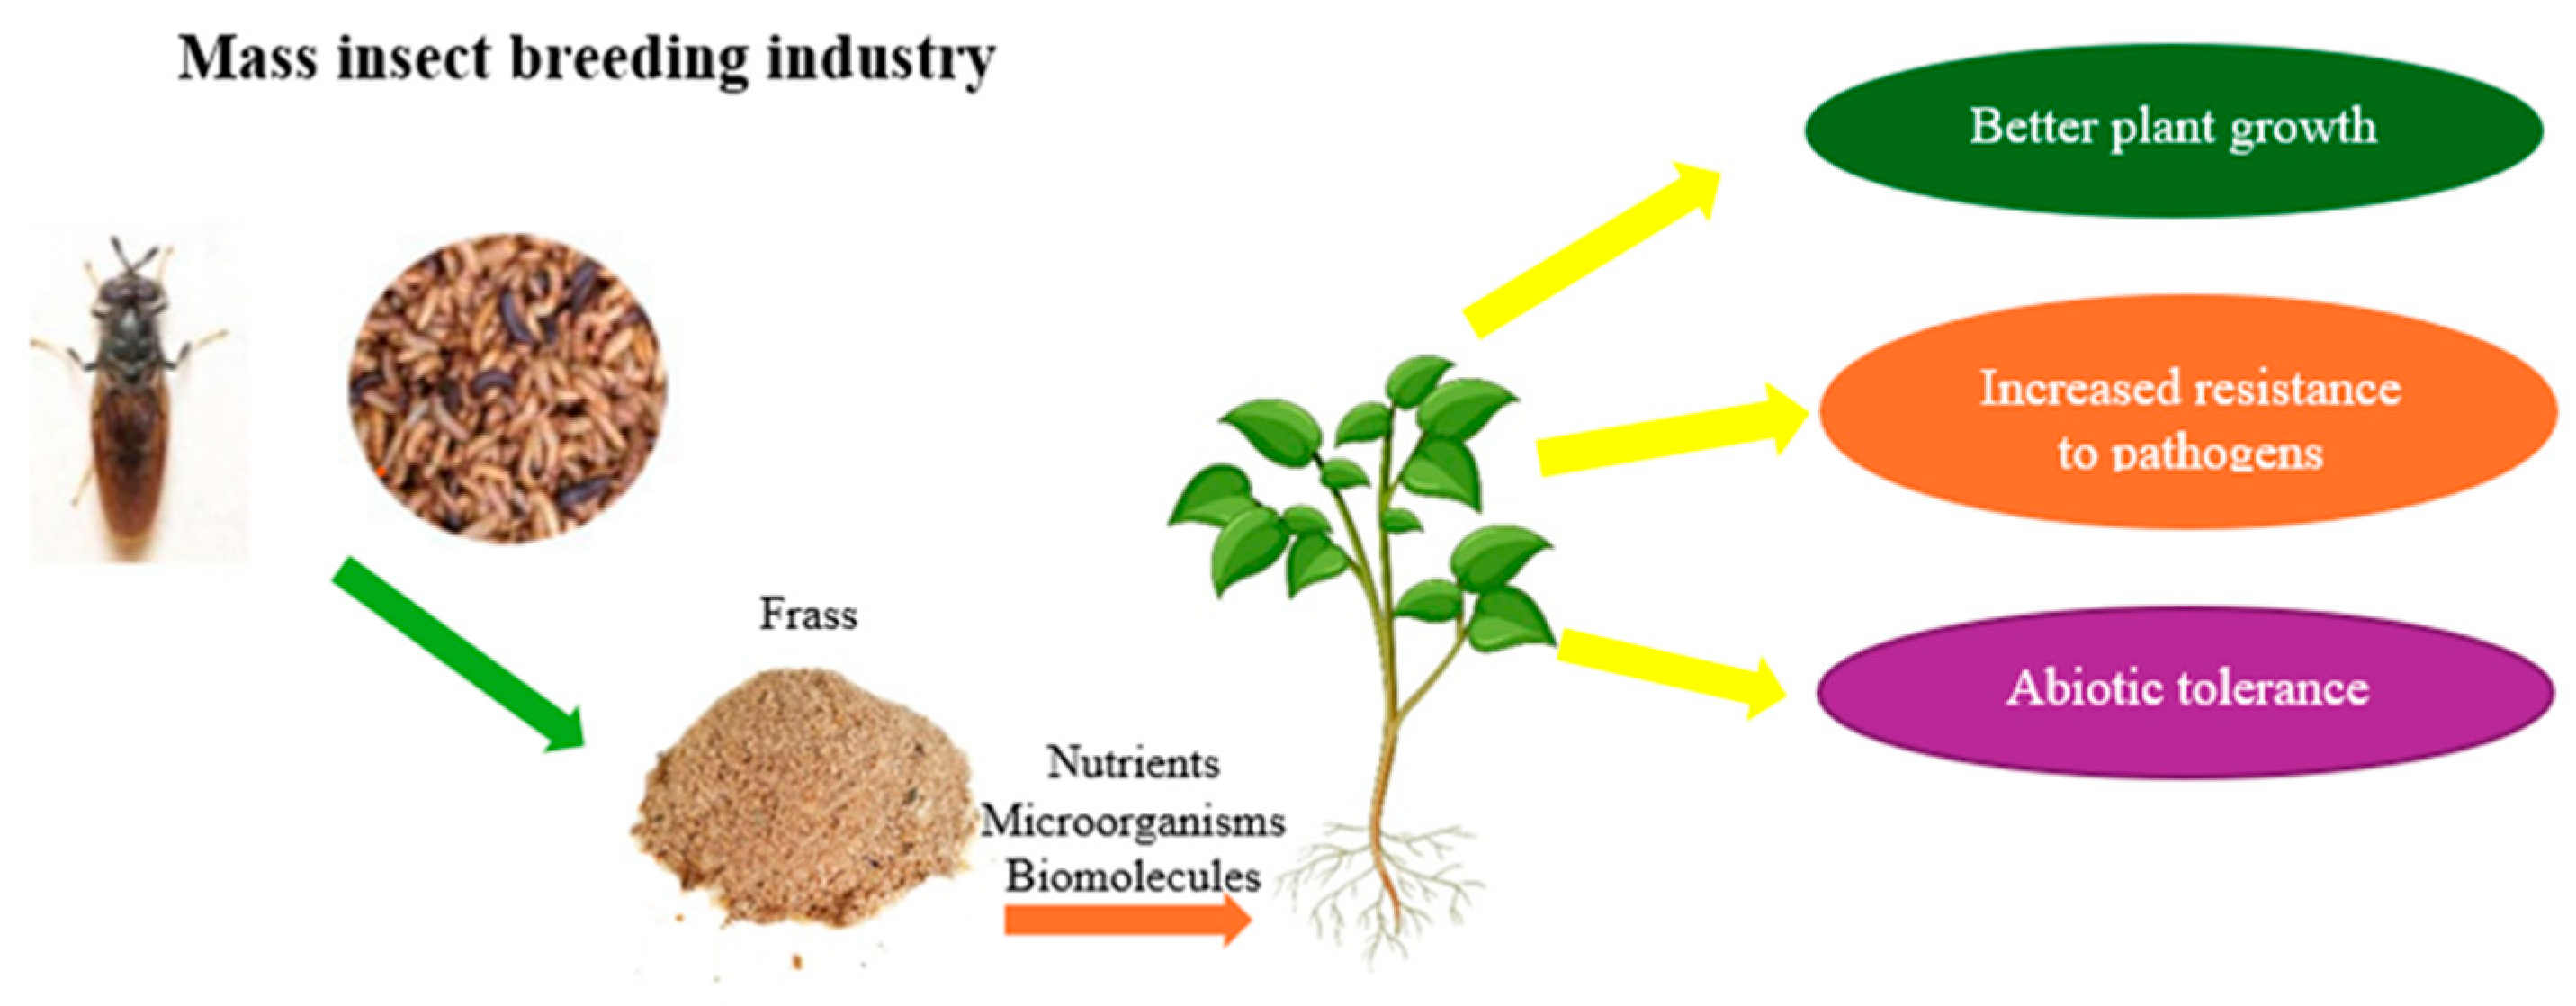
1.3. Opportunities for the Utilization of Generated Waste

One way to use agricultural waste to obtain fertilizers is to compost it. A faster rate of cellulose, hemicellulose and lignin degradation is achieved by using these insects, i.e., black solder fly larvae (BSFL) and Tenebrio molitor L. (mealworm). The possibilities of using insects for waste recycling are being intensively studied [19,20,21,22,23,24,25,26]. There are published results of studies that Tenebrio molitor larvae can be useful in the recycling of microplastics [27], causing polystyrene and polyethylene depolymerization and biodegradation [28]. The conditions for rearing such mealworms [29] and processing them into biofuels are being studied [30].
The insect farming sector generates large amounts of waste to meet food needs, which can become a serious environmental problem. The waste generated from insect farming consists of feed residues, larval feces and exoskeletons. It is estimated that 2–4 tons of waste is generated per ton of edible insects [31]. In order to mitigate this, recycling of this waste according to circular economy methods is relevant [5,14,15,16,17]. Biological waste generated during insect farming—frass—is valuable, and its properties, suitability and possibilities of use are widely analyzed. There are many studies that analyze the biomass generated during insect farming and its use as a soil substitute [31,32,33,34,35,36,37,38,39,40,41,42,43].
Frass undoubtedly has great potential for use in agriculture. The use of frass as an alternative to mineral fertilizers by reducing dependence on non-renewable natural resources is being studied very widely. There are known studies [32] where the composition and effect of frass are compared with poultry manure. Frass is superior in terms of C and N ratio and is a more effective product for soil improvement. Comparative studies of the effectiveness of use of frass for soil improvement are being conducted, and soil health is being assessed [33,34,35,36]. Various vegetation experiments are being conducted when frass is used instead of mineral fertilizers [37,38,39]. The results show that frass has great potential to be used as a substitute for mineral NPK fertilizers. The effect of frass as a fertilizer substitute on germination and growth has been determined [38]. The chemical composition and nutrient concentration of frass are heterogeneous and are mainly influenced by growing conditions and feed used [31,32,40]. Frass contains significant amounts of chitin and other bioactive components [15,35,39,40,41,42,43,44,45], which makes it not only an alternative agronomic practice to use instead of mineral fertilizers, but also as a means of protecting plants from abiotic stress [40,41] and acting as a repellent [41,42,43,44,45]. The role of chitin in current sustainable agricultural practices is gaining increasing importance, making frass a potential raw material of even greater value due to it being a source of this natural biostimulator and protective compound [44].
Frass, which is obtained by growing mealworms, is very different, and there are various studies dedicated to its use. Experimental studies have been carried out in which mealworm frass was used for the adsorption of heavy metals (Cd) [46]. The adsorption-desorption mechanism and the influence of external conditions have been studied. It was found that the process depends greatly on environmental changes, but the results suggest that MF is suitable as an effective adsorbent for Cd removal [46]. Various methods are being used to extract useful components from frass, such as chitin. The possibilities and applications of such biopolymers are being studied [15,41]. Frass is used for the production of biochar [15] and for the production of biogas as a raw material for anaerobic digestion [47]. Oil, produced from frass by pyrolysis, is used as a bioinsecticide [43]. The use of frass has shown to stimulate the effectiveness of local bacteria and to influence soil formation processes by affecting CaCO3 conversion [48].
The emerging edible insect industry fits perfectly into the agricultural sector as a classic example of the principles of the circular economy [9,17,18,49,50,51]. Insects are grown as an alternative source of food. On the one hand, they are a source of protein and other valuable raw materials such as chitin [5,6,15,41,42,43,44,45]; on the other hand, insects are used as a biotechnological tool for the processing of various agricultural residues [14,15,16,17,18,19,20,21,22,23,24], as these byproducts can be used as part of the insect diet. The waste remaining after larval rearing—frass—can be further used as a fertilizer product or growing medium [15,16,17,29,30,31,32,33,34,35,36,37,38,39,40,41,42,43,44,45]. Figure 1 shows the benefits frass provides to plants when it is used as a fertilizer.
The chemical composition (organic nitrogen, soluble carbon and nutrients) and physical properties (small size and layered structure) of insect frass are generating increasing interest in their potential of improving soil fertility and developing new organic products. It not only contains beneficial microorganisms such as some species of Bacillus and Pseudomonas bacteria, but frass is also a source of chitin, which helps to improve the plant’s tolerance to biotic (insect and nematode) and abiotic (drought and salinity) stresses [40,52]. Current research in this field is focused on two industrial insect species: the black soldier fly (Hermetia illucens) and the mealworm (Tenebrio molitor). The application of frass from these two insects of 5–10 tons per hectare increases the yield of important crops such as oilseed rape, barley, rye, corn and sugar beet, both in quantity and quality [49,53].
Obtaining organic fertilizers and optimizing their quality is an important factor in improving soil health and crop output. In order to create and produce sustainable fertilizers, a lot of research is being conducted. After reviewing the trends in insect farming and the need and possibilities of using biodegradable waste in agriculture, the aim of our study was formulated—to produce liquid fertilizers by evaluating the composition of frass from Lithuanian company UAB “Divaks”.
The scientific research focused on two main hypotheses:
H1. 
The waste from rearing Tenebrio molitor insects is a suitable source of plant nutrients.
H2. 
Frass is an appropriate raw material for producing liquid fertilizers through the extraction method.

2. Materials and Methods

2.1. Materials and Sample Preparation for Analysis

Chemical analysis and extraction were performed using chemically pure or pure analytical reagents, along with the standardized methodology and using appropriate laboratory devices. Each sample was tested three or more times. Every analysis was replicated two, three, or more times (depending on the requirements for methodology or repeatability of measurements). All values presented in this work have been calculated as an arithmetic mean with standard error (±SD).
Frass (FR) is the solid light brown colored waste of the company “Divaks” (Marijampolė, Lithuanian), which produces and develops new ingredients for food and animal feed industry from insects (Tenebrio molitor). FR is a byproduct of insect breeding—the remaining substrate consisting of spent feed, insect feces, and insect remains. Analysis was carried out using air-dried frass. FR samples from different growing batches, designated DF1 and DF2, were analyzed. Samples for chemical analysis were prepared according to methodological requirements. Frass sampling and preparation were carried out in accordance with the following standards: EN 1482-1:2007 Fertilizers and liming materials—Sampling and sample preparation—Part 1: Sampling and EN 1482-2:2007 Fertilizers and liming materials—Sampling and sample preparation—Part 2: Sample preparation [54,55]. First, samples of waste were taken from different pilot facilities, from the boxes, after the end of the intended larval rearing period, in order to form a composite sample reflecting the characteristics of the entire test batch. Such a sample is final and homogeneous. Laboratory samples are taken from it, which are tested immediately (physical tests) or ground and prepared as a test sample for chemical analysis. This sampling and preparation process ensured the accuracy, repeatability and reliability of the tests.

2.2. Physical Analysis

RETSCH (Retsch, GmbH, Haan, Germany) sieves (DIN-ISO 3310/1) with a mesh size of 0.2, 0.5 and 1.0 were used to determine the particle size distribution. The mass of every size fraction was determined by weighing on a WPS 210/C Kern ABJ balance with an accuracy of 0.001 g [56].
The moisture content was determined by a thermogravimetric method using an electronic KERN MLS_N (KERN & SohnGmbH, Balingen, Germany) moisture meter with a measurement accuracy of 0.01% at a sample weight of more than 1.5 g and an operating temperature of 40–160 °C [57].
The bulk density and packed bulk density of frass samples were determined by the gravimetric method [57].
The density of the extracts was determined by the pycnometric method using a 5 cm3 pycnometer and electronic scales, WPS 210/C Kern ABJ (accuracy of 0.001 g).
A pH meter HANNA instrument pH 211 microprocessor (HANNA instruments, Woonsocket, RI, USA) with a glass electrode (accuracy of 0.01) was used to determine pH values [58].
The viscosity of the solutions was determined by the viscometer method using a glass capillary viscometer (Ø 3 mm).
The refractive index was determined using an IPF-2 refractometer (KOMZ, Kazan, Russia) with an accuracy of 0.001 increments.
The INOLAB COND 720 (WTW GmbH, Weilheim, Germany) with an accuracy of 0.001 mS·cm−1 was used to determine the electrical conductivity.

2.3. Chemical Analysis

Total nitrogen (N) was determined by the Kjeldahl method with the mineralizer Turbosog TUR/TVK, automatic system Gerhardt Vapodest 45s (C. Gerhardt GmbH & Co. KG, Koenigswinter, Germany), using 96% sulfuric acid according to the LST EN 13654-1:2002 [59]. The essence of the method is that the analyte is distilled into a boric acid solution, while the concentration is determined by the results of the titration with HCl (the accuracy ofthe method is 0.5%). The method was applied three times.
The concentration of water-soluble phosphorus (P2O5) was determined by spectrophotometric analysis [60], using a spectrophotometer T-70+ UV–VIS (PG Instruments Limited, Lutterworth, UK) with a 10.0 mm cell at the wavelength of 450 nm (accuracy_0.004 Abs). The potassium concentration was determined by the flame photometric method at the wavelength of 766.5 nm, using a Jenway PFP-7 (Cole-Parmer Ltd., Staffordshire, UK) flame photometer. Sodium (Na) concentration was determined by a flame photometric method based on the emission intensity at wavelengths of 589.0 and 589.6 nm doublets. A Jenway PFP-7 (Cole-Parmer Ltd., Staffordshire, UK) flame photometer was used for the analysis. Calcium and magnesium concentrations were determined by a complexonometric method [60]. The concentration of trace elements (Zn, Mn, Cu, Fe, Co, Mo, Cd, Pb, Ng, Ni, Cr, As) was determined by atomic absorption spectroscopy (AAS) using a Perkin Elmer Analyst, PerkinElmer (PerkinElmer, Waltham, MA, USA) instrument (accuracy ± 0.001 Abs). The flame was obtained by burning a gas mixture of acetylene (7.5 L/min−1) and air (10 L/min−1), except when measuring molybdenum (N2O was used).
Organic matter content was determined according to the modified LST EN 13039: 2012 standard [61]. The samples for the analysis were dried, weighed to within 0.001 g and burned for 1 h at 900 °C temperature. The amount of organic matter in the samples was calculated from the weight loss.
The carbon concentration was determined by the TOC method [62]. All TOC analyses were performed by using TOC analyzer (TOC-L, Shimadzu, Kyoto, Japan) following the LST EN 1484:2002 (EN 1484:1997) standard.
The following chemicals were used for the chemical analysis: potassium chloride (KCl) p. a., “Reachem”, Bratislava, Slovakia; potassium hydroxide (KOH) p. a., “Eurochemicals”, Warsaw, Poland; hydrochloric acid (HCl) p. a., “Eurochemicals”, Warsaw, Poland; sulfuric acid (H2SO4) p. a., “Eurochemicals”, Warsaw, Poland; nitric acid (HNO3) p. a., “Eurochemicals”, Brno, Czech Republic; phosphoric acid (H3PO4) p. a., “Eurochemicals”, Warsaw, Poland; boric acid (H3BO3) p. a., “Chempur”, Warsaw, Poland; potassium dihydrogen phosphate (KH2PO4) p. a., “Reachem”, Bratislava, Slovakia; ethylenediaminetetraacetic acid (C10H16N2O8), p. a., “Unichem”, Hamburg, Germany; distilled water.

2.4. Instrumental Analysis

X-ray diffraction analysis (XRDA) of samples (DF1 and DF1) was performed using Bruker AXS operating at the tube voltage of 40 kV and tube current of 40 mA. The X-ray beam was filtered with a Ni filter to select the CuKα wavelength. The step size was 0.05 and the dwell time was 0.5 s, anodic voltage Ua = 40 kV; strength of the current I = 40 mA. Data was analyzed using a Crystallographica Search-Match Version 2, 1, 1, 1 program.
FT–IR spectra of solid samples were recorded in the frequency range of 400–4000 cm−1 on a Perkin Elmer SPECTRUM GX 2000 (PerkinElmer, Waltham, MA, USA) device. FT–IR spectra of liquid samples in attenuated total reflectance (ATR) mode were recorded using a Frontier spectrophotometer (PerkinElmer, Waltham, MA, USA). A small amount of the sample was pressed against a diamond crystal plate, and the spectrum was recorded in the wavenumber range of 4000 to 560 cm−1. The number of scans was 6, with a resolution of 4 cm⁻1.
Scanning electron microscopy with energy-dispersive spectroscopy (SEM-EDS) was conducted using an FEI Quanta 200 FEG (FEI, Hillsboro, OR, USA, JAV) microscope with a Schottky electron gun. This system is equipped with a BRUKER (“Hitachi”, Tokyo, Japan) XFLASH 4030 X-ray energy dispersive spectrometer, enabling simultaneous chemical microanalysis. The microscope’s working distance ranged from 2–10 mm, and the energy resolution (Kα) was up to 133 eV, provided by a silicon drift detector [63].

2.5. Statistical Data Analysis

Depending on the repeatability, the investigation of properties of the same sample was performed 3–5 times, and the arithmetic mean of the determined values is presented in this study. Statistically analytical data of micro and macro nutrient concentrations was analyzed by using MS Excel data analysis (Anova, descriptive statistics) tools, calculating a range of statistical parameters for every data set. To analyze data in accordance with descriptive statistics, the observation cluster around the central location was described, and extremes are described by the degree of dispersion [64]. To evaluate results, the relative (RSD), standard (SD) and absolute (ASD) deviations were calculated at 95% probability. In all cases, the significance level was p ≤ 0.05. The article presents experimental measurement (analysis) data in tables and graphs. In graphs, the error bars show confidence intervals. All data (experimental measurement results) in the tables are presented as the mean and ±SD (standard deviation), calculated at p = 0.05 [65,66].

3. Results and Discussion

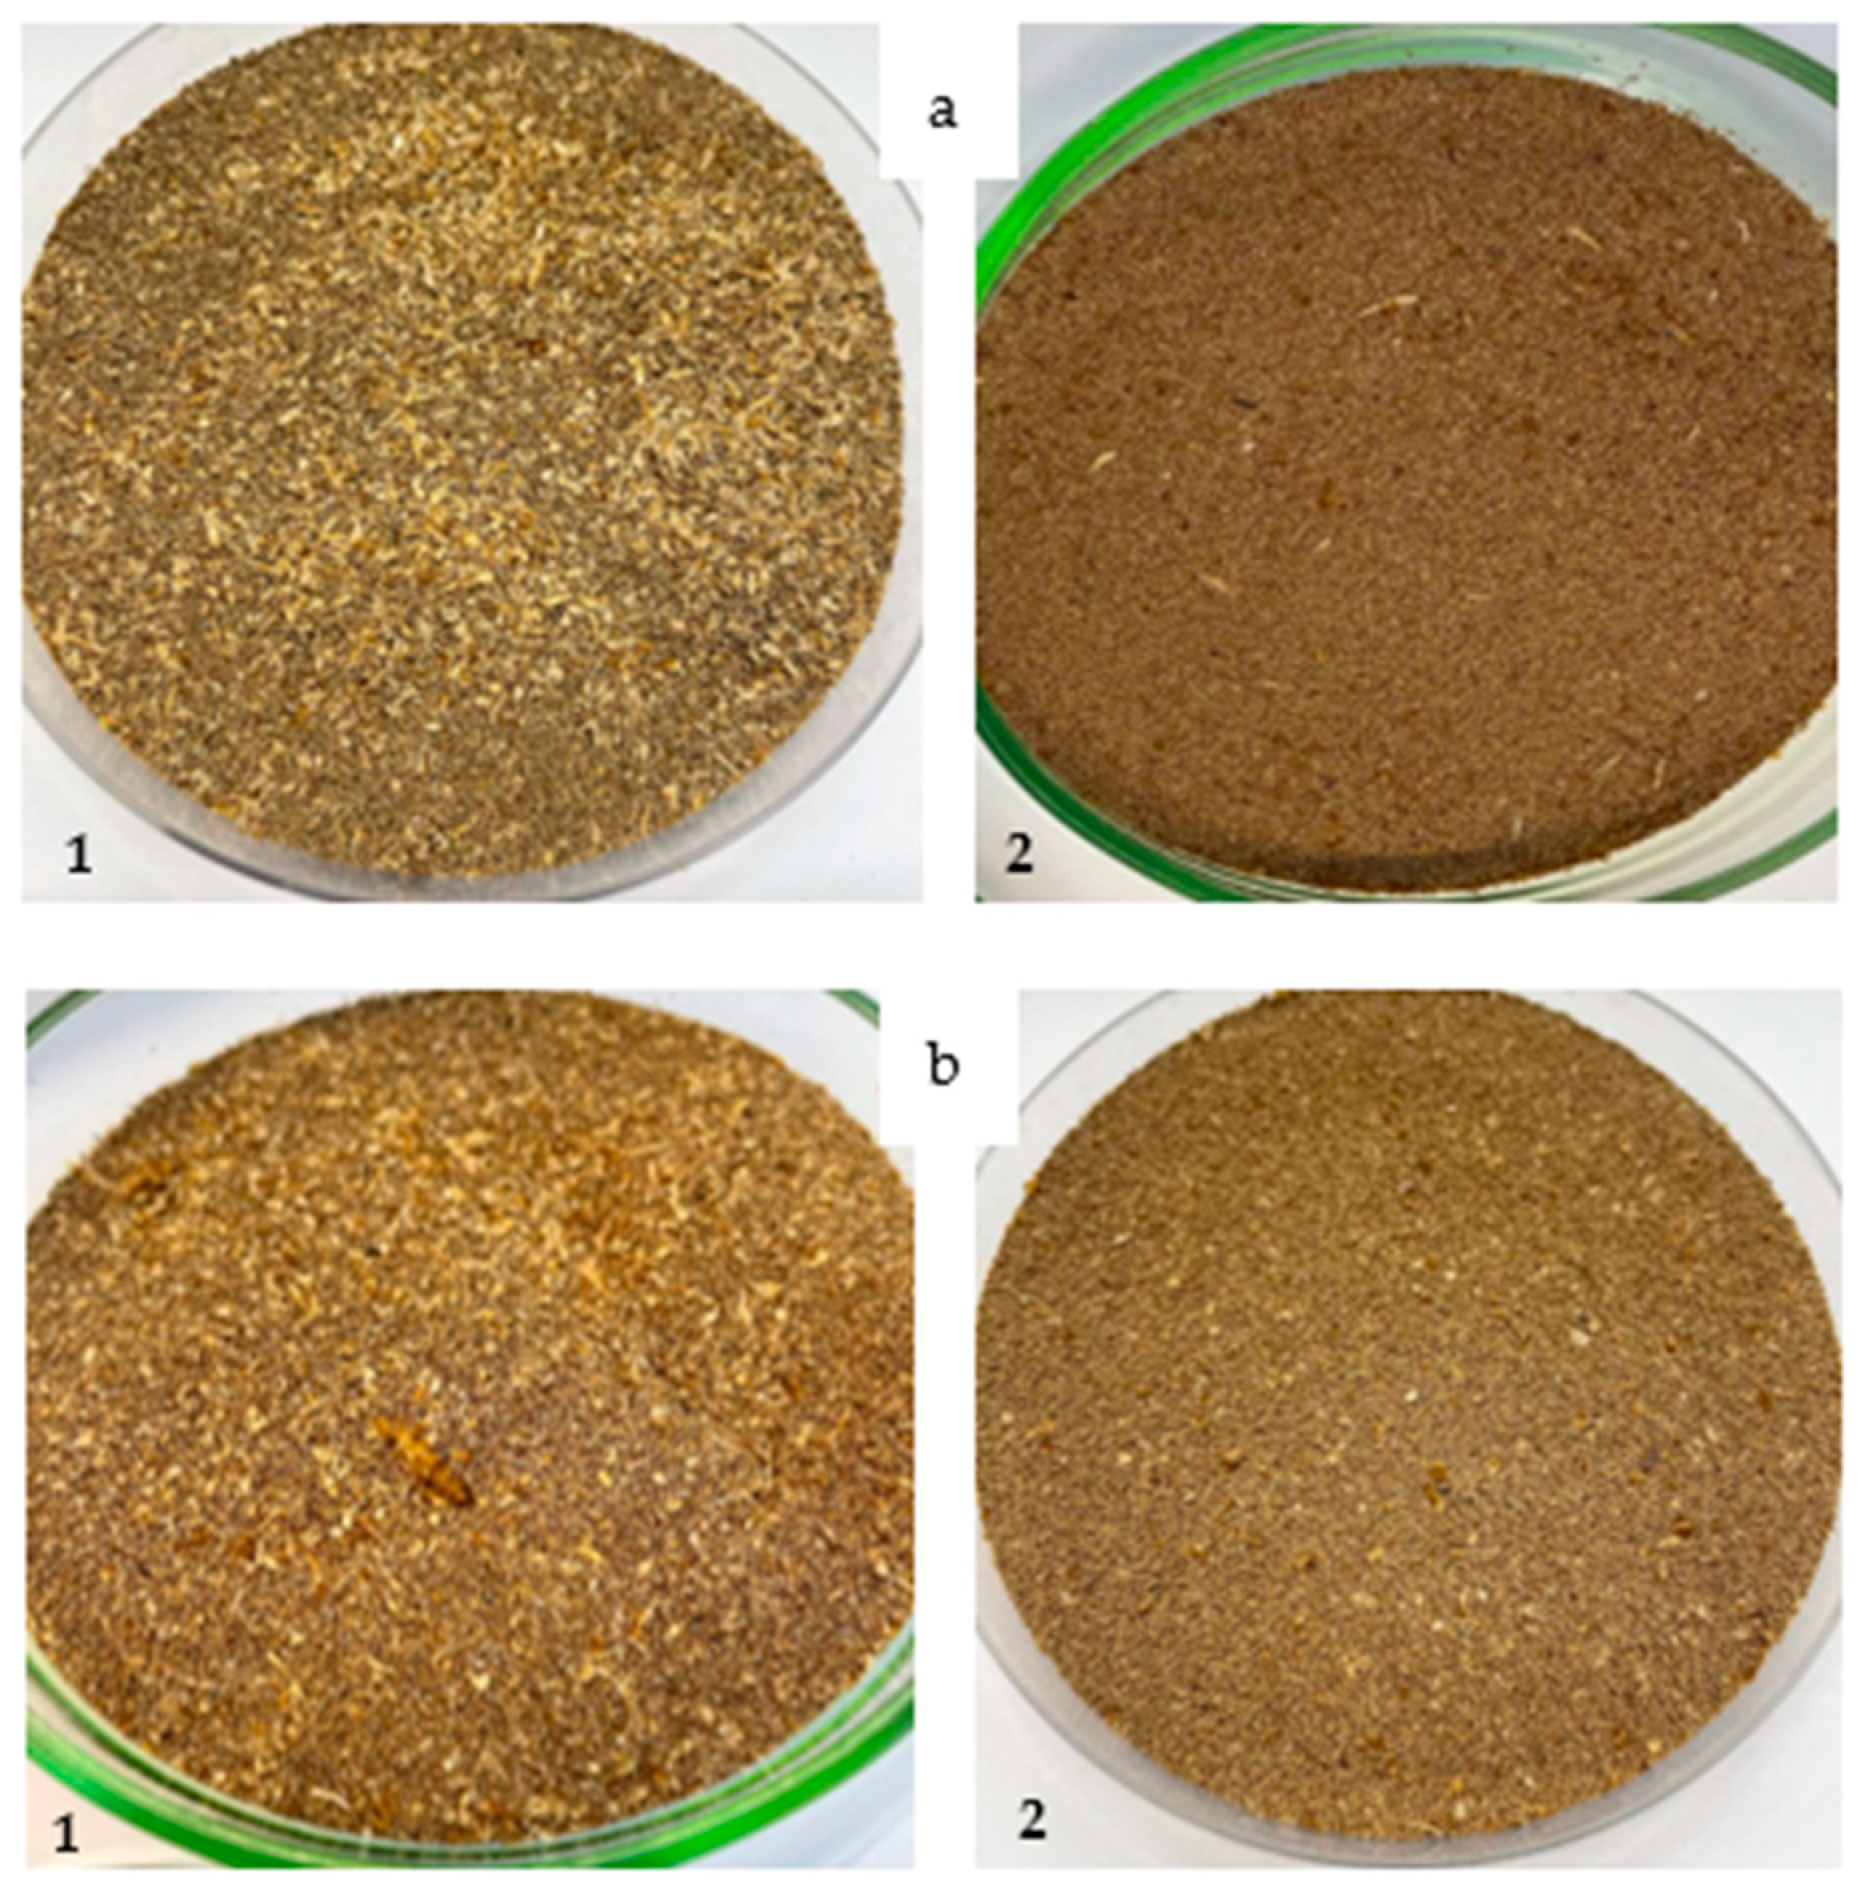
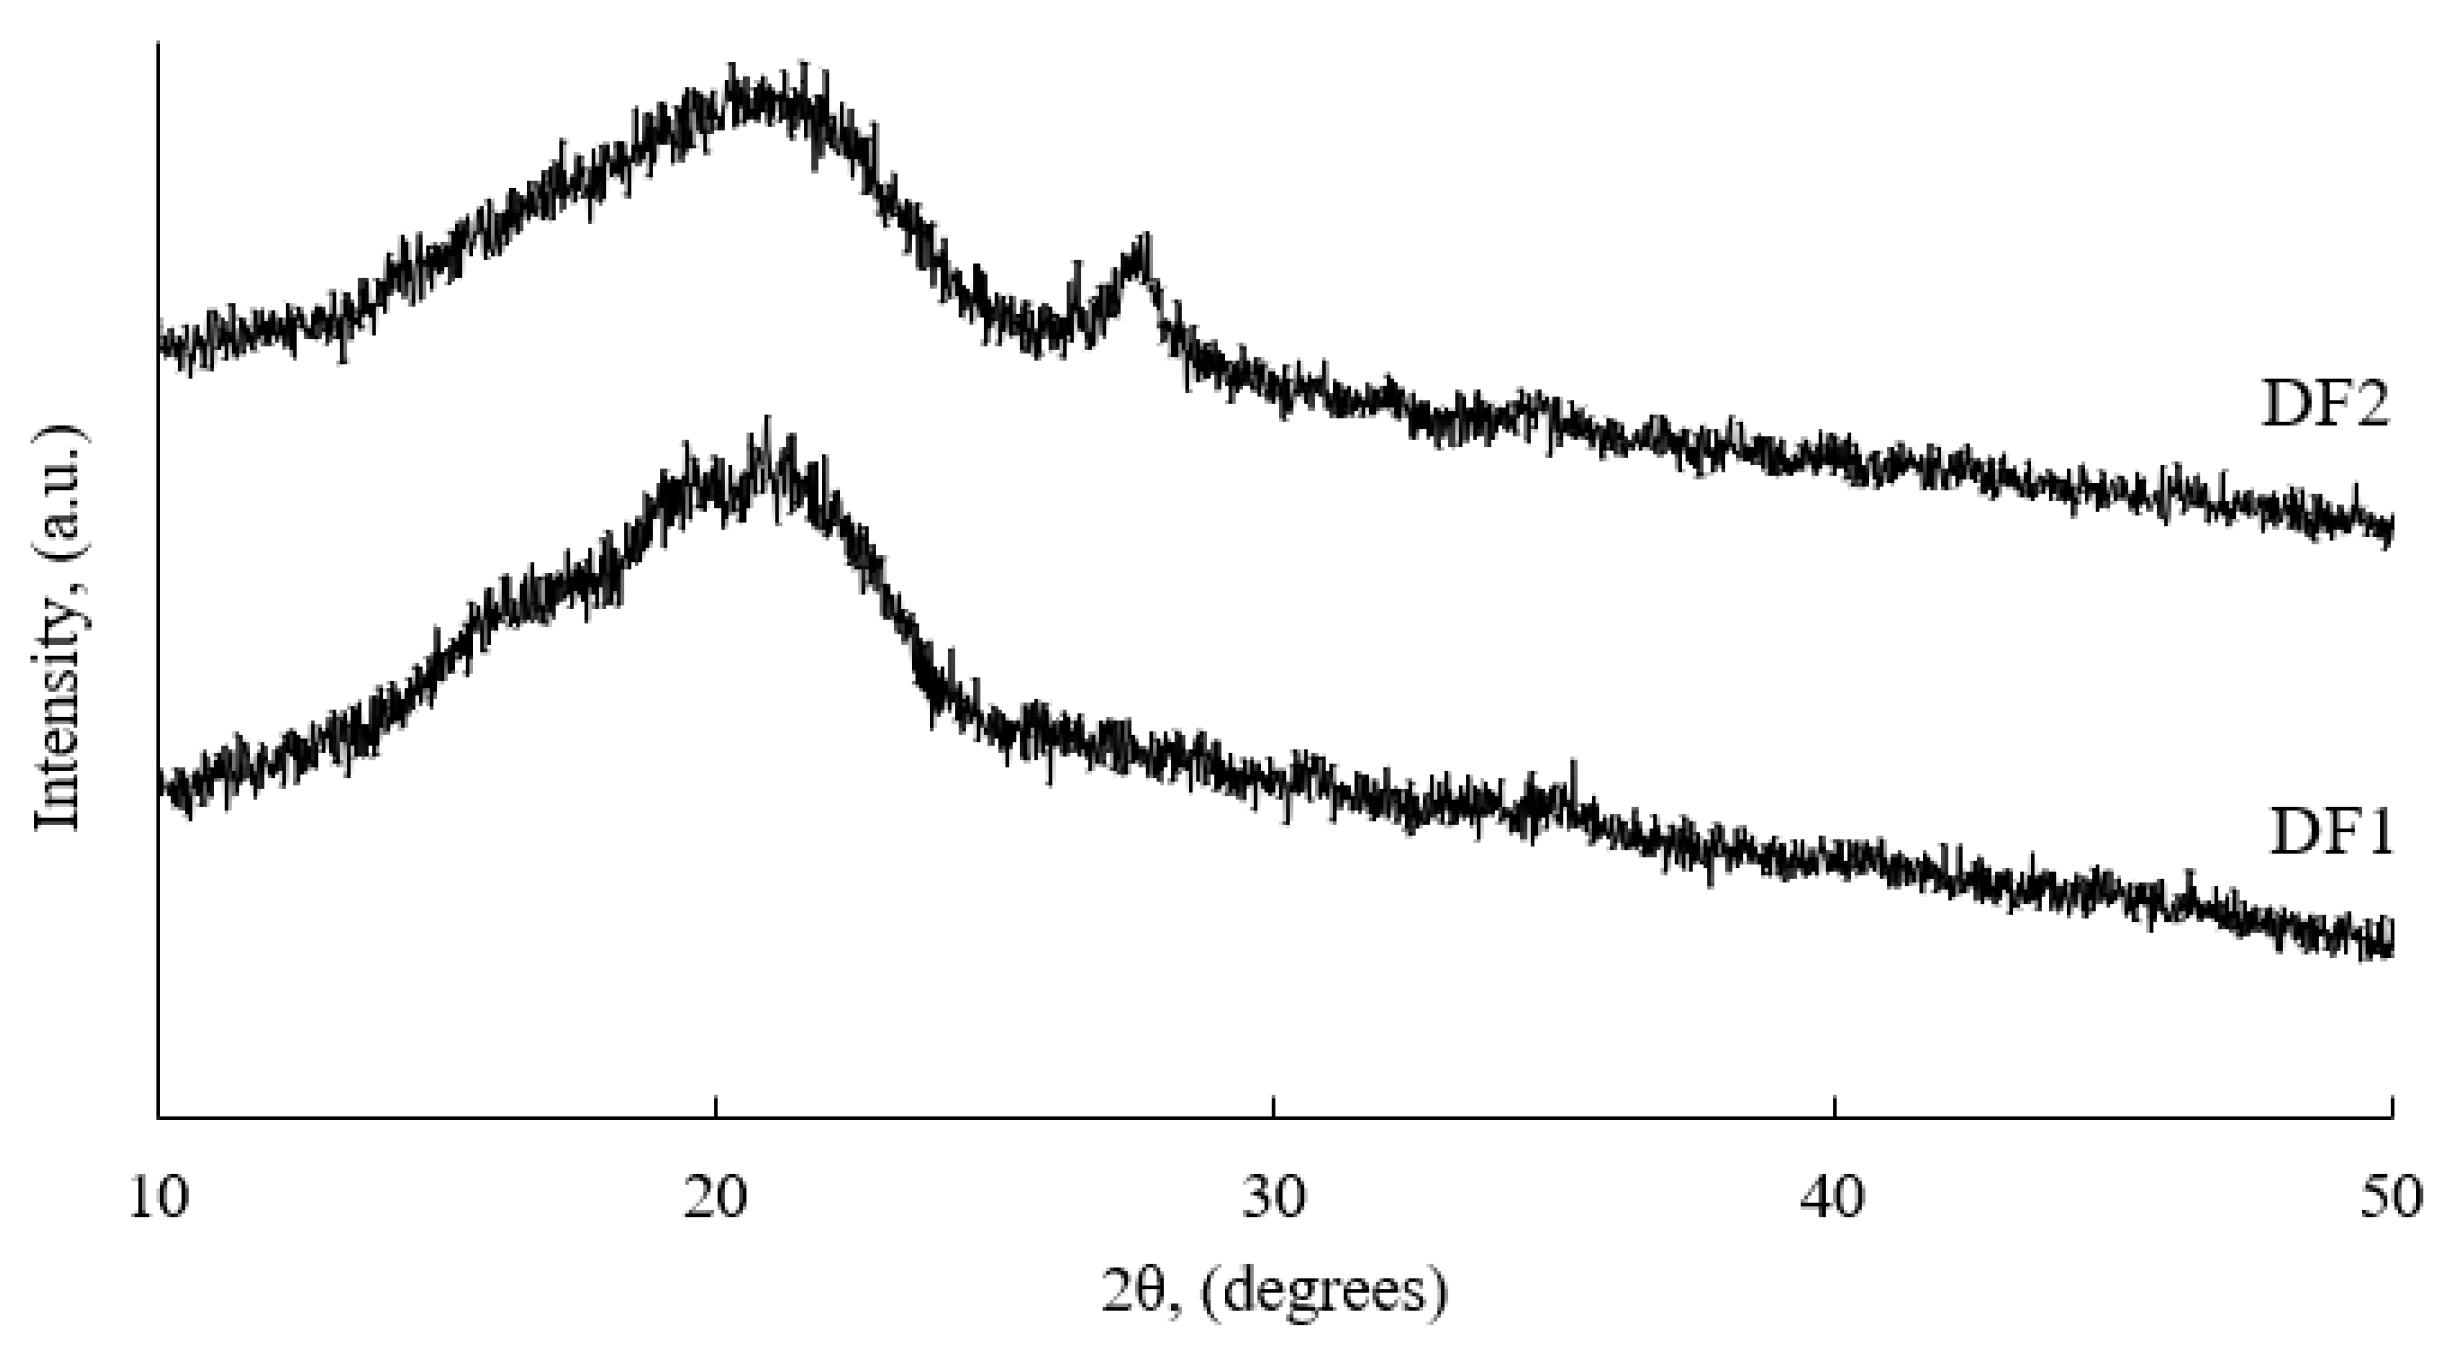
3.1. The Physical Properties and Chemical Composition of Frass Samples

In this work, frass from the Lithuanian company UAB “Divaks” was analyzed [67]. “Divaks” is one of the insect protein-focused companies involved in the innovative production of insect proteins derived from the yellow mealworm (Tenebrio molitor). Insect breeding is carried out in dedicated facilities covering an area of 300 m2. The insect diet is balanced based on methodologies developed by the company’s specialists. Locally sourced plant-based feed is used for breeding. The crude protein content of the feed is not less than 17% [67]. Frass (Figure 2) from two different cultivation batches (DF1, DF2) was used for the research. Figure 2(a1,b1) show the appearance of the raw material and Figure 2(a2,b2) show the prepared (ground) samples for determining chemical properties.
The chemical composition of frass was analyzed using various chemical and instrumental analysis methods. Samples of frass were evaluated for their suitability for fertilizer production, i.e., chemical and instrumental analysis was carried out. The determination of the chemical composition is essential for evaluating the nutrient content present in the raw materials and assessing their potential effectiveness as fertilizer. The second part of the study is dedicated to obtaining extracts and determining their properties.
The research started with the analysis of the physical properties of the samples in order to determine their main mechanical and structural characteristics and to compare and evaluate possible differences of the physical properties (moisture, bulk density, fractional composition, pH of the 10% solution). Samples from two frass batches were analyzed and the results are presented in Table 1.
The data presented in Table 1 shows that most of the studied physical properties (pH of 10% solution, moisture and fractional composition) are quite similar, only the bulk density differs significantly. The bulk density of the DF1 sample is 524.89 kg/m3, and DF2—393.81 kg/m3.
The determined physical properties of the two samples (DF1 and DF2) revealed significant differences (p < 0.05), which may affect their potential application in agriculture. The pH of the 10% aqueous solution of both samples was slightly acidic: DF1—5.85 ± 0.05, and DF2—5.45 ± 0.07, which indicates that DF2 is more acidic and may have a greater impact on the soil pH during application. The moisture content of DF2 was higher (8.76 ± 0.32%) compared to DF1 (7.41 ± 0.51%), which may enhance microbial activity but may also affect storage stability. Bulk density was significantly different, with DF1 showing a significantly higher value (524.89 ± 0.22 kg/m3) than DF2 (393.81 ± 0.35 kg/m3), suggesting that DF1 may be more efficient in terms of transportation and storage.
Fractional composition analysis showed that most of the particles in both samples were in the 0.2–0.5 mm range, especially DF2 (95.75 ± 0.86%), while DF1 had slightly more particles smaller than 0.2 mm (4.61 ± 0.69%) compared to DF2 (2.29 ± 0.72%). However, the differences in the fractional composition of both samples are not significant (p > 0.05).
In order to compare the DF1 and DF2 waste samples in more detail, X-ray diffraction (XRD) analysis was performed, the results of which are presented in Figure 3.
The XRDA patterns show that in both cases the format is characteristic of an amorphous material structure, rather than a crystalline one. However, the DF2 sample shows more peaks than the DF1 sample. Specific compounds cannot be identified due to the amorphous structure. A hump between 13 and 23 degrees is observed in the curves of both samples, with a maximum 2θ value of ~21°. Based on the data from scientific literature and the results of other researchers [20,21,46,68], it can be stated that the curves contain peaks corresponding characteristic of disordered organic structures, which are most often found in cellulosic materials of plant origin [69,70]. The peaks shown in these results are related to lignocellulosic biomass, such as cellulose, hemicellulose and lignin, which are believed to have been mainly derived from mealworm feed [21]. In this range, peaks characteristic of chitin is also recorded between 12.86° and 23.28° [71]. While for chitosan, peaks of maximum intensity are indicated at 19.92° and 26.53° 2-theta values. Therefore, the overlapping peaks recorded in the studied samples can be attributed to chitin and chitosan, which are linear polysaccharides consisting of D-glucosamine and N-acetyl-D-glucosamine. And the small but more pronounced peak at 2θ value ~27° can be attributed to silicon oxide (SiO2). The XRD patterns recorded for our samples are analogous to the results of other researchers on frass samples [20,21,68,69,70,71]. These results confirm that insect farming waste contains feed and processed (digested) feed, insect remains (larvae, skeletons, etc.). The data obtained by us on the composition of the compounds from the waste coincide with the results of studies on the composition of frass described in the works of other researchers [21,31], so it can be stated that the composition is dominated by cellulose, hemicellulose and lignocellulose. Chitin is also detected which enhances the physiological preparedness of plants to respond to various abiotic (e.g., drought, salinity) and biotic (e.g., pathogens, pests) stresses. In addition, chitin improves the activity of beneficial microorganisms in the rhizosphere, which further supports plant resilience under stressful conditions. The effects of chitin and its derivatives, such as chitosan, are also associated with the activation of the antioxidant system and the reinforcement of cell walls [72,73]. This confirms that frass can be used as fertilizers and soil improvers.
Fourier transform infrared spectroscopy (FT–IR) of the frass samples was performed to analyze the structure of the organic frass samples in more detail. The results of FT–IR analysis are presented in Figure 4.
The FT–IR chemical spectra allow identification of functional groups and components in each sample. Comparing the spectra of DF1 and DF2 frass samples, the broadest and most intense peaks in both samples coincide, but in the frequency range of 1000–1600 cm−1, small oscillations are visible, yet they are slightly different, where the amount of oscillations in the DF1 sample is smaller and they are more intense than in the DF2 sample. In the FT–IR spectrum, the intense absorption band recorded in the region of 3677–3000 cm−1 is attributed to the O–H (hydroxyl) group. There is also a peak at 2924 cm−1, which is characteristic of the C–H group vibrations. FT–IR spectra show characteristic carbohydrate absorption bands for cellulose, lignin and hemicellulose [74]. Absorption bands of different intensities in FT–IR spectra are assigned to these compounds, registered in 1735, 1508, 1458, 1370, 1321, 1268, 1031 and 897 cm−1 [74]. Peaks in the range of 1660–1683 cm−1 can be attributed to carbonyl groups (C=O). The lower intensity peak in the range 1540–1510 cm−1 confirms the presence of a C=C double bond. The peaks in the range from 1030 cm−1 to 1244 cm−1 can be attributed to C–O and C–H bonds, while the vibrations at 1032–1039 cm−1 frequency are characteristic of the Si–O functional group. The results obtained in the FT–IR spectra and the results of the absorption bands themselves and the groups identified based on them are corresponding with the results in the works of other researchers [41,46,48,74,75].
SEM images of frass obtained with a scanning electron microscope (Figure 5a and Figure 6a) allow us to say that the frass particles are not only of different sizes, but also of different shapes, and their surface is not smooth. The particles are porous and therefore have a large surface area. The EDS maps (Figure 5b and Figure 6b) and EDS spectrums show the distribution of elements (C, O, K, Ca, Mg, P and S) in the samples. SEM image and EDS results of both frass samples and the determined elemental concentrations of nutrients are fairly similar in both samples. EDS maps (Figure 5c–e and Figure 6c–e) show the distribution of nutrients (C, O and N) in the analyzed samples.
The obtained results show a uniform distribution of nutrients in the organic matter of frass (Figure 5 and Figure 6) which corresponds with the results of the research presented in the scientific papers [33,48], which shows that there are no isolated mineral phases that could determine the release of frass nutrients.
Carbon concentration in both samples (Figure 5c and Figure 6c) was found to be about 30%, oxygen (Figure 5d and Figure 6d) about 50%. There is a slight difference in the concentration of nitrogen (Figure 5e and Figure 6e): 9.9% of nitrogen was found in the DF1 sample, and 12.9% in the DF2.
A detailed analysis of insect farming waste is a crucial first step in evaluating its behavior in soil and its potential benefits to plants. The significance of such analysis is highlighted in several scientific publications [32]. Ongoing studies on the composition of frass, aimed at its application as a fertilizer, have been widely reported in the literature [32,33,34,35,36,37]. These studies indicate that frass holds strong potential for use in agriculture, horticulture, and soil regeneration. Furthermore, its applicability in organic farming systems has also been emphasized.
In the continuation of the experiment, chemical analysis of frass samples was carried out using the methods described in Section 2.3. The concentration of nitrogen, phosphorus and potassium, which are the main plant food elements, was determined and presented in Table 2. The analysis of secondary nutrients (Mg, Na, Ca, S) was also performed. The concentration of trace elements was determined using atomic absorption analysis methods. These results are also presented in Table 2.
The nitrogen concentration in sample DF1 is 3.25 ± 0.21%, and in sample DF2 it is 3.87 ± 0.21%. The difference is not large, but statistically significant (p ≤ 0.05).
Comparing the N concentration determined by the chemical analysis method in our studies with other known analytical results [31], which show that the total nitrogen concentration in mealworms frass samples varies from 1.59% to 5%, it is obvious that these results are analogous. In another publication [34] D. Beesigumaka and colleagues determined nitrogen concentrations in a very similar range: from 1.5 to 3%. Poveda reported that mealworm frass can have a nitrogen content from 2.7% to 7.8% [40].
The concentration of phosphorus (P2O5) determined in the DF1 sample is 2.06 ± 0.2%, and DF2—2.74 ± 0.45% respectively. The difference in concentration is not very large but is statistically significant (p ≤ 0.05).
Phosphorus concentration in the studied samples is consistent with the data provided by other scientists. The article by L. Henault-Ethier et al. [31] provides detailed NPK data. The results of the P2O5 concentration vary from 0.77% to 4.7%. The results of different origin of the analyzed frass are presented in the work, which confirms that the composition of frass depends on the growing conditions and the feed used.
The potassium concentration in sample DF1 was 2.33 ± 0.19%, and in sample DF2—2.60 ± 0.09% (p ≤ 0.05). These potassium concentrations are given in K2O. L. Henault-Ethier et al. [31] found that K2O of different origins of the analyzed frass was from 0.7 to 2.88%, Nyanzira et al. [37] found 2.8% and D. Beesimugukama et al. [34] found about 2% K2O in Tenebrio molitor frass.
The presented and obtained results allow us to consider that frass can be used as a substitute for traditional fertilizers, and agronomic studies proving its effectiveness have been conducted by scientists from various countries [33,35,38,39].
However, the results obtained do not fully agree with the results of instrumental analysis. In SEM-EDS analysis, higher amounts of total nitrogen were obtained. The concentrations of phosphorus and potassium coincide even when analyzed by different methods. The concentrations of calcium (CaO) and magnesium (MgO) in the samples are 0.69 ± 0.22% (DF1) and 0.91 ± 0.2% (DF2), 1.5 ± 0.10% (DF1) and 1.24 ± 0.19% (DF2) (p ≤ 0.05). These results agree quite well with the SEM-EDS results: calcium (Ca) 0.35% and 0.6%, and magnesium (Mg) 0.97% and 0.55%, respectively.
No sodium was found in the DF2 sample by the complexometric method, and the sodium concentration in the DF1 sample is less than 0.5% and, therefore, insignificant. The data obtained during the study confirms the data presented in the scientific literature [35,37,39,40,47].
The concentration of sulfur is quite high (~9%) and in most cases is completely sufficient for fertilizer. Molybdenum is not found in the samples, and the concentration of cobalt is very low 7.23 ± 0.25 mg/kg (DF1) and 2.47 ± 0.12 mg/kg (DF2). Fe concentration in sample DF1 is much higher than in sample DF2, 615.63 ± 0.55 mg/kg in DF1 and 284.05 ± 0.17 mg/kg in DF2. Zn, Cu and Mn were not found in the samples, because concentrations are below the detection limit of the device. Heavy metals Pb, Hg, Ni and Cr were found in the samples DF1 and DF2. However, all the values of heavy metals (except Cr) are insignificant, and it can be said that in the tested frass, samples do not contain heavy metals or do not exceed the limit values. Additionally, the organic carbon content was determined according to the standardized methodology [76] in samples DF1 and DF2. The determined organic carbon concentrations were 33.56 ± 0.60% (p ≤ 0.05) and 30.41 ± 0.69% (p ≤ 0.05), respectively. These carbon concentration determination results are similar to the SEM-EDS results of 30.69% and 30.95%, respectively (Figure 5 and Figure 6).
Different types of organic fertilizers—such as poultry and cattle manure, compost, and insect frass—possess distinct nutritional, agronomic, and environmental characteristics. Poultry manure is particularly rich in nitrogen, phosphorus, and potassium, making it highly effective in stimulating plant growth. However, due to its high ammonia content in fresh form, it can pose phytotoxicity and pathogen risks, thus requiring composting prior to use [77]. Cattle manure contains lower levels of nutrients but is widely used as a slow-release fertilizer that improves soil structure and microbial activity [78]. Compost, depending on its raw material composition, is an ecologically sustainable fertilizer that enhances humus formation and supports soil biodiversity [79]. In contrast, insect frass is gaining popularity as a sustainable alternative. It offers a balanced nutrient profile, rapid mineralization, and a positive impact on rhizosphere microbial communities. Moreover, frass production is based on circular economy principles, as it is derived from recycled organic waste, making it a sustainable and easily applicable input in organic farming systems. Considering its nutrient value, safety, and ease of use, frass can be regarded as a competitive alternative to conventional organic fertilizers.

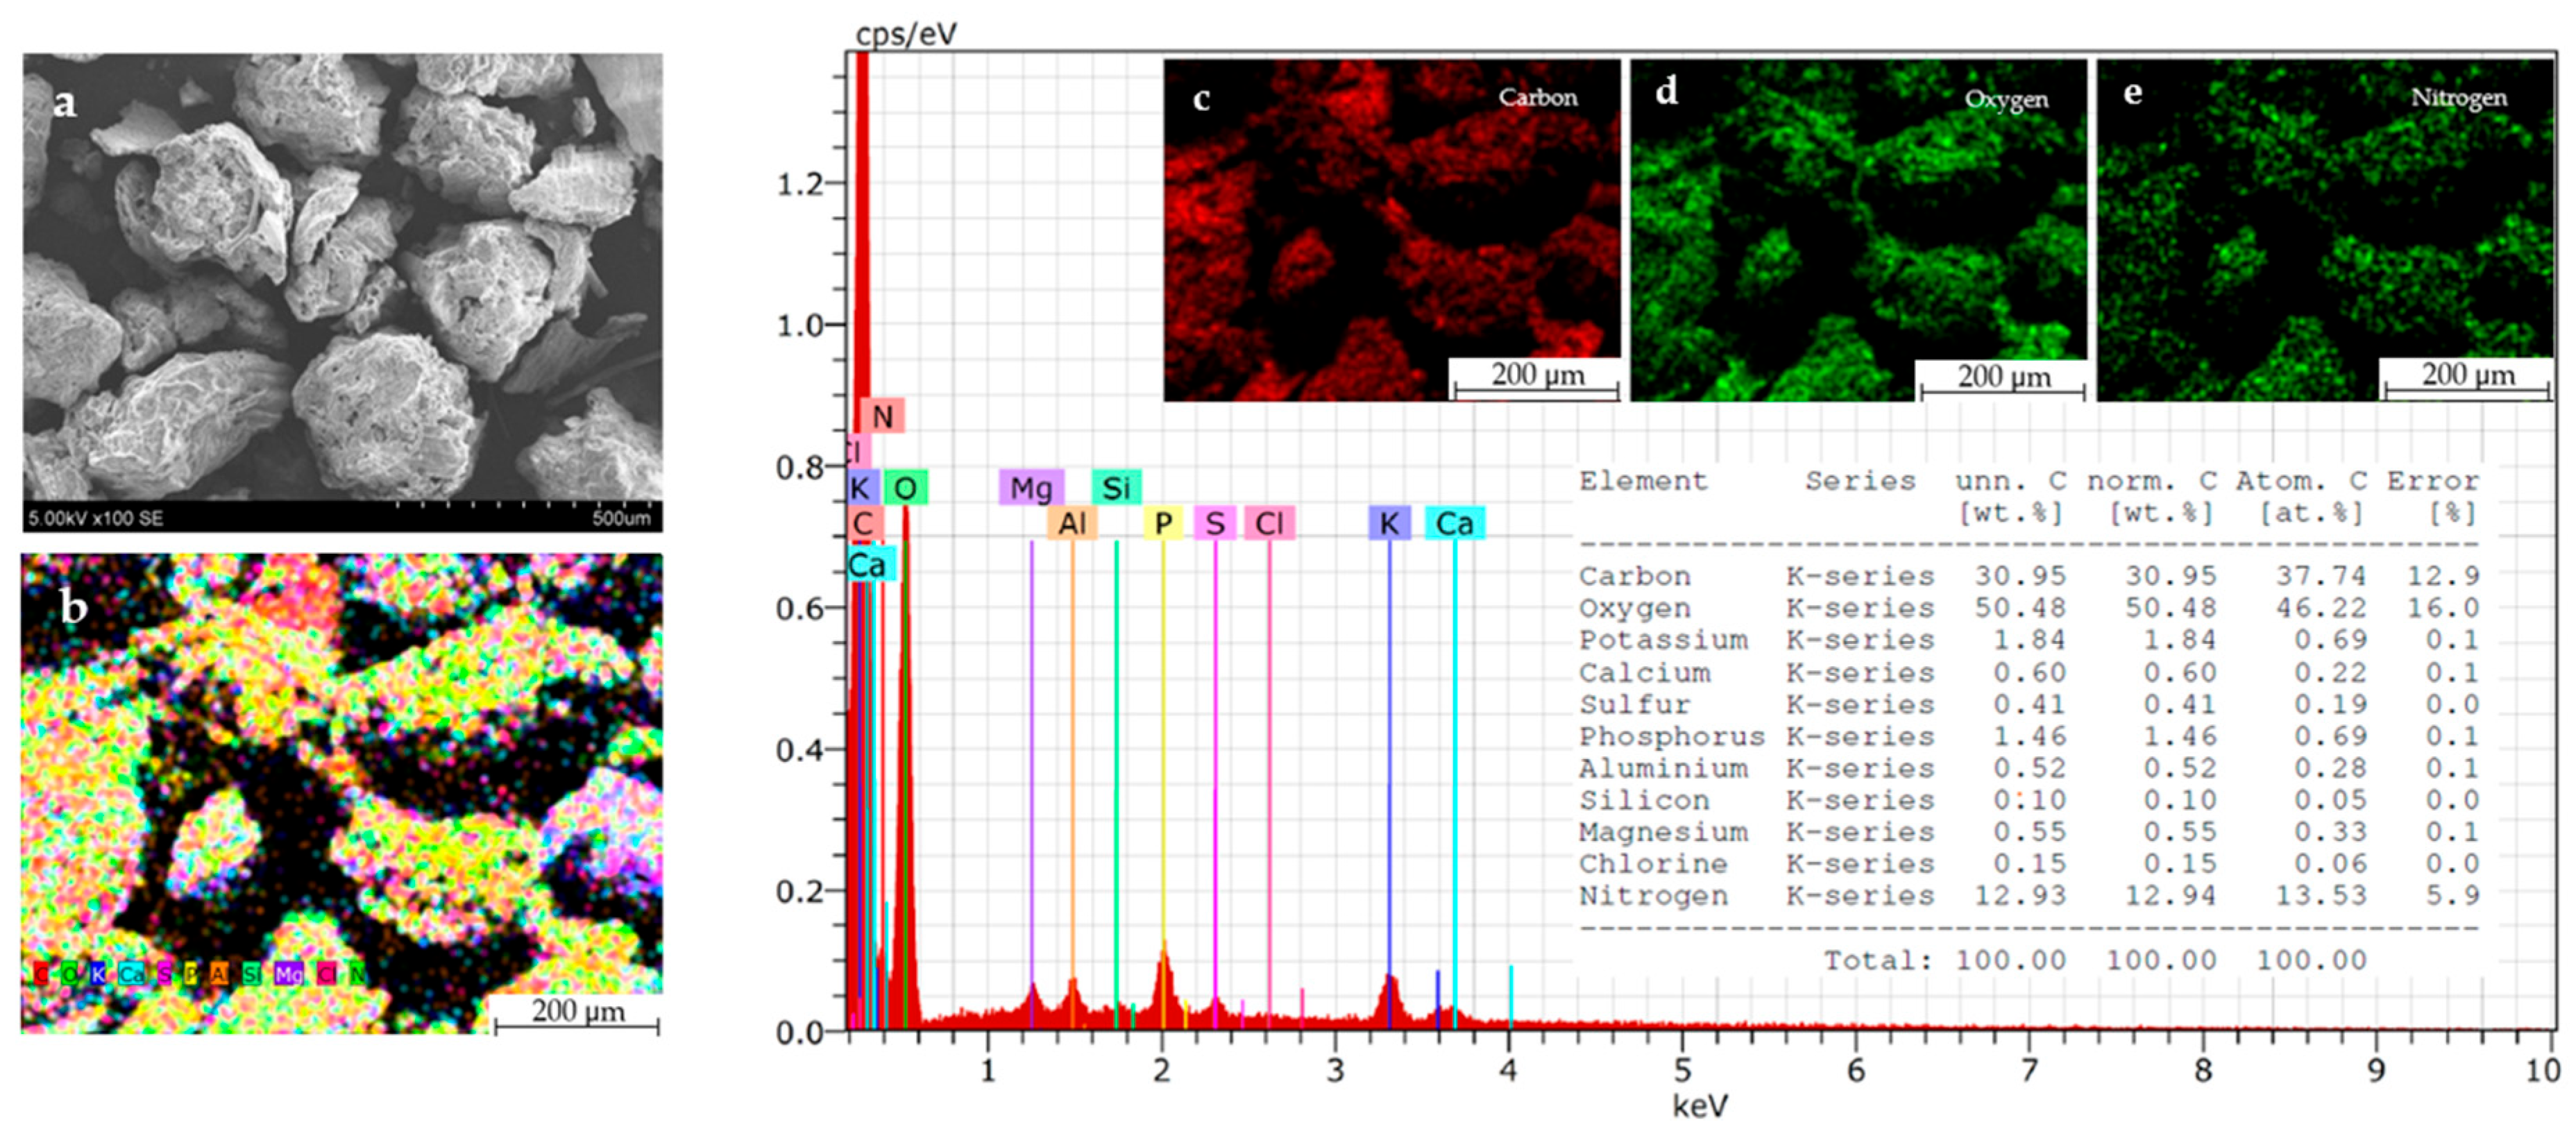
3.2. The Chemical Composition of Frass Ash

The amount of organic matter was determined as the experiment continued. The total amount of organic matter in samples DF1 and DF2 was determined by burning the samples for 1 h at 900 °C [80]. Organic matter was found to be 88.14% (w/w) of DF1 and 87.59% (w/w) of DF2.
To determine the composition of frass ash, an equal amount of both frass samples (5 g) was burned. Three experimental studies were carried out in parallel. Acidic and aqueous solutions were prepared from the ash obtained after burning the samples to determine the chemical composition. The solutions were prepared as follows: 0.5 g of the sample (DF1 or DF2) was weighed, 50 mL of water or hydrochloric acid (HCl:H2O = 1:1) was added and left for 24 h. After 24 h, the solutions were diluted, filtered and the analysis of the main nutrients was performed. The results of the chemical analysis are presented in Table 3.
The data shows that during burning, not only the organic part, but practically all of the nitrogen was removed from biomass frass DF2. Therefore, only minerals (phosphorus and potassium) remained in the ash, which vary considerably in concentration between solvents. Compared with the original frass, this ash contained very high concentrations of phosphorus pentoxide (21.29 ± 0.43% (DF2)—30.50 ± 0.62% (DF1)) and potassium oxide (18.98 ± 0.47% (DF2)—31.52 ± 0.22% (DF1)) soluble in hydrochloric acid.
The obtained results show that the ash of DF1 sample contains more N, P and K in it than seen in the ash of the DF2 sample. Also, the concentrations of elements in acidic solutions are higher than in the aqueous solutions. The concentration of potassium (K2O) is the highest in both sample solutions. The concentration of potassium (K2O) in both sample solutions is the highest compared to other major elements (N, P2O5). This is consistent with the results of other known ash studies [33]. The concentration of potassium (K2O) in the aqueous solutions of DF1 and DF2 frass ash is 21.30 ± 0.12% and 10.56 ± 0.20%, respectively. Frass ash, which is produced by burning insect excrement, is characterized by a high concentration of macronutrients (especially nitrogen, phosphorus and potassium) and retains some useful micronutrients; therefore, it is considered a promising raw material for fertilizer production. The use of other organic waste, such as wood or biomass ash, is a common practice in agriculture [81]. According to sources [82,83], wood ash does not contain nitrogen (N), but it contains significant amounts of phosphorus (P) and potassium (K); therefore, NPK ratios in the context of cultivation are often indicated as 0-1-3 or 0-1.5-7. These results show that not only the waste generated after insect farming, but even their ashes are valuable and can be used as a fertilizing product.

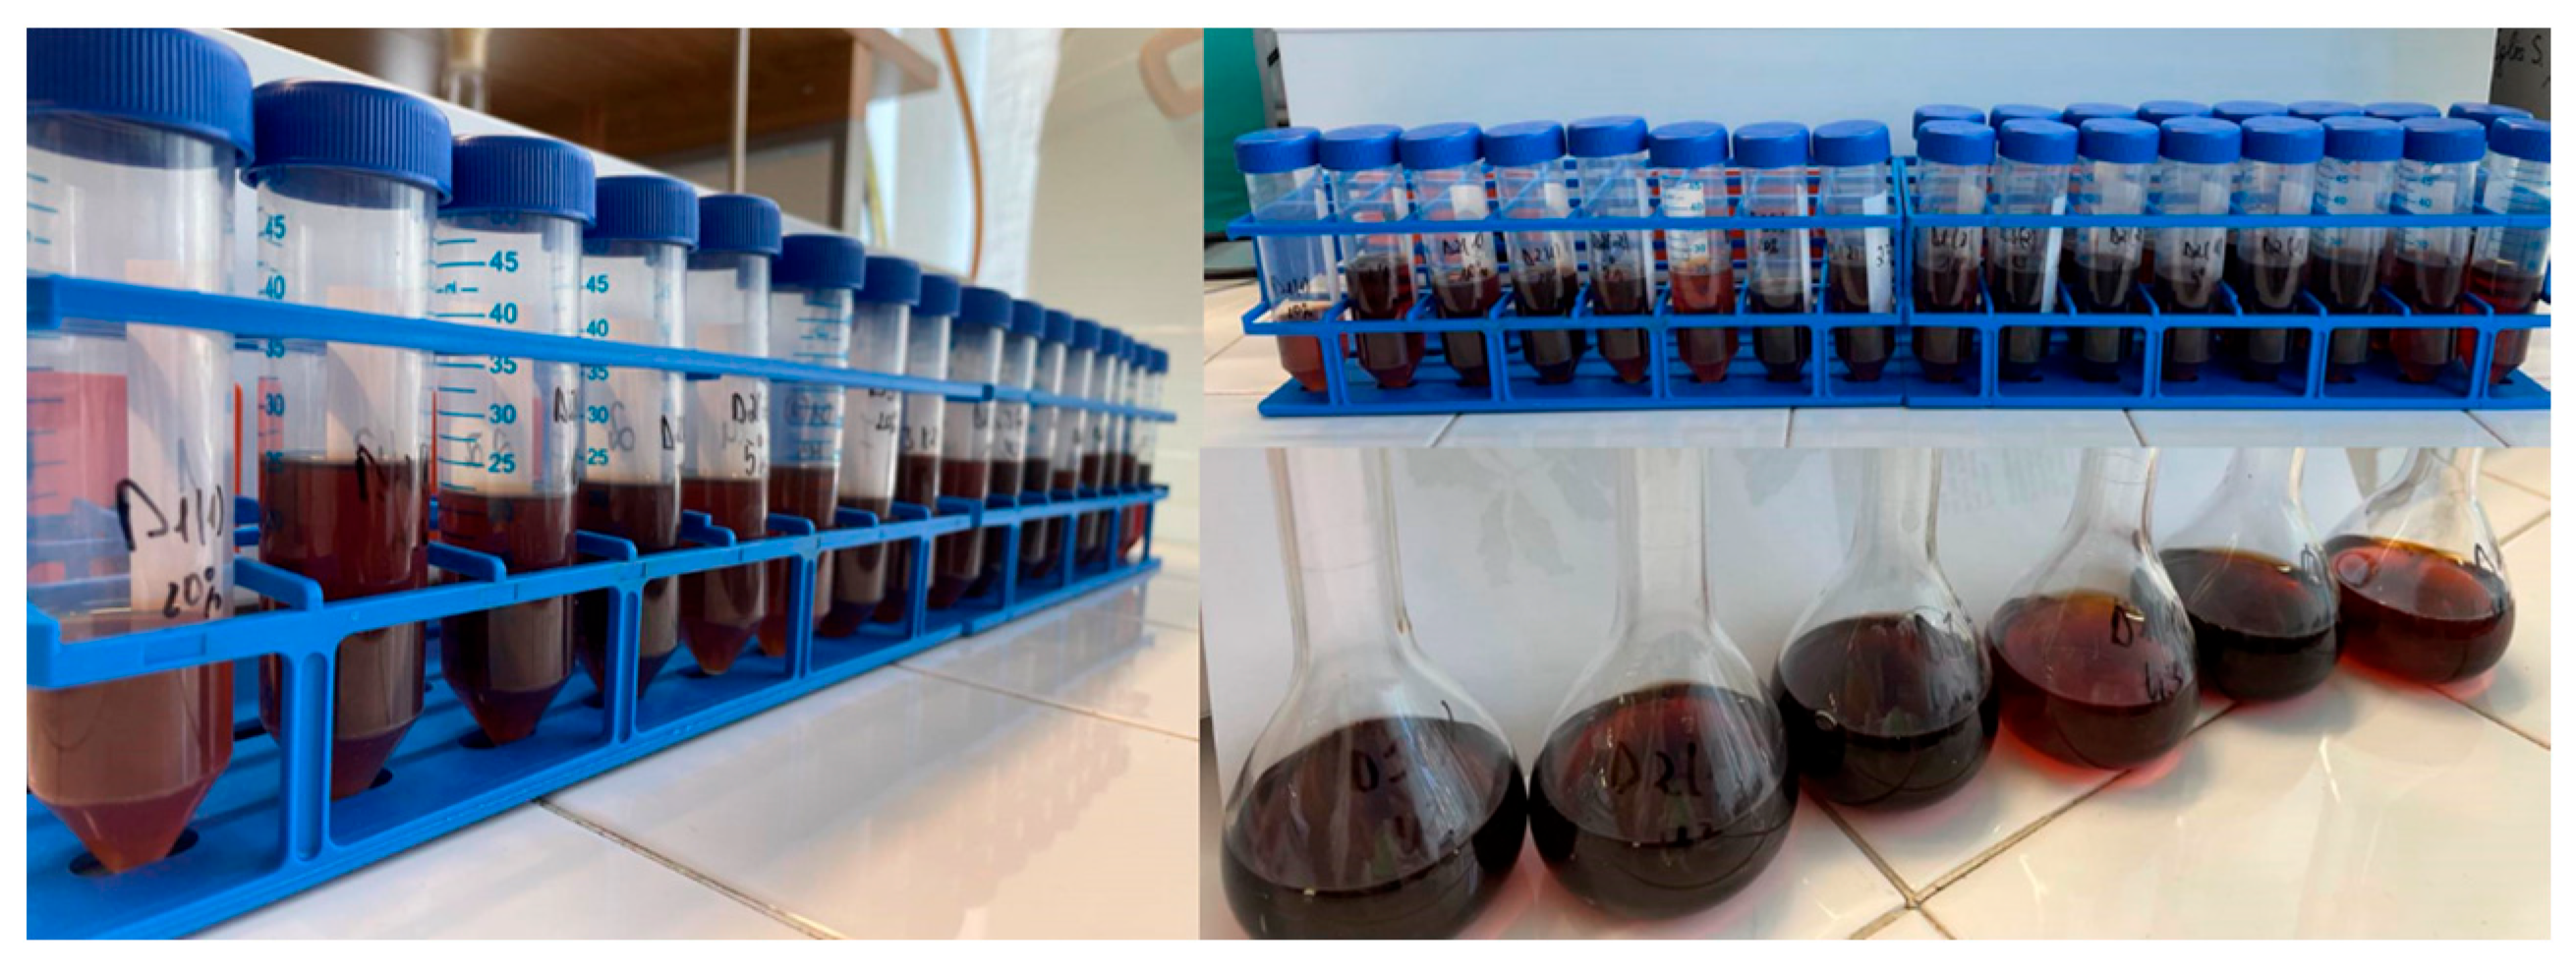
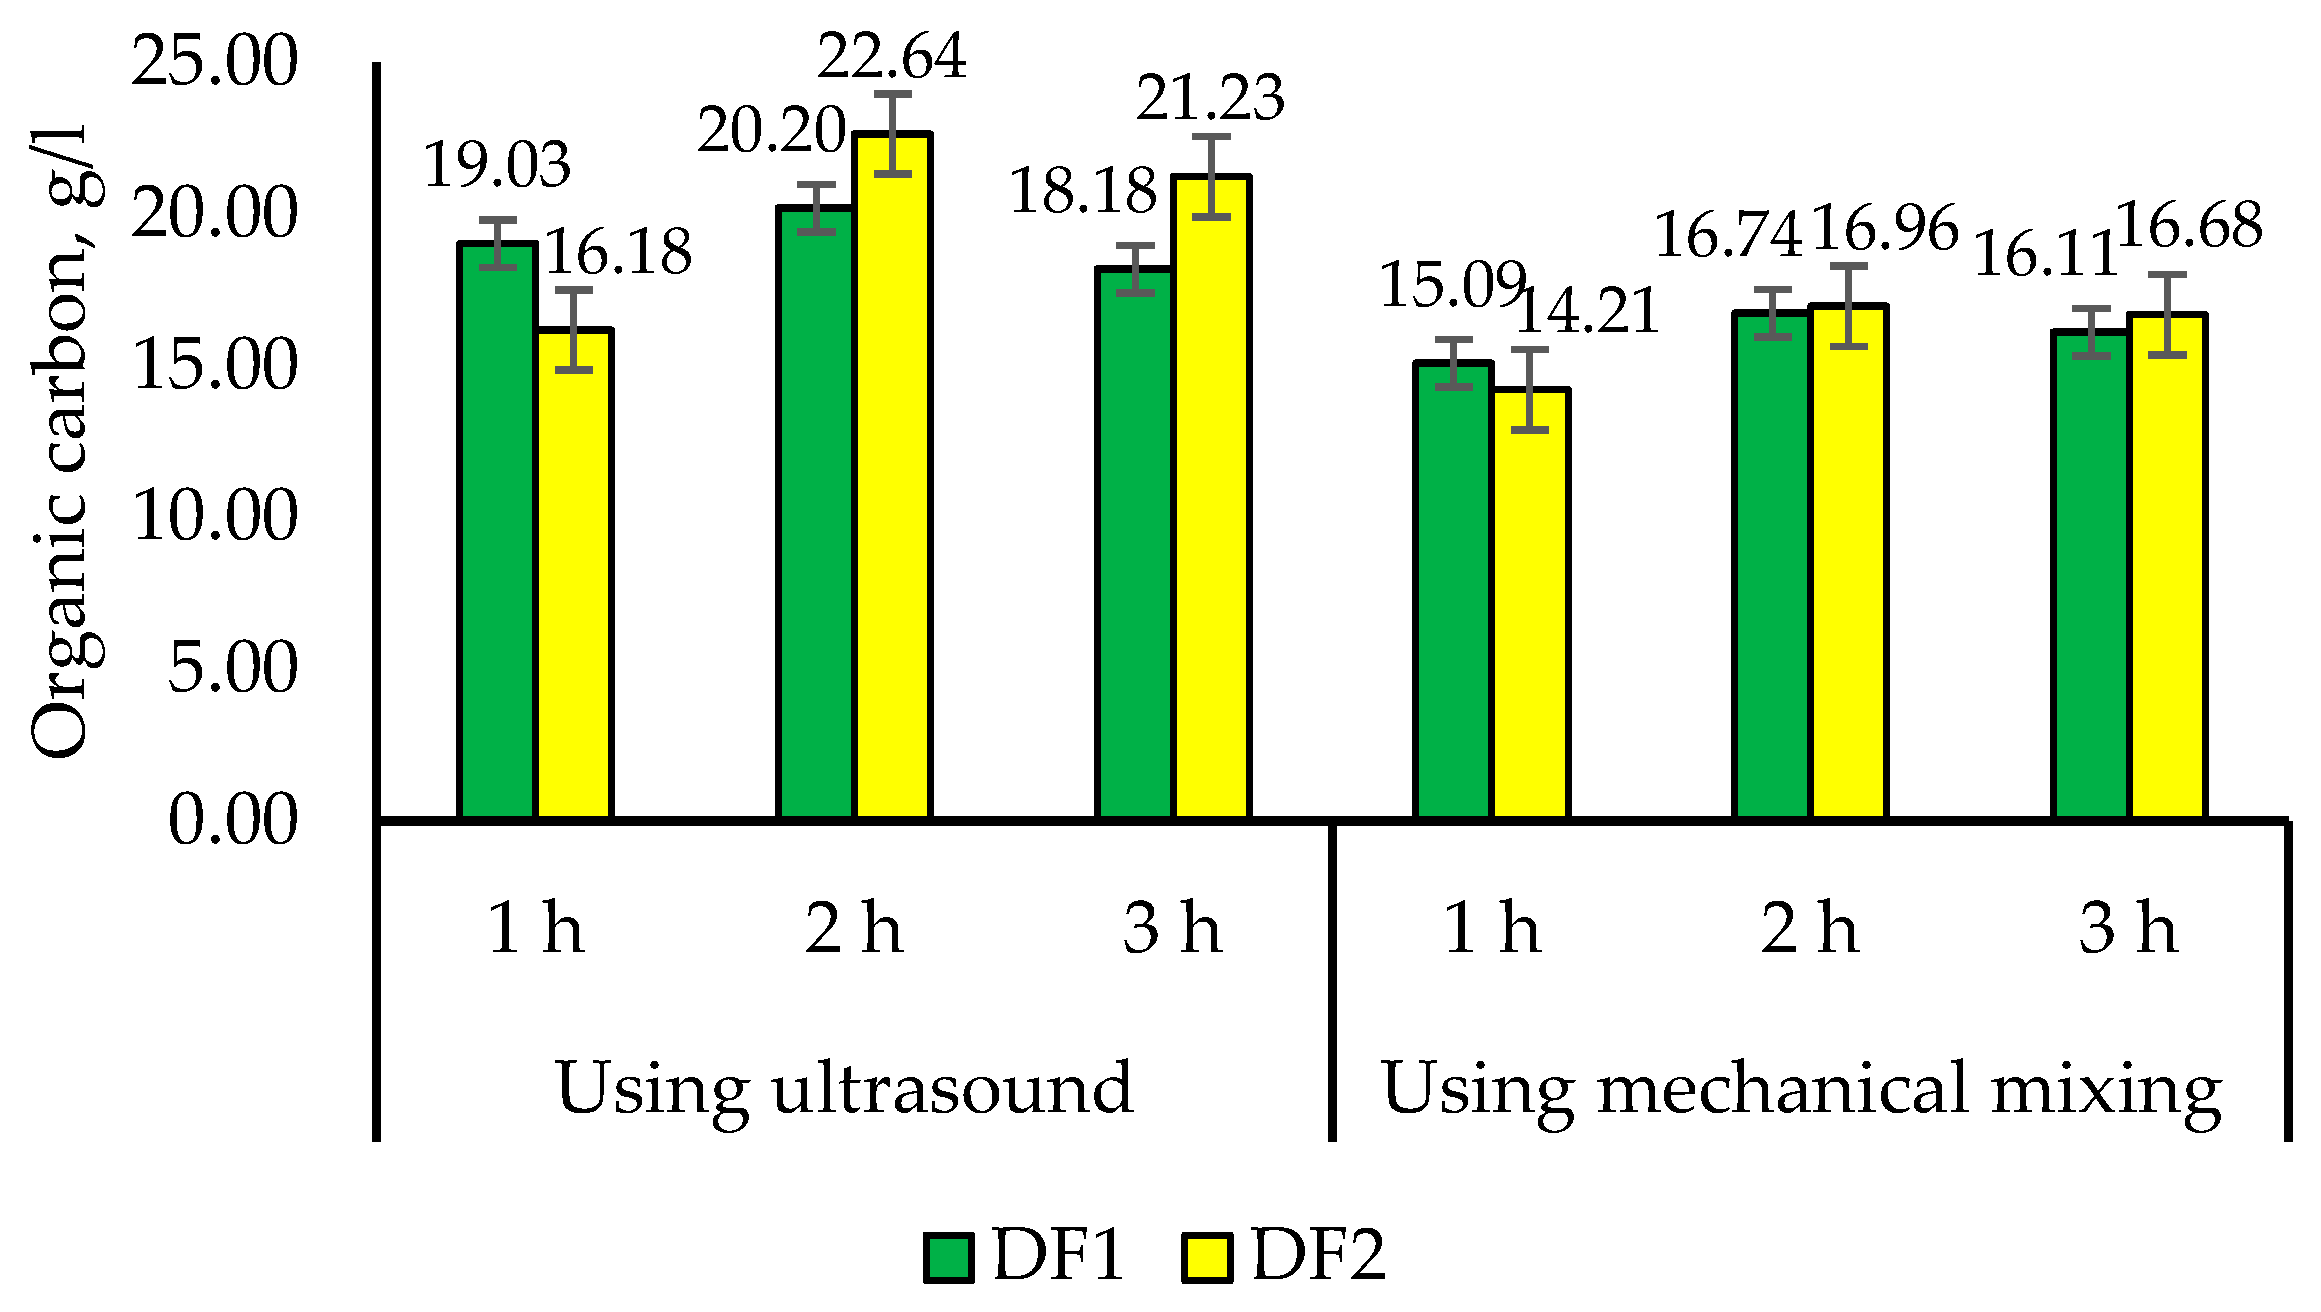
3.3. Preparation of Frass Extracts and Their Properties

The results of the analysis of frass samples, as well as the data published by other researchers on the composition and valuable properties of frass, constitute a reasonable assumption for the use of frass in crop production. There are a lot of scientific experimental works on the direct use of frass, but there is practically no data on the processing of frass in the production of various fertilizer products. Therefore, in our work, studies were conducted on the production of frass extracts and their suitability for the production of liquid fertilizers. Since frass contains a high concentration of carbon, it was attempted to prepare extracts and evaluate the carbon concentration in them. Such carbon concentrates can be used as plant fertilizers and to improve the soil. Around the world, solutions of humic substances are used to compensate for the lack of carbon, so our study would be an alternative to the processing of lignite or peat [84].
Frass experiments were conducted under laboratory conditions to investigate the possibility of extracting plant nutrients from frass using different solvents. Samples of aqueous solutions and extracts of frass in acidic and alkaline (KOH and SPP (sodium pyrophosphate)) media were prepared under different conditions and with different reagent ratios and for different experimental durations. This study and the comparison of extraction methods, i.e., traditional alkaline extraction and ultrasonic alkaline extraction methods, were based on the described studies on the extraction of humic substances. In this work, the researchers found that ultrasound had a positive effect on the efficiency [85].
It was found that the highest carbon concentration in the samples was when a 15% KOH solution was used for extraction. Therefore, this solution was chosen for further analysis. Extracts (Figure 7) were prepared under different conditions using an ultrasonic bath (1 h, 2 h and 3 h) at 35 °C and mechanical stirring (1 h, 2 h and 3 h) at room temperature (24 °C).
After preparing the extracts of frass samples DF1 and DF2, the total carbon concentration in the extracts was determined. All total organic carbon (TOC) analyses were performed by using TOC analyzer (TOC-L, Shimadzu, Japan) following the LST EN 1484:2002 (EN 1484:1997) standard. The samples were analyzed immediately after sampling, ensuring high reliability of the results. The obtained results are presented in Figure 8.
Using ultrasound, the extraction of organic carbon from both samples becomes more efficient over time. The highest organic carbon content was determined after 2 h of ultrasonic extraction: DF2—22.64 ± 1.16 g/L, and DF1—20.20 ± 0.61 g/L. The results obtained show that the carbon content in the DF2 sample is higher than that of DF1 throughout the extraction time. When mechanically stirred, the organic carbon content in the samples is significantly lower than when using ultrasound. The highest carbon content when stirred mechanically is about 16.96 ± 0.51 g/L (DF2, 2 h), which is significantly lower than that of the ultrasonically treated samples. In general, the use of ultrasonic stirring for extraction is a much more efficient solution. After extraction, the solutions obtained can be used immediately as suspensions, or additionally filtered, separating the sediment residue.
For the study of properties, the samples obtained in the experiment were filtered through a dense paper filter. The physical properties (pH, density, viscosity, crystallization temperature) of samples of frass extracts were analyzed, and the results are presented in Table 4.
The results of the characterization of the extracts presented in Table 4 show that the physical properties of the extracts prepared under different conditions from different samples are similar, the pH varies from 13.10 to 13.40, as this is determined by the nature of the extracting agent, and these pH differences are not significant. The density is from 1.140 g/cm3 to 1.148 g/cm3, and in all cases the values are very close. Only by comparing the viscosity values a clear difference can be observed. The kinematic viscosity of the solutions obtained using ultrasound is higher (from 3.290 ± 0.10 mm2/s to 3.320 ± 0.08 mm2/s) than that of the same solutions obtained by mechanical stirring (from 2.512 ± 0.21 mm2/s to 2.621 ± 0.31 mm2/s).
Fourier transform infrared spectroscopy (FT–IR) of frass extracts prepared under different conditions was performed to further analyze the frass extracts.
The obtained FT–IR analysis results for samples obtained after 2 h of extraction are presented in Figure 9. Comparing the spectra of frass extract samples DF1 and DF2 prepared by mechanical stirring for 2 h (Figure 9a), it can be observed that the broadest and most intense peaks in both samples coincide. The broad peak at 3300 cm−1 indicates O–H (hydroxyl group) or N–H (amino) vibrations. The peak at 1700 cm−1 corresponds to the characteristic C=O (carboxyl, ketone or aldehyde) stretching vibration, and the peak at 1200–1000 cm−1 is characteristic of the C–O functional group.
A comparison of the DF1 and DF2 frass extract sample spectra, prepared using ultrasound for 2 h, shows that the broadest and most intense peaks also coincide in both samples. The results are presented in Figure 9b. The broad peaks around 3300 cm⁻1 also indicate O–H (hydroxyl group) or N–H (amine) vibrations. The peaks at 1640 cm⁻1 correspond to the characteristic C=O (carboxylic acids, ketones, or aldehydes) stretching vibration, while the peaks near 1400 cm⁻1 are typical of the C–O functional group. The general nature of the FT–IR spectra remains similar in all cases, with shifts in the absorption peaks observed in the 1370–1400 cm−1 region, which are attributed to the OH group. These results suggest that the composition of compounds in the extracts does not depend on the method of mixing.
After preparation these extracts are stored under normal environmental conditions, their properties do not change. Such prepared extracts, rich in soluble carbon, can be used as liquid soil improvers, mixed with other liquid fertilizers. Such product is appropriate to expand the range of fertilizer products and at the same time it meets the principles of the circular economy.

4. Conclusions

The residues (frass) of Tenebrio molitor insects cultivated at a Lithuanian company (UAB “Divaks”) were investigated. It was determined that the residues remaining after insect rearing contain essential nutrients necessary for plant growth. The concentrations of the main nutrients were as follows: nitrogen (N) ranged from 3.25 ± 0.32% to 3.87 ± 0.21%; phosphorus pentoxide (P2O5) from 2.06 ± 0.21% to 2.74 ± 0.45%; and potassium oxide (K2O) from 2.33 ± 0.19% to 2.60 ± 0.09%. The frass also contains secondary nutrients such as calcium (Ca), magnesium (Mg), sodium (Na), and sulfur (S). Among the micronutrients, iron (Fe) and cobalt (Co) were present in significant concentrations. The determined concentrations of heavy metals did not exceed permissible limits.
Under laboratory conditions, alkaline extracts of the frass were prepared, and it was found that the extraction process was more efficient when ultrasound was applied. The total organic carbon concentration in the extracts reached between 20.20 ± 0.61 g/L and 22.64 ± 1.16 g/L, after 2 h.
These extracts remain stable for more than 6 months. Such prepared extracts rich in soluble carbon can be used as liquid soil improvers, mixed with other liquid fertilizers. Such product allows us to expand the range of fertilizer products and at the same time complies with the principles of the circular economy.

Author Contributions

Conceptualization, G.G. and R.P.; methodology, G.G.; software, G.G.; validation, G.G. and R.P.; formal analysis, G.G.; investigation, G.G.; resources, G.G. and R.P.; data curation, G.G.; writing—original draft preparation, G.G.; writing—review and editing, G.G. and R.P.; visualization, G.G.; supervision, R.P. All authors have read and agreed to the published version of the manuscript.

Funding

This research received no external funding.

Institutional Review Board Statement

Not applicable.

Informed Consent Statement

Not applicable.

Data Availability Statement

The original contributions presented in the study are included in the article; further inquiries can be directed to the corresponding author.

Conflicts of Interest

The authors declare no conflicts of interest; in the collection, analyses, or interpretation of data, in the writing of the manuscript, or in the decision to publish the results.

References

  1. European Commission. Communication from the Commission to the European Parliament, the Council, the European Economic and Social Committee and the Committee of the Regions; European Commission: Brussels, Belgium, 2020.
  2. Chojnacka, K.; Moustakas, K.; Witek-Krowiak, A. Bio-based fertilizers: A practical approach towards circular economy. Bioresour. Technol. 2020, 295, 122223. [Google Scholar] [CrossRef] [PubMed]
  3. Yadav, S.; Malik, K.; Moore, J.M.; Kamboj, B.R.; Malik, S.; Malik, V.K.; Arya, S.; Singh, K.; Mahanta, S.; Bishnoi, D.K. Valorisation of agri-food waste for bioactive compounds: Recent trends and future sustainable challenges. Molecules 2024, 29, 2055. [Google Scholar] [CrossRef]
  4. Leni, G.; Caligiani, A.; Sforza, S. Bioconversion of agri-food waste and by-products through insects: A new valorization opportunity. In Valorization of Agri-Food Wastes and By-Products; Academic Press: Cambridge, MA, USA, 2021; pp. 809–828. [Google Scholar]
  5. Errico, S.; Spagnoletta, A.; Verardi, A.; Moliterni, S.; Dimatteo, S.; Sangiorgio, P. Tenebrio molitor as a source of interesting natural compounds, their recovery processes, biological effects, and safety aspects. Compr. Rev. Food Sci. Food Saf. 2022, 21, 148–197. [Google Scholar] [CrossRef]
  6. Liceaga, A.M. Edible insects, a valuable protein source from ancient to modern times. Adv. Food Nutr. Res. 2022, 101, 129–152. [Google Scholar] [PubMed]
  7. Tang, C.; Yang, D.; Liao, H.; Sun, H.; Liu, C.; Wei, L.; Li, F. Edible insects as a food source: A review. Food Prod. Process. Nutr. 2019, 1, 8. [Google Scholar] [CrossRef]
  8. Meyer-Rochow, V.B.; Jung, C. Insects used as food and feed: Isn’t that what we all need? Foods 2020, 9, 1003. [Google Scholar] [CrossRef] [PubMed]
  9. Van Huis, A. Insects as food and feed, a new emerging agricultural sector: A review. J. Insects Food Feed 2020, 6, 27–44. [Google Scholar] [CrossRef]
  10. Grand View Research. Edible Insects Market Size, Share & Trends Analysis Report by Product (Beetles, Caterpillar, Cricket), by Application (Powder, Protein Bars), by Region (North America, Europe, Asia Pacific, Latin America, MEA), and Segment Forecasts, 2025–2030; Grand View Research: San Francisco, CA, USA, 2024. [Google Scholar]
  11. Research and Markets. Insect Protein Market by Application (Food & Beverages, Animal Nutrition, Pharmaceutical & Cosmetics), Insect Type (Cricket, Grasshoppers, Ants, Mealworms, Black Soldier Flies, and Others), Distribution Channel and Region-Global Forecast to 2027. 2022. Available online: https://www.researchandmarkets.com/reports/5651252/insect-protein-market-by-insect-type-cricket?srsltid=AfmBOoqVWhSur86voGS0yu_7DSAoBhb1AYTmXaFzrT2hXxiJB6btkA0j (accessed on 6 May 2025).
  12. European Commission. Commission Regulation (EU) 2021/1372 of 17 August 2021 Amending Annex IV to Regulation (EC) No 999/2001 of the European Parliament and of the Council as Regards the Prohibition to Feed Non-Ruminant Farmed Animals, Other than Fur Animals, with Protein Derived from Animals (Text with EEA Relevance). Off. J. Eur. Union 2021, 1–10. [Google Scholar]
  13. European Food Safety Authority (EFSA). Nutrition, Novel Foods and Food Allergens (NDA) Panel. Available online: https://www.efsa.europa.eu/en/science/scientific-committee-and-panels/nda (accessed on 6 May 2025).
  14. Adamaki-Sotiraki, C.; Rumbos, C.I.; Athanassiou, C.G. From a stored-product pest to a promising protein source: A U-turn of human perspective for the yellow mealworm Tenebrio molitor. J. Pest Sci. 2025, 98, 113–129. [Google Scholar] [CrossRef]
  15. Moruzzo, R.; Riccioli, F.; Espinosa Diaz, S.; Secci, C.; Poli, G.; Mancini, S. Mealworm (Tenebrio molitor): Potential and challenges to promote circular economy. Animals 2021, 11, 2568. [Google Scholar] [CrossRef]
  16. Nava, A.L.; Higareda, T.E.; Barreto, C.; Rodríguez, R.; Márquez, I.; Palacios, M.L. Circular economy approach for mealworm industrial production for human consumption. IOP Conf. Ser. Earth Environ. Sci. 2020, 463, 012087. [Google Scholar] [CrossRef]
  17. Vrontaki, M.; Adamaki-Sotiraki, C.; Rumbos, C.I.; Anastasiadis, A.; Athanassiou, C.G. Valorization of local agricultural by-products as nutritional substrates for Tenebrio molitor larvae: A sustainable approach to alternative protein production. Environ. Sci. Pollut. Res. 2024, 31, 35760–35768. [Google Scholar] [CrossRef] [PubMed]
  18. Kee, P.E.; Cheng, Y.S.; Chang, J.S.; Yim, H.S.; Tan, J.C.Y.; Lam, S.S.; Lan, J.C.W.; Ng, H.S.; Khoo, K.S. Insect biorefinery: A circular economy concept for biowaste conversion to value-added products. Environ. Res. 2023, 221, 115284. [Google Scholar] [CrossRef] [PubMed]
  19. Lopes, I.G.; Yong, J.W.; Lalander, C. Frass derived from black soldier fly larvae treatment of biodegradable wastes. A critical review and future perspectives. Waste Manag. 2022, 142, 65–76. [Google Scholar] [CrossRef]
  20. Yu, Z.; Xie, C.; Zhang, Z.; Huang, Z.; Zhou, J.; Wang, C. Microbial fermentation and black soldier fly feeding to enhance maize straw degradation. Chemosphere 2024, 353, 141498. [Google Scholar] [CrossRef]
  21. He, L.; Zhang, Y.; Ding, M.Q.; Li, M.X.; Ding, J.; Bai, S.W.; Wu, Q.L.; Zhao, L.; Cao, G.L.; Ren, N.Q.; et al. Sustainable strategy for lignocellulosic crop wastes reduction by Tenebrio molitor Linnaeus (mealworm) and potential use of mealworm frass as a fertilizer. J. Clean. Prod. 2021, 325, 129301. [Google Scholar] [CrossRef]
  22. Katchali, M.; Senagi, K.; Richard, E.; Beesigamukama, D.; Tanga, C.M.; Athanasiou, G.; Zahariadis, T.; Casciano, D.; Lazarou, A.; Tonnang, H.E.Z. Unveiling Environmental Influences on Sustainable Fertilizer Production through Insect Farming. Sustainability 2024, 16, 3746. [Google Scholar] [CrossRef]
  23. Smitt, E.; de Vries, W. Potential benefits of using Hermetia illucens frass as a soil amendment on food production and for environmental impact reduction. Curr. Opin. Green Sustain. Chem. 2020, 25, 100335. [Google Scholar] [CrossRef]
  24. Kotsou, K.; Chatzimitakos, T.; Athanasiadis, V.; Bozinou, E.; Lalas, S.I. Exploiting Agri-Food Waste as Feed for Tenebrio molitor Larvae Rearing: A Review. Foods 2024, 13, 1027. [Google Scholar] [CrossRef]
  25. Siddiqui, S.A.; Harahap, I.A.; Osei-Owusu, J.; Saikia, T.; Wu, Y.S.; Fernando, I.; Perestrelo, R.; Câmara, J.S. Bioconversion of organic waste by insects–A comprehensive review. Process Saf. Environ. Prot. 2024, 187, 1–25. [Google Scholar] [CrossRef]
  26. Kim, S.Y.; Chung, T.H.; Kim, S.H.; Song, S.; Kim, N. Recycling agricultural wastes as feed for mealworm (Tenebrio molitor). Korean J. Appl. Entomol. 2014, 53, 365–371. [Google Scholar] [CrossRef]
  27. Wu, Q.; Tao, H.; Wong, M.H. Feeding and metabolism effects of three common microplastics on Tenebrio molitor L. Environ. Geochem. Health 2019, 41, 17–26. [Google Scholar] [CrossRef] [PubMed]
  28. Peng, B.Y.; Chen, Z.; Chen, J.; Yu, H.; Zhou, X.; Criddle, C.S.; Wu, W.M.; Zhang, Y. Biodegradation of polyvinyl chloride (PVC) in Tenebrio molitor (Coleoptera: Tenebrionidae) larvae. Environ. Int. 2020, 145, 106106. [Google Scholar] [CrossRef] [PubMed]
  29. Wang, X.; Du, R.; Henriquez, F.N.; Liu, H.; Chan, S.Y.; Leong, C.M.; Lui, M.Y. Enhancing Plastic Decomposition in Mealworms (Tenebrio molitor): The Role of Nutritional Amino Acids and Water. Adv. Energy Sustain. Res. 2025, 6, 2400378. [Google Scholar] [CrossRef]
  30. Koyunoğlu, C. Biofuel production utilizing Tenebrio molitor: A sustainable approach for organic waste management. Int. J. Thermofluids 2024, 22, 100603. [Google Scholar] [CrossRef]
  31. Hénault-Ethier, L.; Quinche, M.; Reid, B.; Hotte, N.; Fortin, A.; Normandin, É.; Renaud, G.L.R.; Zadeh, A.R.; Deschamps, M.H.; Vandenberg, G. Opportunities and challenges in upcycling agri-food byproducts to generate insect manure (frass): A literature review. Waste Manag. 2024, 176, 169–191. [Google Scholar] [CrossRef] [PubMed]
  32. Amorim, H.C.; Ashworth, A.J.; Arsi, K.; Rojas, M.G.; Morales-Ramos, J.A.; Donoghue, A.; Robinson, K. Insect frass composition and potential use as an organic fertilizer in circular economies. J. Econ. Entomol. 2024, 117, 1261–1268. [Google Scholar] [CrossRef]
  33. Houben, D.; Daoulas, G.; Faucon, M.P.; Dulaurent, A.M. Potential use of mealworm frass as a fertilizer: Impact on crop growth and soil properties. Sci. Rep. 2020, 10, 4659. [Google Scholar] [CrossRef]
  34. Beesigamukama, D.; Subramanian, S.; Tanga, C.M. Nutrient quality and maturity status of frass fertilizer from nine edible insects. Sci. Rep. 2022, 12, 7182. [Google Scholar] [CrossRef]
  35. Watson, C.; Schlösser, C.; Vögerl, J.; Wichern, F. Excellent excrement? Frass impacts on a soil’s microbial community, processes and metal bioavailability. Appl. Soil Ecol. 2021, 168, 104110. [Google Scholar] [CrossRef]
  36. Barragán-Fonseca, K.Y.; Nurfikari, A.; Van De Zande, E.M.; Wantulla, M.; Van Loon, J.J.; De Boer, W.; Dicke, M. Insect frass and exuviae to promote plant growth and health. Trends Plant Sci. 2022, 27, 646–654. [Google Scholar] [CrossRef] [PubMed]
  37. Nyanzira, A.; Machona, O.; Matongorere, M.; Chidzwondo, F.; Mangoyi, R. Analysis of frass excreted by Tenebrio molitor for use as fertilizer. Entomol. Appl. Sci. Lett. 2023, 10, 29–37. [Google Scholar] [CrossRef]
  38. Foscari, A.; Dalla Costa, L.; Tulli, F.; Uboni, C.; Fellet, G. Frass from Tenebrio molitor as alternative to NPK-mineral fertilization: Results from a germination test and pot experiment on sunflower. Ital. J. Agron. 2024, 19, 100010. [Google Scholar] [CrossRef]
  39. Houben, D.; Daoulas, G.; Dulaurent, A.M. Assessment of the short-term fertilizer potential of mealworm frass using a pot experiment. Front. Sustain. Food Syst. 2021, 5, 714596. [Google Scholar] [CrossRef]
  40. Poveda, J.; Jiménez-Gómez, A.; Saati-Santamaría, Z.; Usategui-Martín, R.; Rivas, R.; García-Fraile, P. Mealworm frass as a potential biofertilizer and abiotic stress tolerance-inductor in plants. Appl. Soil Ecol. 2019, 142, 110–122. [Google Scholar] [CrossRef]
  41. Khatami, N.; Guerrero, P.; Martín, P.; Quintela, E.; Ramos, V.; Saa, L.; Cortajarena, A.L.; Caba, K.D.L.; Camarero-Espinosa, S.; Abarrategi, A. Valorization of biological waste from insect-based food industry: Assessment of chitin and chitosan potential. Carbohydr. Polym. 2024, 324, 121529. [Google Scholar] [CrossRef]
  42. Weaver, D.K.; McFarlane, J.E.; Alli, I. Repellency of volatile fatty acids present in frass of larval yellow mealworms, Tenebrio molitor L. (Coleoptera: Tenebrionidae), to larval conspecifics. J. Chem. Ecol. 1990, 16, 585–593. [Google Scholar] [CrossRef]
  43. Urrutia, R.I.; Jesser, E.N.; Gutierrez, V.S.; Rodriguez, S.; Gumilar, F.; Murray, A.P.; Volpe, M.A.; Werdin-González, J.O. From waste to food and bioinsecticides: An innovative system integrating Tenebrio molitor bioconversion and pyrolysis bio-oil production. Chemosphere 2023, 340, 139847. [Google Scholar] [CrossRef]
  44. Shahrajabian, M.H.; Chaski, C.; Polyzos, N.; Tzortzakis, N.; Petropoulos, S.A. Sustainable agriculture systems in vegetable production using chitin and chitosan as plant biostimulants. Biomolecules 2021, 11, 819. [Google Scholar] [CrossRef]
  45. Gong, B.Q.; Wang, F.Z.; Li, J.F. Hide-and-seek: Chitin-triggered plant immunity and fungal counterstrategies. Trends Plant Sci. 2020, 25, 805–816. [Google Scholar] [CrossRef]
  46. Kim, H.B.; Lee, J.H.; Lee, Y.J.; Rho, J.S.; Lee, J.M.; Kim, S.H.; Park, J.H.; Seo, D.C. Adsorption characteristics and mechanism of Cd by mealworm frass. Appl. Biol. Chem. 2025, 68, 5. [Google Scholar] [CrossRef]
  47. Wedwitschka, H.; Gallegos Ibanez, D.; Jáquez, D.R. Biogas Production from Residues of Industrial Insect Protein Production from Black Soldier Fly Larvae Hermetia illucens (L.): An Evaluation of Different Insect Frass Samples. Processes 2023, 11, 362. [Google Scholar] [CrossRef]
  48. Omoregie, A.I.; Muda, K.; Steven, R.; Mustapha, M.; Ibrahim, H.U.; Ouahbi, T. Insect frass as a substrate to stimulate native ureolytic bacteria for microbial-induced carbonate precipitation in soil biocementation. Biomass Convers. Biorefinery 2024, 14, 25849–25872. [Google Scholar] [CrossRef]
  49. Hodge, S. Beetles Sale: Could Insect Farming Feed Us All Help Save Planet? Wētā 2022, 56, 1–12. [Google Scholar]
  50. Poveda, J. Insect frass in the development of sustainable agriculture. A review. Agron. Sustain. Dev. 2021, 41, 5. [Google Scholar] [CrossRef]
  51. Chavez, M.; Uchanski, M. Insect left-over substrate as plant fertiliser. J. Insects Food Feed 2021, 7, 683–694. [Google Scholar] [CrossRef]
  52. Van Huis, A.; Rumpold, B.A.; van der Fels-Klerx, H.J.; Tomberlin, J.K. Advancing edible insects as food and feed in a circular economy. J. Insects Food Feed 2021, 7, 935–948. [Google Scholar] [CrossRef]
  53. Hodge, S.; Conway, J. The effects of insect frass fertilizer and biochar on the shoot growth of chicory and plantain, two forage herbs commonly used in multispecies swards. Agronomy 2022, 12, 2459. [Google Scholar] [CrossRef]
  54. EN 1482-1:2007; Fertilizers and Liming Materials—Sampling and Sample Preparation—Part 1: Sampling. European Committee for Standardization (CEN): Bruxelles, Belgium, 2007. Available online: https://standards.iteh.ai/catalog/standards/cen/0b07d50f-496f-4e38-9765-b7687501d382/en-1482-1-2007 (accessed on 12 May 2025).
  55. EN 1482-2:2007; Fertilizers and Liming Materials—Sampling and Sample Preparation—Part 2: Sample Preparation. European Committee for Standardization (CEN): Bruxelles, Belgium, 2007. Available online: https://standards.iteh.ai/catalog/standards/cen/7721782c-cacf-4781-8b78-3b9c2df3d2cd/en-1482-2-2007 (accessed on 12 May 2025).
  56. Retsch GmbH. Sieving Methods of Sieve Analysis. Available online: https://www.retsch.com/applications/knowledge-base/sieve-analysis/ (accessed on 6 May 2025).
  57. LST EN 13040:2008; Soil Improvers and Growing Media—Sample Preparation for Chemical and Physical Tests, Determination of Dry Matter Content, Moisture Content and Laboratory Compacted Bulk Density. Lithuanian Standard: Vilnius, Lithuania, 2008.
  58. LST EN 13037:2012; Soil Improvers and Growing Media—Determination of pH. Lithuanian Standard: Vilnius, Lithuania, 2012.
  59. LST EN 13654-1:2002; Soil Improvers and Growing Media—Determination of Nitrogen. Part 1: Modified Kjeldahl Method. Lithuanian Standard: Vilnius, Lithuania, 2002.
  60. UR-Lex. Regulation (EC) No 2003/2003 of the European Parliament and of the Council of 13 October 2003 Relating to Fertilisers. Available online: https://eur-lex.europa.eu/legal-content/EN/TXT/?uri=CELEX%3A32003R2003 (accessed on 6 May 2025).
  61. LST EN 13039:2012; Soil Improvers and Growing Media—Determination of Organic Matter Content and Ash. Lithuanian Standard: Vilnius, Lithuania, 2012.
  62. EN 1484:1997; Water Analysis—Guidelines for the Determination of Total Organic Carbon (TOC) and Dissolved Organic Carbon (DOC). European Committee for Standardization (CEN): Brussels, Belgium, 1997.
  63. Lucideon. Scanning Electron Microscopy (SEM) with Energy Dispersive X-Ray Analysis (EDX) Testing Technique. Available online: https://www.lucideon.com/testing-characterisation/techniques/sem-edx (accessed on 6 May 2025).
  64. SAS Institute Inc. SAS/STAT® 9.3 User’s Guide; SAS Institute Inc.: Cary, NC, USA, 2011. [Google Scholar]
  65. National University. Statistics Resources. Available online: https://resources.nu.edu/statsresources/assumptions (accessed on 12 May 2025).
  66. Carpi, A. Introduction to Descriptive Statistics: Using Mean, Median, and Standard Deviation. Visionlearning. Available online: https://www.visionlearning.com/en/library/Chemistry/1/Introduction-to-Descriptive-Statistics/218 (accessed on 12 May 2025).
  67. Divaks. About Us. Available online: https://divaks.com/about-us/ (accessed on 6 May 2025).
  68. Luengnaruemitchai, A.; Anupapwisetkul, C. Surface morphology and cellulose structure of Napier grass pretreated with the ionic liquid 1-ethyl-3-methylimidazolium acetate combined with either water or dimethyl sulfoxide as a co-solvent under microwave irradiation. Biomass Convers. Biorefinery 2020, 10, 435–446. [Google Scholar] [CrossRef]
  69. Kumar, S.; Koh, J. Physiochemical, optical and biological activity of chitosan-chromone derivative for biomedical applications. Int. J. Mol. Sci. 2012, 13, 6102–6116. [Google Scholar] [CrossRef]
  70. Ju, X.; Bowden, M.; Brown, E.E.; Zhang, X. An improved X-ray diffraction method for cellulose crystallinity measurement. Carbohydr. Polym. 2015, 123, 476–481. [Google Scholar] [CrossRef] [PubMed]
  71. Jena, K.; Ananta, S.; Akthar, J.; Patnaik, A.; Das, S.; Singh, J.; Sathyanarayana, K.; Kar, P.K.; Das, B.K.; Hassan, M.A.; et al. Physical, biochemical and antimicrobial characterization of chitosan prepared from tasar silkworm pupae waste. Environ. Technol. Innov. 2023, 31, 103200. [Google Scholar] [CrossRef]
  72. Riseh, R.S.; Vazvani, M.G.; Vatankhah, M.; Kennedy, J.F. Chitin-induced disease resistance in plants: A review. Int. J. Biol. Macromol. 2024, 266, 131105. [Google Scholar]
  73. Hidangmayum, A.; Dwivedi, P.; Katiyar, D.; Hemantaranjan, A. Application of chitosan on plant responses with special reference to abiotic stress. Physiol. Mol. Biol. Plants 2019, 25, 313–326. [Google Scholar] [CrossRef] [PubMed]
  74. Akcay, C.; Yalcin, M. Morphological and chemical analysis of Hylotrupes bajulus (old house borer) larvae-damaged wood and its FTIR characterization. Cellulose 2021, 28, 1295–1310. [Google Scholar] [CrossRef]
  75. Zhu, P.; Gong, S.; Deng, M.; Xia, B.; Yang, Y.; Tang, J.; Qian, G.; Yu, F.; Goonetilleke, A.; Li, X. Biodegradation of waste refrigerator polyurethane by mealworms. Front. Environ. Sci. Eng. 2023, 17, 38. [Google Scholar] [CrossRef]
  76. ISO 10694:1995; Soil Quality—Determination of Organic and Total Carbon After Dry Combustion (Elementary Analysis). International Organization for Standardization (ISO): Geneva, Switzerland, 1995. Available online: https://www.iso.org/standard/18782.html (accessed on 6 May 2025).
  77. Soto-Herranz, M.; Sánchez-Báscones, M.; Antolín-Rodríguez, J.M.; Martín-Ramos, P. Reduction of ammonia emissions from laying hen manure in a closed composting process using gas-permeable membrane technology. Agronomy 2021, 11, 2384. [Google Scholar] [CrossRef]
  78. Li, X.; Guo, Z.; Ma, Y.; Leite, P.A.; Li, Z.; Wu, G.L. Incorporating Cattle Manure Improves Hydraulic Properties and Enhances Infiltration Rates of Low-Infiltrability Saline-Sodic Soils. Land Degrad. Dev. 2025, 36, 945–953. [Google Scholar] [CrossRef]
  79. Guo, X.X.; Liu, H.T.; Wu, S.B. Humic substances developed during organic waste composting: Formation mechanisms, structural properties, and agronomic functions. Sci. Total Environ. 2019, 662, 501–510. [Google Scholar] [CrossRef]
  80. EN 13039:2011; Soil Improvers and Growing Media—Determination of Organic Matter Content and Ash. European Committee for Standardization (CEN): Bruxelles, Belgium, 2011. Available online: https://standards.iteh.ai/catalog/standards/cen/825ecadd-2c72-4dc9-a38c-1e4bdeac857f/en-13039-2011 (accessed on 6 May 2025).
  81. Demeyer, A.; Nkana, J.V.; Verloo, M.G. Characteristics of wood ash and in-fluence on soil properties and nutrient uptake: An overview. Bioresour. Technol. 2001, 77, 287–295. [Google Scholar] [CrossRef]
  82. Moragues-Saitua, L.; Arias-González, A.; Blanco, F.; Benito-Carnero, G.; Gartzia-Bengoetxea, N. Effects of biochar and wood ash amendments in the soil-water-plant environment of two temperate forest plantations. Front. For. Glob. Change 2023, 5, 878217. [Google Scholar] [CrossRef]
  83. Kim, N.; Watmough, S.A.; Yan, N.D. Wood ash amendments as a potential solution to widespread calcium decline in eastern Canadian forests. Environ. Rev. 2022, 30, 485–500. [Google Scholar] [CrossRef]
  84. Pettit, R.E. Organic Matter, Humus, Humate, Humic Acid, Fulvic Acid and Humin: Their Importance in Soil Fertility and Plant Health. Available online: https://humates.com/wp-content/uploads/2020/04/ORGANICMATTERPettit.pdf (accessed on 6 May 2025).
  85. Nieweś, D.; Huculak-Mączka, M.; Braun-Giwerska, M.; Marecka, K.; Tyc, A.; Biegun, M.; Hoffmann, K.; Hoffmann, J. Ultrasound-Assisted Extraction of Humic Substances from Peat: Assessment of Process Efficiency and Products’ Quality. Molecules 2022, 27, 3413. [Google Scholar] [CrossRef] [PubMed]
Figure 1. Benefits of used frass for plants.
Sustainability 17 05710 g001
Figure 2. Frass samples: (a)—DF1: 1—frass sample before preparation for analysis, 2—ground frass sample; (b)—DF2: 1—frass sample before preparation for analysis, 2—ground frass sample.
Sustainability 17 05710 g002
Figure 3. XRDA patterns of frass samples DF1 and DF2.
Sustainability 17 05710 g003
Figure 4. FT–IR spectra of frass samples DF1 and DF2.
Sustainability 17 05710 g004
Figure 5. EDS maps of DF1: (a)—SEM image; (b)—EDS map; EDS spectrum of DF1; (c)—carbon concentration; (d)—oxygen concentration; (e)—nitrogen concentration.
Sustainability 17 05710 g005
Figure 6. EDS maps of DF2: (a)—SEM image; (b)—EDS map; EDS spectrum of DF1; (c)—carbon concentration; (d)—oxygen concentration; (e)—nitrogen concentration.
Sustainability 17 05710 g006
Figure 7. Alkaline extracts of frass.
Sustainability 17 05710 g007
Figure 8. Organic carbon concentration (in graphs error bar show confidence intervals).
Sustainability 17 05710 g008
Figure 9. FT–IR spectra of frass extracts of samples DF1, DF2: (a)—Frass extracts prepared using mechanical mixing for 2 h, (b)—Frass extracts prepared using ultrasound for 2 h.
Sustainability 17 05710 g009
Table 1. Physical properties of the frass samples.
Sample *10% Solution pHMoisture, %Bulk Density, kg/m3Fractional Composition, %
>1 mm0.5–1 mm0.2–0.5 mm<0.2 mm
DF15.85 ± 0.057.41 ± 0.51524.89 ± 0.220.05 ± 0.831.98 ± 0.4393.36 ± 1.014.61 ± 0.69
DF25.45 ± 0.078.76 ± 0.32393.81 ± 0.350.01 ± 0.511.95 ± 0.9395.75 ± 0.862.29 ± 0.72
* Data represent the means ± SD of three experiments, n = 3.
Table 2. Chemical composition of frass samples.
Sample *Primary and Secondary Macronutrients, %
NP2O5K2OCaOMgONaS
DF13.25 ± 0.322.06 ± 0.212.33 ± 0.190.69 ± 0.221.5 ± 0.100.38 ± 0.139.25 ± 0.31
DF23.87 ± 0.212.74 ± 0.452.60 ± 0.090.91 ± 0.201.24 ± 0.198.99 ± 0.04
SampleMicroelements, mg/kg
ZnMnCuFeCoMo
DF1615.63 ± 0.557.23 ± 0.25
DF2284.05 ± 0.172.47 ± 0.12
SampleHeavy metals, mg/kg
CdPbHgNiCrAs
DF111.23 ± 0.11<0.022.50 ± 0.3130.69 ± 0.08<0.09
DF218.03 ± 0.09<0.024.20 ± 0.2232.46 ± 0.19<0.09
* Data represent the means ± SD of 3 experiments, n = 3.
Table 3. The Chemical Composition of the Frass ash.
Sample *N, %P2O5, %K2O, %
H2O 1HCl 2H2OHClH2OHCl
DF10.15 ± 0.090.42 ± 0.515.52 ± 0.5130.50 ± 0.6221.30 ± 0.1231.52 ± 0.22
DF20.21 ± 0.510.62 ± 0.512.28 ± 0.5121.29 ± 0.4310.56 ± 0.2018.98 ± 0.47
* Data represent the means ± SD of 3 experiments, n = 3; 1 aqueous solutions; 2 acidic solutions.
Table 4. Physical properties of the frass extract samples.
Sample *ConditionspHDensity, g/cm3Kinematic Viscosity, mm2/s
DF1Using ultrasound1 h13.20 ± 0.091.145 ± 0.053.301 ± 0.11
2 h13.15 ± 0.071.148 ± 0.073.320 ± 0.08
3 h13.20 ± 0.101.147 ± 0.103.318 ± 0.12
Using mechanical mixing1 h13.15 ± 0.111.143 ± 0.053.311 ± 0.15
2 h13.18 ± 0.051.147 ± 0.083.290 ± 0.10
3 h13.20 ± 0.041.144 ± 0.043.305 ± 0.09
DF2Using ultrasound1 h13.10 ± 0.081.142 ± 0.102.621 ± 0.31
2 h13.20 ± 0.041.141 ± 0.092.599 ± 0.25
3 h13.22 ± 0.091.145 ± 0.052.579 ± 0.20
Using mechanical mixing1 h13.10 ± 0.121.140 ± 0.022.512 ± 0.21
2 h13.40 ± 0.081.142 ± 0.052.522 ± 0.11
3 h13.30 ± 0.051.144 ± 0.022.519 ± 0.19
* Data represent the means ± SD of three experiments, n = 3.
Disclaimer/Publisher’s Note: The statements, opinions and data contained in all publications are solely those of the individual author(s) and contributor(s) and not of MDPI and/or the editor(s). MDPI and/or the editor(s) disclaim responsibility for any injury to people or property resulting from any ideas, methods, instructions or products referred to in the content.

