
Impact Assessment and Product Life Cycle Analysis of Different Jersey Fabrics Using Conventional, Post-Industrial, and Post-Consumer Recycled Cotton Fibers

Abstract
1. Introduction
2. Background
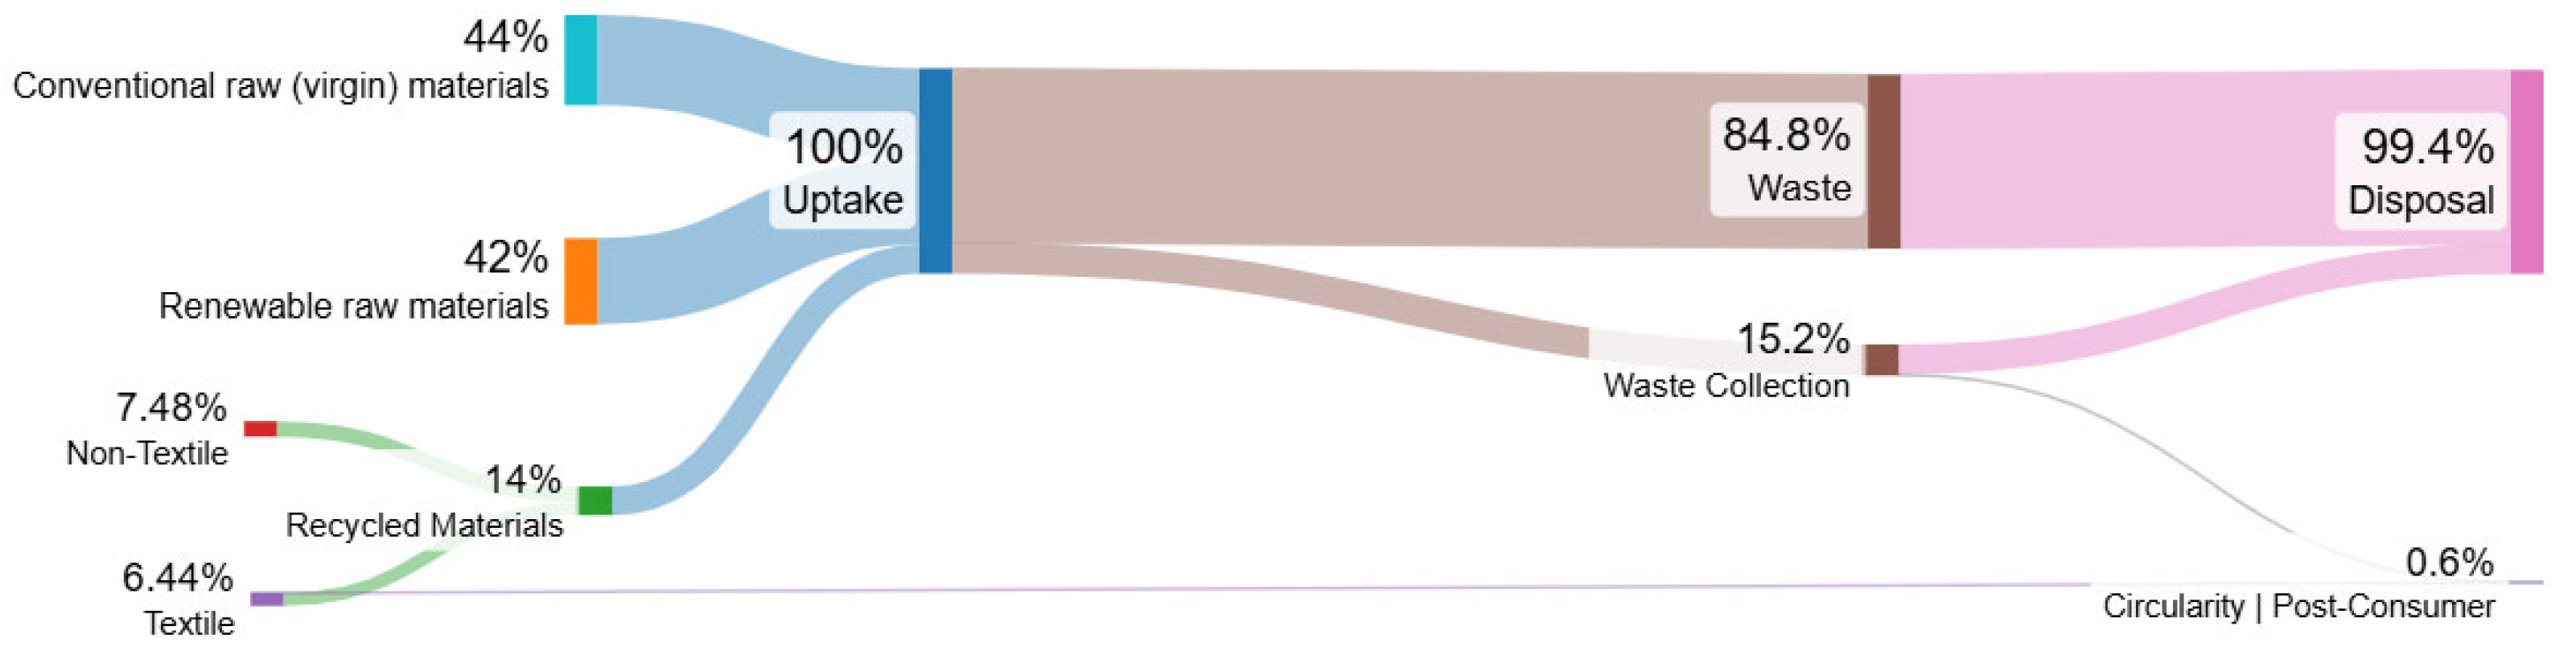
2.1. Circular Economy on Textile Industry
2.2. Innovative Technologies
2.3. Impact Measurement: Life Cycle Assessment
- Opportunities for improving the environmental performance of products at different stages of the life cycle;
- Definition of priorities for optimizing products or processes—can help with decision-making and drive the adoption of more sustainable and circular practices in the textile industry;
- Definition of relevant environmental performance indicators, including measurement methods;
- Marketing—the only way to convince the industry to opt for more sustainable raw materials and processes, with the presentation of specific and real data on the costs and benefits of each product and/or process.
3. Methodology
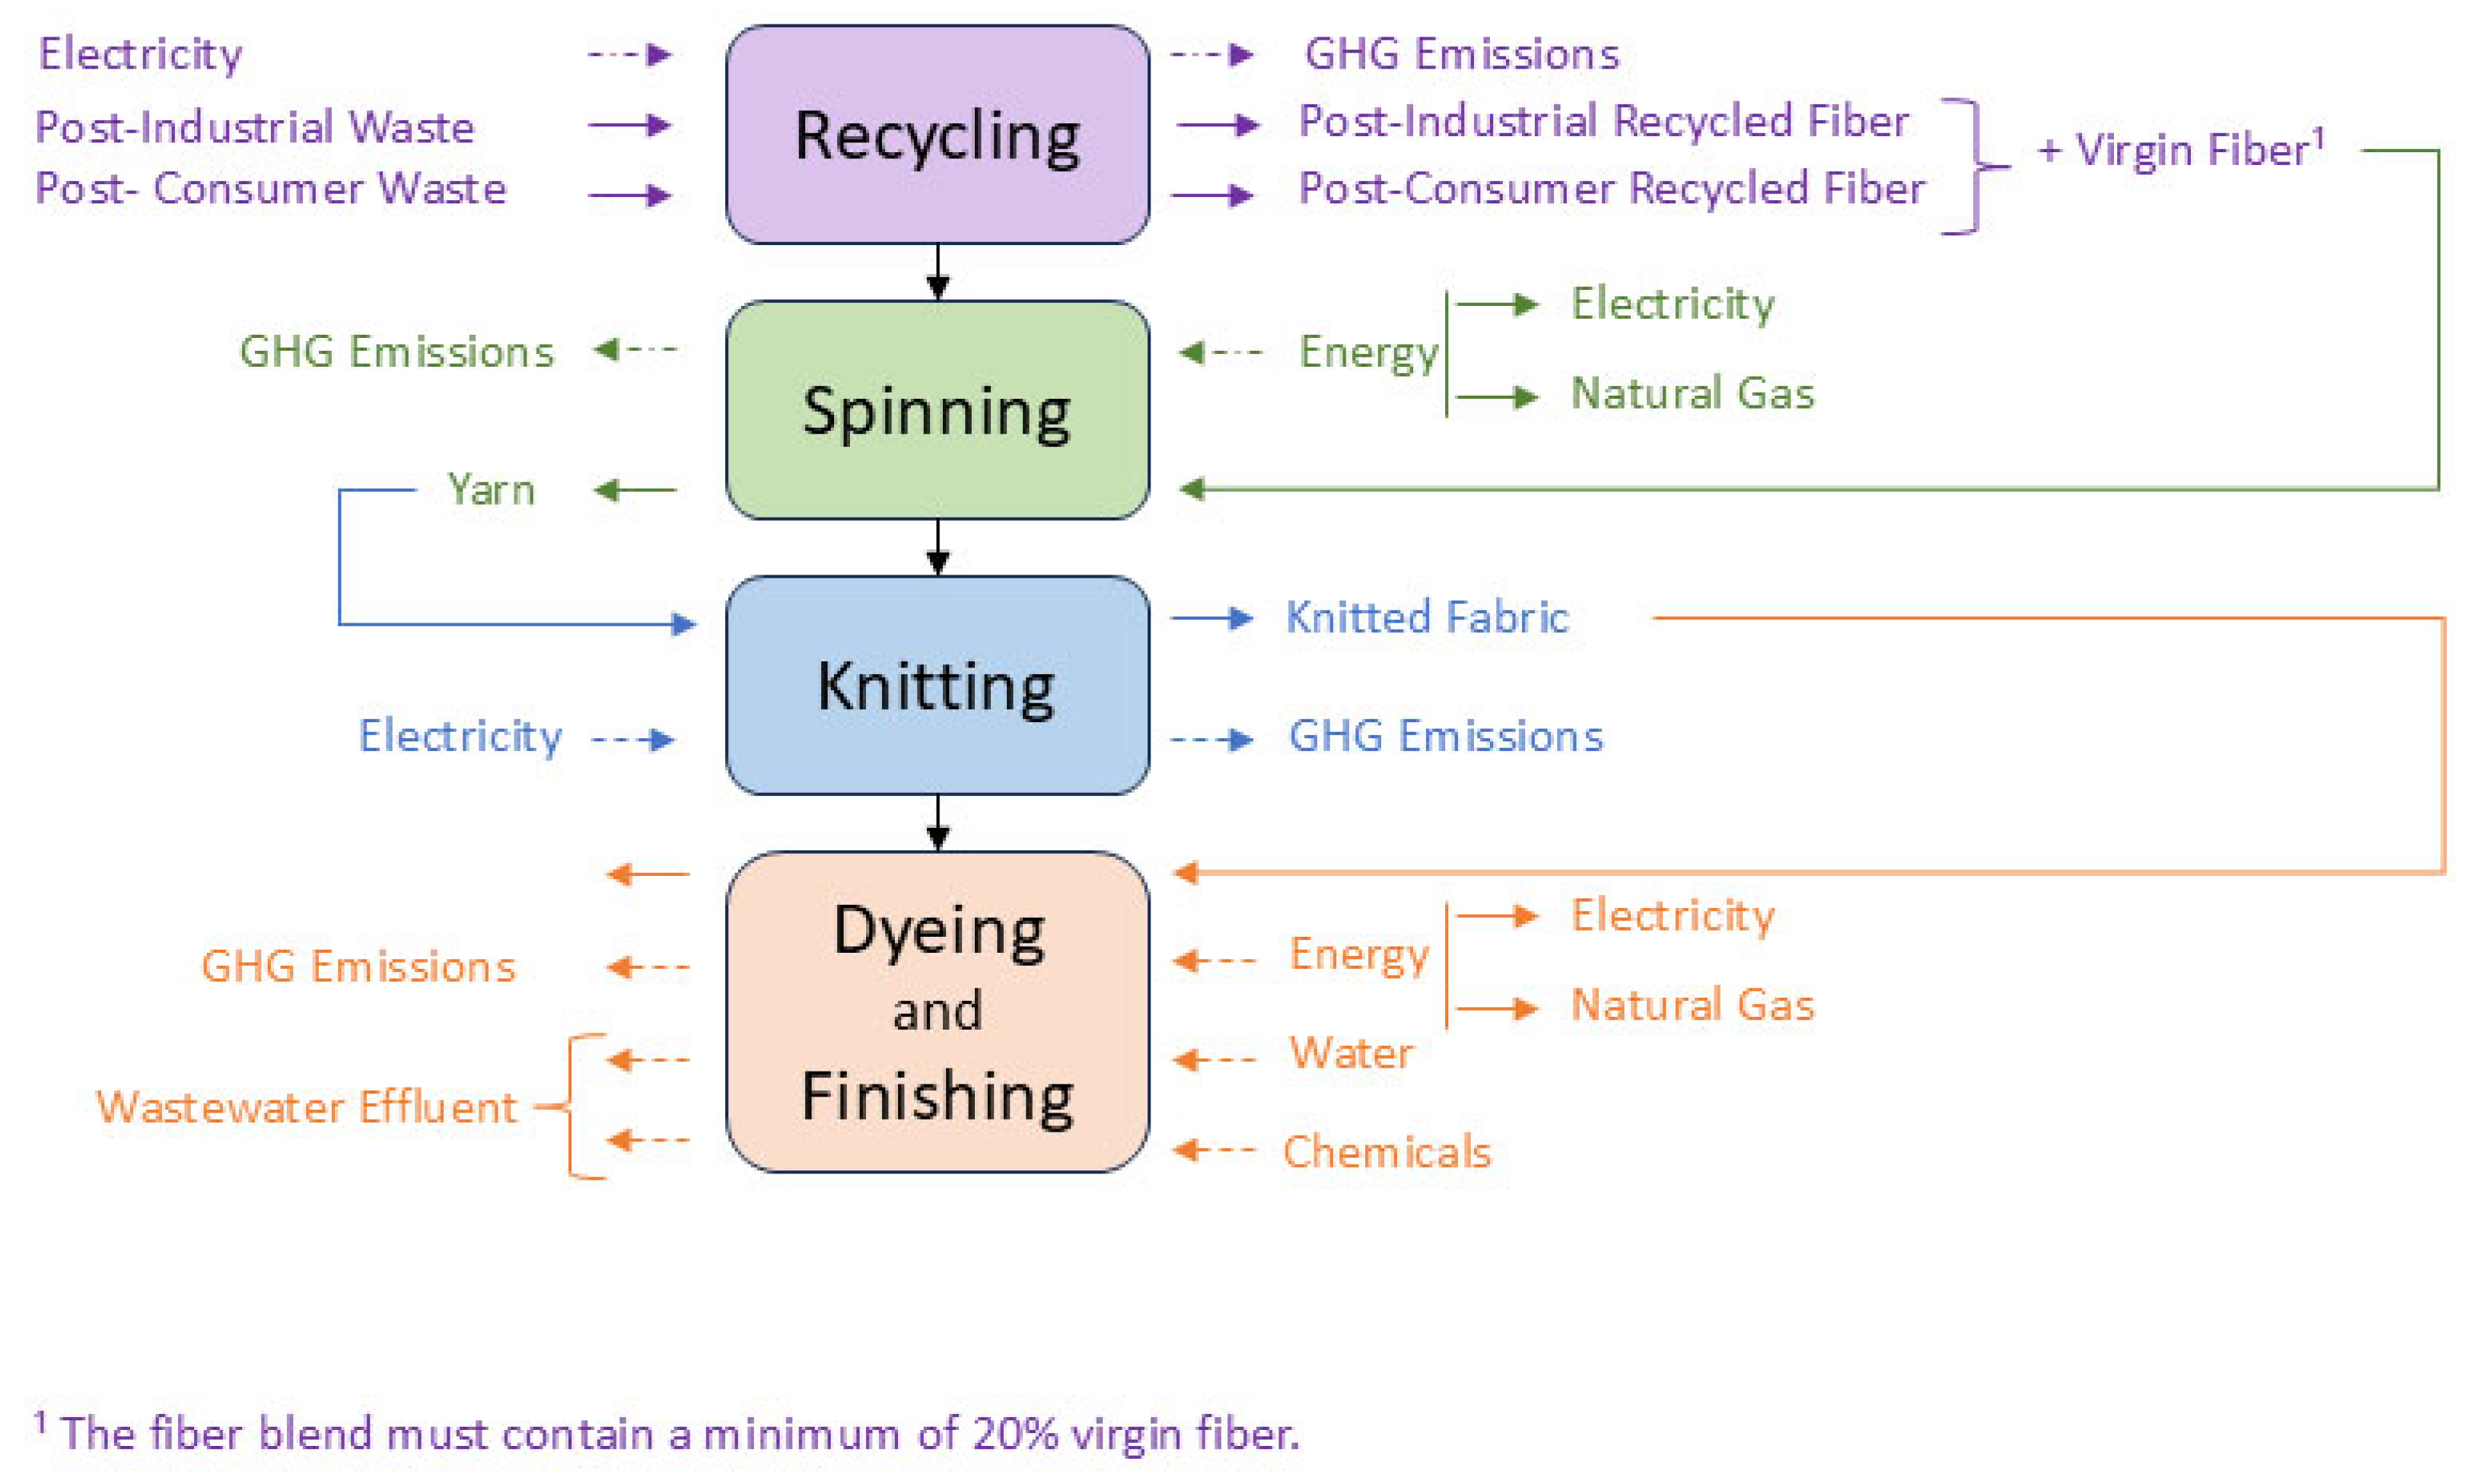
3.1. Identifying Supply Chain Processes
3.2. Product Specifications
3.3. Life Cycle Assessment
4. Results and Discussion
- I.
- UPSTREAM includes the upstream processes—the production stage of organic cotton fibers—that are not carried out in the Valérius facilities and the production of post-industrial and post-consumer fibers produced in Valérius 360.
- II.
- CORE, which are all production processes carried out in Valérius companies—spinning, knitting, dyeing, and finishing.
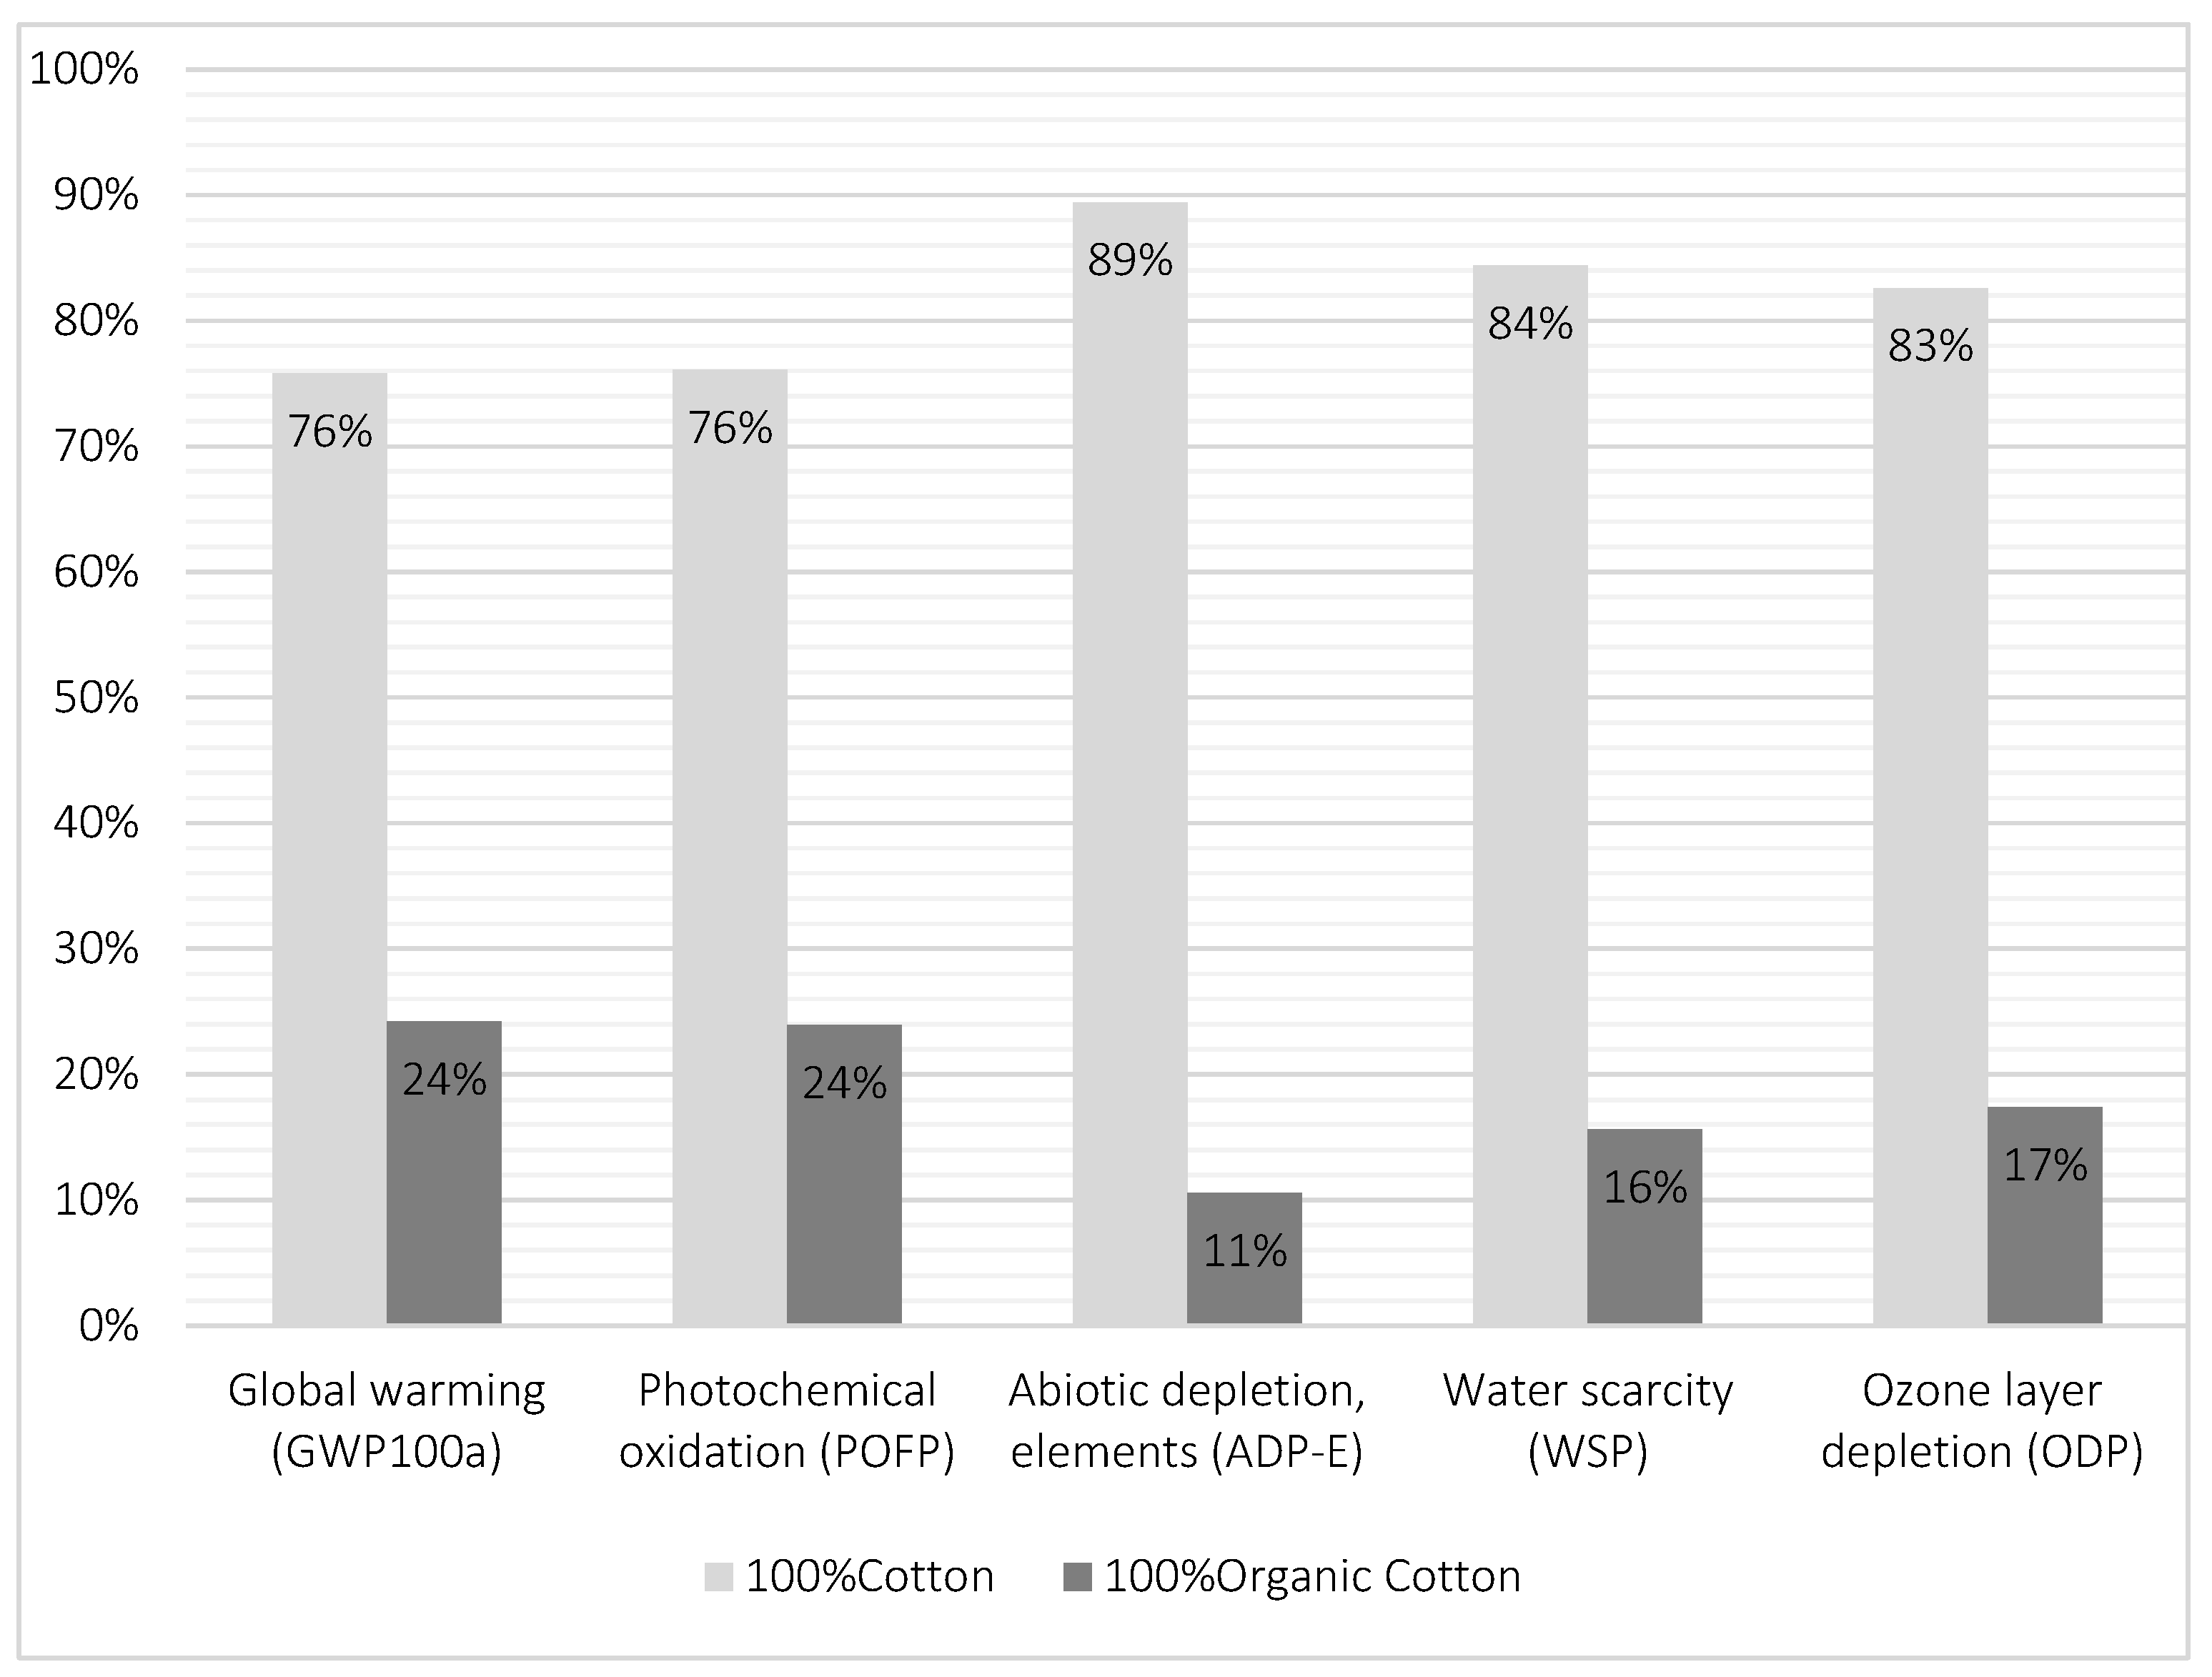
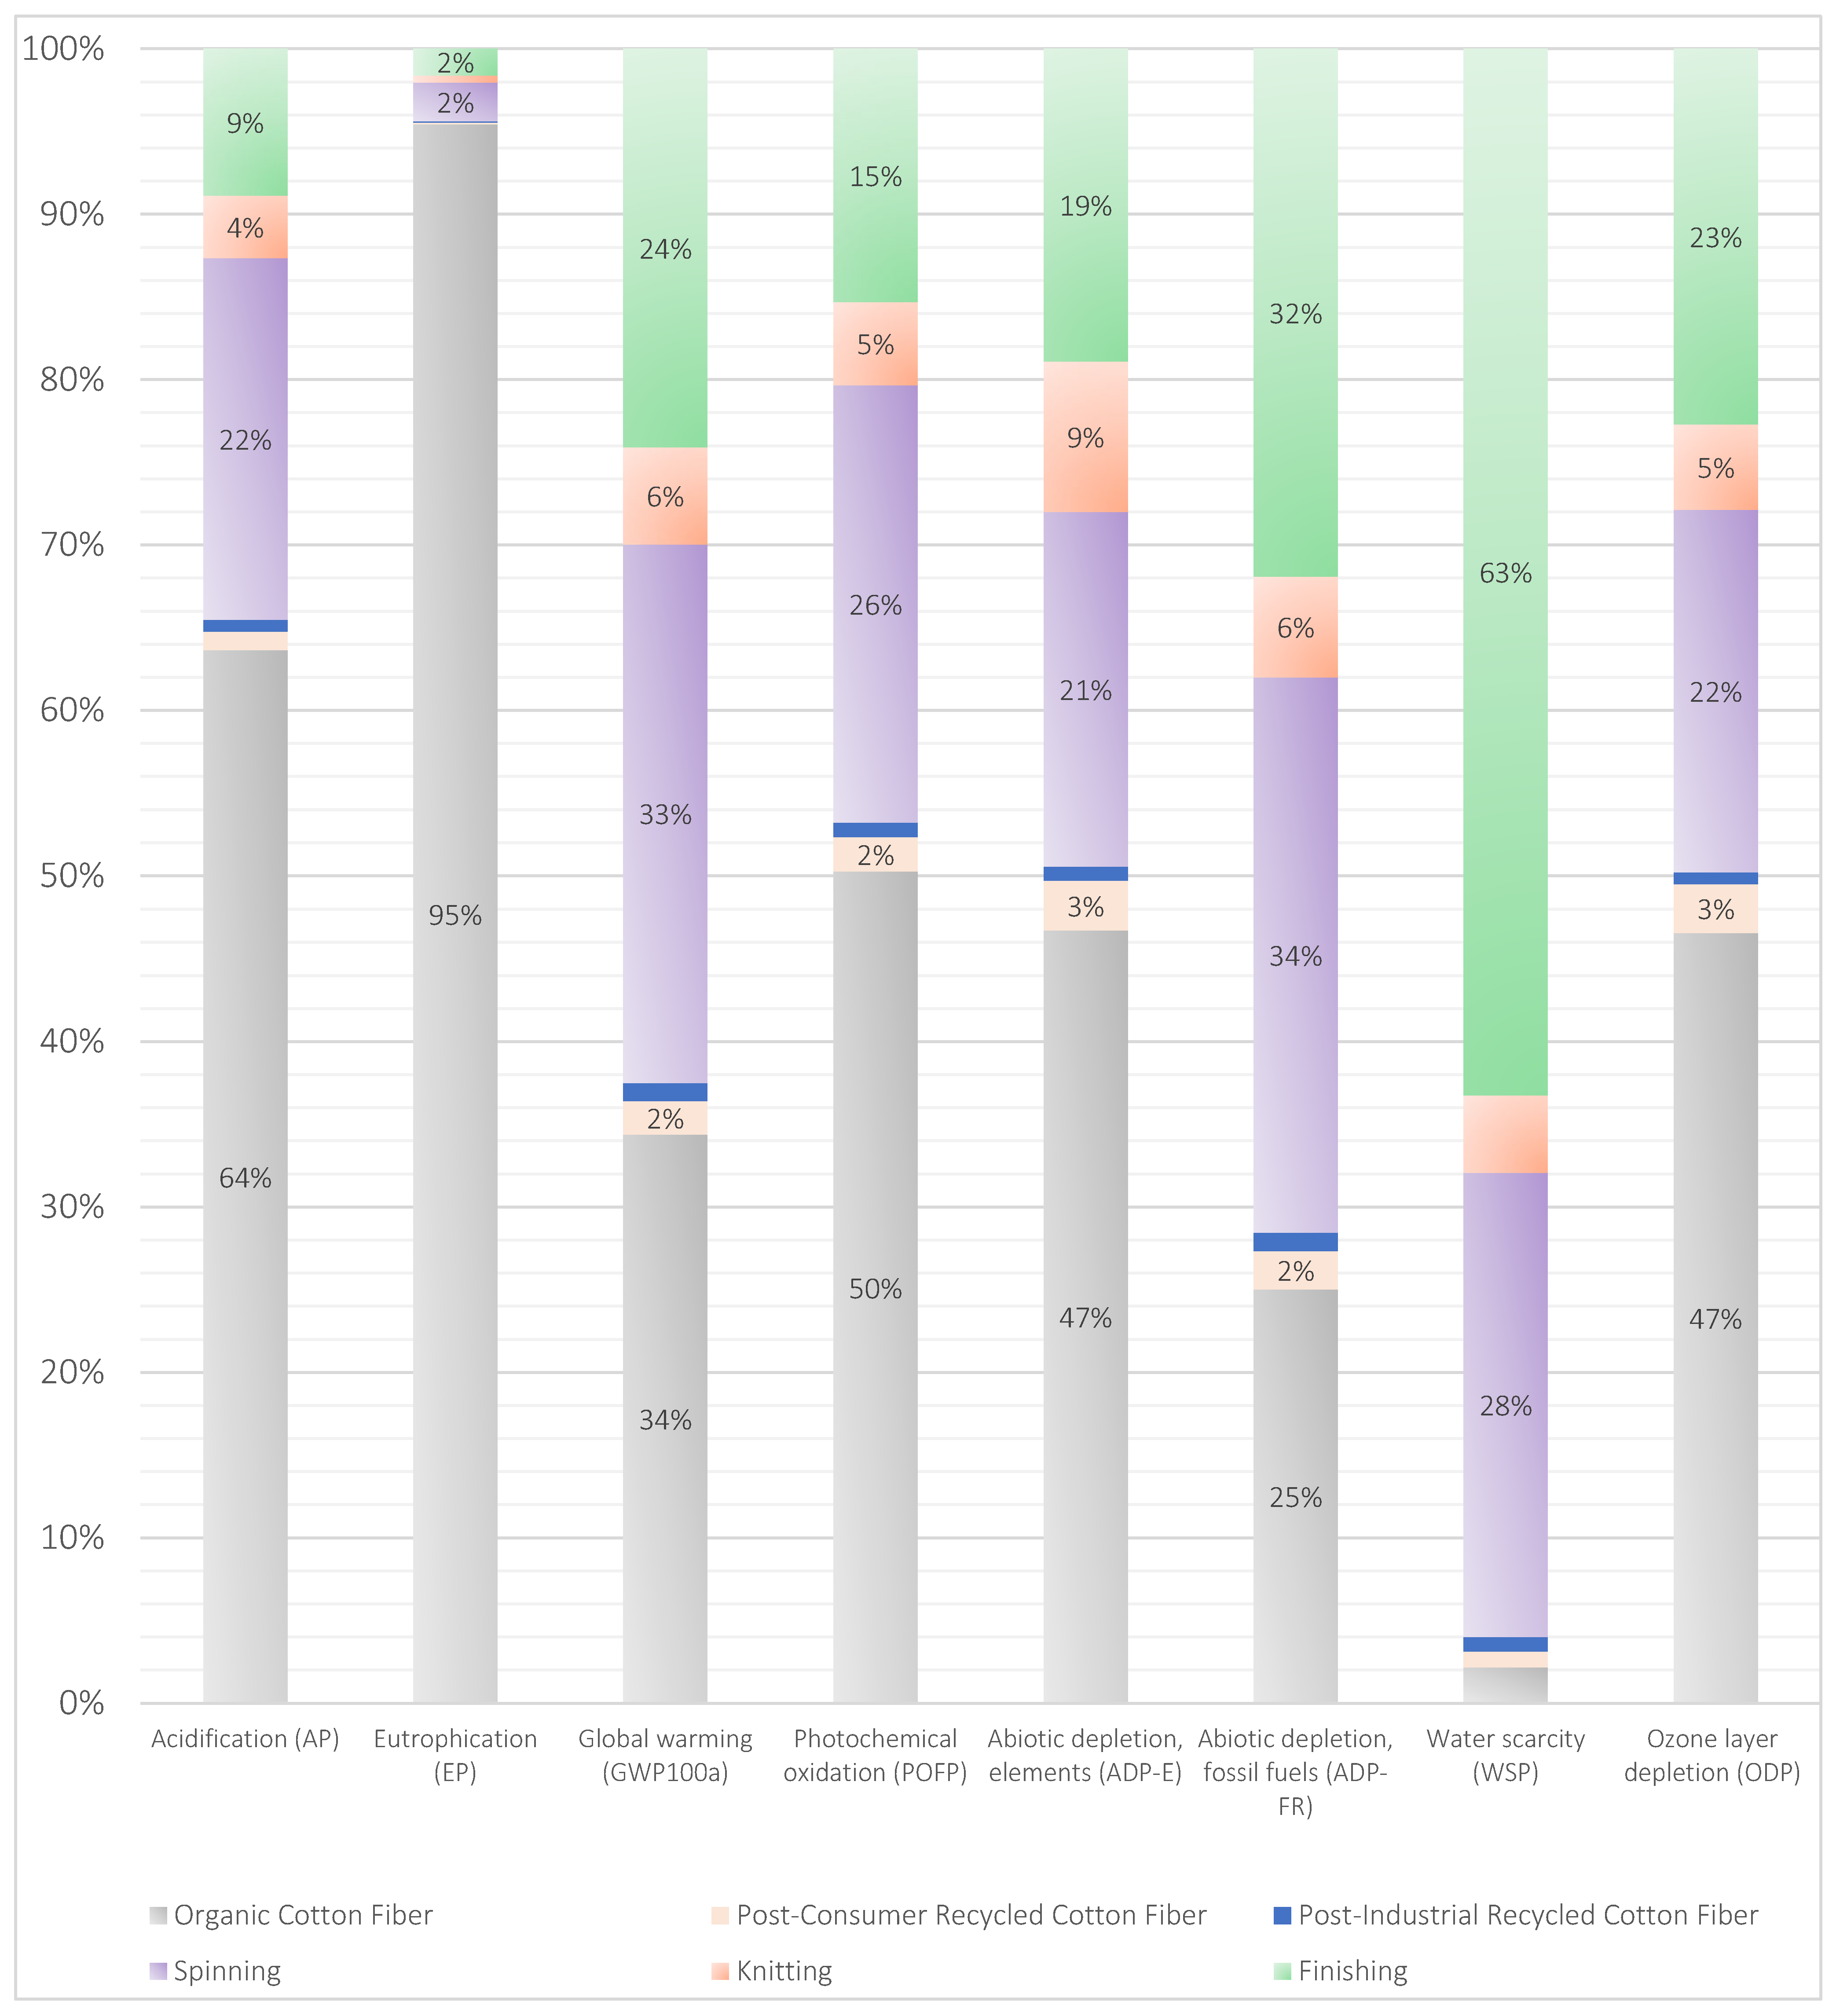
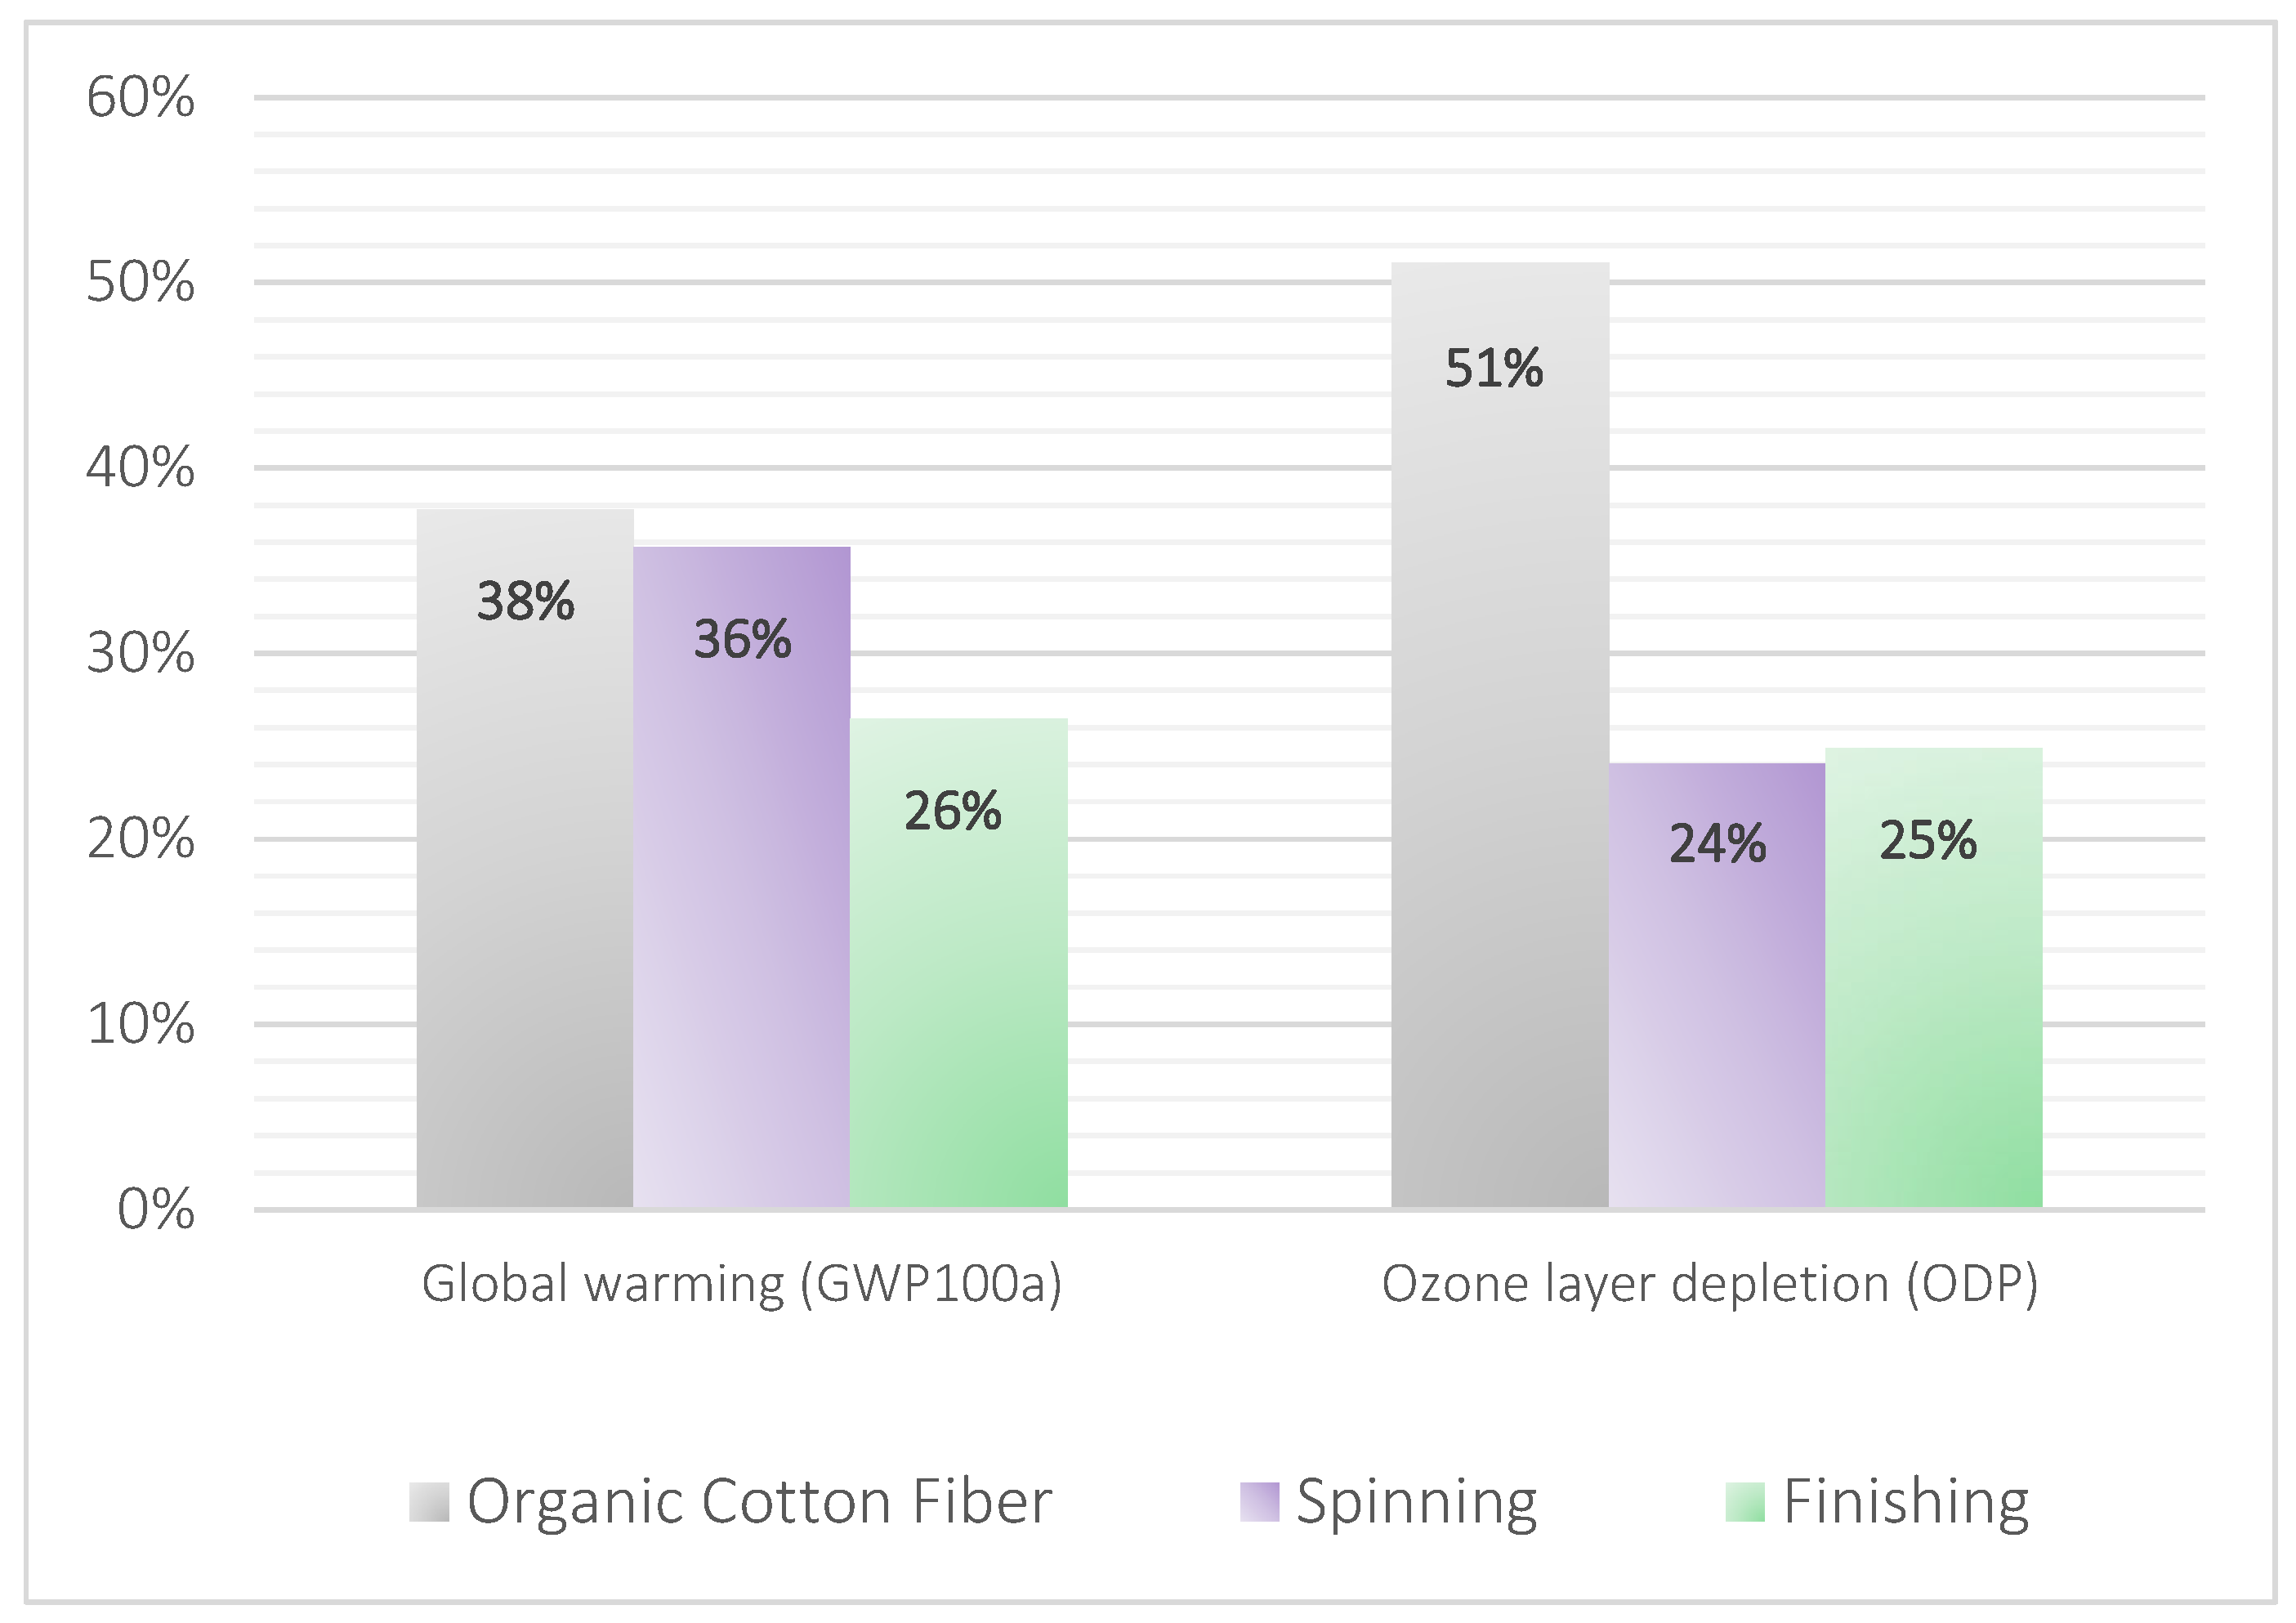
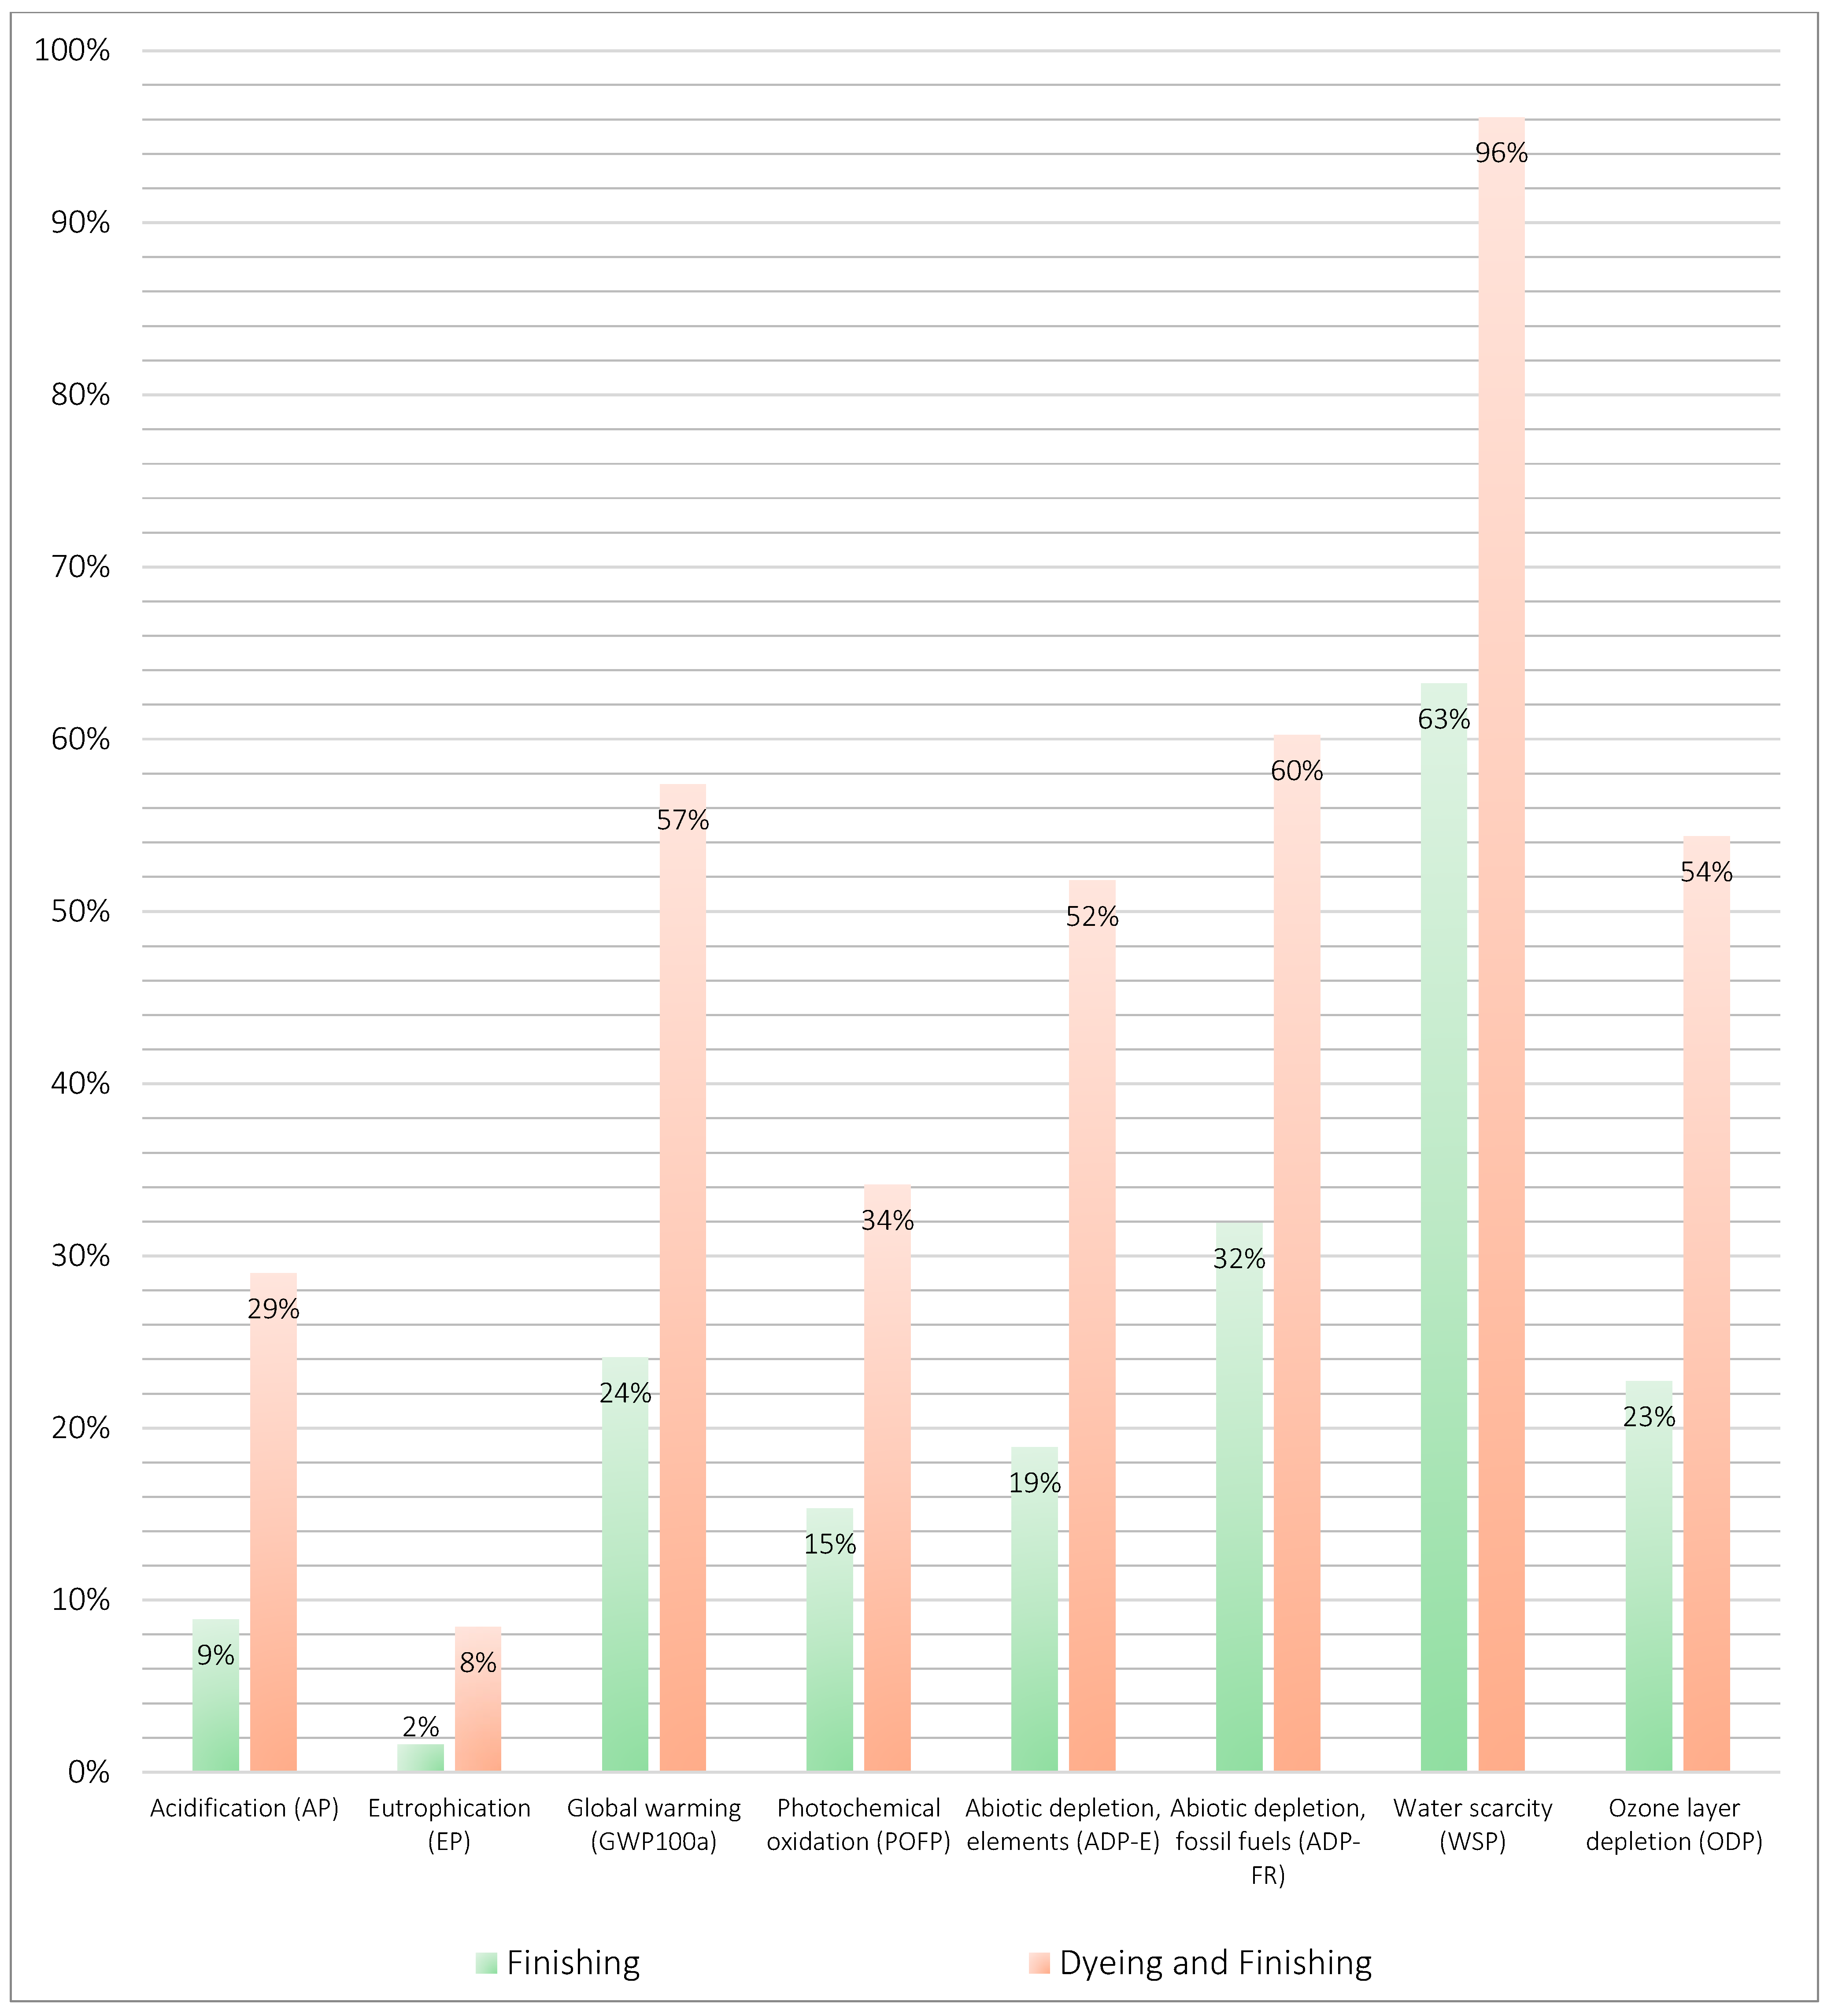
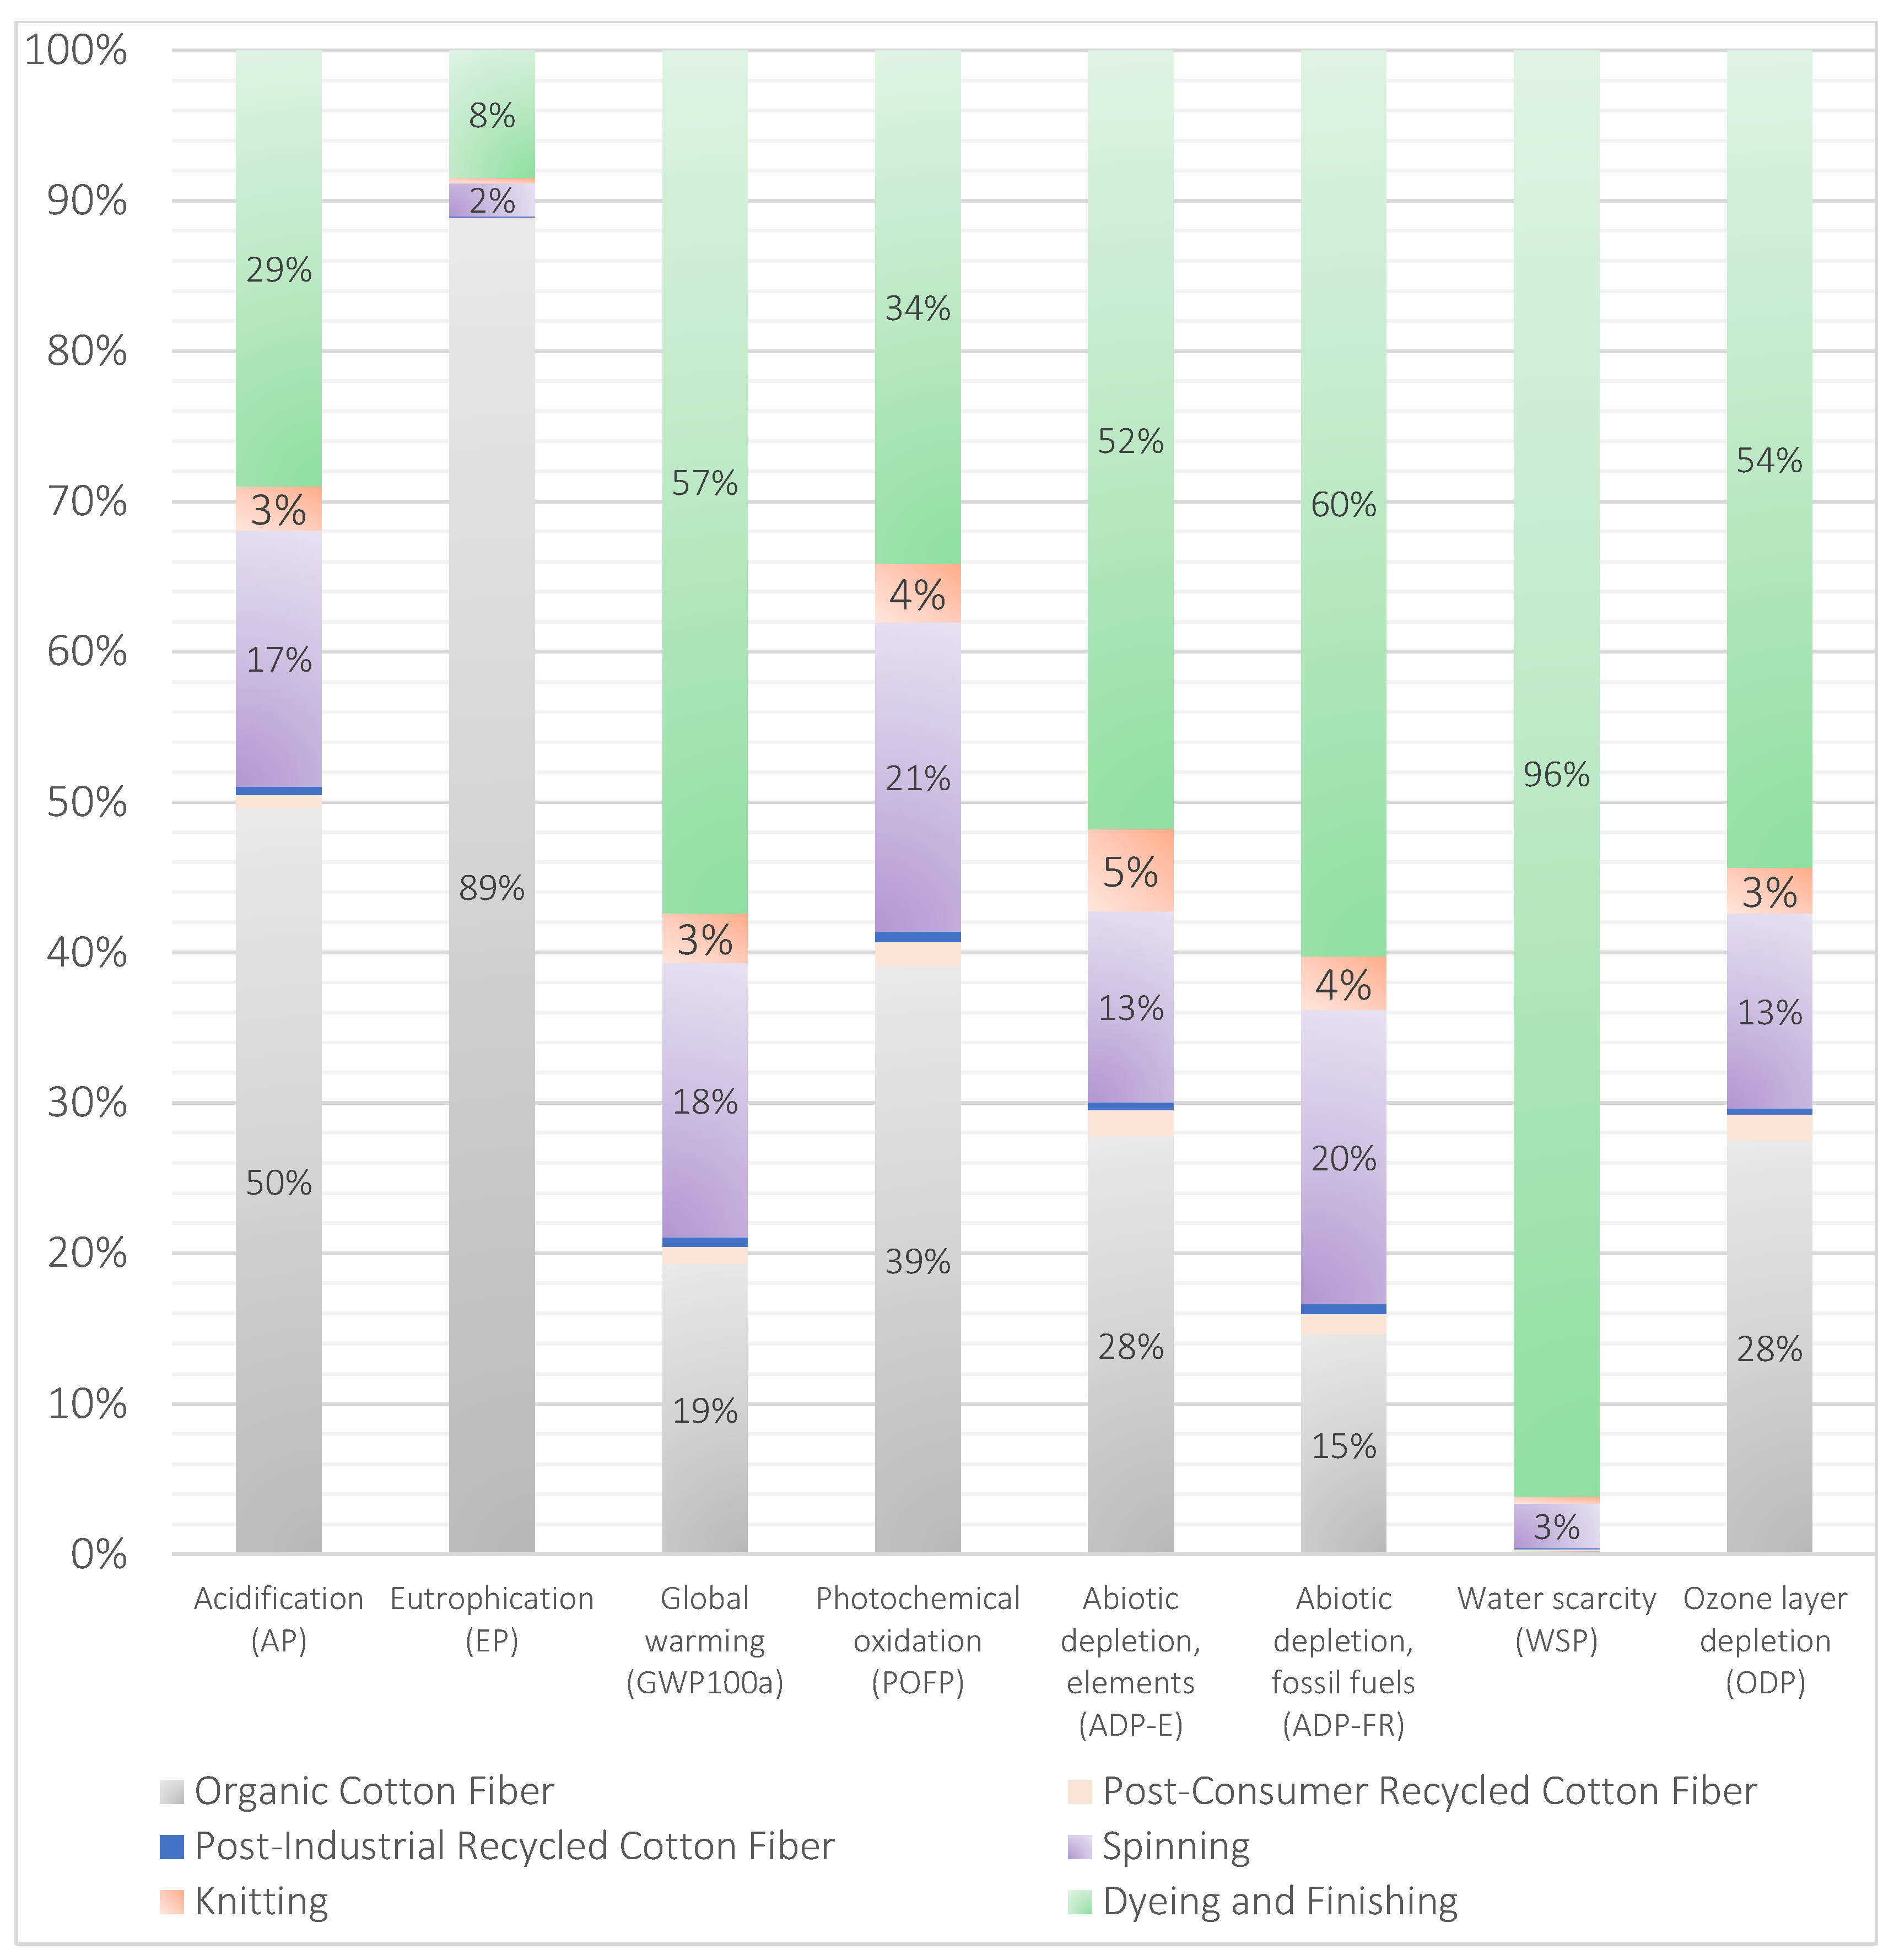
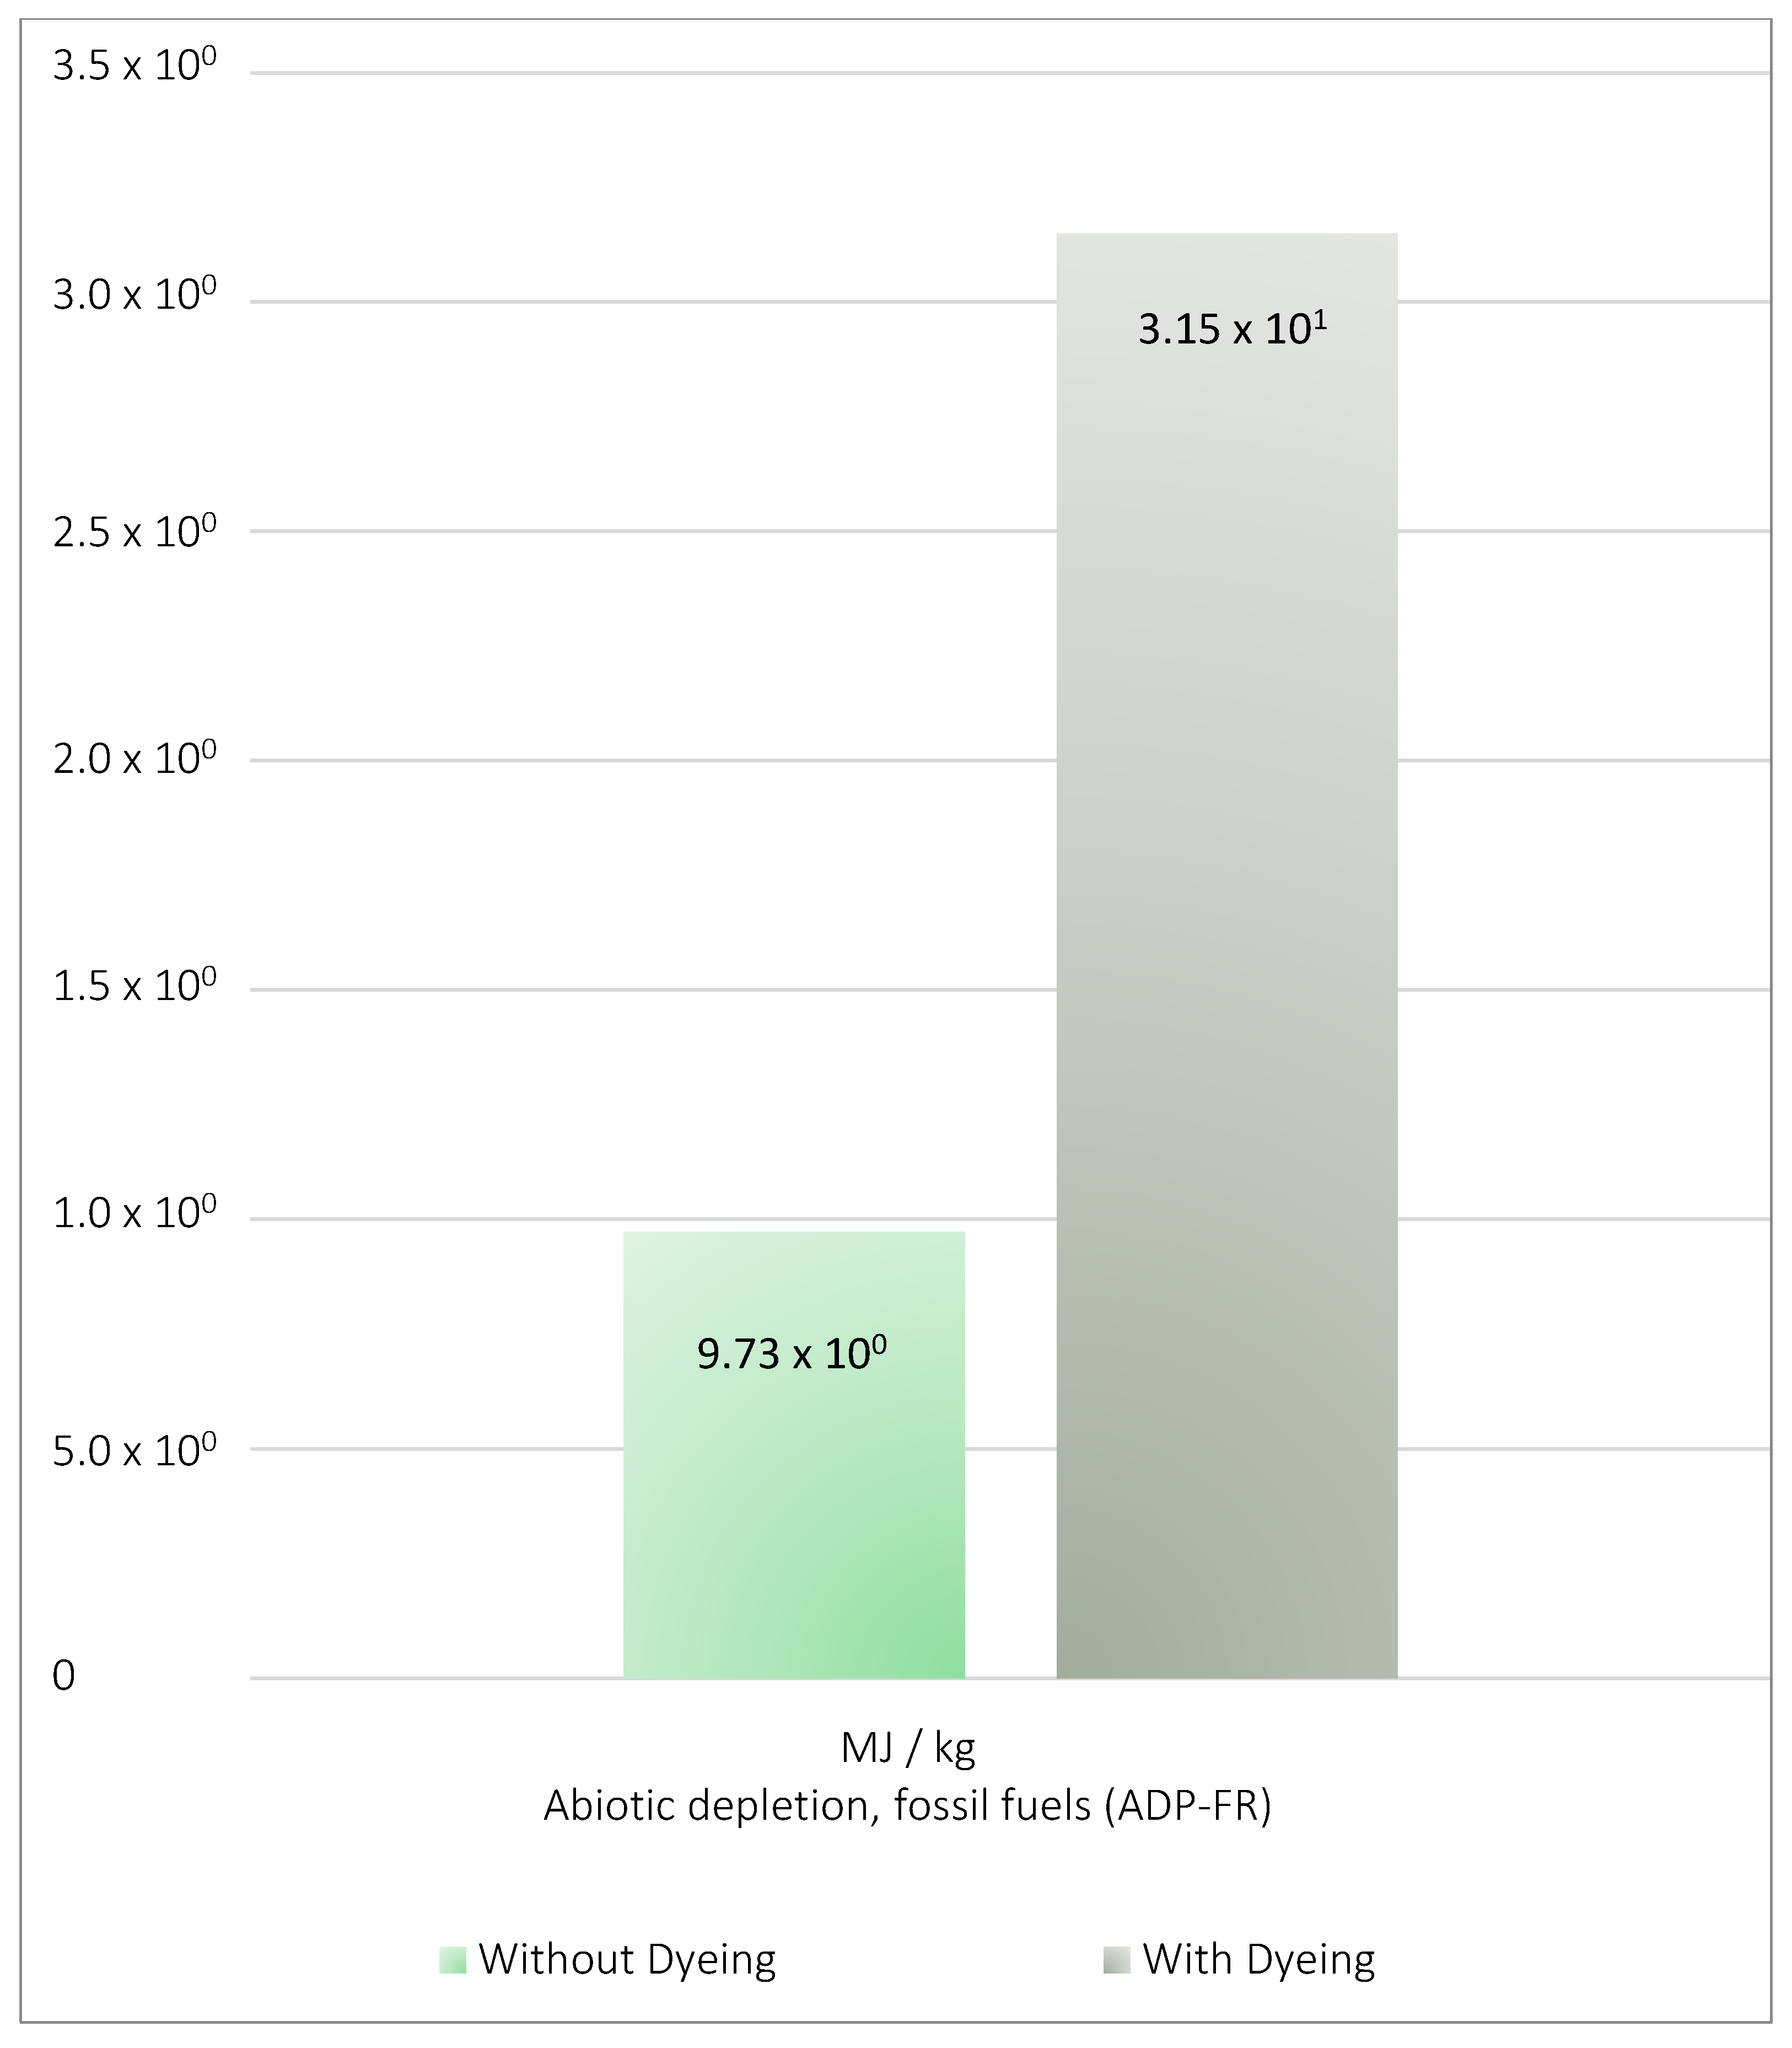
4.1. Product Life Cycle Assessment Analysis
4.2. Physical Properties of the Product
- -
- EN 12127:1997–Textiles—Fabrics—Determination of Mass per Unit Area Using Small Samples [43]This standard specifies the method for determining the fabric weight (g/m2) of woven and knitted textiles using small fabric specimens.
- -
- ISO 16322-2:2021–Textiles—Determination of Spirality After Laundering—Part 2: Woven and Knitted Fabrics [35]This method assesses the spirality (twisting or skewing) of textiles following washing, providing a reliable measure of fabric distortion.
- -
- ISO 5077:2007/ISO 6330:2021–Textiles—Determination of Dimensional Change in Washing and Drying/Domestic Washing and Drying Procedures for Textile Testing [34,44]ISO 5077 outlines procedures for quantifying fabric shrinkage after laundering, while ISO 6330 standardizes the washing and drying conditions used during the testing.
- -
- ISO 13938-2:2019–Textiles—Bursting Properties of Fabrics—Part 2: Pneumatic Method for Determination of Bursting Strength and Bursting DistensionThis standard defines a pneumatic method for measuring the bursting resistance of fabrics, using a diaphragm-based testing apparatus. [45]
- -
- ISO 12945-1:2020–Textiles—Determination of Fabric Propensity to Surface Fuzzing and to Pilling—Part 1: Pilling Box Method [36]This method evaluates the tendency of fabrics to form fuzz and pills through controlled tumbling in a pilling box.
5. Research Gaps and Future Perspectives
- Quality of Recycled Materials: The quality and properties of recycled fibers can vary significantly, impacting their performance and the overall quality of the final product. Important factors include the textile processing methods used on the original material, the usage cycles of garments, and the average fiber length resulting from post-consumer recycling. Current tools may not sufficiently account for these variations.
- Lifecycle Analysis Limitations: Many assessments focus narrowly on specific stages of the textile lifecycle, neglecting the broader implications of recycling throughout the entire value chain. A comprehensive lifecycle analysis (LCA) that includes end-of-life phases is crucial for understanding the true environmental benefits of recycled fibers.
- Impact of Cotton Cultivation: For fabrics that incorporate a blend of organic and recycled cotton, the environmental impacts associated with cotton cultivation, such as land use, pesticide use, and water consumption, may overshadow the benefits of using recycled materials. Existing measurement tools may not effectively integrate these factors.
6. Conclusions
Author Contributions
Funding
Institutional Review Board Statement
Informed Consent Statement
Data Availability Statement
Acknowledgments
Conflicts of Interest
References
- Ellen MacArthur Foundation. A New Textiles Economy: Redesigning Fashion’s Future; Ellen MacArthur Foundation: Cowes, UK, 2017. [Google Scholar]
- European Environment Agency. Como Tornar o Consumo e a Produção de Têxteis Mais Sustentáveis? European Environment Agency: Copenhagen, Denmark, 2023; Available online: https://www.eea.europa.eu/pt/articles/como-tornar-o-consumo-e (accessed on 10 February 2025).
- Comissão Europeia. Estratégia da UE em Prol da Sustentabilidade e Circularidade Dos Têxteis; Comissão Europeia: Bruxelas, Belgium, 2022; Available online: https://eur-lex.europa.eu/legal-content/PT/TXT/HTML/?uri=CELEX:52022DC0141 (accessed on 10 February 2025).
- Juanga-Labayen, J.P.; Labayen, I.V.; Yuan, Q. A Review on Textile Recycling Practices and Challenges. Textiles 2022, 2, 174–188. [Google Scholar] [CrossRef]
- Biyada, S.; Urbonavičius, J. Circularity in Textile Waste: Challenges and Pathways to Sustainability; Elsevier Ltd.: Amsterdam, The Netherlands, 2025. [Google Scholar] [CrossRef]
- F. & L. G. McKinsey Apparel. Scaling Textile Recycling in Europe-Turning Waste into Value; F. & L. G. McKinsey Apparel: New York, NY, USA, 2022. [Google Scholar]
- Diário da República. Plano Estratégico para os Resíduos Urbanos 2030. 2023. Available online: https://diariodarepublica.pt/dr/detalhe/resolucao-conselho-ministros/30-2023-210923318 (accessed on 16 October 2023).
- Carvalho, C.; Silva, C.J.; Abreu, M.J. Circular Economy: Literature Review on the Implementation of the Digital Product Passport (DPP) in the Textile Industry. Sustainability 2025, 17, 1802. [Google Scholar] [CrossRef]
- Stanescu, M.D. State of the art of post-consumer textile waste upcycling to reach the zero waste milestone. Environ. Sci. Pollut. Res. 2021, 28, 14253–14270. [Google Scholar] [CrossRef] [PubMed]
- Dissanayake, D.G.K.; Weerasinghe, D. Towards Circular Economy in Fashion: Review of Strategies, Barriers and Enablers. Circ. Econ. Sustain. 2022, 2, 25–45. [Google Scholar] [CrossRef]
- Jia, F.; Yin, S.; Chen, L.; Chen, X. The circular economy in the textile and apparel industry: A systematic literature review. J. Clean. Prod. 2020, 259, 120728. [Google Scholar] [CrossRef]
- Ellen MacArthur Foundation. How the Circular Economy Tackles Biodiversity Loss. 2021. Available online: https://ellenmacarthurfoundation.org/biodiversity-report (accessed on 10 May 2025).
- CTI Tool—WBCSD. Take the Driver’s Seat in Your Company’s Circular Transition. CTI Tool. Available online: https://ctitool.com/ (accessed on 13 March 2025).
- ISO 14040:2006; Environmental Management–Life Cycle Assessment–Principles and Framework. ISO: Geneva, Switzerland, 2006.
- ISO 14044:2006; Environmental Management—Life Cycle Assessment—Requirements and Guidelines. ISO: Geneva, Switzerland, 2006.
- Ellen MacArthur Foundation and IDEO. Circular Design Guide. 2018. Available online: https://www.circulardesignguide.com/ (accessed on 13 March 2025).
- Geissdoerfer, M.; Savaget, P.; Bocken, N.M.P.; Hultink, E.J. The Circular Economy—A new sustainability paradigm? J. Clean. Prod. 2017, 143, 757–768. [Google Scholar] [CrossRef]
- Koszewska, M. Circular Economy—Challenges for the Textile and Clothing Industry. Autex Res. J. 2018, 18, 337–347. [Google Scholar] [CrossRef]
- Brydges, T. Closing the loop on take, make, waste: Investigating circular economy practices in the Swedish fashion industry. J. Clean. Prod. 2021, 293, 126245. [Google Scholar] [CrossRef]
- Sandberg, E.; Hultberg, E. Dynamic capabilities for the scaling of circular business model initiatives in the fashion industry. J. Clean. Prod. 2021, 320, 128831. [Google Scholar] [CrossRef]
- Manickam, P.; Duraisamy, G. 3Rs and circular economy. In Circular Economy in Textiles and Apparel; Elsevier: Amsterdam, The Netherlands, 2019; pp. 77–93. [Google Scholar] [CrossRef]
- Com, B.W.B.; Balwan, W.K.; Singh, A.; Kour, S.; Kashmir, I. European Journal of Biotechnology and 5R’s of zero waste management to save our green planet: A narrative review. Eur. J. Biotechnol. Biosci. 2022, 10, 7–11. Available online: www.biosciencejournals.com (accessed on 8 February 2025).
- Chen, X.; Memon, H.A.; Wang, Y.; Marriam, I.; Tebyetekerwa, M. Circular Economy and Sustainability of the Clothing and Textile Industry. Mater. Circ. Econ. 2021, 3, 12. [Google Scholar] [CrossRef]
- Whicher, A.; Harris, C.; Beverley, K.; Swiatek, P. Design for circular economy: Developing an action plan for Scotland. J. Clean. Prod. 2018, 172, 3237–3248. [Google Scholar] [CrossRef]
- Textile Exchange. Material Change Insights 2021: The State of Fiber and Materials Sourcing; Textile Exchange: Lamesa, TX, USA, 2022. [Google Scholar]
- Textile Exchange. Material Change Insights 2022; Textile Exchange: Lamesa, TX, USA, 2023. [Google Scholar]
- European Commission. Guidance on Waste Definitions—European Commission; European Commission: Brussels, Belgium, 2021. [Google Scholar]
- Utebay, B.; Celik, P.; Cay, A. Valorization of fabric wastes through production of recycled cotton yarns by compact ring and open-end rotor spinning. J. Clean. Prod. 2023, 409, 137135. [Google Scholar] [CrossRef]
- Wang, Y. Fiber and Textile Waste Utilization. Waste Biomass Valorization 2010, 1, 135–143. [Google Scholar] [CrossRef]
- Elia, V.; Gnoni, M.G.; Tornese, F. Measuring circular economy strategies through index methods: A critical analysis. J. Clean. Prod. 2017, 142, 2741–2751. [Google Scholar] [CrossRef]
- Candan, C.; Nergis, U.B.; Iridağ, Y. Performance of Open-End and Ring Spun Yarns in Weft Knitted Fabrics. Text. Res. J. 2000, 70, 177–181. [Google Scholar] [CrossRef]
- Erdumlu, N.; Ozipek, B.; Oztuna, A.S.; Cetinkaya, S. Investigation of Vortex Spun Yarn Properties in Comparison with Conventional Ring and Open-end Rotor Spun Yarns. Text. Res. J. 2009, 79, 585–595. [Google Scholar] [CrossRef]
- Soe, A.K.; Takahashi, M.; Nakajima, M.; Matsuo, T.; Matsumoto, T. Structure and Properties of MVS Yarns in Comparison with Ring Yarns and Open-End Rotor Spun Yarns. Text. Res. J. 2004, 74, 819–826. [Google Scholar] [CrossRef]
- ISO 6330:2021; Textiles—Domestic Washing and Drying Procedures for Textile Testing. ISO: Geneva, Switzerland, 2021.
- ISO 16322-2:2021; Textiles—Determination of Spirality after Laundering, Part 2: Woven and Knitted Fabrics. ISO: Geneva, Switzerland, 2021.
- ISO 12945-1:2020; Textiles—Determination of Fabric Propensity to Surface Pilling, Fuzzing or Matting, Part 1: Pilling Box Method. ISO: Geneva, Switzerland, 2020.
- Raja, A.S.M.; Arputharaj, A.; Saxena, S.; Patil, P.G. Water requirement and sustainability of textile processing industries. In Water in Textiles and Fashion: Consumption, Footprint, and Life Cycle Assessment; Elsevier: Amsterdam, The Netherlands, 2019; pp. 155–173. [Google Scholar] [CrossRef]
- Samanta, K.K.; Pandit, P.; Samanta, P.; Basak, S. Water consumption in textile processing and sustainable approaches for its conservation. In Water in Textiles and Fashion: Consumption, Footprint, and Life Cycle Assessment; Elsevier: Amsterdam, The Netherlands, 2019; pp. 41–59. [Google Scholar] [CrossRef]
- Benetto, E.; Gericke, K.; Guiton, M. Life Cycle Assessment of Organic, BCI and Conventional Cotton: A Comparative Study of Cotton Cultivation Practices in India; Springer International Publishing: Cham, Switzerland, 2018. [Google Scholar] [CrossRef]
- Esteve-Turrillas, F.A.; de la Guardia, M. Environmental impact of Recover cotton in textile industry. Resour. Conserv. Recycl. 2017, 116, 107–115. [Google Scholar] [CrossRef]
- Avadí, A.; Marcin, M.; Biard, Y.; Renou, A.; Gourlot, J.P.; Basset-Mens, C. Life cycle assessment of organic and conventional non-Bt cotton products from Mali. Int. J. Life Cycle Assess. 2020, 25, 678–697. [Google Scholar] [CrossRef]
- Brooke Roberts-Islam. When It Comes To Sustainable Cotton, Fashion’s Focused On 1% at the Expense Of The Other 99. Why? Forbes. Available online: https://www.forbes.com/sites/brookerobertsislam/2023/05/09/when-it-comes-to-sustainable-cotton-fashions-focused-on-1-at-the-expense-of-the-other-99-why/ (accessed on 8 February 2025).
- DIN EN 12127:1997; Textile Fabrics-Determination of Mass Per Unit Area Using Small Samples. Comite Europeen de Normalisation: Brussels, Belgium, 1997.
- ISO 5077:2007; Textiles—Determination of Dimensional Change in Washing and Drying. ISO: Geneva, Switzerland, 2007.
- ISO 13938-2:2019; Textiles—Bursting Properties of Fabrics—Part 2: Pneumatic Method for Determination of Bursting Strength and Bursting Distension. ISO: Geneva, Switzerland, 2019.
- Lu, L.; Fan, W.; Meng, X.; Xue, L.; Ge, S.; Wang, C.; Foong, S.Y.; Tan, C.S.; Sonne, C.; Aghbashlo, M.; et al. Current recycling strategies and high-value utilization of waste cotton. Sci. Total Environ. 2023, 856, 158798. [Google Scholar] [CrossRef] [PubMed]
- Fidan, F.; Aydoğan, E.K.; Uzal, N. An integrated life cycle assessment approach for denim fabric production using recycled cotton fibers and combined heat and power plant. J. Clean. Prod. 2021, 287, 125439. [Google Scholar] [CrossRef]
- Chen, S.; Zhu, L.; Sun, L.; Huang, Q.; Zhang, Y.; Li, X.; Ye, X.; Li, Y.; Wang, L. A systematic review of the life cycle environmental performance of cotton textile products. Sci. Total Environ. 2023, 883, 163659. [Google Scholar] [CrossRef] [PubMed]


| Stage of the Value Chain | Practices to Adopt for a Circular Economy |
|---|---|
| Raw Material TAKE | Choose natural fibers instead of blended materials. |
| Work closely with raw material suppliers. | |
| Assess and quantify the environmental impact of production processes, including water consumption and chemicals, particularly in dyeing. | |
| Adoption of more sustainable dyeing techniques and use low-impact dyeing processes | |
| Production/Manufacturing MAKE | Use modular design techniques and optimize cutting processes, such as laser cutting. |
| Present timeless collections instead of seasonal ones. | |
| Establish strategic partnerships to expand capacity and resources, leveraging the knowledge and experience of other organizations. | |
| Consumption USE | Use suitable care practices to prolong the lifespan of textile products, such as proper washing instructions. |
| Encourage upcycling, repair initiatives, and take-back programs or partnerships. | |
| Disposal WASTE | Recycling |
| Invest in more efficient waste management systems, such as textile recycling, and in water and effluent treatment technologies, including water recycling. |
| Reference | Fabric Structure | Yarn Count [Ne] | Fabric Composition |
|---|---|---|---|
| S1 | Jersey | 20/1 | 100% Cotton |
| S2 | 100% Organic Cotton | ||
| S3 | 60% Organic Cotton/40% Cotton | ||
| S4 | 50% Organic Cotton/50% Post-Industrial Recycled Cotton | ||
| DS_1 | 60% Organic Cotton/20% Post-Industrial Recycled Cotton/20% Post-Consumer Recycled Cotton |
| Product Reference | Developed Sample—DS_1 |
|---|---|
| Structure | Jersey |
| Composition | 60% Organic Cotton/20% Recycled Cotton Post-Industrial/20% Recycled Cotton Post-Consumer |
| Weight (g/m2) | 215 (±5%) |
| Width (m) | 1.65 (±5%) |
| Shrinkage NP EN ISO 6330 [34] (40 °C line dry) | Length ± 7%|Width ± 7% |
| Spirality NP EN ISO 16322-2 [35] (40 °C line dry) | 3% max |
| Pilling Box NP EN ISO 12945-1 [36](11,000 rot) | 3 |
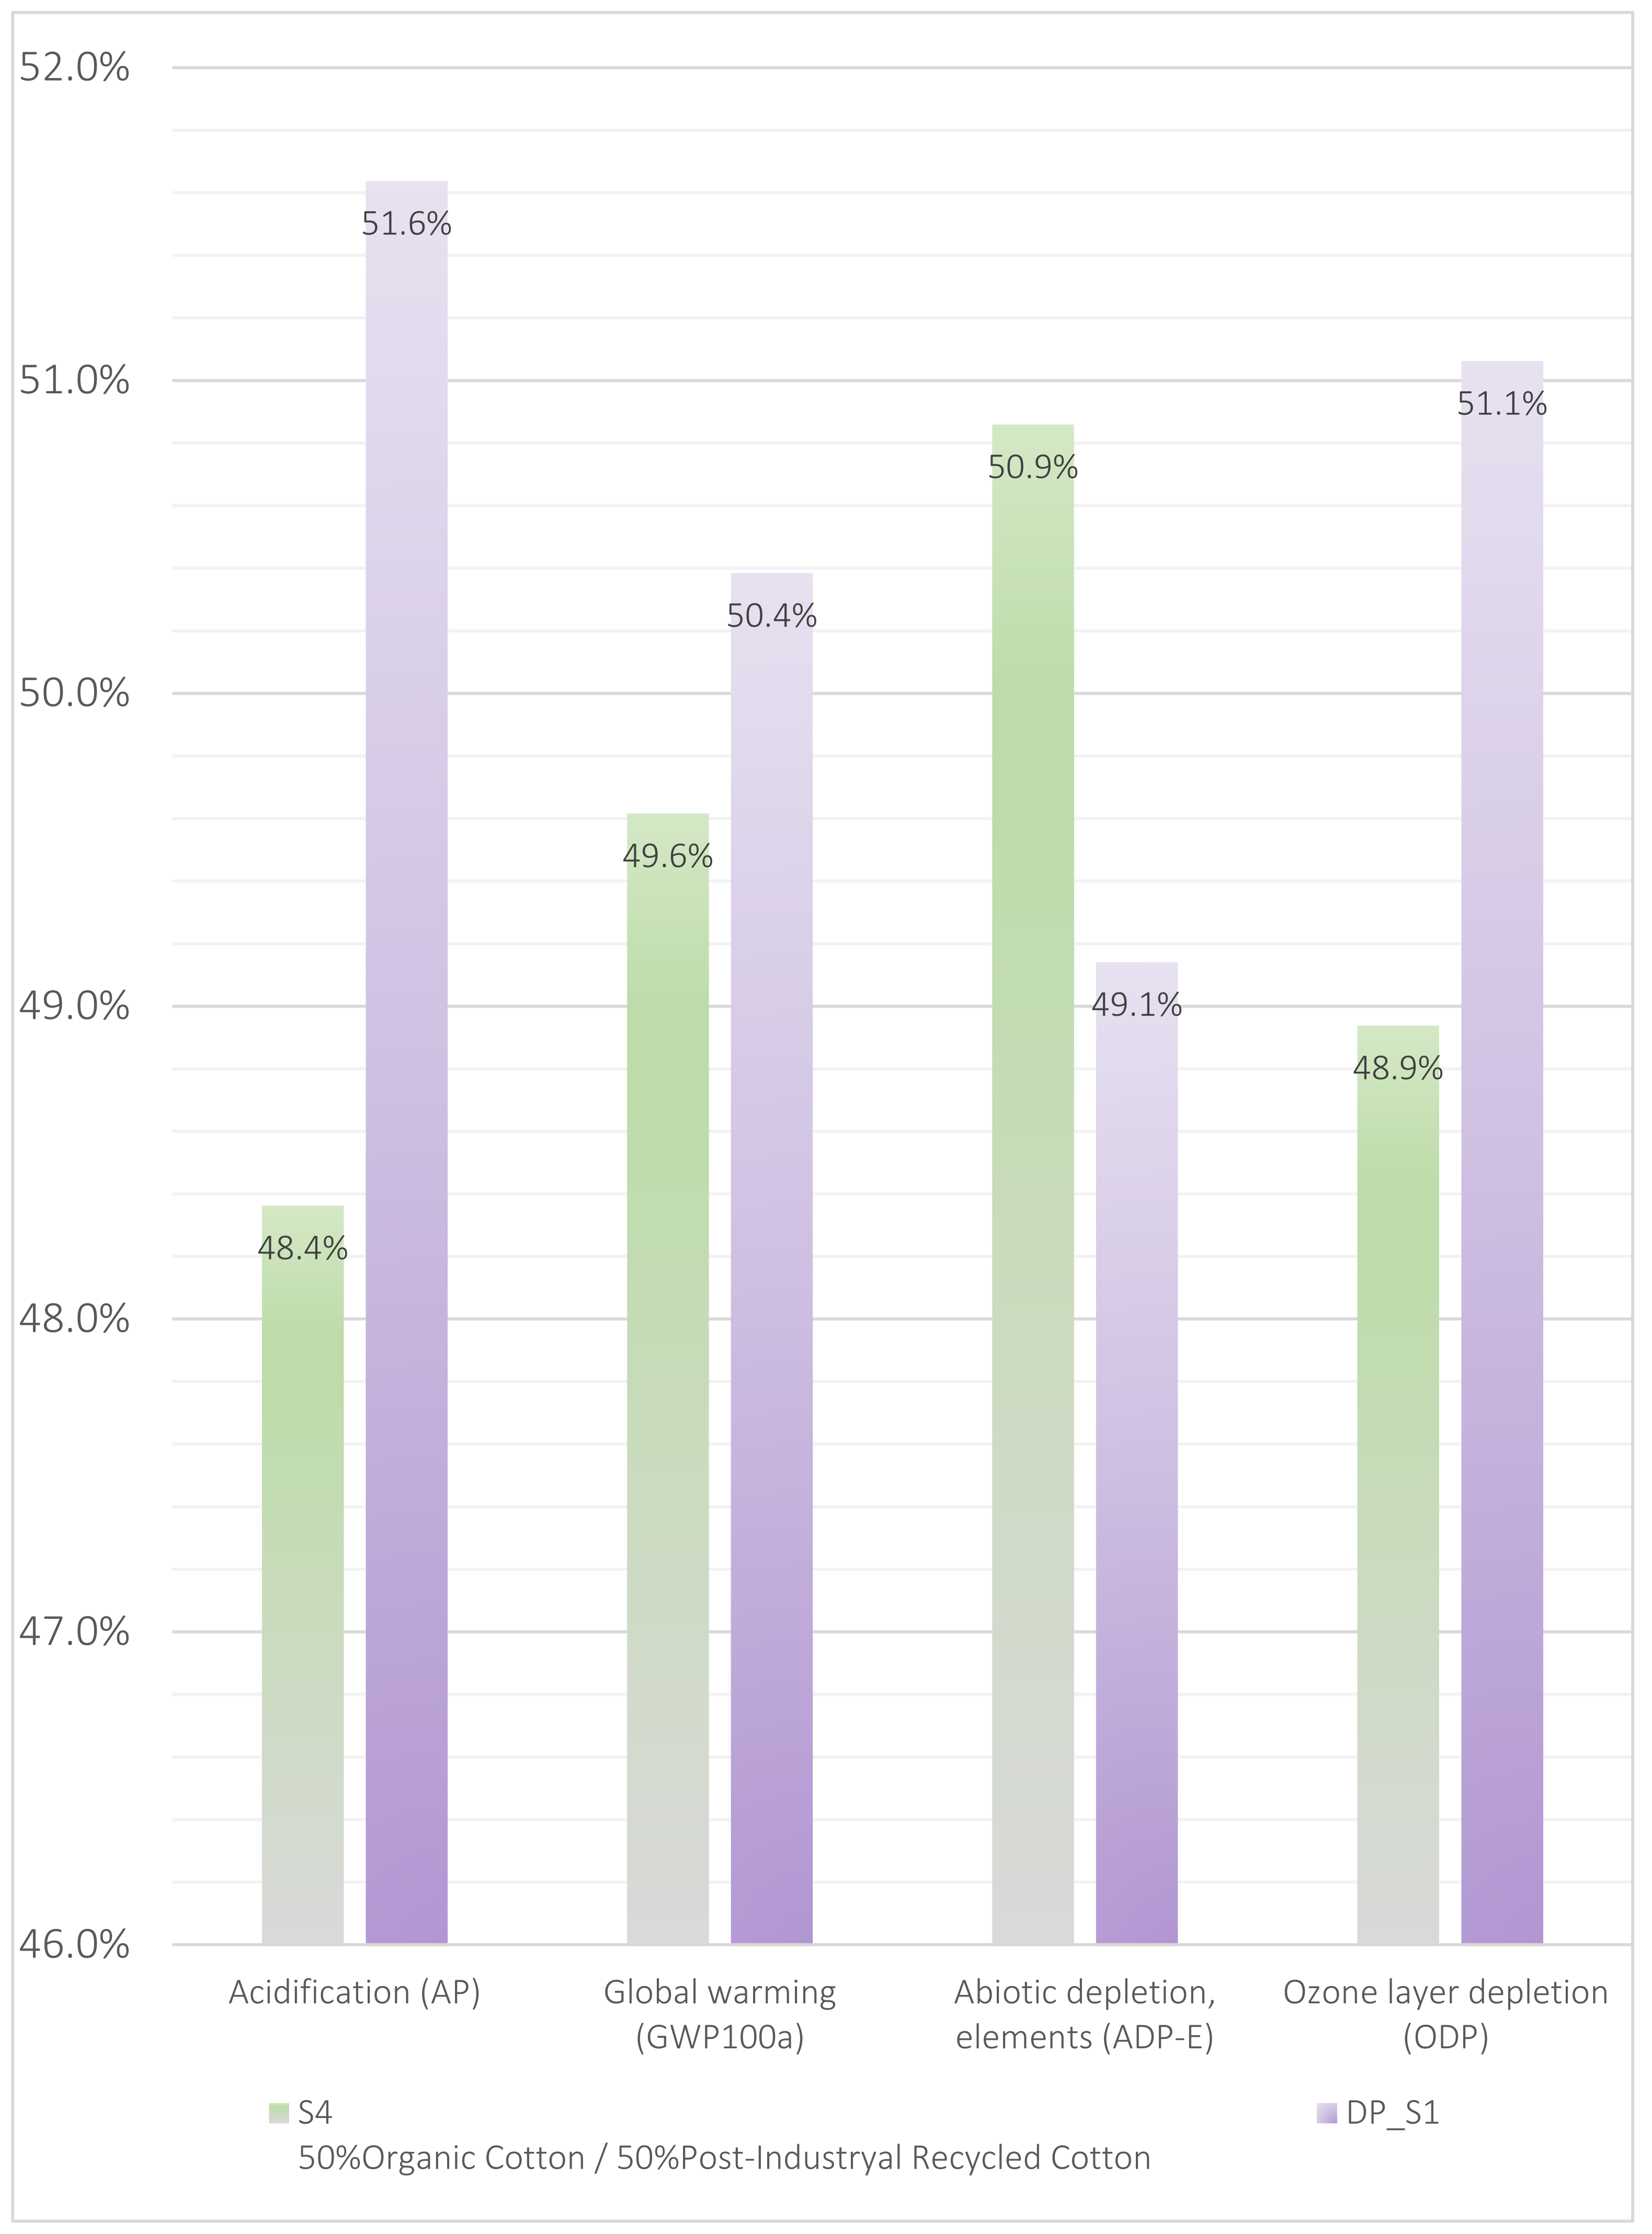
| Impact Category | Unit | Savings |
|---|---|---|
| Acidification potential (AP) | kg SO2 eq | 76% |
| Eutrophication potential (EP) | kg PO4 eq | 82% |
| Global warming potential (GWP100a) | kg CO2 eq | 76% |
| Photochemical oxidation potential (POFP) | kg NMVOC | 65% |
| Abiotic depletion potential—elements (ADP-E) | kg Sb eq | 78% |
| Abiotic depletion potential—fossil fuels (ADP-FR) | MJ | 69% |
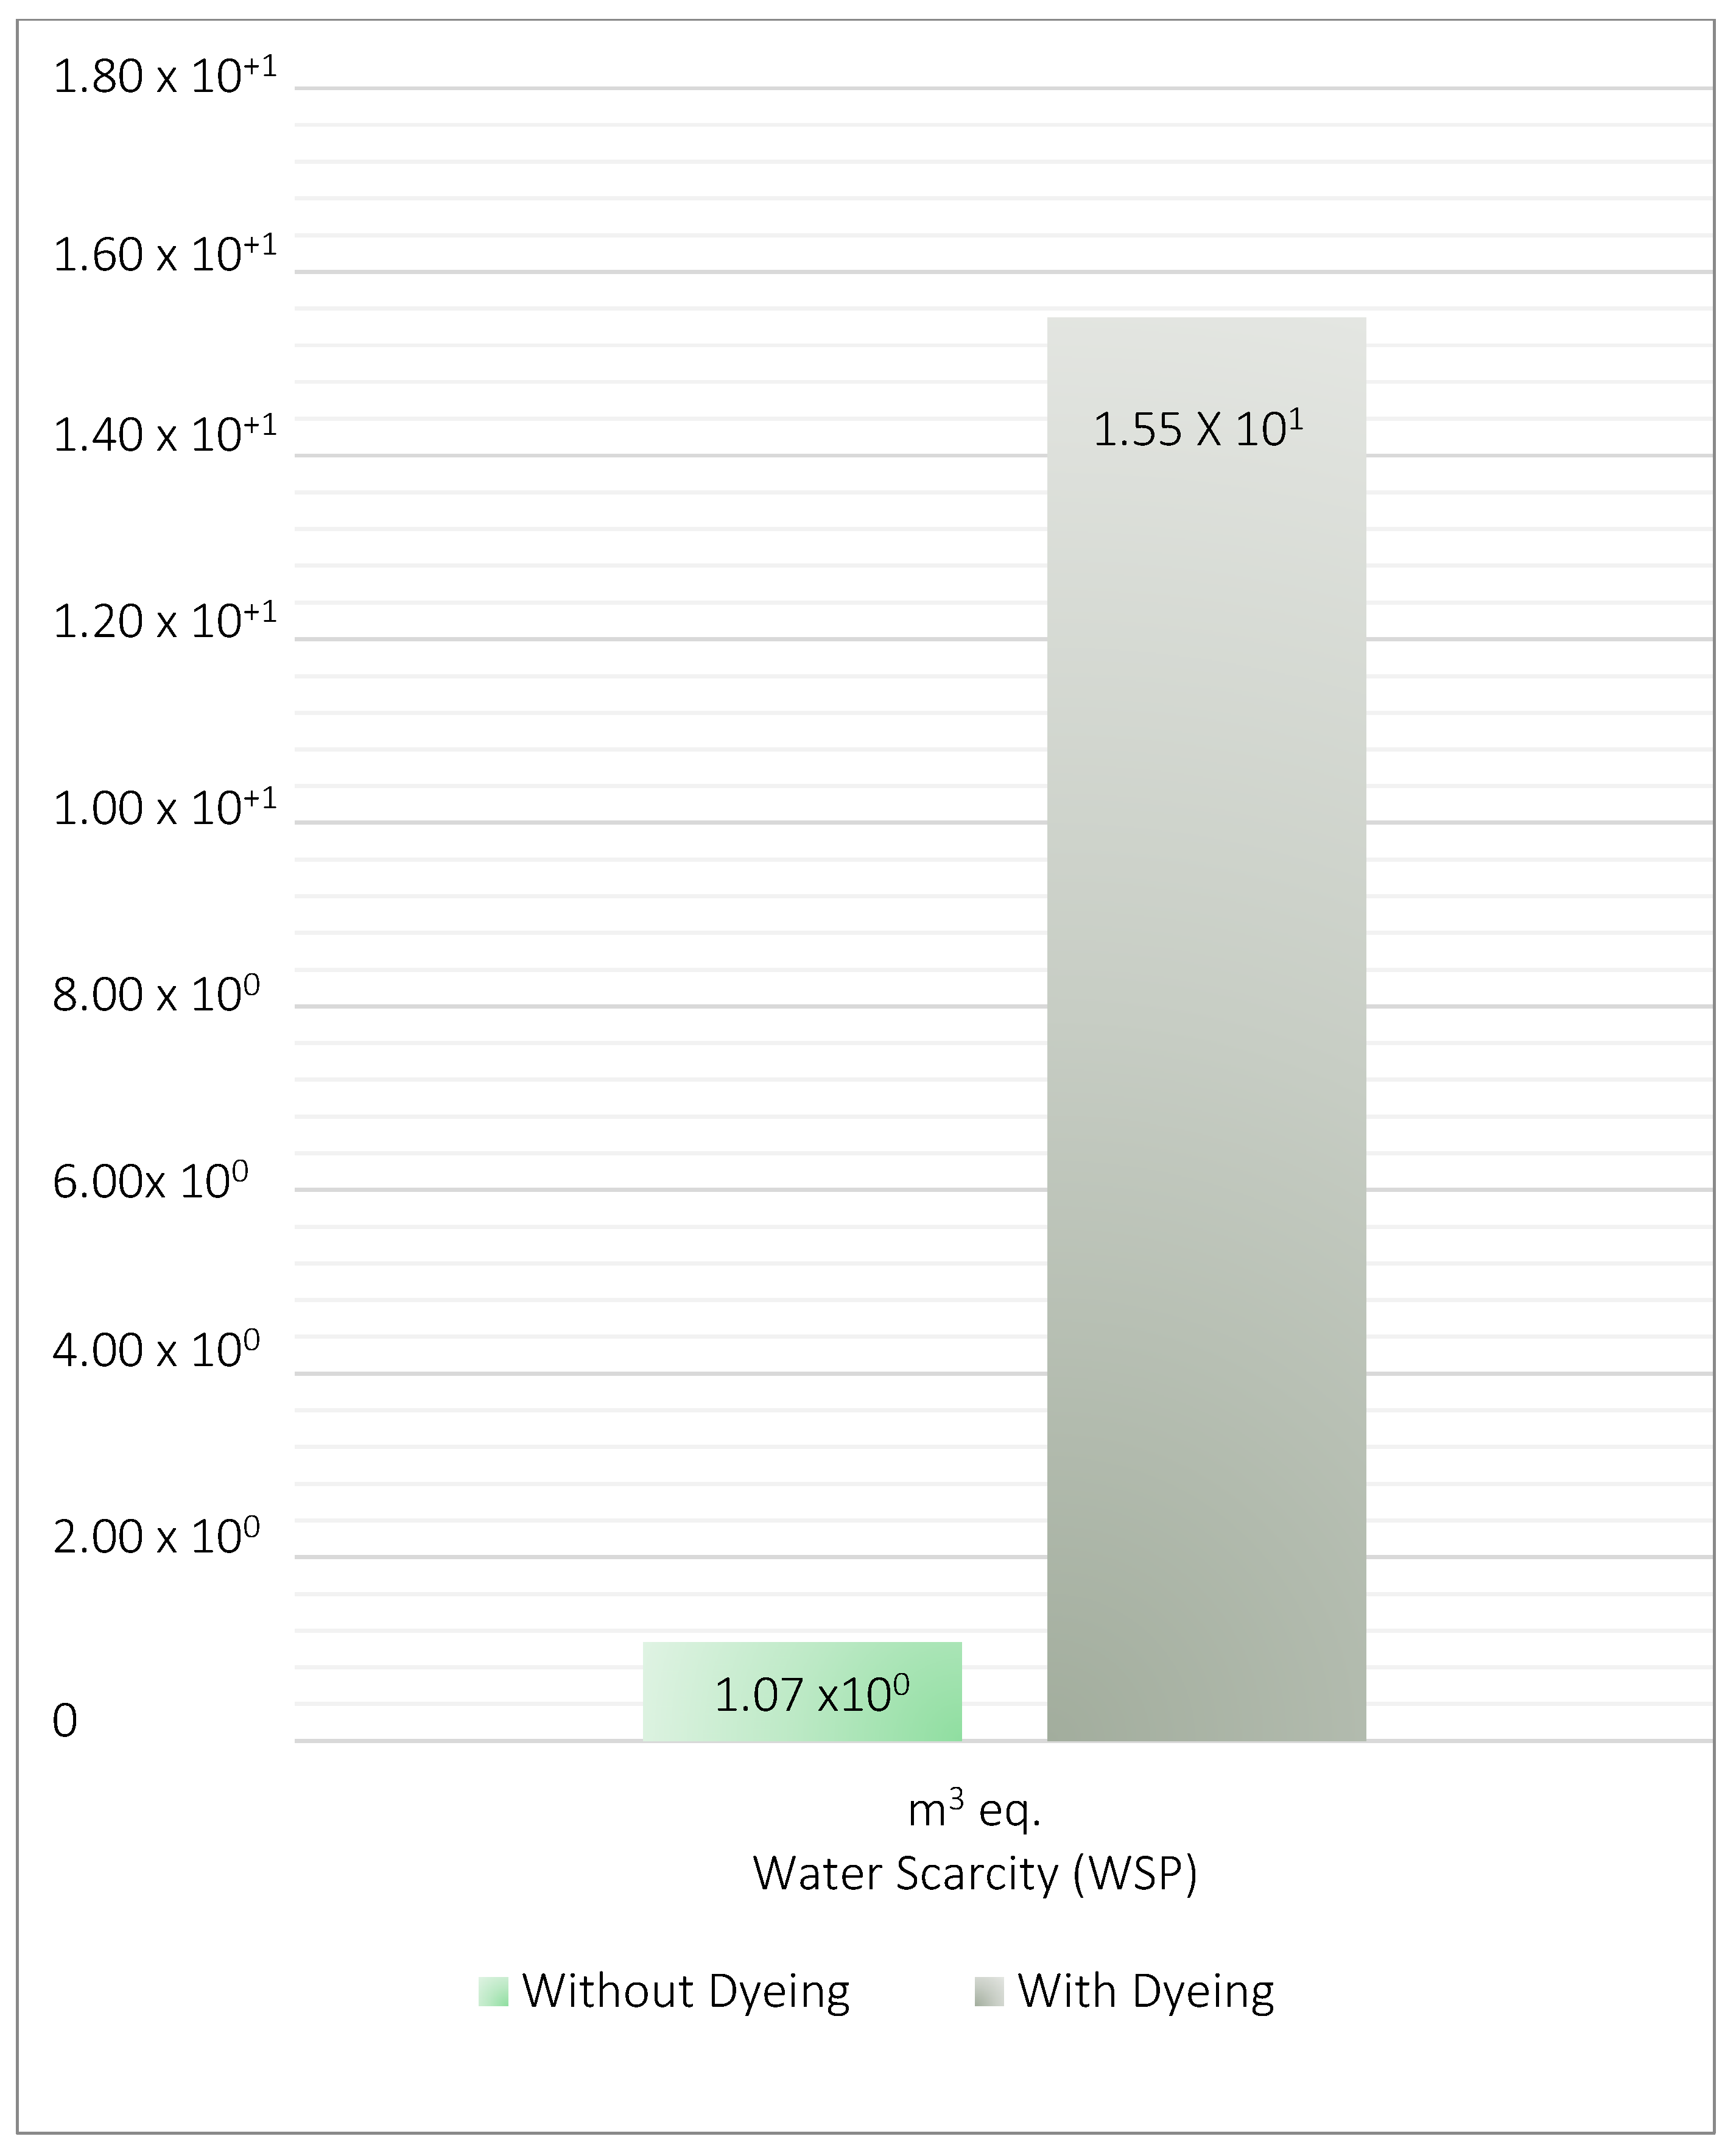
| Water scarcity potential (WSP) | m3 eq | 93% |
| Ozone layer depletion potential (ODP) | kg CFC-11 eq | 75% |
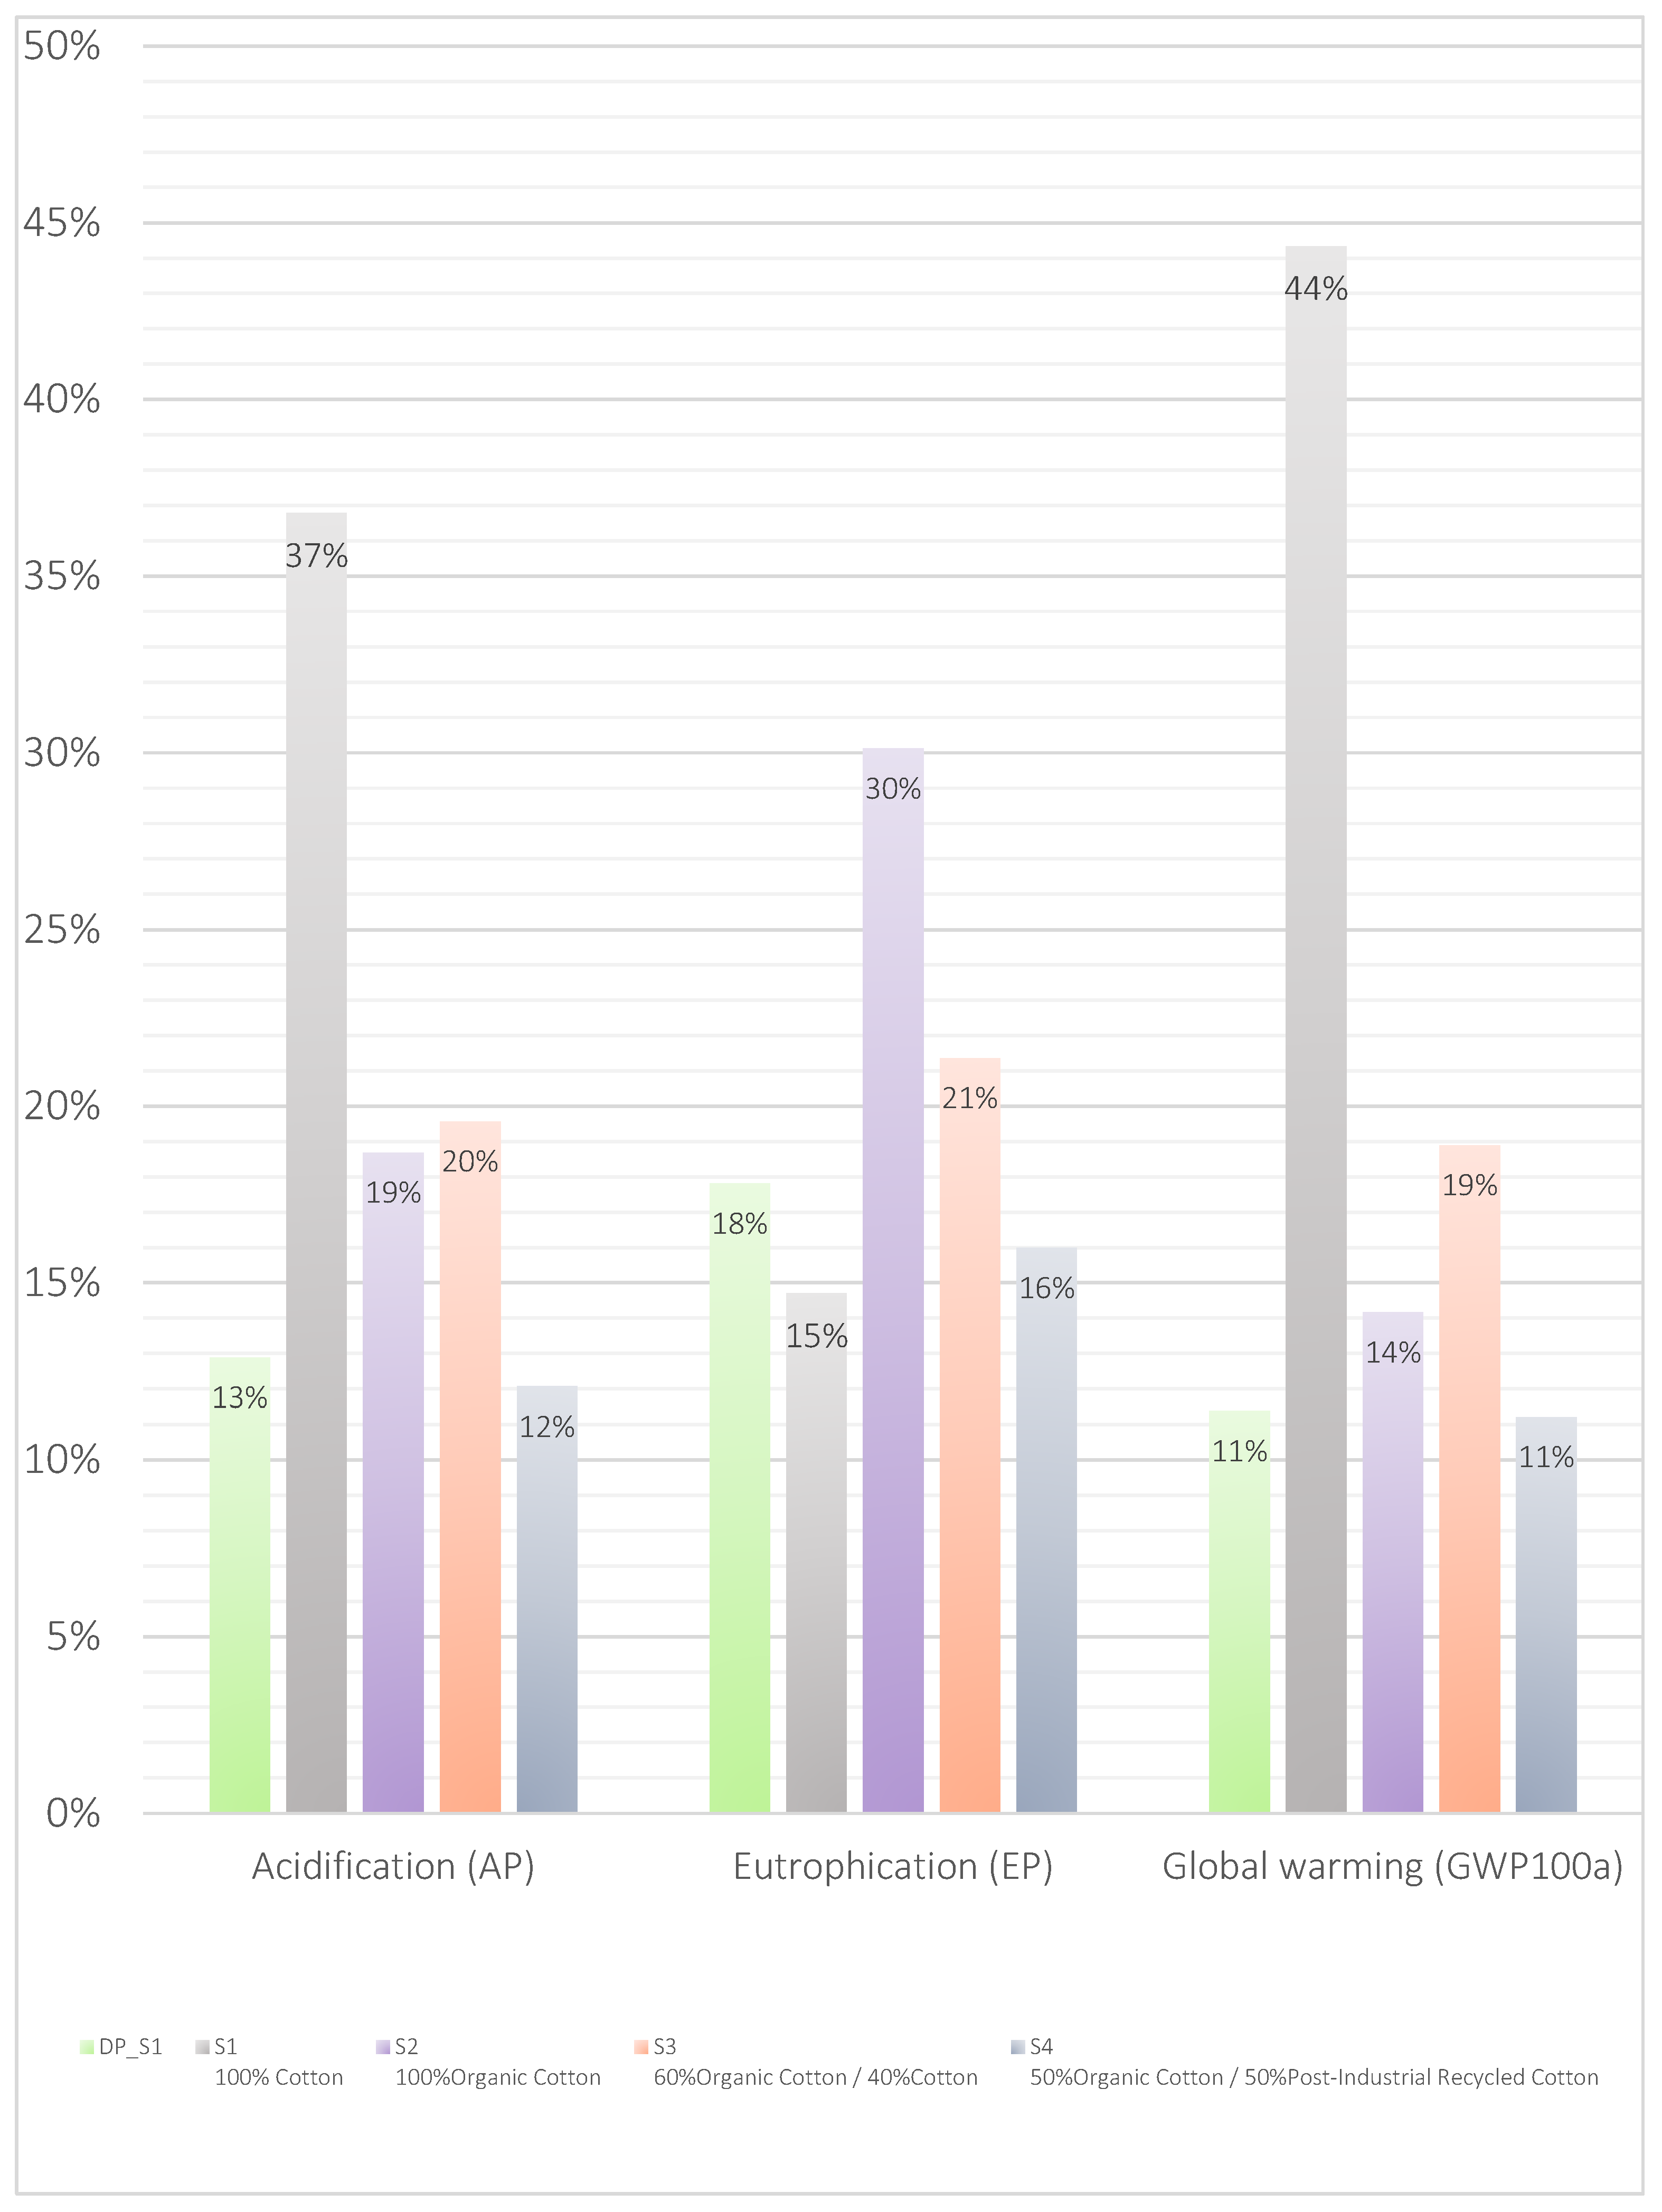
| Impact Category | S1 100% Cotton | S2 100% Organic Cotton | S3 60% Organic Cotton/40% Cotton | S4 50% Organic Cotton/50% Post-Industrial Recycled Cotton |
|---|---|---|---|---|
| Acidification potential (AP) | 65% | 31% | 34% | −7% |
| Eutrophication potential (EP) | −21% | 41% | 17% | −11% |
| Global warming potential (GWP100a) | 74% | 20% | 40% | −2% |
| Photochemical oxidation potential (POFP) | 77% | 26% | 44% | −4% |
| Abiotic depletion potential—elements (ADP-E) | 92% | 29% | 70% | 3% |
| Abiotic depletion potential—fossil fuels (ADP-FR) | 75% | 15% | 40% | −1% |
| Water scarcity potential (WSP) | 97% | 82% | 90% | 82% |
| Ozone layer depletion potential (ODP) | 84% | 25% | 54% | −4% |
| Test | Knit Structures | |||
|---|---|---|---|---|
| S1 100% Cotton | S2 100% Organic Cotton | S4 50% Organic Cotton/50% Recycled Cotton V.360 (Post-Industrial) | DS_1 | |
| Weight [g/m2] EN 12127:1997 [44] | 220 | 220 | 215 | 215 |
| Spirality [%] ISO 16322-2:2021 [35] | 1 | 1.9 | 2.1 | 1.9 |
| Shrinkage [%] ISO 5077:2007/ISO 6330:2021 [45] | −6.5/6 | −6/−5.5 | −7/−6 | −4/−6.5 |
| Burst Resistance [kPa] ISO 13938-2:2019 [46] | 558 | 552 | 415 | 496 |
| Pilling Box ISO 12945-1:2020 [36] | 4/5 | 4/5 | 4 | 4 |
Disclaimer/Publisher’s Note: The statements, opinions and data contained in all publications are solely those of the individual author(s) and contributor(s) and not of MDPI and/or the editor(s). MDPI and/or the editor(s) disclaim responsibility for any injury to people or property resulting from any ideas, methods, instructions or products referred to in the content. |
© 2025 by the authors. Licensee MDPI, Basel, Switzerland. This article is an open access article distributed under the terms and conditions of the Creative Commons Attribution (CC BY) license (https://creativecommons.org/licenses/by/4.0/).
Share and Cite
Santos, R.; Abreu, M.J. Impact Assessment and Product Life Cycle Analysis of Different Jersey Fabrics Using Conventional, Post-Industrial, and Post-Consumer Recycled Cotton Fibers. Sustainability 2025, 17, 5700. https://doi.org/10.3390/su17135700
Santos R, Abreu MJ. Impact Assessment and Product Life Cycle Analysis of Different Jersey Fabrics Using Conventional, Post-Industrial, and Post-Consumer Recycled Cotton Fibers. Sustainability. 2025; 17(13):5700. https://doi.org/10.3390/su17135700
Chicago/Turabian StyleSantos, Rute, and Maria José Abreu. 2025. "Impact Assessment and Product Life Cycle Analysis of Different Jersey Fabrics Using Conventional, Post-Industrial, and Post-Consumer Recycled Cotton Fibers" Sustainability 17, no. 13: 5700. https://doi.org/10.3390/su17135700
APA StyleSantos, R., & Abreu, M. J. (2025). Impact Assessment and Product Life Cycle Analysis of Different Jersey Fabrics Using Conventional, Post-Industrial, and Post-Consumer Recycled Cotton Fibers. Sustainability, 17(13), 5700. https://doi.org/10.3390/su17135700