
Multidimensional Risk Assessment in Sustainable Coal Supply Chains for China’s Low-Carbon Transition: An AHP-FCE Framework


Abstract
1. Introduction
2. Literature Review
2.1. The Integration Framework of Sustainable Supply Chain Risk Management (SSCRM) and MCDM
2.2. Risk Management of Sustainable Coal Supply Chain
2.2.1. Economic Risks
2.2.2. Risks of Safe Operation
2.2.3. Ecological and Environmental Risks
2.2.4. Managing Policy Risks
2.2.5. Demand Risk
2.2.6. Sustainable Supply Risk
2.2.7. Information Technology Risks
2.2.8. Social Risks
3. Research Framework and Evaluation Index System
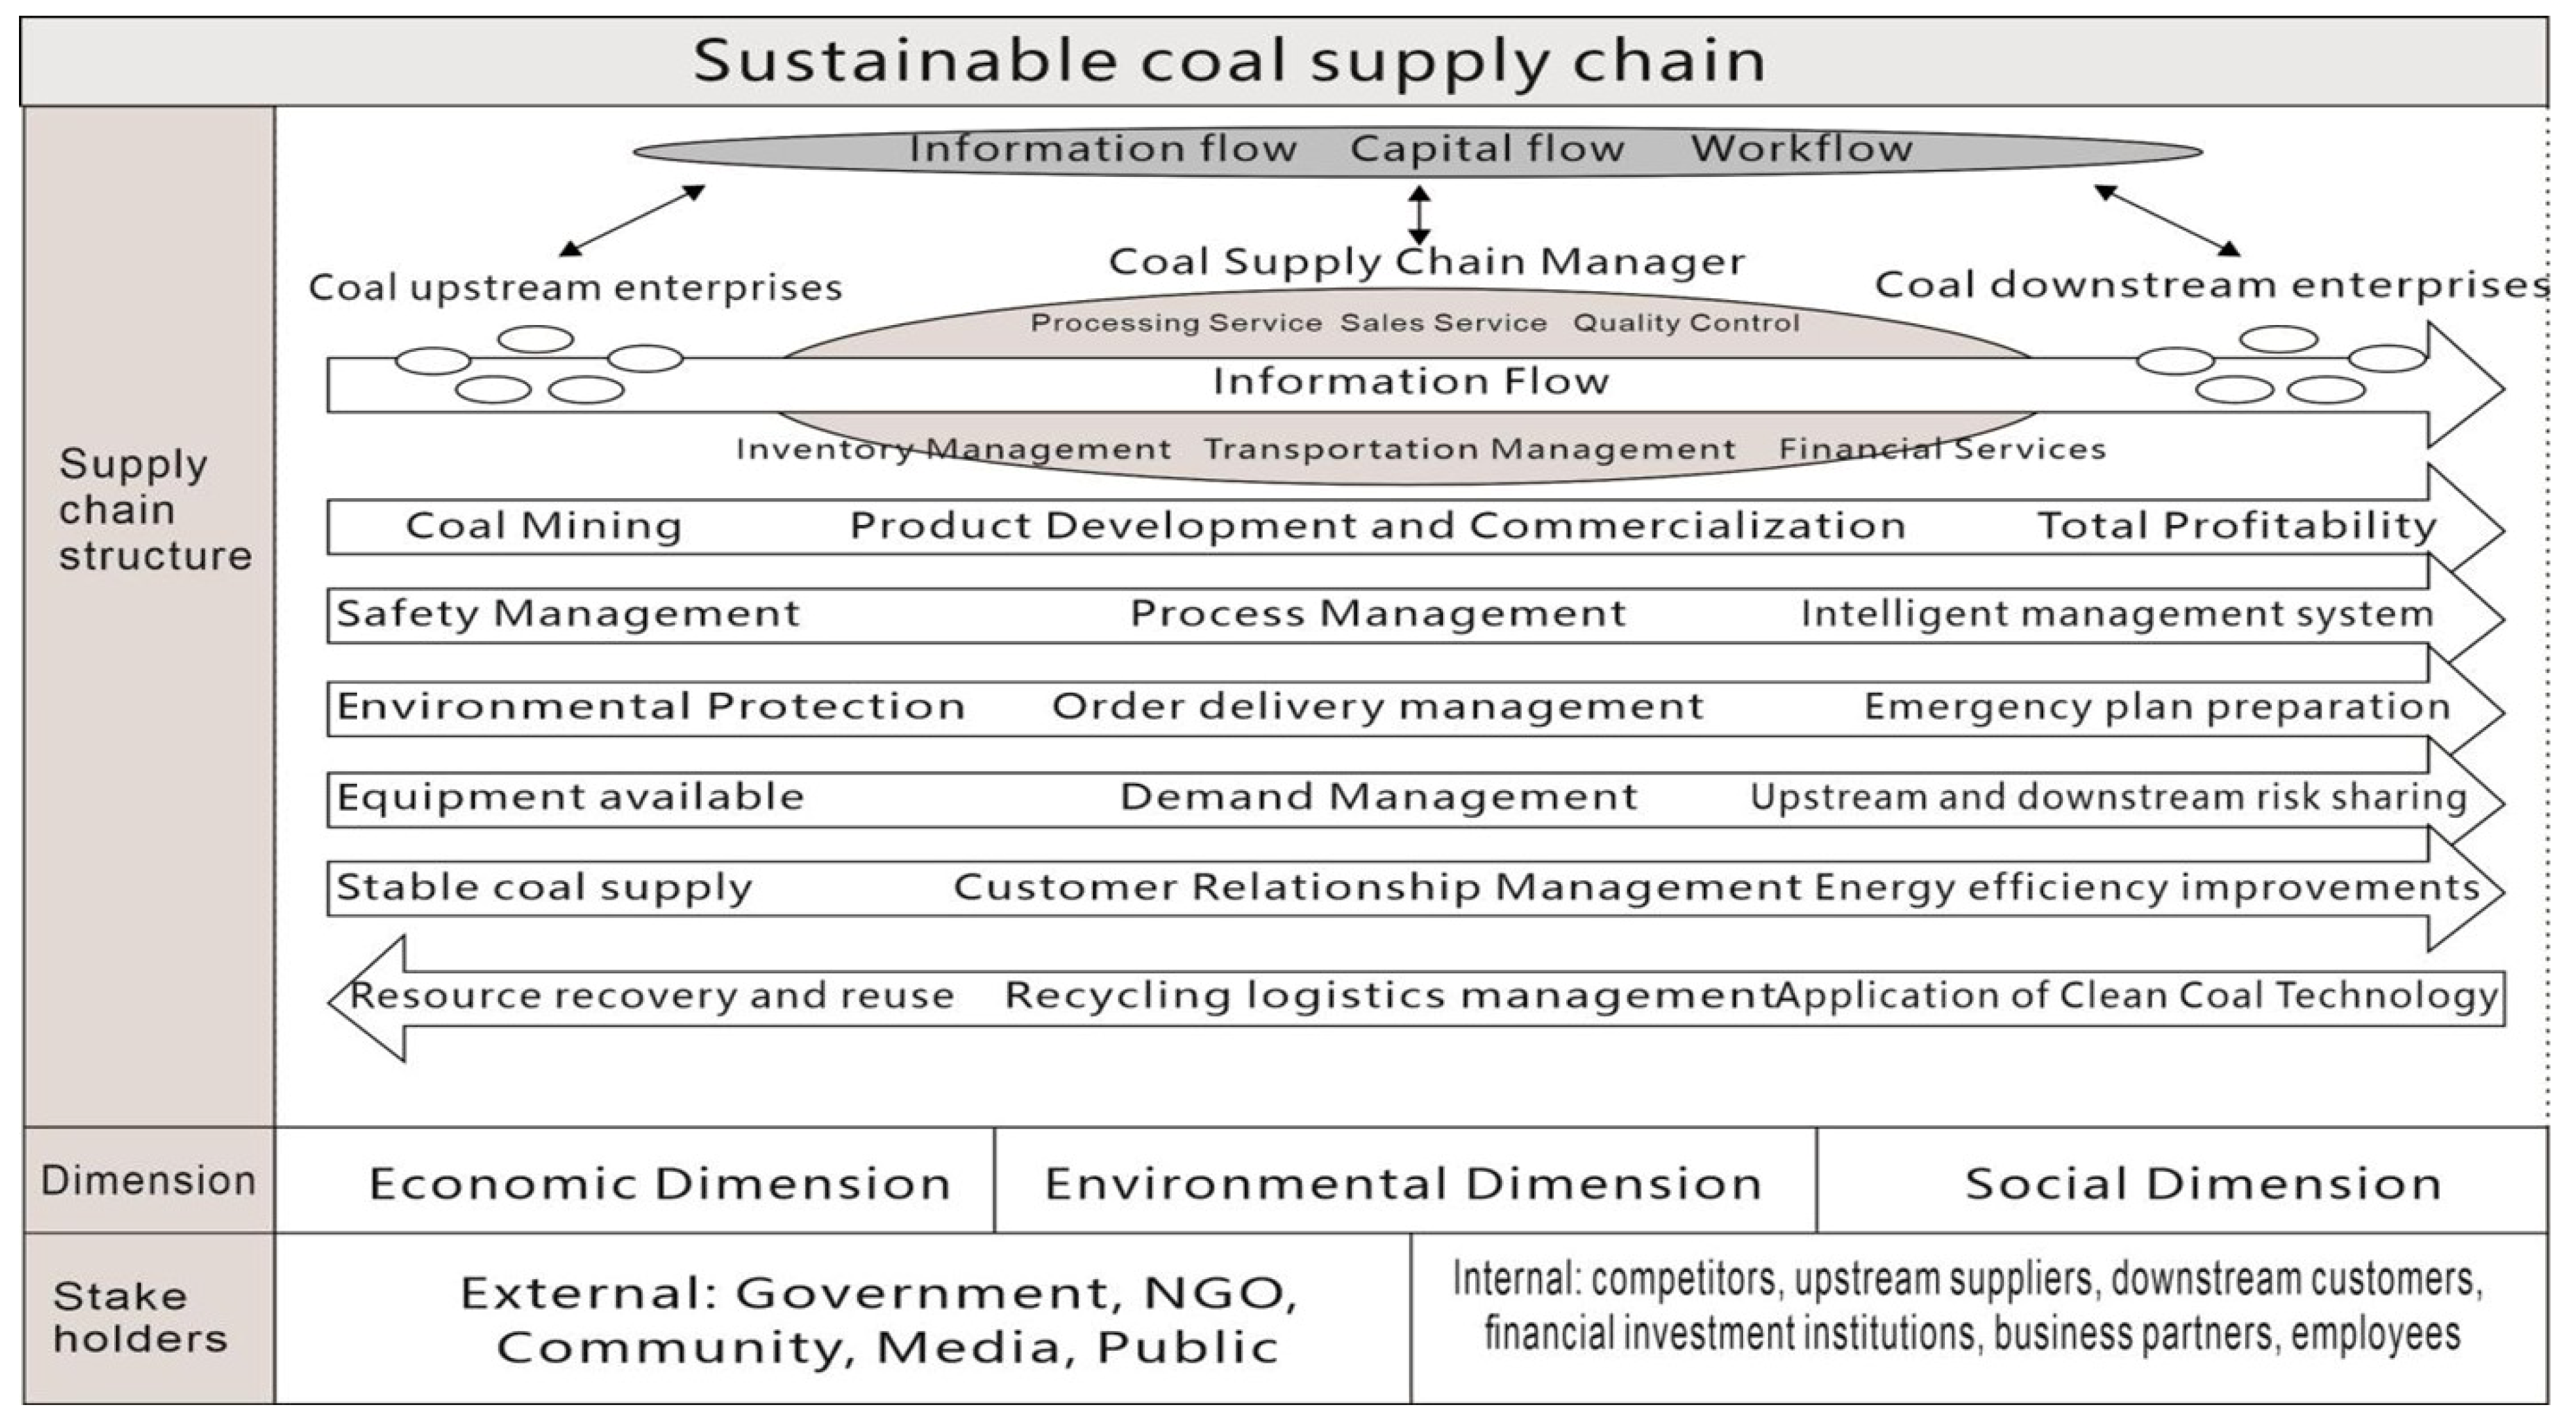
3.1. Research Framework
3.2. Evaluation Index System
3.2.1. Preliminary Selection of Evaluation Indicators
3.2.2. Optimization of Evaluation Indicators
4. Method
4.1. Subjective Weights Based on AHP Method
4.2. Comprehensive Evaluation Based on the FCE Method
5. Comprehensive Evaluation of Coal Sustainable Supply Chain Risks
5.1. Calculation and Testing of Index Layer Weight
5.2. Risk Assessment of Sustainable Coal Supply Chain
5.2.1. Case Study Company
5.2.2. FCE
6. Results and Discussion
6.1. Result
6.1.1. Overall Results Analysis
6.1.2. Analysis of Secondary Indicator Results
6.2. Discussion
7. Conclusions
Author Contributions
Funding
Institutional Review Board Statement
Informed Consent Statement
Data Availability Statement
Conflicts of Interest
Appendix A

| Primary Criteria | B1 | B2 | B3 | B4 | B5 | B6 | B7 | B8 |
| B1 | 1 | 1/3 | 1 | 2 | 3 | 1 | 4 | 1/2 |
| B2 | 3 | 1 | 2 | 4 | 5 | 3 | 6 | 1 |
| B3 | 1 | 1/2 | 1 | 3 | 4 | 2 | 5 | 1/2 |
| B4 | 1/2 | 1/4 | 1/3 | 1 | 2 | 1/2 | 3 | 1/3 |
| B5 | 1/3 | 1/5 | 1/4 | 1/2 | 1 | 1/2 | 2 | 1/4 |
| B6 | 1 | 1/3 | 1/2 | 2 | 2 | 1 | 2 | 1/3 |
| B7 | 1/4 | 1/6 | 1/3 | 1/3 | 1/2 | 1/2 | 1 | 1/5 |
| B8 | 2 | 1 | 3 | 4 | 4 | 3 | 5 | 1 |
| B1 | C1 | C2 | C3 | C4 | C5 |
| C1 | 1 | 2 | 4 | 2 | 3 |
| C2 | 1/2 | 1 | 3 | 2 | 2 |
| C3 | 1/4 | 1/3 | 1 | 1/2 | 1/2 |
| C4 | 1/2 | 1/2 | 2 | 1 | 2 |
| C5 | 1/3 | 1/2 | 2 | 1/2 | 1 |
| B2 | C6 | C7 | C8 | C9 | C10 |
| C6 | 1 | 1/2 | 2 | 2 | 1/3 |
| C7 | 2 | 1 | 2 | 3 | 1 |
| C8 | 1/2 | 1/2 | 1 | 1 | 1/3 |
| C9 | 1/2 | 1/3 | 1 | 1 | 1/4 |
| C10 | 3 | 1 | 3 | 4 | 1 |
| B3 | C11 | C12 | C13 | C14 |
| C11 | 1 | 1 | 2 | 1/2 |
| C12 | 1 | 1 | 1 | 1/2 |
| C13 | 1/2 | 1 | 1 | 1/3 |
| C14 | 2 | 2 | 3 | 1 |
| B4 | C15 | C16 | C17 | C18 | C19 |
| C15 | 1 | 2 | 4 | 3 | 2 |
| C16 | 1/2 | 1 | 3 | 2 | 1 |
| C17 | 1/4 | 1/3 | 1 | 1/2 | 1/2 |
| C18 | 1/3 | 1/2 | 2 | 1 | 1/2 |
| C19 | 1/2 | 1 | 2 | 2 | 1 |
| B5 | C20 | C21 | C22 | C23 | C24 |
| C20 | 1 | 1 | 3 | 3 | 2 |
| C21 | 1 | 1 | 2 | 3 | 2 |
| C22 | 1/3 | 1/2 | 1 | 2 | 1/2 |
| C23 | 1/3 | 1/3 | 1/2 | 1 | 1/3 |
| C24 | 1/2 | 1/2 | 2 | 3 | 1 |
| B6 | C25 | C26 | C27 | C28 | C29 | C30 | C31 |
| C25 | 1 | 2 | 1 | 3 | 1/2 | 4 | 5 |
| C26 | 1/2 | 1 | 1 | 2 | 1/3 | 2 | 3 |
| C27 | 1 | 1 | 1 | 2 | 1/2 | 3 | 3 |
| C28 | 1/3 | 1/2 | 1/2 | 1 | 1/3 | 1 | 2 |
| C29 | 2 | 3 | 2 | 3 | 1 | 4 | 5 |
| C30 | 1/4 | 1/2 | 1/3 | 1 | 1/4 | 1 | 2 |
| C31 | 1/5 | 1/3 | 1/3 | 1/2 | 1/5 | 1/2 | 1 |
| B7 | C32 | C33 | C34 | C35 | C36 |
| C32 | 1 | 1 | 1/2 | 1/3 | 1/3 |
| C33 | 1 | 1 | 1/2 | 1/3 | 1/4 |
| C34 | 2 | 2 | 1 | 1 | 1/2 |
| C35 | 3 | 3 | 1 | 1 | 1 |
| C36 | 3 | 4 | 2 | 1 | 1 |
| B8 | C37 | C38 | C39 | C40 |
| C37 | 1 | 1 | 2 | 2 |
| C38 | 1 | 1 | 2 | 2 |
| C39 | 1/2 | 1/2 | 1 | 2 |
| C40 | 1/2 | 1/2 | 1/2 | 1 |
References
- Sivageerthi, T.; Bathrinath, S.; Uthayakumar, M.; Bhalaji, R.K.A. A SWARA method to analyze the risks in coal supply chain management. Mater. Today Proc. 2022, 50, 935–940. [Google Scholar] [CrossRef]
- Silvia, F.; Talia, V.; Di Matteo, M. Coal mining and policy responses: Are externalities appropriately addressed? A meta-analysis. Environ. Sci. Policy 2021, 126, 39–47. [Google Scholar] [CrossRef]
- Ma, J.; Yuan, Y.; Zhao, S.; Wu, W. Research on Sustainability Evaluation of China’s Coal Supply Chain from the Perspective of Dual Circulation New Development Pattern. Sustainability 2022, 14, 9129. [Google Scholar] [CrossRef]
- Flores, R.M.; Moore, T.A. Coal and Coalbed Gas: Future Directions and Opportunities; Elsevier: Amsterdam, The Netherlands, 2024. [Google Scholar]
- Zhao, X.F.; Li, S.J. Environmental uncertainty, supply chain, and stability of sustainable green innovation: Based on micro evidence from energy-intensive enterprises. J. Environ. Manag. 2024, 372, 123398. [Google Scholar] [CrossRef]
- Liu, B.; Zhao, F. The Impact of the EU Carbon Border Adjustment Mechanism on China’s Exports and Policy Recommendations. J. Tsinghua Univ. (Philos. Socia Sci.) 2021, 36, 185–194. [Google Scholar]
- Ayaz, M.; Jehan, N.; Nakonieczny, J.; Mentel, U.; Uz Zaman, Q. Health costs of environmental pollution faced by underground coal miners: Evidence from Balochistan, Pakistan. Resour. Policy 2022, 76, 102536. [Google Scholar] [CrossRef]
- Zhang, F.; Lu, J.; Chen, L. When green recovery fails to consider coal pushback: Exploring global coal rebounds, production, and policy retrenchment post COVID-19. Energy Res. Soc. Sci. 2023, 101, 103142. [Google Scholar] [CrossRef]
- Sakib, N.; Hossain, N.U.I.; Nur, F.; Talluri, S.; Jaradat, R.; Lawrence, J.M. An assessment of probabilistic disaster in the oil and gas supply chain leveraging Bayesian belief network. Int. J. Prod. Econ. 2021, 235, 108107. [Google Scholar] [CrossRef]
- Zhao, D.; Sibt E-Ali, M.; Omer Chaudhry, M.; Ayub, B.; Waqas, M.; Ullah, I. Modeling the Nexus between geopolitical risk, oil price volatility and renewable energy investment; evidence from Chinese listed firms. Renew. Energy 2024, 225, 120309. [Google Scholar] [CrossRef]
- Wang, J.M.; Yang, M.; Liu, B.; Zhu, Q.P. Research Progress on Carbon Sources/Sinks and Emission Reduction/Carbon Sequestration Enhancement in Green Mine Construction. J. China Coal Soc. 2024, 49, 1597–1610. [Google Scholar]
- Du, K.R.; Li, M.Y.; Wang, S.Q.; Lin, B.Q. Corporate Financing Constraints Under the Overlapping Impacts of Coal Price Shocks and New Energy Business Expansion. Econ. Res. J. 2024, 59, 4–20. [Google Scholar]
- Zhu, N.; Sun, C.H.; Xu, Y.X. The Impact of Green Finance on the Resilience of the Coal Industry Chain: A Quasi-Natural Experiment Based on Green Financial Reform and Innovation Pilot Zones. Theory Pract. Financ. Econ. 2024, 45, 27–34. [Google Scholar]
- Nie, H.H.; Gui, L.; Ruan, R. Balancing Safety and Efficiency: Evidence from China’s Coal Industry. World Econ. 2025, 48, 59–89. [Google Scholar]
- Carter, C.R.; Rogers, D.S. A framework of sustainable supply chain management: Moving toward new theory. Int. J. Phys. Distrib. Log. 2008, 38, 360–387. [Google Scholar] [CrossRef]
- Seuring, S.; Müller, M. From a literature review to a conceptual framework for sustainable supply chain management. J. Clean. Prod. 2008, 16, 1699–1710. [Google Scholar] [CrossRef]
- Moktadir, M.A.; Paul, S.K.; Bai, C.G.; Gonzalez, E. The current and future states of MCDM methods in sustainable supply chain risk assessment. Environ. Dev. Sustain. 2025, 27, 7435–7480. [Google Scholar] [CrossRef]
- Govindan, K.; Jepsen, M.B. Supplier risk assessment based on trapezoidal intuitionistic fuzzy numbers and ELECTRE TRI-C: A case illustration involving service suppliers. J. Oper. Res. Soc. 2016, 67, 339–376. [Google Scholar] [CrossRef]
- Chen, Z.W.; Yildizbasi, A.; Wang, Y.; Sarkis, J. Safety in lithium-ion battery circularity activities: A framework and evaluation methodology. Resour. Conserv. Recycl. 2023, 193, 106962. [Google Scholar] [CrossRef]
- Yazdani, M.; Gonzalez, E.D.R.S.; Chatterjee, P. A multi-criteria decision-making framework for agriculture supply chain risk management under a circular economy context. Manag. Decis. 2021, 59, 1801–1826. [Google Scholar] [CrossRef]
- Moktadir, M.A.; Ali, S.M.; Rajesh, R.; Paul, S.K. Modeling the interrelationships among barriers to sustainable supply chain management in leather industry. J. Clean. Prod. 2018, 181, 631–651. [Google Scholar] [CrossRef]
- Ganguly, K.; Kumar, G. Supply Chain Risk Assessment: A fuzzy AHP approach. Oper. Supply Chain. Manag. 2019, 12, 1–13. [Google Scholar] [CrossRef]
- Soyer, A.; Bozdag, E.; Kadaifci, C.; Asan, U.; Serdarasan, S. A hesitant approach to sustainable supply chain risk assessment. J. Clean. Prod. 2023, 418, 138103. [Google Scholar] [CrossRef]
- Rajesh, R.; Ravi, V. Analyzing drivers of risks in electronic supply chains: A grey-DEMATEL approach. Int. J. Adv. Manuf. Technol. 2017, 92, 1127–1145. [Google Scholar] [CrossRef]
- Wang, Y.; Hao, H.X. Research on the Supply Chain risk Assessment of the Fresh Agricultural Products based on the Improved TOPTSIS Algorithm. Chem. Eng. Trans. 2016, 51, 445–450. [Google Scholar]
- Mangla, S.K.; Luthra, S.; Jakhar, S. Benchmarking the risk assessment in green supply chain using fuzzy approach to FMEA. Benchmarking Int. J. 2018, 25, 2660–2687. [Google Scholar] [CrossRef]
- Rostamzadeh, R.; Ghorabaee, M.K.; Govindan, K.; Esmaeili, A.; Nobar, H.B.K. Evaluation of sustainable supply chain risk management using an integrated fuzzy TOPSIS-CRITIC approach. J. Clean. Prod. 2018, 175, 651–669. [Google Scholar] [CrossRef]
- Alshehri, S.M.A.; Jun, W.X.; Shah, S.A.A.; Solangi, Y.A. Analysis of core risk factors and potential policy options for sustainable supply chain: An MCDM analysis of Saudi Arabia’s manufacturing industry. Environ. Sci. Pollut. Res. 2022, 29, 25360–25390. [Google Scholar] [CrossRef]
- Moktadir, M.A.; Dwivedi, A.; Khan, N.S.; Paul, S.K.; Khan, S.A.; Ahmed, S.; Sultana, R. Analysis of risk factors in sustainable supply chain management in an emerging economy of leather industry. J. Clean. Prod. 2021, 283, 124641. [Google Scholar] [CrossRef]
- Amin, F.U.; Dong, Q.; Grzybowska, K.; Ahmed, Z.; Yan, B. A Novel Fuzzy-Based VIKOR-CRITIC Soft Computing Method for Evaluation of Sustainable Supply Chain Risk Management. Sustainability 2022, 14, 2827. [Google Scholar] [CrossRef]
- Tarei, P.K.; Thakkar, J.J.; Nag, B. A hybrid approach for quantifying supply chain risk and prioritizing the risk drivers: A case of Indian petroleum supply chain. J. Manuf. Technol. Manag. 2018, 29, 533–569. [Google Scholar] [CrossRef]
- Feng, J.Y.; Yuan, B.Y.; Li, X.; Tian, D.; Mu, W.S. Evaluation on risks of sustainable supply chain based on optimized BP neural networks in fresh grape industry. Comput. Electron. Agric. 2021, 183, 105988. [Google Scholar]
- Ju, H. Research on the Risk Assessment of Hazardous Chemical Supply Chain and the Application. Chem. Eng. Trans. 2017, 59, 1123–1128. [Google Scholar]
- Xu, J.; Tian, Y. Corporate Social Responsibility Risk Assessment Based on Sustainable Supply Chain Management. Chin. J. Manag. Sci. 2014, 22, 396–403. [Google Scholar]
- Giannakis, M.; Papadopoulos, T. Supply chain sustainability: A risk management approach. Int. J. Prod. Econ. 2016, 171, 455–470. [Google Scholar] [CrossRef]
- Song, W.; Ming, X.; Liu, H. Identifying critical risk factors of sustainable supply chain management: A rough strength-relation analysis method. J. Clean. Prod. 2017, 143, 100–115. [Google Scholar] [CrossRef]
- Valinejad, F.; Rahmani, D. Sustainability risk management in the supply chain of telecommunication companies: A case study. J. Clean. Prod. 2018, 203, 53–67. [Google Scholar] [CrossRef]
- Erdil, A.; Taçgın, E. Potential Risks and Their Analysis of the Apparel & Textile Industry in Turkey: A Quality-Oriented Sustainability Approach. Fibres Text. East. Eur. 2018, 26, 30–42. [Google Scholar]
- Xu, M.; Cui, Y.; Hu, M.; Xu, X.; Zhang, Z.; Liang, S.; Qu, S. Supply chain sustainability risk and assessment. J. Clean. Prod. 2019, 225, 857–867. [Google Scholar] [CrossRef]
- Abdel-Basset, M.; Mohamed, R. A novel plithogenic TOPSIS-CRITIC model for sustainable supply chain risk management. J. Clean. Prod. 2020, 247, 119586. [Google Scholar] [CrossRef]
- Zhang, X.; Sun, B.; Chen, X.; Chu, X.; Yang, J. An approach to evaluating sustainable supply chain risk management based on BWM and linguistic value soft set theory. IFS 2020, 39, 4369–4382. [Google Scholar] [CrossRef]
- Elmsalmi, M.; Hachicha, W.; Aljuaid, A.M. Prioritization of the Best Sustainable Supply Chain Risk Management Practices Using a Structural Analysis Based-Approach. Sustainability 2021, 13, 4608. [Google Scholar] [CrossRef]
- Chen, W.; Nalluri, V.; Ma, S.; Lin, M.; Lin, C. An Exploration of the Critical Risk Factors in Sustainable Telecom Services: An Analysis of Indian Telecom Industries. Sustainability 2021, 13, 445. [Google Scholar] [CrossRef]
- Kalantari, F.; Hosseininezhad, S.J. A Multi-objective Cross Entropy-based algorithm for sustainable global food supply chain with risk considerations: A case study. Comput. Ind. Eng. 2022, 164, 107766. [Google Scholar] [CrossRef]
- Hashim, M.; Nazam, M.; Zia-ur-Rehman, M.; Abrar, M.; Baig, S.A.; Nazim, M.; Hussain, Z. Modeling Supply Chain Sustainability-Related Risks and Vulnerability: Insights from the Textile Sector of Pakistan. Autex Res. J. 2022, 22, 123–134. [Google Scholar] [CrossRef]
- Hsu, C.; Li, M.; Zhang, T.; Chang, A.; Shangguan, S.; Liu, W. Deploying Big Data Enablers to Strengthen Supply Chain Resilience to Mitigate Sustainable Risks Based on Integrated HOQ-MCDM Framework. Mathematics 2022, 10, 1233. [Google Scholar] [CrossRef]
- Zhu, T.; Liu, G.C. A Novel Hybrid Methodology to Study the Risk Management of Prefabricated Building Supply Chains: An Outlook for Sustainability. Sustainability 2023, 15, 361. [Google Scholar] [CrossRef]
- Lu, T.; Zhang, M.Z.; Liu, X.Y. Analysis and Empirical Study on Influencing Factors of Coal Supply Guarantee Based on Supply Chain. Stat. Decis. 2016, 58–62. [Google Scholar] [CrossRef]
- Zhou, Y.; Guo, M. Empirical Investigation into the Driving Factors of Sustainable Supply Chain Management: A Comparative Analysis of Coal and Agricultural Supply Chains. J. Commer. Biotechnol. 2024, 29, 304–319. [Google Scholar]
- Wang, N.; Zhang, J.; Wu, D.; Zhao, W.J. Spatiotemporal Patterns and Driving Forces of Global Coal Resource Flows. J. Nat. Resour. 2019, 34, 487–500. [Google Scholar]
- Baruya, P. Production and Supply Chain Costs of Coal; IEA Clean Coal Centre: London, UK, 2018; Volume 2. [Google Scholar] [CrossRef]
- Rioux, B.; Galkin, P.; Murphy, F.; Pierru, A. Economic impacts of debottlenecking congestion in the Chinese coal supply chain. Energ. Econ. 2016, 60, 387–399. [Google Scholar] [CrossRef]
- Wang, S.M.; Sun, Q.; Qiao, J.W.; Wang, S.Q. Geological guarantee of coal green mining. J. China Coal Soc. 2020, 45, 8–15. [Google Scholar]
- Wang, B.; He, L.; Yuan, X.; Sun, Z.; Liu, P. Carbon emissions of coal supply chain: An innovative perspective from physical to economic. J. Clean. Prod. 2021, 295, 126377. [Google Scholar] [CrossRef]
- Hou, Z.M.; Xiong, Y.; Liu, J.H.; Cao, C.; Fang, Y.L.; Zhang, R.Q.; Hou, W.Y.; Tang, J.W. Strategic Pathways, Technological Roadmaps, and Action Plans for Carbon Peak and Neutrality in Henan Province. Adv. Eng. Sci. 2022, 54, 23–36. [Google Scholar]
- Yun, N.Y.; Ülkü, M.A. Sustainable Supply Chain Risk Management in a Climate-Changed World: Review of Extant Literature, Trend Analysis, and Guiding Framework for Future Research. Sustainability 2023, 15, 13199. [Google Scholar] [CrossRef]
- Zhang, L.J.; Fu, S.K.; Tian, J.L.; Peng, J.C. A Review of Energy Industry Chain and Energy Supply Chain. Energies 2022, 15, 9246. [Google Scholar] [CrossRef]
- Sun, H.; Yang, Q.; Wu, Y. Evaluation and Design of Reusable Takeaway Containers Based on the AHP-FCE Model. Sustainability 2023, 15, 2191. [Google Scholar] [CrossRef]
- Zhang, F.; Song, W. Sustainability risk assessment of blockchain adoption in sustainable supply chain: An integrated method. Comput. Ind. Eng. 2022, 171, 108378. [Google Scholar] [CrossRef]


| Author | Risk Dimension | Application Method | Research Subject |
|---|---|---|---|
| Moktadir et al. [21] | Environment, technology, knowledge and support, society, financial | Grey DEMATEL | Leather industry |
| Ganguly et al. [22] | Supply risk, financial risk, information risk, manufacturing risk | Fuzzy AHP | |
| Soyer et al. [23] | Supply risk, demand risk, operational risk, competition related risk, political and legal risk, environmental and societal risk, economical risk | Hesitant FCM | General supply chain |
| Wang et al. [25] | Internal risk, external risk, logistics risk, information risk | Improved entropy method combined with TOPSIS | Fresh produce |
| Mangla et al. [26] | supplier perspective, organization perspective, customer perspective, reverse logistics network design | Fuzzy FMEA | Plastic manufacturers |
| Rostamzadeh et al. [27] | Environmental risks, organizational risks, sustainable supply risks, sustainable production risks/manufacturer, sustainable distribution risks, sustainable recycling risks, IT-related risks | Comprehensive fuzzy TOPSIS-CRITIC | Oil industry |
| Moktadir et al. [29] | Social dimension, environmental dimension, economic dimension, technical dimension, institutional dimension | Pareto analysis and BWM | Leather Industry Supply Chain |
| Alshehri et al. [28] | Economic risk, management policy risk and environmental risk. Sub-risks are industrial emissions, market dynamics, management policy failure, financial constraints, and credit uncertainty. | Hesitant AHP and hesitant WASPAS | Saudi Arabia manufacturing |
| Amin et al. [30] | Supply and procurement risks, distribution risks, organizational risks, environmental risks | FUZZY VIKOR-CRITIC | Logistics industry |
| Tarei et al. [31] | Logistics (delivery systems), petroleum product quality, crude oil supply, customer orders, and legal/political regulations | DEMATEL-AHP | India’s oil supply chain |
| Feng et al. [32] | Economic risk, quality risk, technical risk, accident risk, social risk, environmental risk, management decision risk, cooperation risk | GABP and PSO-BP | Grape supply chain |
| Xu&Tian [34] | Stakeholder responsibility, legal responsibility, resource and environmental responsibility, community and government responsibility, philanthropic responsibility | AHP-FCE | Automotive industry |
| Giannakis et al. [35] | Propose endogenous risks and exogenous risks from the three dimensions of economy, society, and environment, and conclude that endogenous risks are the most important | FMEA | Industrial manufacturing and textiles |
| Song et al. [36] | Operational risks, economic risks, environmental risks, and social risks | DEMATEL | Telecommunications companies |
| Valinejad et al. [37] | Technical sustainability, economic sustainability, social sustainability, environmental sustainability, institutional sustainability | Failure mode and effects analysis methodology | Internet service providers |
| Erdil et al. [38] | Environmental problems, economic problems, social problems | FMEA | Clothing and textile industry |
| Xu et al. [39] | Operational risk, social risk, environmental risk | Risk assessment space and materiality analysis | Clothing and automotive industries |
| Abdel-Basset et al. [40] | Financial risk, supply risk factors, environment risk, operational risk, control and plan risk, information-/IT-related risks | TOPSIS-CRITIC | Telecommunications equipment company |
| Zhang et al. [41] | Supply operational risk, economic risk, environmental risk, social risk | BWM and linguistic value soft set theory | Energy industry chain |
| Elmsalmi et al. [42] | Manufacturing risk, risk of upstream and downstream partners, product design risk, supplier risk | MICMAC | |
| Chen et al. [43] | Economic dimension, technological dimension, social dimension, demand dimension, policy dimension, supply dimension, market dimension, natural environment dimension | FDM and ISM | Telecom industry |
| Kalantari et al. [44] | Time delay risk, exchange rate fluctuations, raw material quality, and production quality | Multi-objective cross-entropy algorithm | Food supply chain |
| Hashim et al. [45] | Endogenous: workplace diversity, corporate strategy, operational plan, disruptions, internal stakeholder pressures; exogenous: economic conditions, regulatory compliance, natural calamities, external stakeholder pressure | FMEA and Pareto analysis | Textile industry |
| Hsu et al. [46] | External risks include man-made disasters, environmental disasters, natural disasters, and market trend risks. Internal risks include strategic management risks, information system risks, supplier and customer risks, internal unforeseen risks, internal business risks, and employee risks. | Integrated HOQ-MCDM | Electrical appliance manufacturers |
| Zhu et al. [47] | Environmental risk, organizational risk, technical risk, manage risk, cooperation risk. | WBS-RBS and BP neural network | Prefabricated building supply chain |
| Primary Criteria | Sub-Criteria | References |
|---|---|---|
| Economic Risk | Economic Cycle Risk | Moktadir et al. [21]; Alshehri et al. [28]; Feng et al. [32]; Giannakis et al. [35]; Song et al. [36]; Valinejad et al. [37]; Abdel-Basset et al., 2020 [40]; Zhang et al. [41] |
| Financing Risk | ||
| Financial Constraints | ||
| Solvency Risk | ||
| R&D Investment | ||
| Safety Operation Risk | Natural Disasters | Ganguly et al. [22]; Soyer et al. [23]; Mangla et al. [26]; Alshehri et al. [28]; Feng et al. [32]; Hsu et al. [46]; |
| Safety Production Training | ||
| Mining Technology Upgrade | ||
| Equipment Failure | ||
| Employee Operation Risk | ||
| Ecological Risk | Environmental Governance | Soyer et al. [23];Alshehri et al. [28]; Feng et al. [32]; Zhang et al. [41]; Hashim et al. [45]; Hsu et al. [46]; Zhu et al. [47] |
| Mine Ecological Protection | ||
| Pollution Reduction Risk | ||
| Energy Consumption | ||
| Environmental Accidents | ||
| Policy Risk | Regulatory Compliance | Alshehri et al. [28]; Feng et al. [32]; Hashim et al. [45]; Zhu et al. [47] |
| Legal Risk | ||
| Local Government Supervision | ||
| Coal Industry Access Restrictions | ||
| Corporate Sustainable Development Strategy | ||
| Partner Risk | ||
| Demand Risk | International Energy Market Price Fluctuations | Soyer et al. [23]; Xu et al. [39]; Kalantari et al. [44]; Hsu et al. [46] |
| Coal Industry Cyclicality | ||
| Clean Energy Substitution | ||
| Bullwhip Effect Risk | ||
| Key Customer Disruption | ||
| Sustainable Supply Risk | Supplier Legal Compliance | Soyer et al. [23]; Rostamzadeh et al. [27]; Alshehri et al. [28]; Amin et al. [30]; Zhang et al. [41]; Elmsalmi et al. [42] |
| Supplier Green Commitment | ||
| Supplier Quality Management | ||
| Core Supplier Disruption | ||
| Procurement Cost Risk | ||
| Coal Resource Depletion Risk | ||
| Capacity Constraint Risk | ||
| Logistics and Transportation Risk | ||
| IT Risk | Green Innovation Risk | Rostamzadeh et al. [27]; Moktadir et al. [29]; Feng et al. [32]; Abdel-Basset et al. [40]; Hsu et al. [46]; Zhu et al. [47] |
| Artificial Intelligence Risks | ||
| Digital Supply Chain System Stability | ||
| IoT Device Reliability | ||
| Information System Security | ||
| Data Timeliness | ||
| Social Risk | Employee Health and Safety | Alshehri et al. [28]; Moktadir et al. [29];Feng et al. [32]; Zhang et al. [41];Hashim et al. [45] |
| Employee Compensation and Benefits | ||
| Community Relations Maintenance | ||
| Public Opinion Risk |
| Number | Workplace | Position (Level) | Experience | Work Areas |
|---|---|---|---|---|
| E1 | Coal Enterprises | Assistant to General Manager | 20+ | Business Management and Coordination |
| E2 | Coal Enterprises | Head of Planning Section | 12+ | Corporate Strategic Planning |
| E3 | Coal Enterprises | Sales Company Manager | 20+ | Supply Chain Management |
| E4 | Coal Enterprises | Union Chairman | 15+ | Protecting Workers’ Rights |
| E5 | Coal Enterprises | Production Team Leader | 10+ | Production Front Line |
| E6 | Universities | Professor | 30+ | Coal Mine Safety |
| E7 | Universities | Professor | 15+ | Intelligent Safety Production |
| E8 | Universities | Associate Professor | 10+ | Coal Enterprises Emergency Management |
| E9 | Universities | Professor | 20+ | Supply Chain Management |
| E10 | Universities | Associate Professor | 12+ | Green Supply Chain Management |
| Primary Criteria | Sub-Criteria | AV | CV |
|---|---|---|---|
| Economic Risk | Economic Cycle Risk | 4.4615 | 0.148000215 |
| Financing Risk | 4.2308 | 0.196621295 | |
| Financial Constraints | 4 | 0.176776695 | |
| Solvency Risk | 4.1538 | 0.133607173 | |
| R&D Investment | 4.3077 | 0.17433882 | |
| Safety Operation Risk | Natural Disasters | 4.6154 | 0.140916172 |
| Safety Production Training | 4.7692 | 0.091876635 | |
| Mining Technology Upgrade | 4.3846 | 0.175184641 | |
| Equipment Failure | 4.3846 | 0.148333828 | |
| Employee Operation Risk | 4.9231 | 0.056364636 | |
| Ecological Risk | Environmental governance | 3.0769 | 0.357058653 |
| Mine Ecological Protection | 4.3846 | 0.175184641 | |
| Pollution Reduction Risk | 4.3077 | 0.17433882 | |
| Energy Consumption | 4.6923 | 0.10242836 | |
| Environmental Accidents | 3.9231 | 0.264532157 | |
| Policy Risk | Regulatory Compliance | 4.4615 | 0.116250611 |
| Legal Risk | 4.3846 | 0.175184641 | |
| Local Government Supervision | 3.7692 | 0.245893699 | |
| Coal Industry Access Restrictions | 3.9231 | 0.219865501 | |
| Corporate Sustainable Development Strategy | 4.3846 | 0.148333828 | |
| Partner Risk | 3.5385 | 0.318354953 | |
| Demand Risk | International Energy Market Price Fluctuations | 4.4615 | 0.148000215 |
| Coal Industry Cyclicality | 4.3077 | 0.17433882 | |
| Clean Energy Substitution | 3.8462 | 0.233708128 | |
| Bullwhip Effect Risk | 3.6923 | 0.231559023 | |
| Key Customer Disruption | 4.0769 | 0.211571132 | |
| Sustainable Supply Risk | Supplier Legal Compliance | 4.4615 | 0.148000215 |
| Supplier Green Commitment | 2.8923 | 0.341559023 | |
| Supplier Quality Management | 3.8462 | 0.179001763 | |
| Core Supplier Disruption | 4.4615 | 0.174051495 | |
| Procurement Cost Risk | 4.2308 | 0.141620045 | |
| Coal Resource Depletion Risk | 4.6154 | 0.16642427 | |
| Capacity Constraint Risk | 4.0769 | 0.233986412 | |
| Logistics and Transportation Risk | 3.9231 | 0.163215932 | |
| IT Risk | Green Innovation Risk | 3.9231 | 0.243159543 |
| Artificial Intelligence Risks | 2.991 | 0.333853008 | |
| Digital Supply Chain System Stability | 3.8462 | 0.233708128 | |
| IoT Device Reliability | 4.0769 | 0.157058653 | |
| Information System Security | 4.2308 | 0.171423507 | |
| Data Timeliness | 4.3077 | 0.198478395 | |
| Social Risk | Employee Health and Safety | 4.6923 | 0.134279428 |
| Employee Compensation and Benefits | 4.4615 | 0.148000215 | |
| Community Relations Maintenance | 4.3846 | 0.148333828 | |
| Public Opinion Risk | 4.2308 | 0.21906555 |
| Importance | Standard |
|---|---|
| 1 | Both factors have equal importance |
| 3 | One factor is slightly more important than the other |
| 5 | One factor is significantly more important than the other |
| 7 | One factor is relatively important |
| 9 | One factor is definitely more important than the other |
| A | A1 | A2 | An |
|---|---|---|---|
| A1 | a11 | a12 | a1n |
| A2 | a12 | a22 | a2n |
| An | an1 | an2 | ann |
| n | 1 | 2 | 3 | 4 | 5 | 6 | 7 | 8 | 9 |
|---|---|---|---|---|---|---|---|---|---|
| RI | 0 | 0 | 0.59 | 0.90 | 1.12 | 1.24 | 1.32 | 1.41 | 1.45 |
| Primary Criteria | Weight | CI | RI | CR | Sub-Criteria | Weight | CI | RI | CR | Consistency Check | ||
|---|---|---|---|---|---|---|---|---|---|---|---|---|
| B1 | 0.1158 | 8.3819 | 0.0546 | 1.41 | 0.0387 | C1 | 0.3736 | 5.0849 | 0.0212 | 1.12 | 0.019 | Yes |
| C2 | 0.2486 | |||||||||||
| C3 | 0.0798 | |||||||||||
| C4 | 0.1755 | |||||||||||
| C5 | 0.1224 | |||||||||||
| B2 | 0.2526 | C6 | 0.1622 | 5.0755 | 0.0189 | 1.2 | 0.0169 | Yes | ||||
| C7 | 0.2847 | |||||||||||
| C8 | 0.1075 | |||||||||||
| C9 | 0.0918 | |||||||||||
| C10 | 0.3537 | |||||||||||
| B3 | 0.1499 | C11 | 0.2306 | 4.0459 | 0.0153 | 0.9 | 0.017 | Yes | ||||
| C12 | 0.1948 | |||||||||||
| C13 | 0.1492 | |||||||||||
| C14 | 0.4254 | |||||||||||
| B4 | 0.0681 | C15 | 0.3774 | 5.0493 | 0.0123 | 1.12 | 0.011 | Yes | ||||
| C16 | 0.2171 | |||||||||||
| C17 | 0.0816 | |||||||||||
| C18 | 0.1234 | |||||||||||
| C19 | 0.2005 | |||||||||||
| B5 | 0.0464 | C20 | 0.3123 | 5.0943 | 0.0236 | 1.12 | 0.0211 | Yes | ||||
| C21 | 0.2888 | |||||||||||
| C22 | 0.1251 | |||||||||||
| C23 | 0.0809 | |||||||||||
| C24 | 0.1929 | |||||||||||
| B6 | 0.0886 | C25 | 0.2126 | 7.1191 | 0.0198 | 1.32 | 0.015 | Yes | ||||
| C26 | 0.1308 | |||||||||||
| C27 | 0.1612 | |||||||||||
| C28 | 0.0787 | |||||||||||
| C29 | 0.3028 | |||||||||||
| C30 | 0.0688 | |||||||||||
| C31 | 0.0451 | |||||||||||
| B7 | 0.0353 | C32 | 0.098 | 5.0426 | 0.0107 | 1.12 | 0.0095 | Yes | ||||
| C33 | 0.0926 | |||||||||||
| C34 | 0.2033 | |||||||||||
| C35 | 0.274 | |||||||||||
| C36 | 0.3321 | |||||||||||
| B8 | 0.2434 | C37 | 0.329 | 4.061 | 0.0203 | 0.9 | 0.0266 | Yes | ||||
| C38 | 0.329 | |||||||||||
| C39 | 0.2002 | |||||||||||
| C40 | 0.1418 |
| Evaluation of Sub-Criteria | Comments | Statistics | ||||
|---|---|---|---|---|---|---|
| H | MH | M | ML | L | ||
| C1 Economic Cycle Risk | 6 | 11 | 34 | 13 | 10 | 74 |
| C2 Financing Risk | 3 | 12 | 27 | 18 | 14 | 74 |
| C3 Financial Constraints | 10 | 17 | 27 | 13 | 7 | 74 |
| C4 Solvency Risk | 8 | 20 | 20 | 13 | 13 | 74 |
| C5 R&D Investment | 4 | 17 | 33 | 12 | 8 | 74 |
| C6 Natural Disasters | 5 | 17 | 19 | 20 | 13 | 74 |
| C7 Safety Production Training | 31 | 23 | 6 | 10 | 4 | 74 |
| C8 Mining Technology Upgrade | 18 | 31 | 10 | 9 | 6 | 74 |
| C9 Equipment Failure | 4 | 10 | 21 | 20 | 19 | 74 |
| C10 Employee Operation Risk | 5 | 11 | 21 | 19 | 18 | 74 |
| C11 Mine Ecological Protection | 18 | 22 | 19 | 9 | 6 | 74 |
| C12 Pollution Reduction Risk | 10 | 18 | 22 | 17 | 7 | 74 |
| C13 Energy Consumption | 1 | 9 | 18 | 26 | 20 | 74 |
| C14 Environmental Accidents | 2 | 14 | 25 | 17 | 16 | 74 |
| C15 Regulatory Compliance | 8 | 14 | 28 | 15 | 9 | 74 |
| C16 Legal Risk | 6 | 16 | 23 | 15 | 14 | 74 |
| C17 Local Government Supervision | 15 | 30 | 18 | 7 | 4 | 74 |
| C18 Coal Industry Access Restrictions | 10 | 29 | 22 | 7 | 6 | 74 |
| C19 Corporate Sustainable Development Strategy | 14 | 32 | 19 | 6 | 3 | 74 |
| C20 International Energy Market Price Fluctuations | 6 | 34 | 28 | 5 | 1 | 74 |
| C21 Coal Industry Cyclicality | 4 | 29 | 33 | 7 | 1 | 74 |
| C22 Clean Energy Substitution | 3 | 25 | 36 | 8 | 2 | 74 |
| C23 Bullwhip Effect Risk | 6 | 14 | 37 | 13 | 4 | 74 |
| C24 Key Customer Disruption | 5 | 13 | 40 | 9 | 7 | 74 |
| C25 Supplier Legal Compliance | 11 | 23 | 30 | 7 | 3 | 74 |
| C26 Supplier Quality Management | 11 | 22 | 32 | 7 | 2 | 74 |
| C27 Core Supplier Disruption | 4 | 21 | 32 | 9 | 8 | 74 |
| C28 Procurement Cost Risk | 8 | 15 | 34 | 10 | 7 | 74 |
| C29 Coal Resource Depletion Risk | 6 | 17 | 34 | 9 | 8 | 74 |
| C30 Capacity Constraint Risk | 7 | 19 | 33 | 10 | 5 | 74 |
| C31 Logistics and Transportation Risk | 6 | 12 | 37 | 11 | 8 | 74 |
| C32 Green Innovation Risk | 3 | 14 | 37 | 10 | 10 | 74 |
| C33 Digital Supply Chain System Stability | 6 | 16 | 38 | 9 | 5 | 74 |
| C34 IoT Device Reliability | 8 | 19 | 38 | 5 | 4 | 74 |
| C35 Information System Security | 10 | 20 | 35 | 7 | 2 | 74 |
| C36 Data Timeliness | 11 | 19 | 33 | 8 | 3 | 74 |
| C37 Employee Health and Safety | 10 | 23 | 28 | 7 | 6 | 74 |
| C38 Employee Compensation and Benefits | 6 | 15 | 42 | 7 | 4 | 74 |
| C39 Community Relations Maintenance | 6 | 20 | 40 | 4 | 4 | 74 |
| C40 Public Opinion Risk | 3 | 19 | 37 | 10 | 5 | 74 |
| A large-scale coal group sustainable supply chain risk assessment score (61.7130) | Primary Criteria | Score | Sub-Criteria | Score |
| B1 Economic Risk | 57.0771 | C1 Economic Cycle Risk | 57.2973 | |
| C2 Financing Risk | 52.4324 | |||
| C3 Financial Constraints | 62.7027 | |||
| C4 Solvency Risk | 59.1892 | |||
| C5 R&D Investment | 59.1892 | |||
| B2 Safety Operation Risk | 61.4103 | C6 Natural Disasters | 54.8649 | |
| C7 Safety Production Training | 78.1081 | |||
| C8 Mining Technology Upgrade | 72.4324 | |||
| C9 Equipment Failure | 49.1892 | |||
| C10 Employee Operation Risk | 50.8108 | |||
| B3 Ecological Risk | 56.8925 | C11 Mine Ecological Protection | 70.0000 | |
| C12 Pollution Reduction Risk | 61.8919 | |||
| C13 Energy Consumption | 45.1351 | |||
| C14 Environmental Accidents | 51.6216 | |||
| B4 Policy Risk | 63.4079 | C15 Regulatory Compliance | 59.1892 | |
| C16 Legal Risk | 55.9459 | |||
| C17 Local Government Supervision | 72.1622 | |||
| C18 Coal Industry Access Restrictions | 68.1081 | |||
| C19 Corporate Sustainable Development Strategy | 72.9730 | |||
| B5 Demand Risk | 66.2291 | C20 International Energy Market Price Fluctuations | 70.5405 | |
| C21 Coal Industry Cyclicality | 67.5676 | |||
| C22 Clean Energy Substitution | 65.1351 | |||
| C23 Bullwhip Effect Risk | 61.3514 | |||
| C24 Key Customer Disruption | 60.0000 | |||
| B6 Sustainable Supply Risk | 63.8610 | C25 Supplier Legal Compliance | 68.6486 | |
| C26 Supplier Quality Management | 68.9189 | |||
| C27 Core Supplier Disruption | 61.0811 | |||
| C28 Procurement Cost Risk | 61.8919 | |||
| C29 Coal Resource Depletion Risk | 61.0811 | |||
| C30 Capacity Constraint Risk | 63.5135 | |||
| C31 Logistics and Transportation Risk | 59.1892 | |||
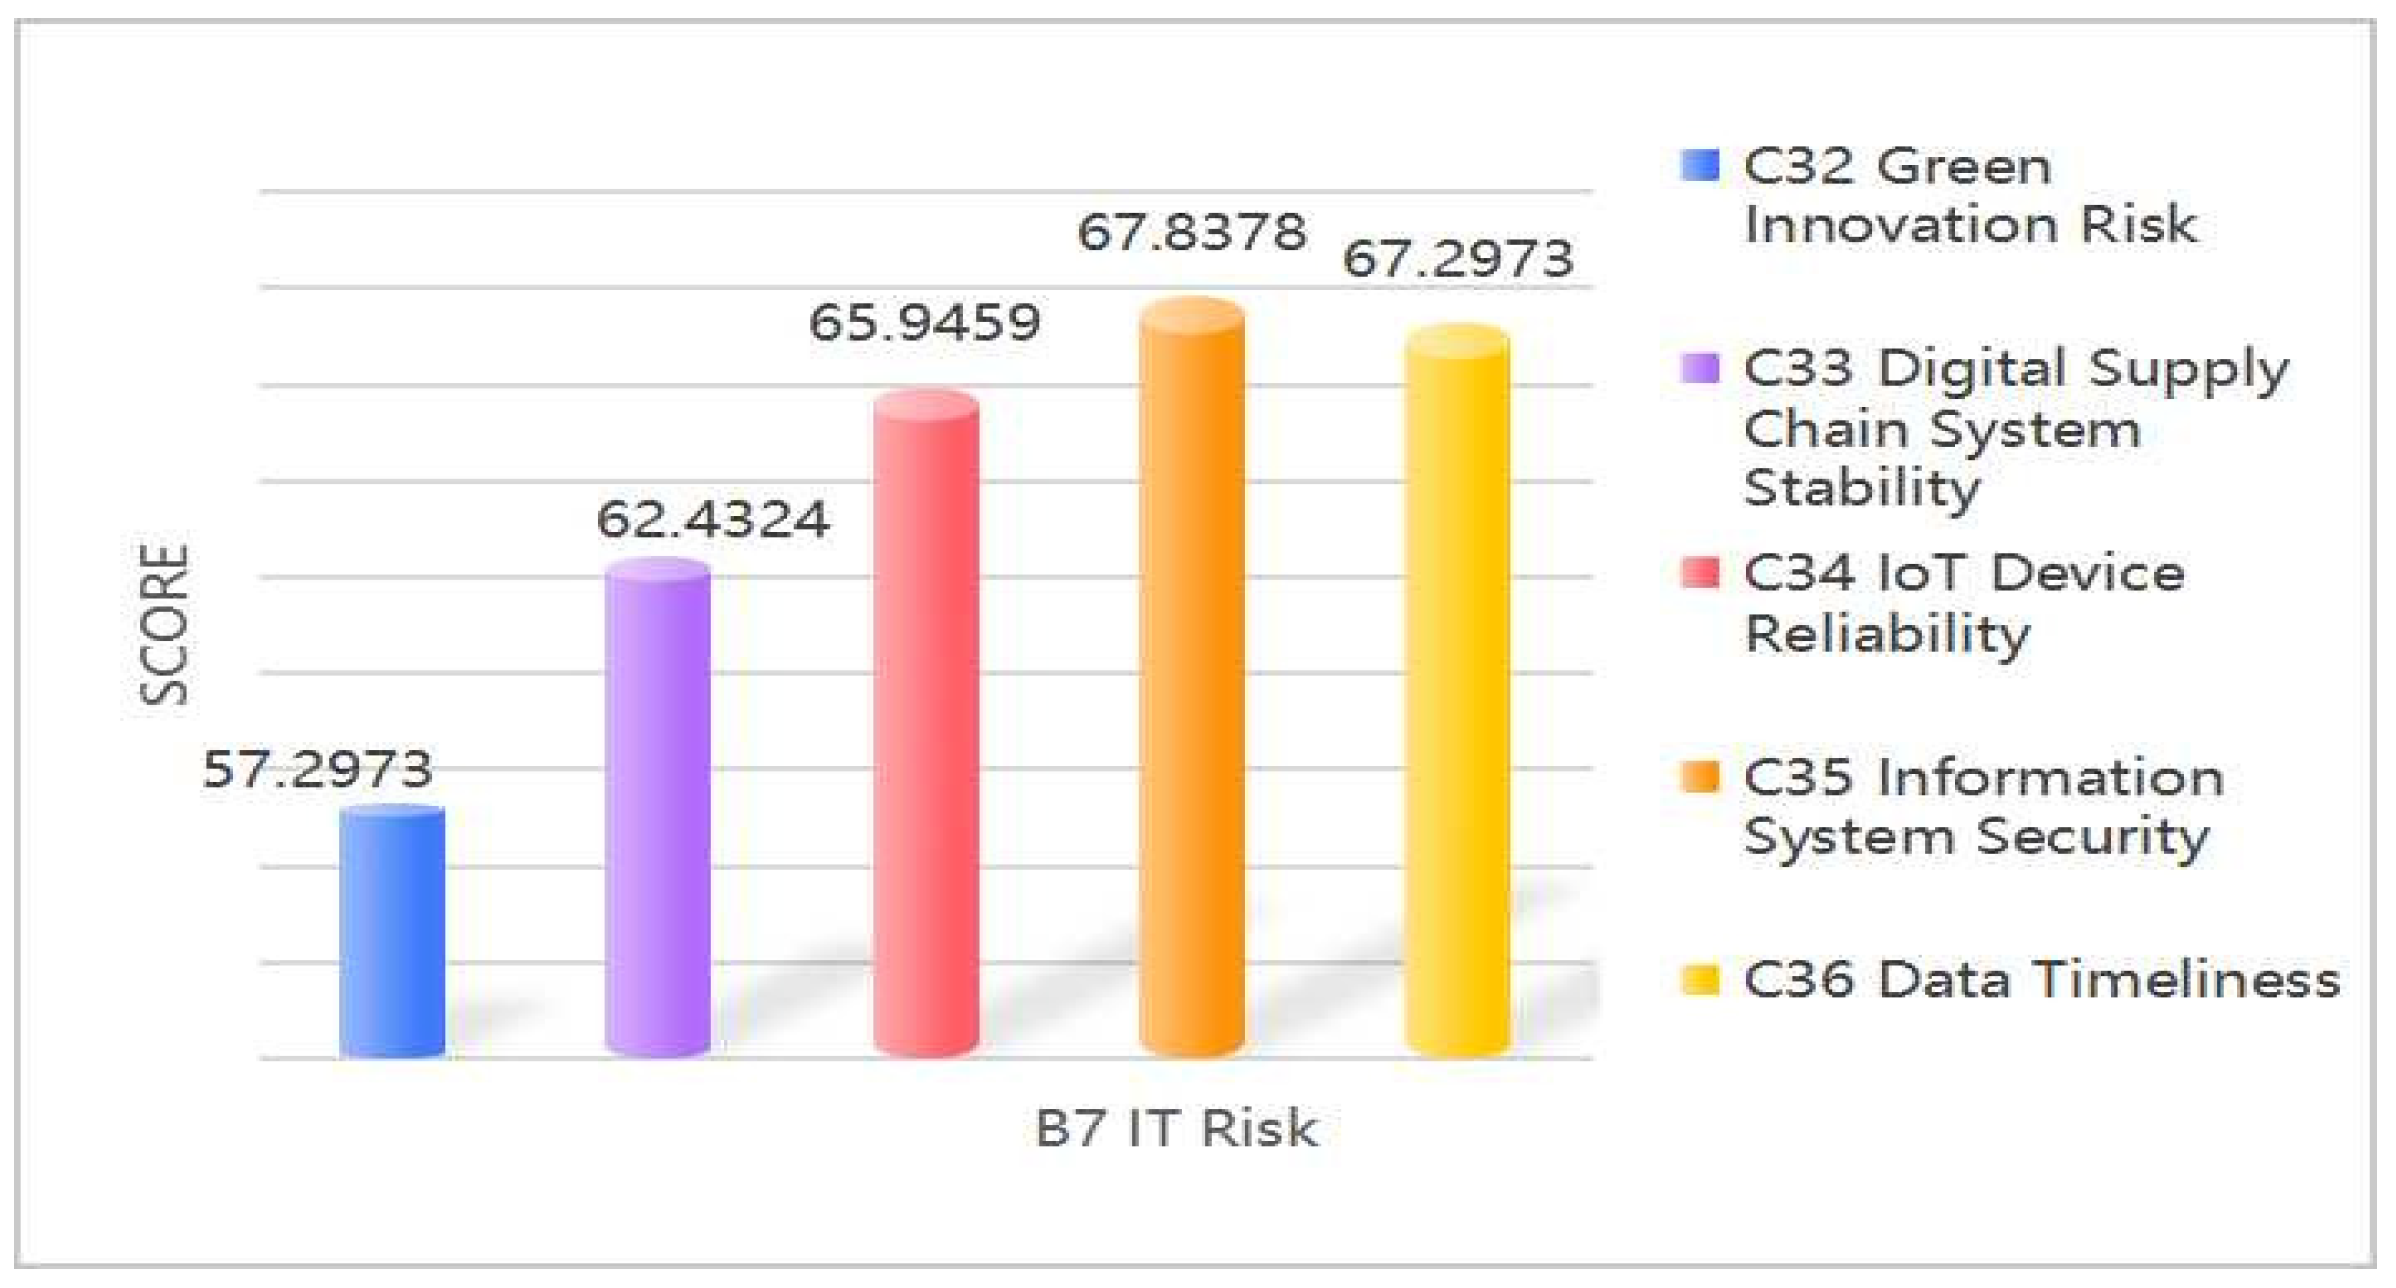
| B7 IT Risk | 65.7402 | C32 Green Innovation Risk | 57.2973 | |
| C33 Digital Supply Chain System Stability | 62.4324 | |||
| C34 IoT Device Reliability | 65.9459 | |||
| C35 Information System Security | 67.8378 | |||
| C36 Data Timeliness | 67.2973 | |||
| B8 Social Risk | 64.4749 | C37 Employee Health and Safety | 66.4865 | |
| C38 Employee Compensation and Benefits | 63.2432 | |||
| C39 Community Relations Maintenance | 65.4054 | |||
| C40 Public Opinion Risk | 61.3514 |
Disclaimer/Publisher’s Note: The statements, opinions and data contained in all publications are solely those of the individual author(s) and contributor(s) and not of MDPI and/or the editor(s). MDPI and/or the editor(s) disclaim responsibility for any injury to people or property resulting from any ideas, methods, instructions or products referred to in the content. |
© 2025 by the authors. Licensee MDPI, Basel, Switzerland. This article is an open access article distributed under the terms and conditions of the Creative Commons Attribution (CC BY) license (https://creativecommons.org/licenses/by/4.0/).
Share and Cite
Zhou, Y.; Guo, M.; Hao, J.; Xu, W.; Wu, Y. Multidimensional Risk Assessment in Sustainable Coal Supply Chains for China’s Low-Carbon Transition: An AHP-FCE Framework. Sustainability 2025, 17, 5689. https://doi.org/10.3390/su17135689
Zhou Y, Guo M, Hao J, Xu W, Wu Y. Multidimensional Risk Assessment in Sustainable Coal Supply Chains for China’s Low-Carbon Transition: An AHP-FCE Framework. Sustainability. 2025; 17(13):5689. https://doi.org/10.3390/su17135689
Chicago/Turabian StyleZhou, Yang, Ming Guo, Junfang Hao, Wanqiang Xu, and Yuping Wu. 2025. "Multidimensional Risk Assessment in Sustainable Coal Supply Chains for China’s Low-Carbon Transition: An AHP-FCE Framework" Sustainability 17, no. 13: 5689. https://doi.org/10.3390/su17135689
APA StyleZhou, Y., Guo, M., Hao, J., Xu, W., & Wu, Y. (2025). Multidimensional Risk Assessment in Sustainable Coal Supply Chains for China’s Low-Carbon Transition: An AHP-FCE Framework. Sustainability, 17(13), 5689. https://doi.org/10.3390/su17135689