
The Impact Path of New Energy Vehicle Promotion on Green Development—Empirical Research from the Provincial Level in China


Abstract
1. Introduction
- (1)
- What impact does NEVP have on green development?
- (2)
- What are the paths through which the impact of NEVP on green development can be realized?
- (3)
- Will the impact of NEVP on green development be affected by regional heterogeneity?
2. Literature Review
2.1. New Energy Vehicle Promotion
- (1)
- With the rapid development of China’s NEV industry, it is also actively exploring more factors affecting its development [17]. It mainly considers the impact of network embedding [18], technology interaction [19], carbon price [20], credit conditions [21], and other factors on NEVP. Many scholars have actively studied the NEV industry from the perspectives of environmental factors [22], residents’ health, traffic congestion, industrial foundation, etc. Lin and Wu [23] found that network externalities, price acceptability, government subsidies, vehicle performance, environmental problems, and other attitude factors have a significant impact on consumers’ willingness to buy electric vehicles. Pan et al. [24] evaluated the health benefits and monetary value of promoting new energy vehicles in Chongqing. Zhang et al. [25] found that the construction of charging piles can accelerate the penetration of NEVs, which will exacerbate traffic congestion.
- (2)
- NEVP is inseparable from government policy support [26]. Active government policies can play a key role in NEVP [27]. NEVP policies will directly promote the consumption and industrial upgrading of NEVs. Kuang and Wang [28] believed that the industrial policies of the Chinese government have greatly promoted the structural upgrading and optimization of the NEV industry and stimulated the improvement of the innovation level of enterprises. Zhu et al. [29] found that the unit carbon subsidy for electric vehicles promoted manufacturers’ profits and product demand. Zhao et al. [30] found that government subsidies can promote NEVP. However, excessive reliance on government subsidy policies may lead to insufficient endogenous power in the industry [31]. Therefore, China is gradually canceling the financial subsidies for the NEV industry [32] and shifting the incentive policy from policy guidance to market driven [33]. The market-driven mechanism is becoming an important internal driving force for the sustainable development of NEVs [34].
2.2. Green Development
- (1)
- There are different views on the definition of green development. Huang et al. [35] defined green development as the process of promoting the harmonious coexistence between man and nature, propelling the continuous accumulation of green assets, improving the environmental well-being of residents, and finally realizing the coordinated progress of the economic society and the ecological environment through the practice of “greening” and “Ecologicalization” within the framework of resource carrying capacity and ecological capacity. Zhu [36] proposed that green development is the recognition of the value of ecological nature; green should be used as the background of development, and development is also the basis of “greening”.
- (2)
- The measurement standard of green development has not been unified. The measurement mainly includes using the entropy weight method to build the index system to measure the regional green development level [37] and using the input–output model to take green development efficiency as the proxy variable of green development [38]. Che et al. [39] measured the efficiency of green development at the provincial level in China while considering the unexpected output. Hao and Zhu [40] divided the GDL into 6 first-class indicators, including resource utilization, environmental governance, and green life, and 44 s-class indicators, which were measured by the entropy method. Zhou et al. [41] measured the green development efficiency of Chinese cities by using the SBM model while considering the unexpected output and the spatial Markov chain. Zhao [42] divided the evaluation index of the urban GDL into three dimensions, namely ecological greening, economic greening, and social greening, and calculated it by the entropy method.
- (3)
- The realization path of green development has raised concerns. It mainly focuses on the significant role of industrial agglomeration [43], digital finance [2], environmental regulation [44], population migration [45], a new urbanization level [46], technological innovation [47], and other factors in promoting green development.
2.3. Impact of NEVP on Green Development
2.3.1. NEVP Influences the Effect of Energy Conservation and Emission Reduction
- (1)
- NEVP has an obvious positive effect on energy conservation and emission reduction [7,48]. Jochem et al. [49] believed that NEVP would help reduce CO2 emissions. Trost et al. [50] found that the long-term promotion of new energy vehicles helps to further mitigate the greenhouse effect. Lane et al. [51] found that NEVs have certain green benefits to replace traditional fuel vehicles, but plug-in fuel cell vehicles are better than pure electric vehicles. Su et al. [52] analyzed the positive role of the transportation sector in reducing air pollution. Jiang et al. [53] evaluated NEVs and fuel vehicles from the perspectives of energy consumption, pollution emissions, and total driving cost and found that new energy vehicles were superior to traditional internal combustion engine vehicles in energy consumption and carbon emissions.
- (2)
- The environmental benefits of NEVs are controversial [54]. The high energy consumption and emissions of NEVs in the process of battery preparation make their carbon emissions higher than those of traditional internal combustion engine vehicles [55]; that is, NEVP only transfers emissions from the transportation field to the power generation sector and fundamentally still relies on coal, making it difficult to achieve true emission reduction effects [54].
2.3.2. NEVP Policies Affect Green Development
- (1)
- The NEVP policy has a certain impact on environmental improvement and the energy structure [56]. Tan et al. [57] found that the emission reduction effect of the subsidy policy was continuously enhanced with the deepening of the policy. Zhang et al. [58] found that the construction of a low-carbon transportation system significantly promoted the optimization of the energy consumption structure. Wang et al. [15] found that the promotion and application of NEV policies significantly reduced the carbon intensity of the cities.
- (2)
- The implementation effect of NEVP policy is by no means completely positive. Ruan and Liu [59] believed that the emission reduction effect of the subsidy policy for NEVs on mobile pollution sources showed nonlinear characteristics. With the expansion of the industrial scale, its emission reduction efficiency will gradually weaken. Guo and Wang [60] found that government subsidies have a two-way effect on emission reduction: the substitution effect reduces vehicle exhaust emissions, while the direct effect increases electricity emissions by stimulating additional demand. Because the substitution effect is weaker than the direct effect, it shows that subsidies are not an effective means of emission reduction.
- (3)
- Other impact paths: Sheldon and Dua [61] found that thanks to the cost advantage of new energy vehicles, it indirectly promotes the reduction in fuel consumption for fuel vehicles, and the improvement of the fuel economy has become a way for NEVs to reduce emissions. Road traffic congestion [62] and charging station congestion [63] are considered in the green development path.
2.4. Literature Summary
3. Research Assumptions
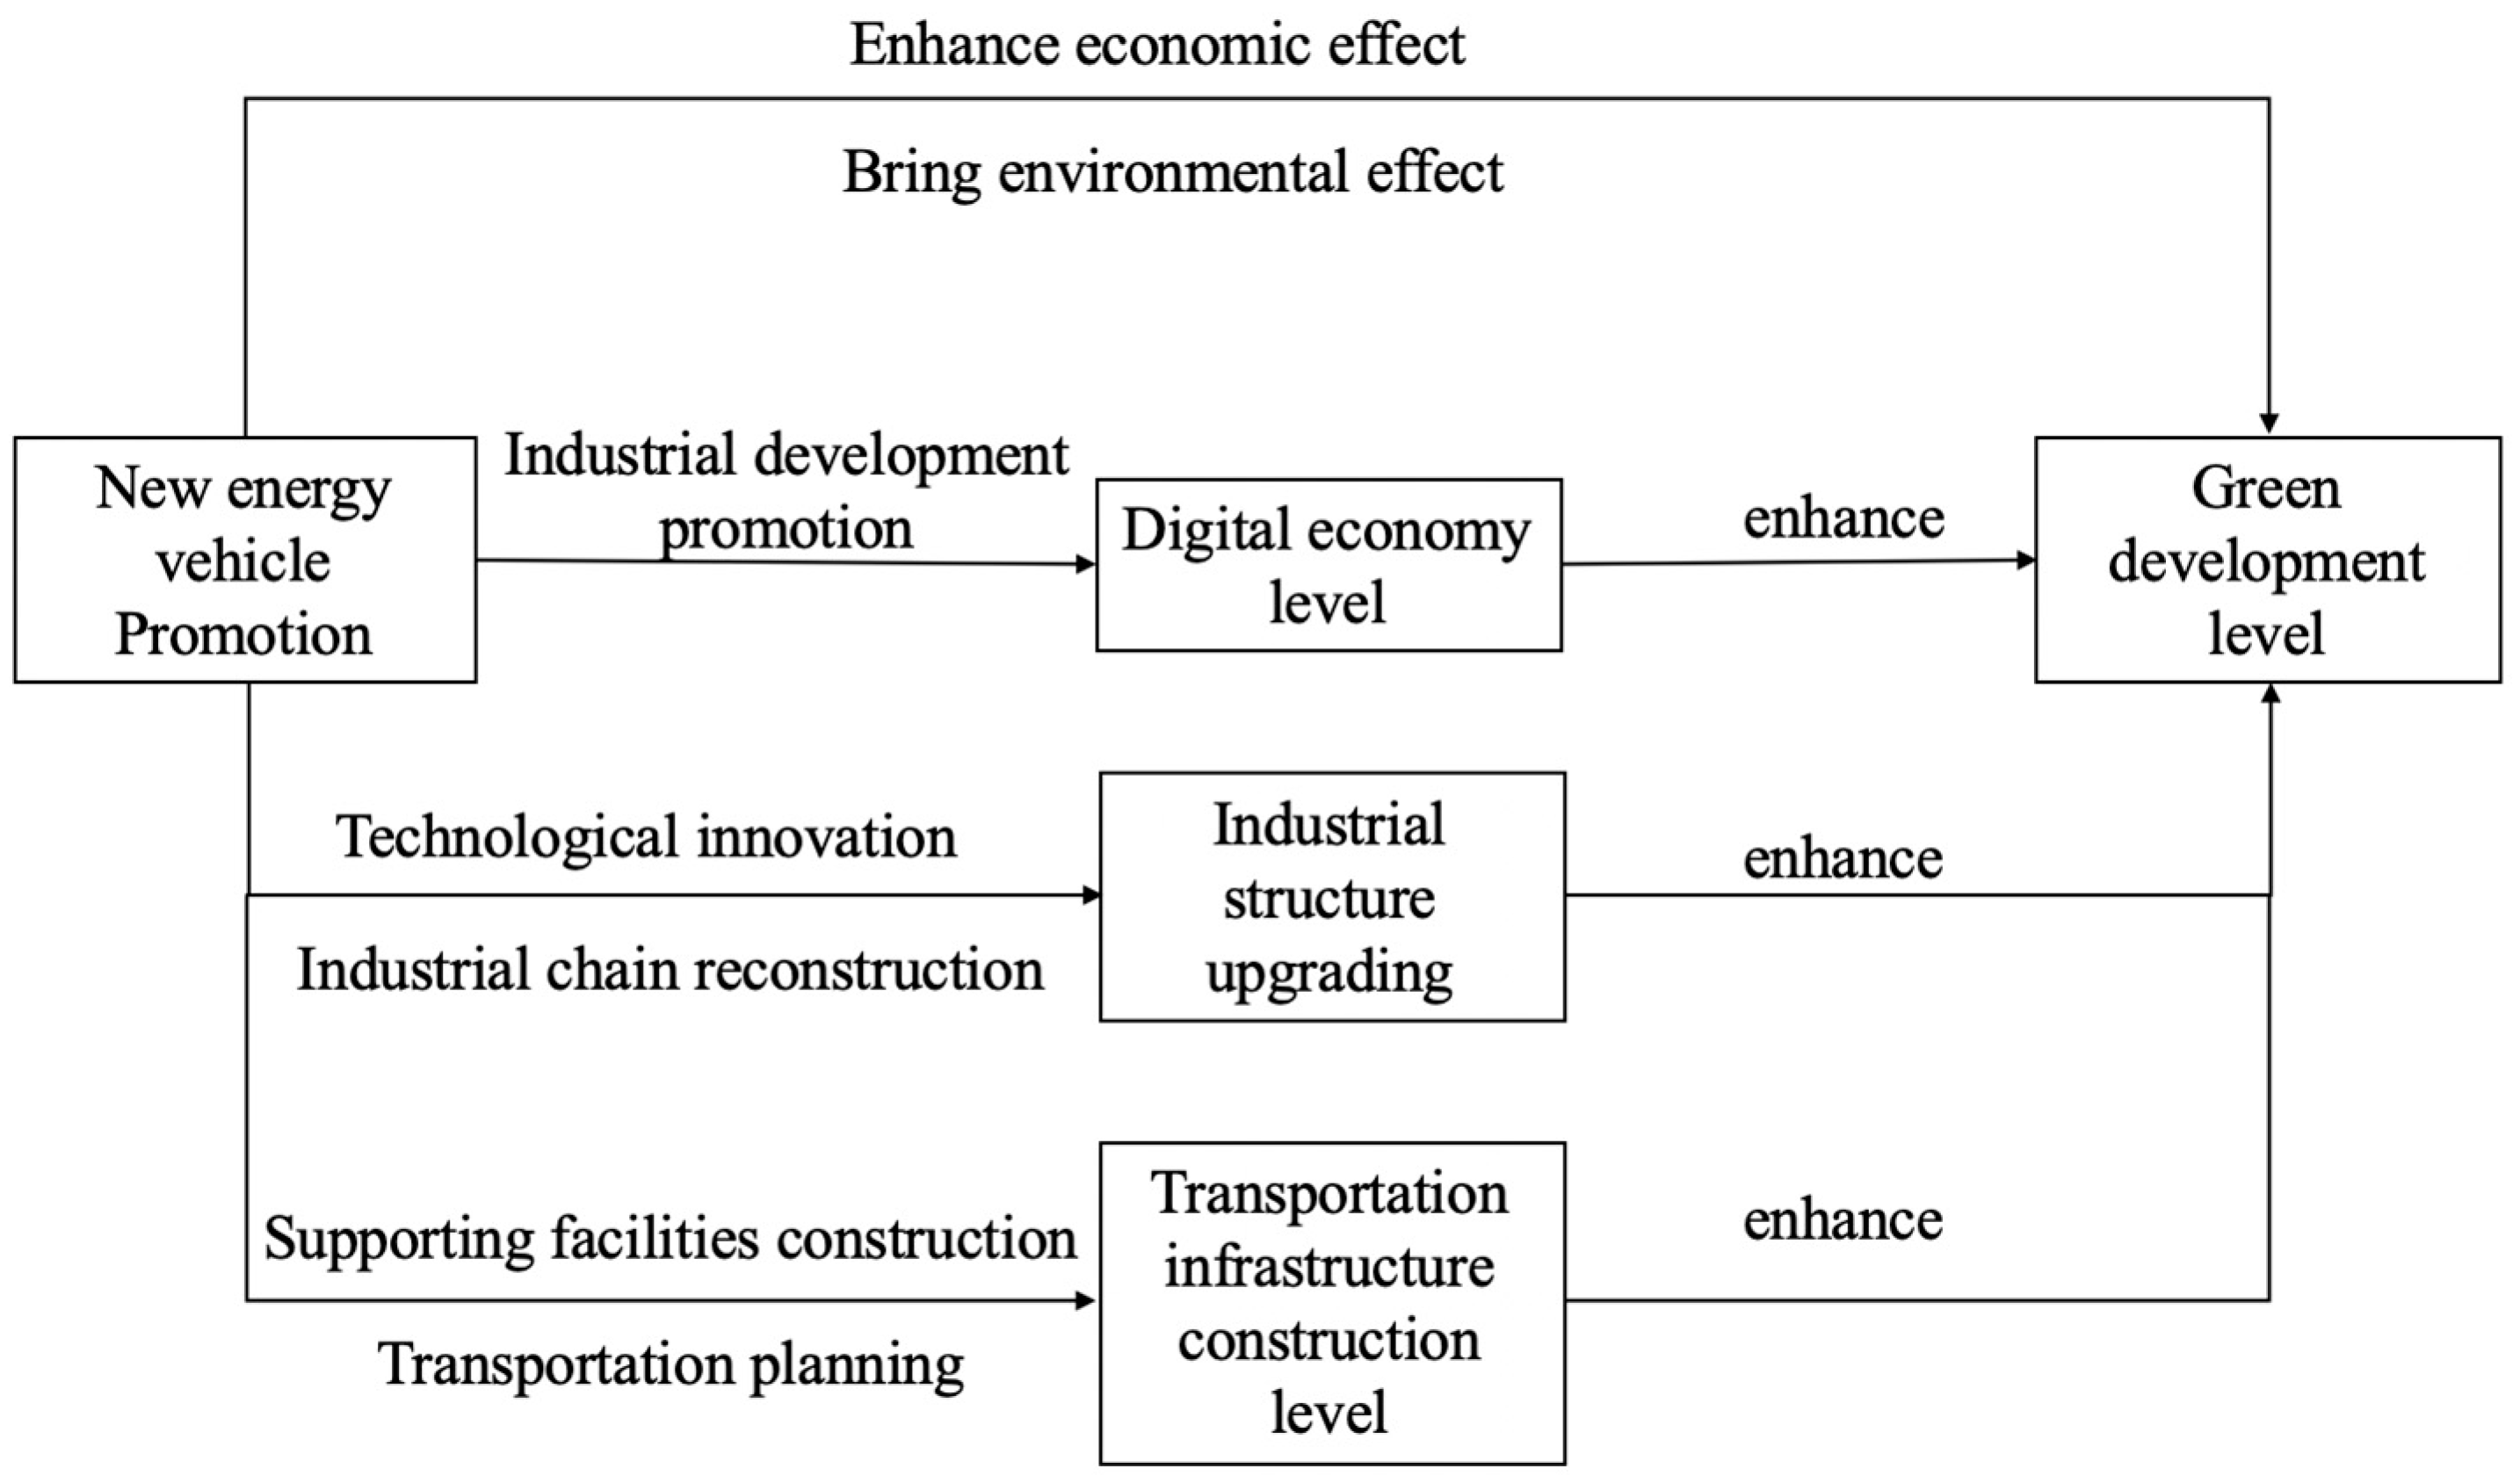
3.1. Direct Impact of NEVP on Green Development
3.2. Indirect Impact of NEVP on Green Development
3.2.1. Digital Economy Level
3.2.2. Industrial Structure Upgrading
3.2.3. Transport Infrastructure Construction Level
4. Research Methods
4.1. Data Sources
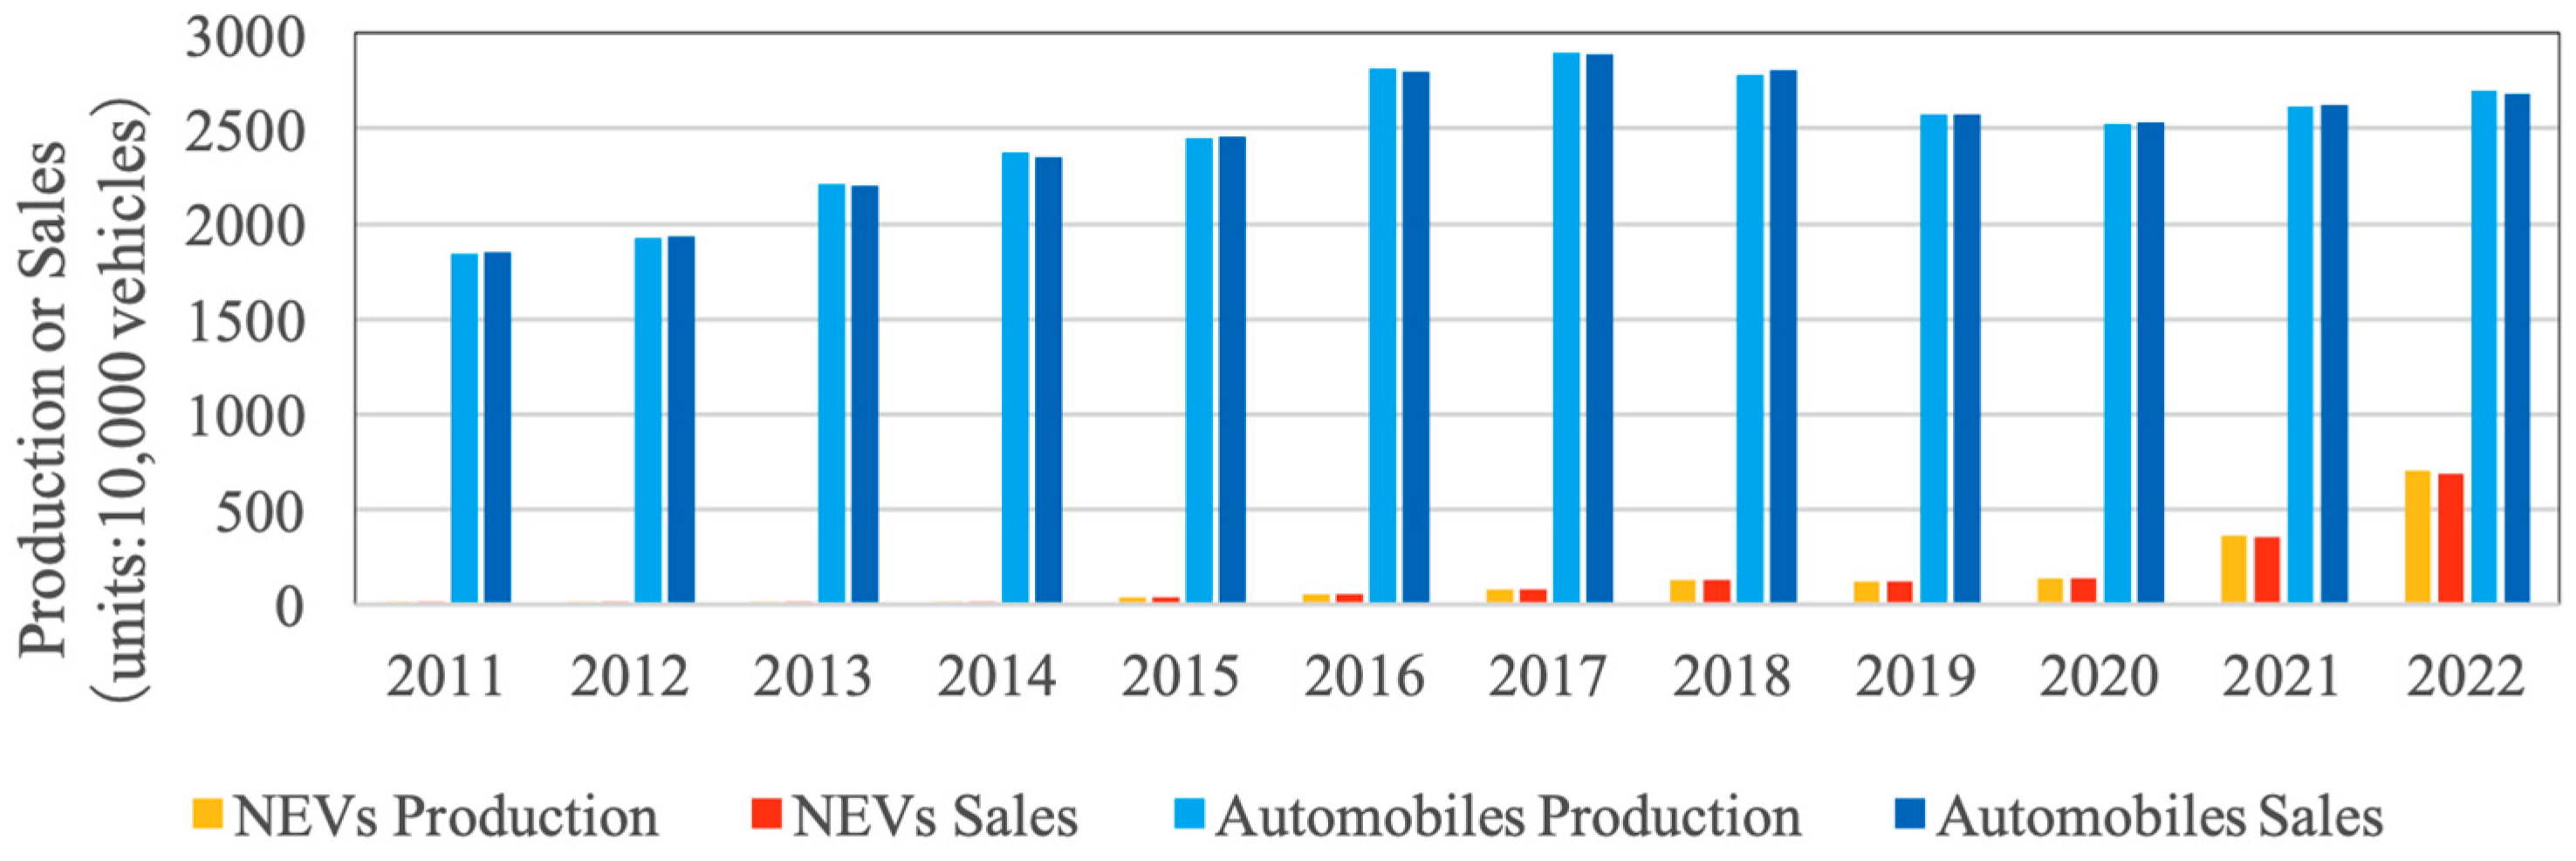
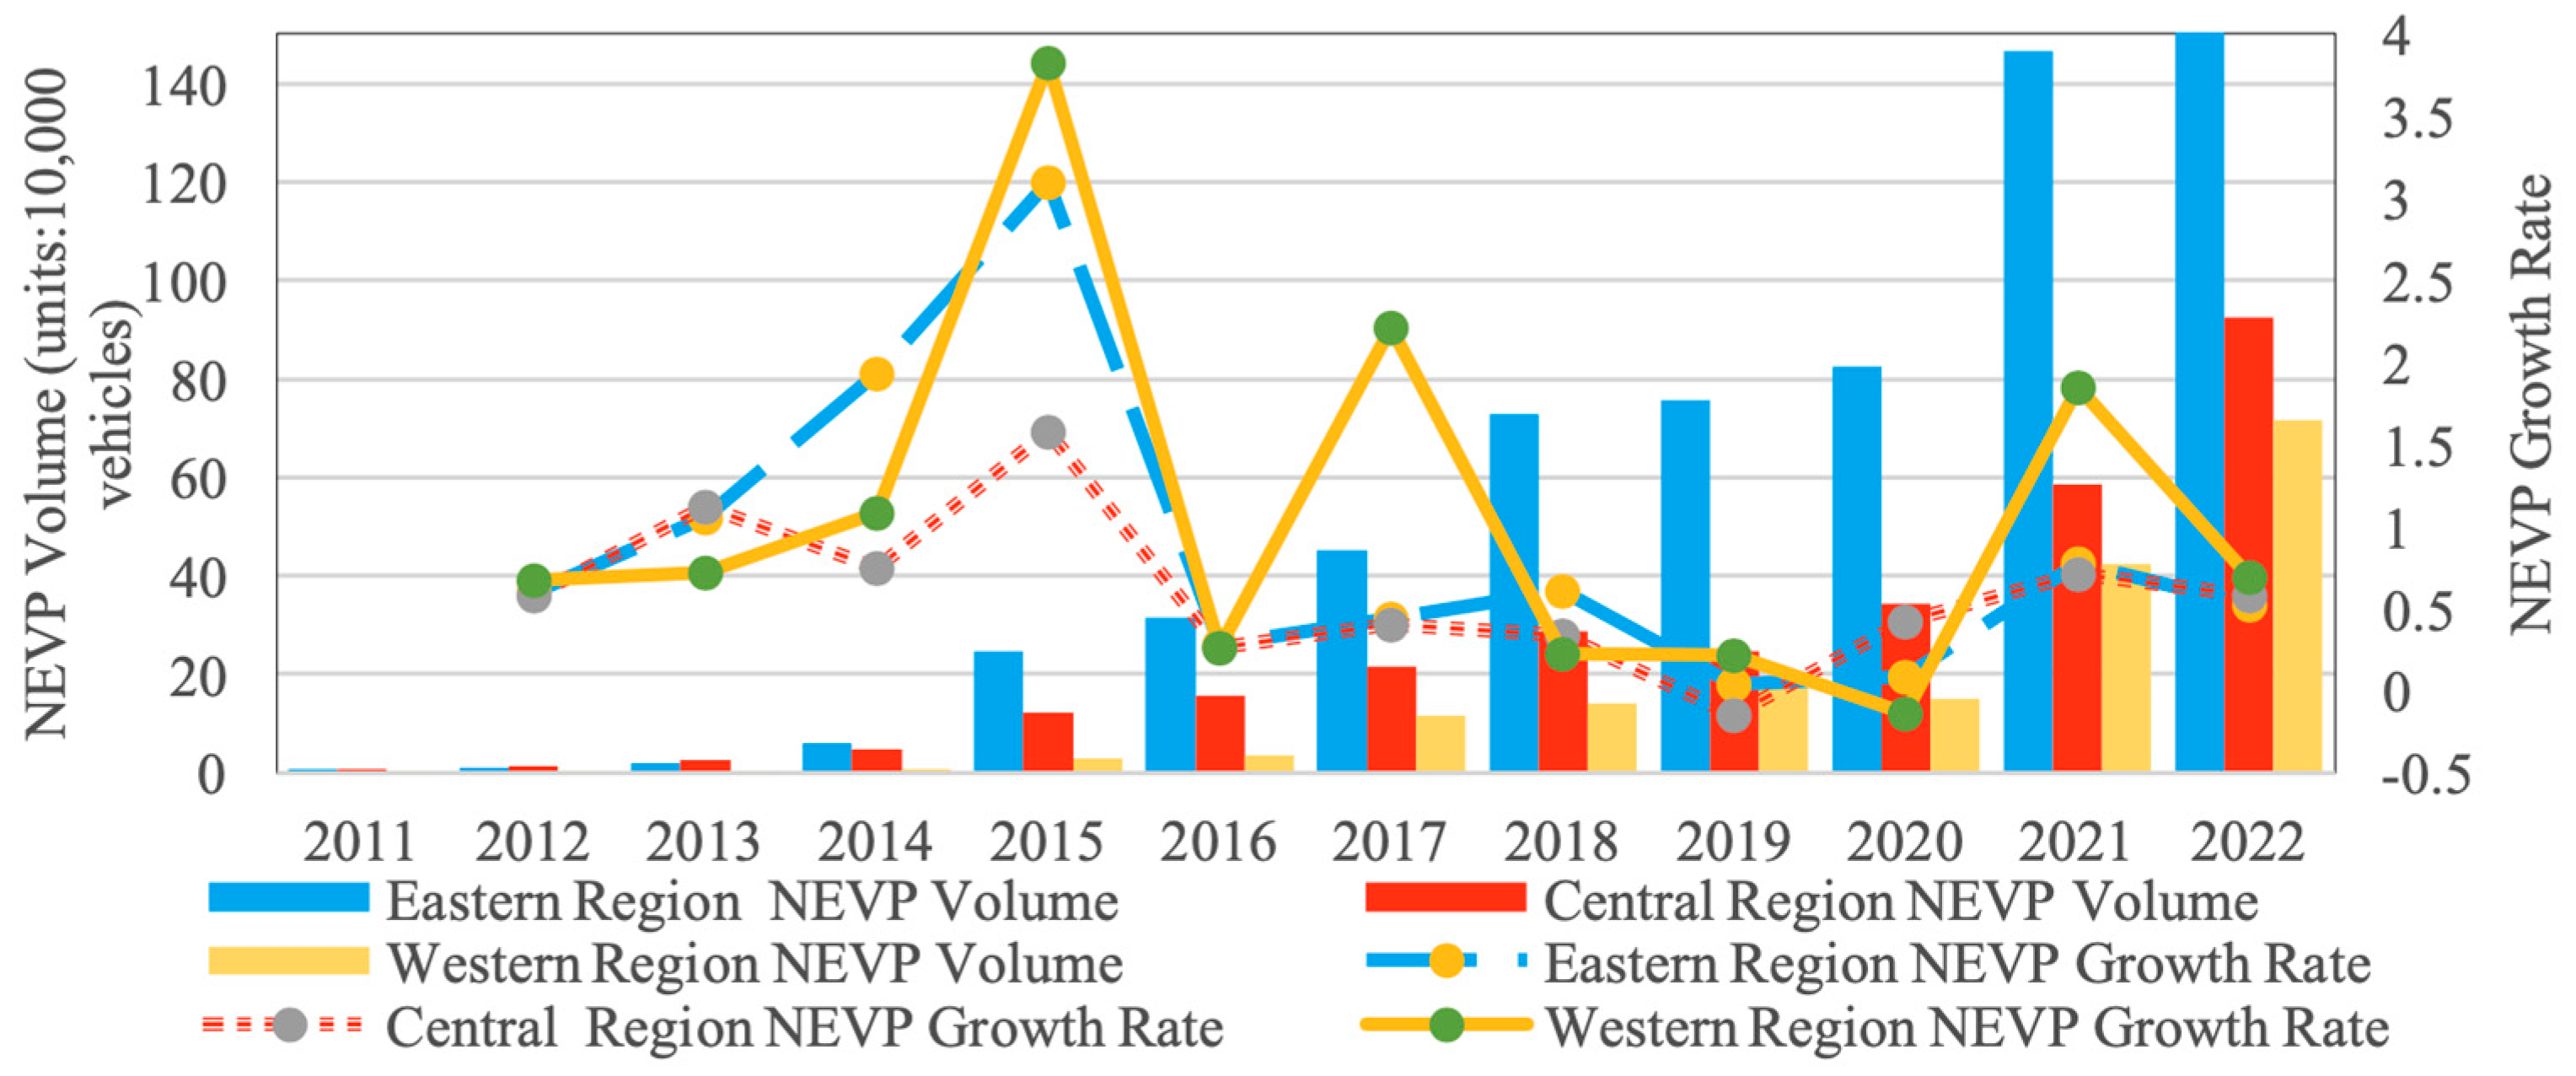
4.2. Development Status of New Energy Vehicles in China
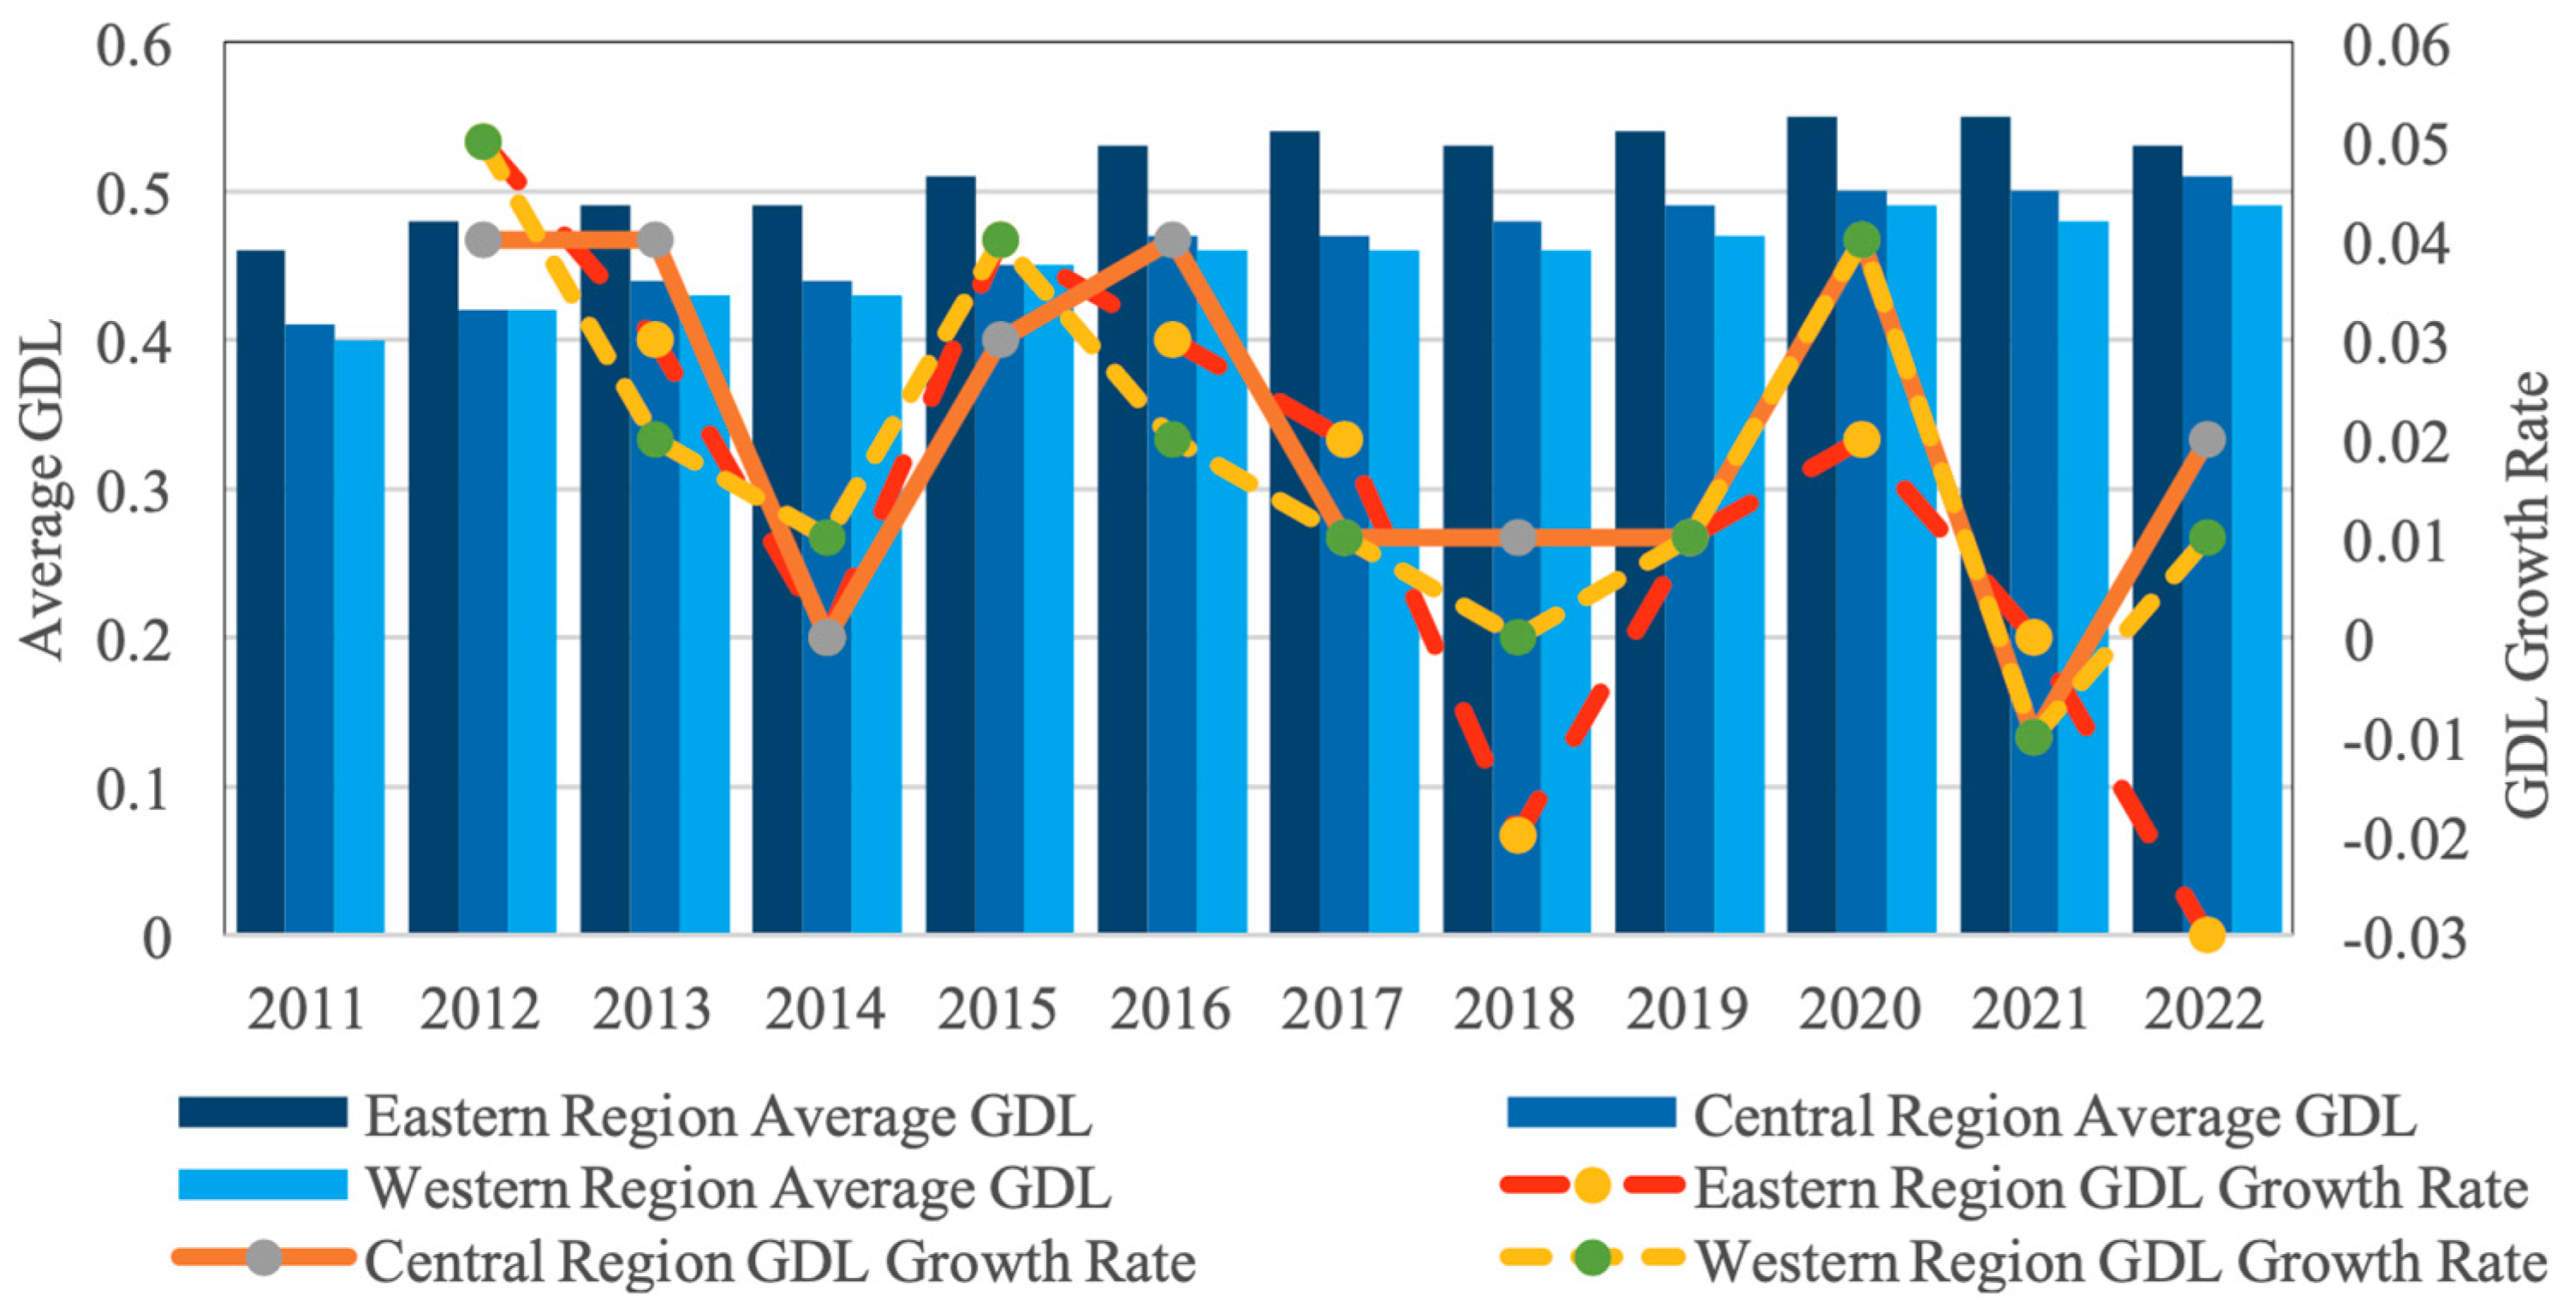
4.3. Green Development Level of Provincial Administrative Regions
4.4. Variable Selection
4.4.1. Explained Variable
4.4.2. Core Explanatory Variable, Control Variables, and Intermediary Variables
- (1)
- Core explanatory variable
- (2)
- Control variable
- ➀
- Fiscal decentralization (FD)
- ➁
- Foreign direct investment (FDI)
- ➂
- Degree of opening up (DO)
- ➃
- Environmental regulation (ER)
- (3)
- Mediating variable
- ➀
- Digital economy level (DEL)
- ➁
- Industrial structure upgrading (ISU)
- ➂
- Transport infrastructure construction level (TICL)
4.5. Model Construction
4.5.1. Tobit Model
4.5.2. Mediation Effect Model
- (1)
- Digital economy level
- (2)
- Industrial structure upgrading
- (3)
- Transport infrastructure construction level
5. Empirical Results and Analysis
5.1. Sample Descriptive Statistics
5.2. Stability Test
5.3. Basic Regression Analysis
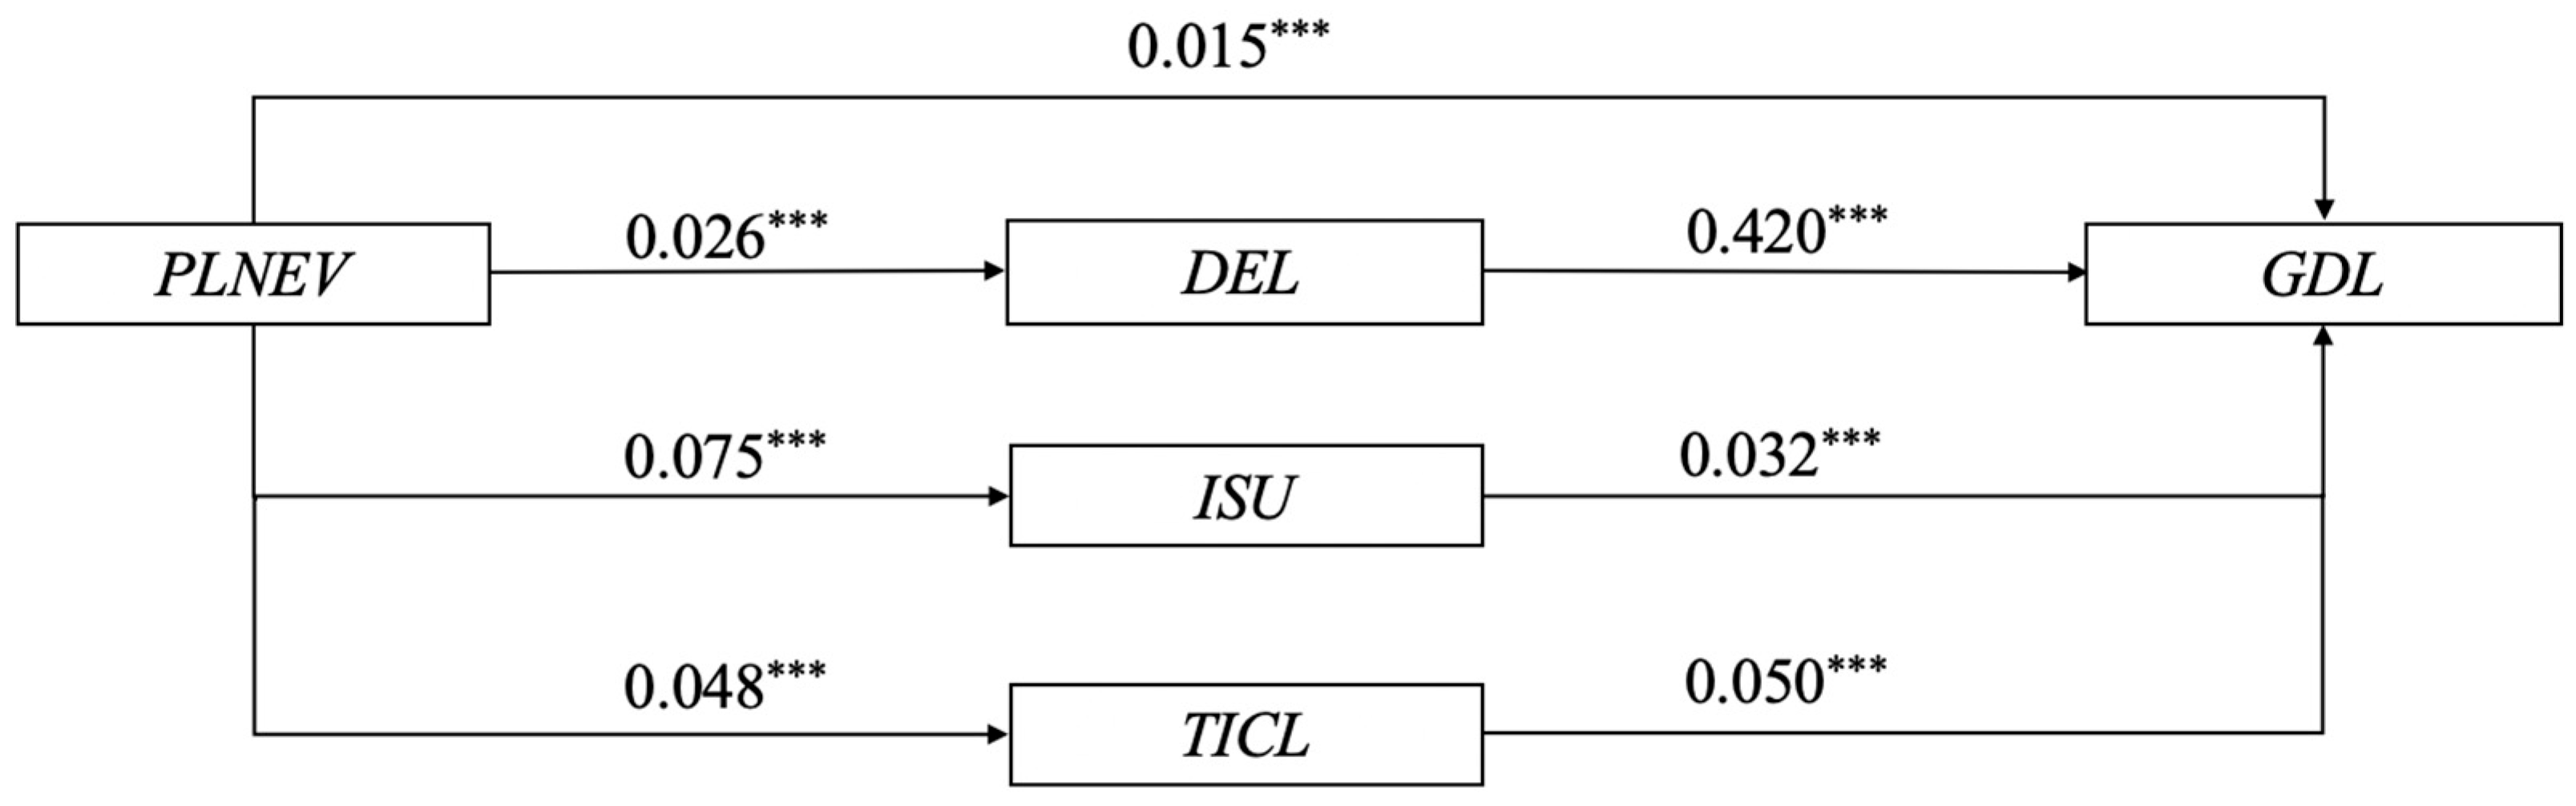
5.4. Multiple Intermediary Tests and Analyses
5.5. Regional Heterogeneity Analysis
5.6. Robustness and Endogenous Test
5.6.1. Robustness Test
5.6.2. Endogenous Test
6. Conclusions and Policy Suggestions
- (1)
- Adhere to innovation-driven development, increase research and development support for core technologies of NEVs, promote green technology innovation, support data-driven innovation mode, optimize the efficiency of the transportation system, and reduce environmental pollution.
- (2)
- Optimize the industrial structure, promote the green transformation of traditional industries, support the transformation of the traditional automobile manufacturing industry to a high-tech industry, promote the green and low-carbon development of the industrial chain, and encourage the coordinated development of NEVs with related supporting industries and basic industries to form a green industrial cluster.
- (3)
- Improve the construction of transportation infrastructure, accelerate the construction and planning of roads and charging infrastructure, improve supporting facilities, promote the green transformation of the urban transportation system, and build an efficient and low-carbon green transportation system.
- (4)
- Maintain the NEVP level in the eastern region, improve the NEVP level in the central region, enhance the policy support for NEVs in the western region, and further promote regional green development to a greater extent.
Author Contributions
Funding
Institutional Review Board Statement
Informed Consent Statement
Data Availability Statement
Conflicts of Interest
References
- Awan, A.; Alnour, M.; Jahanger, A.; Onwe, J.C. Do technological innovation and urbanization mitigate carbon dioxide emissions from the transport sector? Technol. Soc. 2022, 71, 102128. [Google Scholar] [CrossRef]
- Liu, B.; Song, C.; Wang, Q.; Zhang, X.; Chen, J. Research on regional differences of China’s new energy vehicles promotion policies: A perspective of sales volume forecasting. Energy 2022, 248, 123541. [Google Scholar] [CrossRef]
- Liu, Y.; Kokko, A. Who does what in China’s new energy vehicle industry? Energy Policy 2013, 57, 21–29. [Google Scholar] [CrossRef]
- Ren, J.Z. New energy vehicle in China for sustainable development: Analysis of success factors and strategic implications. Transp. Res. Part D Transp. Environ. 2018, 59, 268–288. [Google Scholar] [CrossRef]
- Zahoor, A.; Yu, Y.; Zhang, H.; Nihed, B.; Afrane, S.; Peng, S.; Sapi, A.; Lin, C.J.; Mao, G. Can the new energy vehicles (NEVs) and power battery industry help China to meet the carbon neutrality goal before 2060? J. Environ. Manag. 2023, 336, 117663. [Google Scholar] [CrossRef]
- Baars, J.; Domenech, T.; Bleischwitz, R.; Melin, H.E.; Heidrich, O. Circular economy strategies for electric vehicle batteries reduce reliance on raw materials. Nate Sustain. 2020, 4, 71–79. [Google Scholar] [CrossRef]
- Cheng, A.; Jiang, G.; Teng, X.; Xu, W.; Li, Y.; Wu, L.; Chiu, Y.H. Changes in low-carbon transportation efficiency of Chinese roads after considering the impact of new energy vehicles. Transp. Policy 2024, 159, 28–43. [Google Scholar] [CrossRef]
- Gu, X.; Wang, M.; Wu, J. An empirical study on the green effects of new energy vehicle promotion in the context of global carbon neutrality. China Popul. Resour. Environ. 2022, 20, 332–340. [Google Scholar] [CrossRef]
- Sun, B.; Ju, Z. Research on the promotion of new energy vehicles based on multi-source heterogeneous data: Consumer and manufacturer perspectives. Environ. Sci. Pollut. Res. 2023, 30, 28863–28873. [Google Scholar] [CrossRef]
- Richardson, D.B. Electric vehicles and the electric grid: A review of modeling approaches, Impacts, and renewable energy integration. Renew. Sustain. Energy Rev. 2013, 19, 247–254. [Google Scholar] [CrossRef]
- Wang, J.; He, Y.; Wang, H.; Wu, R. Low-carbon promotion of new energy vehicles: A quadrilateral evolutionary game. Renew. Sustain. Energy Rev. 2023, 188, 113795. [Google Scholar] [CrossRef]
- Huang, X.; Lin, Y.; Lim, M.K.; Zhou, F.; Liu, F. Electric vehicle charging station diffusion: An agent-based evolutionary game model in complex networks. Energy 2022, 257, 124700. [Google Scholar] [CrossRef]
- Zhao, X.; Li, X.; Zhao, Q. Does the new energy vehicles adoption reduce carbon emissions? A perspective of spatial spillover effect. J. Arid Land Res. Environ. 2024, 38, 1–8. [Google Scholar]
- Li, X.M.; Pu Chen, P.; Wang, X.W. Impacts of renewables and socioeconomic factors on electric vehicle demands—Panel data studies across 14 countries. Energy Policy 2017, 109, 473–478. [Google Scholar] [CrossRef]
- Wang, S.; Wang, J.; Cheng, J. Does the promotion and application of new energy vehicles contribute to the reduction of carbon intensity? A quasi-natural experiment analysis. Sustain. Futures 2025, 9, 100455. [Google Scholar] [CrossRef]
- Xiong, Y.Q.; Qian Cheng, Q. Effects of new energy vehicle adoption on provincial energy efficiency in China: From the perspective of regional imbalances. Energy 2023, 281, 128324. [Google Scholar] [CrossRef]
- Liu, D.; Xiao, B. Exploring the development of electric vehicles under policy incentives: A scenario-based system dynamics model. Energy Policy 2018, 120, 8–23. [Google Scholar] [CrossRef]
- Lin, J.L.; Fang, S.C.; Fang, S.R.; Tsai, F.S. Network embeddedness and technology transfer performance in R&D consortia in Taiwan. Technovation 2009, 29, 763–774. [Google Scholar]
- McJeon, H.C.; Clarke, L.; Kyle, P.; Wise, M.; Hackbarth, A.; Bryant, B.P.; Lempert, R.J. Technology interactions among low-carbon energy technologies: What can we learn from a large number of scenarios? Energy Econ. 2011, 33, 619–631. [Google Scholar] [CrossRef]
- Liu, X.; Gao, X. A survey analysis of low carbon technology diffusion in China’s iron & steel industry. J. Clean. Prod. 2016, 129, 88–101. [Google Scholar]
- Carauta, M.; Latynskiy, E.; Mssinger, J.; Gil, J.; Libera, A.; Hampf, A.; Monteiro, L.; Siebold, M.; Berger, T. Can preferential credit programs speed up the adoption of low-carbon agricultural systems in Mato Grosso, Brazil? Results from bioeconomic microsimulation. Reg. Environ. Change 2018, 18, 117–128. [Google Scholar] [CrossRef]
- Beak, Y.J.; Kim, K.Y.; Maeng, K.; Cho, Y. Is the environment-friendly factor attractive to customers when purchasing electric vehicles? Evidence from South Korea. Bus. Strategy Environ. 2020, 29, 996–1006. [Google Scholar] [CrossRef]
- Lin, B.; Wu, W. Why people want to buy electric vehicle: An empirical study in first-tier cities of China. Energy Policy 2018, 112, 233–241. [Google Scholar] [CrossRef]
- Pan, R.; Liang, Y.; Li, Y.; Zhou, K.; Miao, J. Environmental and health benefits of promoting new energy vehicles: A case study based on Chongqing city. Sustainability 2023, 15, 9257. [Google Scholar] [CrossRef]
- Zhang, H.; Liu, Y.; Tan, X.; Qi, Y.; Yang, L.; Jia, M. Research on the impact of leap-forward development of new energy vehicles on urban traffic congestion. Chin. J. Manag. Sci. 2024; in press. [Google Scholar]
- Yang, Z.; Li, Q.; Yan, Y.; Shang, W.L.; Ochieng, W. Examining influence factors of Chinese electric vehicle market demand based on online reviews under moderating effect of subsidy policy. Appl. Energy 2022, 326, 120019. [Google Scholar] [CrossRef]
- Liu, L.; Zhang, T.; Avrin, A.; Wang, X. Is China’s industrial policy effective? An empirical study of the new energy vehicles industry. Technol. Soc. 2020, 63, 101356. [Google Scholar] [CrossRef]
- Kuang, Y.; Wang, Q. Analysis of the influence of China’s industrial policy on the development of new energy automobile industry. Ind. Technol. BBS 2014, 13, 15–16+37. [Google Scholar]
- Zhu, X.; Ren, M.; Wu, G.; Pei, J.; Pardalos, P.M. Promoting new energy vehicles consumption: The effect of implementing carbon regulation on automobile industry in China. Comput. Ind. Eng. 2019, 135, 211–226. [Google Scholar] [CrossRef]
- Zhao, P.; Zeng, L.; Li, P.; Lu, H.; Hu, H.; Li, C.; Zheng, M.; Li, H.; Yu, Z.; Yuan, D.; et al. China’s transportation sector carbon dioxide emissions efficiency and its influencing factors based on the EBM DEA model with undesirable outputs and spatial Durbin model. Energy 2022, 238, 121934. [Google Scholar] [CrossRef]
- Yao, X.; Hao, Z.; Wang, Z.; Zhu, Z.; Chen, Z.; Wu, Q. Policy incentives and market mechanisms dual-driven framework for new energy vehicles promotion. Energy Policy 2025, 199, 114530. [Google Scholar] [CrossRef]
- Liao, D.; Tan, B. An evolutionary game analysis of new energy vehicles promotion considering carbon tax in post-subsidy era. Energy 2023, 264, 126156. [Google Scholar] [CrossRef]
- Yao, X.; Ma, S.; Bai, Y.; Jia, N. When are new energy vehicle incentives effective? Empirical evidence from 88 pilot cities in China. Transp. Res. Part A Policy Pract. 2022, 165, 207–224. [Google Scholar] [CrossRef]
- Li, Y.; Zhan, C.; Jong, M.; Lukszo, Z. Business innovation and government regulation for the promotion of electric vehicle use: Lessons from Shenzhen, China. J. Clean. Prod. 2016, 134, 371–383. [Google Scholar] [CrossRef]
- Huang, Z.; Yao, C.; Wang, X. Discrimination on Some Fundamental Concepts of Green Development Theory and Their Relationships. Stud. Dial. Nat. 2015, 31, 108–113. [Google Scholar]
- Zhu, D. Xi Jin-ping’s green development concept: Thought foundation, connotative system and contemporary value. Economist 2020, 3, 5–15. [Google Scholar]
- Xu, X.; Fan, H.; Su, Y.; Zheng, Z. Research on the driving factors of China’s green economy development level. J. Quant. Technol. Econ. 2021, 38, 65–82. [Google Scholar]
- Yang, L.; Hu, X. Analysis on regional difference and convergence of the efficiency of China’s green economy based on DEA. Economist 2010, 2, 46–54. [Google Scholar]
- Che, L.; Bai, Y.; Zhou, L.; Wang, F.; Ji, X.; Qiao, F. Spatial pattern and spillover effects of green development efficiency in China. Sci. Geogr. Sin. 2018, 38, 1788–1798. [Google Scholar]
- Hao, S.; Zhu, X. Spatial Econometrics for Influencing Factors of Regional Green Development of China. Econ. Surv. 2019, 36, 10–17. [Google Scholar]
- Zhou, L.; Che, L.; Zhou, C. Spatio-temporal evolution and influencing factors of urban green development efficiency in China. Acta Geogr. Sin. 2019, 74, 2027–2044. [Google Scholar] [CrossRef]
- Zhao, W. Can Coordination of two-way FDI promote urban green development? --empirical evidence from the Yangtze river delta urban agglomeration. J. Nantong Univ. Soc. Sci. Ed. 2023, 39, 49–61. [Google Scholar]
- Yue, S.; Zou, Y.; Hu, Y. The combined effects of industrial agglomeration on the efficiency of urban green development. Urb. Prob. 2015, 10, 49–54. [Google Scholar]
- He, A.; An, M. Competition among local governments, environmental regulation and green development efficiency. China Popul. Resour. Environ. 2019, 29, 21–30. [Google Scholar]
- Tang, J.; Shan, Y.; Cai, C. Research on the impact of population migration on the level of green development-interprovincial panel analysis based on spatial Dubin model. World Surv. Res. 2023, 8, 79–88. [Google Scholar]
- Zhao, Y.; Wang, J.; Pan, W. Regional Characteristics and Impact Mechanisms of New Urbanization and Green Development Level in China at the Provincial Level. Econ. Geogr. 2023, 43, 1–9. [Google Scholar]
- Wu, X.; Ren, B.; Ge, P. Coupling and coordinating relationship between technological innovation and green development in the Yellow River Basin. China Popul. Resour. Environ. 2022, 32, 20–28. [Google Scholar]
- Liao, H.; Peng, S.; Li, L.; Zhu, Y. The role of governmental policy in game between traditional fuel and new energy vehicles. Comput. Ind. Eng. 2022, 169, 108292. [Google Scholar] [CrossRef]
- Jochem, P.; Babrowski, S.; Fichtner, W. Assessing CO2 emissions of electric vehicles in Germany in 2030. Transp. Res. Part A Policy Pract. 2015, 78, 68–83. [Google Scholar] [CrossRef]
- Trost, T.; Sterner, M.; Bruckner, T. Impact of electric vehicles and synthetic gaseous fuels on final energy consumption and carbon dioxide emissions in Germany based on long-term vehicle fleet modelling. Energy 2017, 141, 1215–1225. [Google Scholar] [CrossRef]
- Lane, B.; Shaffer, B.; Samuelsen, S. A comparison of alternative vehicle fueling infrastructure scenarios. Appl. Energy 2020, 259, 114128. [Google Scholar] [CrossRef]
- Su, C.W.; Yuan, X.; Tao, R.; Umar, M. Can new energy vehicles help to achieve carbon neutrality targets? J. Environ. Manag. 2021, 297, 113348. [Google Scholar] [CrossRef] [PubMed]
- Jiang, D.; Song, L.; Wang, L. Analysis on Impact of Energy Consumption and Carbon Emission of New Energy Vehicles Based on GREET Software. Automob. Appl. Technol. 2022, 47, 15–21. [Google Scholar]
- Zhao, D.; Ji, S.F.; Wang, H.P.; Jiang, L.W. How do government subsidies promote new energy vehicle diffusion in the complex network context? A three-stage evolutionary game model. Energy 2021, 230, 120899. [Google Scholar] [CrossRef] [PubMed]
- Girardi, P.; Gargiulo, A.; Brambilla, P.C. A comparative LCA of an electric vehicle and an internal combustion engine vehicle using the appropriate power mix: The Italian case study. Int. J. Life Cycle Assess. 2015, 20, 1127–1142. [Google Scholar] [CrossRef]
- Pellegrini, A.; Yao, X.; Rose, J.M.; Ma, S. An autoregressive spatial stochastic frontier analysis for quantifying the sales efficiency of the electric vehicle market: An application to 88 pilot cities in China. Transp. Res. Part A Policy Pract. 2025, 193, 104388. [Google Scholar] [CrossRef]
- Tan, R.; Tang, D.; Lin, B. Policy impact of new energy vehicles promotion on air quality in Chinese cities. Energy Policy 2018, 118, 33–40. [Google Scholar] [CrossRef]
- Zhang, X.; Song, G.; Yan, Y. The impact of urban low-carbon transportation system on the improvement of the structure of energy consumption-evidence from 14 cities in China. Chin. J. Manag. Sci. 2020, 28, 173–183. [Google Scholar]
- Ruan, X.; Liu, Q. Threshold effects of new energy vehicle subsidy policies on mobile sources of pollution. Econ. Res. Guide 2020, 7, 127–131. [Google Scholar]
- Guo, X.; Wang, F. Government Subsidies, Demand Substitution and Emission Reduction Effects under the Dual Carbon Target: Evidence from China’s Passenger Car Market. J. Quant. Technol. Econ. 2024, 41, 131–150. [Google Scholar]
- Sheldon, T.L.; Dua, R. Measuring the cost-effectiveness of electric vehicle subsidies. Energy Econ. 2019, 84, 104545. [Google Scholar] [CrossRef]
- Ju, X.; Sun, B.; Jin, J. The effect of new energy vehicle policies on traffic congestion: Evidence from Beijing. Bus. Manag. Res. 2018, 7, 9–21. [Google Scholar] [CrossRef]
- Quddus, M.A.; Yavuz, M.; Usher, J.M.; Marufuzzaman, M. Managing load congestion in electric vehicle charging stations under power demand uncertainty. Expert Syst. Appl. 2019, 125, 195–220. [Google Scholar] [CrossRef]
- Wang, K.L.; Zheng, L.J.; Zhang, J.Z.; Yao, H.J. The impact of promoting new energy vehicles on carbon intensity: Causal evidence from China. Energy Econ. 2022, 114, 106255. [Google Scholar] [CrossRef]
- Xie, Y.; Wu, D.; Zhu, S. Can new energy vehicles subsidy curb the urban air pollution? Empirical evidence from pilot cities in China. Sci. Total Environ. 2021, 754, 142232. [Google Scholar] [CrossRef]
- Cai, J.Y.; Zhu, M.Z.; Wu, J.; Chen, X.L.; Xu, J.J.; Shen, Z.Y. Evaluating the impact of new energy vehicle subsidies on urban carbon emissions: Evidence from 261 Chinese cities. Renew. Energy 2025, 240, 122261. [Google Scholar] [CrossRef]
- Dixon, J.; Bukhsh, W.; Edmunds, C.; Bell, K. Scheduling electric vehicle charging to minimise carbon emissions and wind curtailment. Renew. Energy 2020, 161, 1072–1091. [Google Scholar] [CrossRef]
- Teixeira, A.C.R.; Sodre, J.R. Impacts of replacement of engine powered vehicles by electric vehicles on energy consumption and CO2 emissions. Transp. Res. Part D Transp. Environ. 2018, 59, 375–384. [Google Scholar] [CrossRef]
- Lander, L.; Kallitsis, E.; Hales, A.; Edge, J.S.; Korre, A.; Offer, G. Cost and carbon footprint reduction of electric vehicle lithium-ion batteries through efficient thermal management. Appl. Energy 2021, 289, 116737. [Google Scholar] [CrossRef]
- He, H.; Li, S.; Wang, S.; Zhang, J.; Ma, F. Value of dual-credit policy: Evidence from green technology innovation efficiency. Transp. Policy 2023, 139, 182–198. [Google Scholar] [CrossRef]
- Xu, L.; Su, J. From government to market and from producer to consumer: Transition of policy mix towards clean mobility in China. Energy Policy 2016, 96, 328–340. [Google Scholar] [CrossRef]
- Han, J.; Chen, X. The Digital Economy Enables Green Development: The Internal Mechanism and Empirical Evidence. Comp. Econ. Soc. Syst. 2022, 2, 73–84. [Google Scholar]
- Wang, Z.; Zhao, C.; Yin, J.; Zhang, B. Purchasing intentions of Chinese citizens on new energy vehicles: How should one respond to current preferential policy? J. Clean. Prod. 2017, 161, 1000–1010. [Google Scholar] [CrossRef]
- Yu, H.; Li, Y.; Wei, W. Does the dual-credit policy promote the technological development of new energy vehicles? An industry chain reconstruction perspective. Heliyon 2024, 10, e31009. [Google Scholar] [CrossRef] [PubMed]
- Pu, G.; Zhu, X.; Dai, J.; Chen, X. Understand technological innovation investment performance: Evolution of industry-university-research cooperation for technological innovation of lithium-ion storage battery in China. J. Energy Storage 2022, 46, 103607. [Google Scholar] [CrossRef]
- Gong, H.; Hansen, T. The rise of China ’s new energy vehicle lithium-ion battery industry: The coevolution of battery technological innovation systems and policies. Environ. Innov. Soc. Trans. 2023, 46, 100689. [Google Scholar] [CrossRef]
- Yu, H.; Li, Y.; Wang, W. Optimal innovation strategies of automakers with market competition under the dual-credit policy. Energy 2023, 283, 128403. [Google Scholar] [CrossRef]
- Nie, Y.; Wen, H. Green economic efficiency of Chinese city at the level of municipality or above. China Popul. Resour. Environ. 2015, 25, 409–413. [Google Scholar]
- Skippon, S.M.; Kinnear, N.; Lloyd, L.; Stannard, J. How experience of use influences mass-market drivers’ willingness to consider a battery electric vehicle: A randomised controlled trial. Transp. Res. Part A Policy Pract. 2016, 92, 26–42. [Google Scholar] [CrossRef]
- Wang, Y.; Liao, Z. Functional industrial policy mechanism under natural resource conflict: A case study on the Chinese new energy vehicle industry. Res. Policy 2023, 81, 103417. [Google Scholar] [CrossRef]
- Shao, W.; Yang, K.; Bai, X. Impact of financial subsidies on the R&D intensity of new energy vehicles: A case study of 88 listed enterprises in China. Energy. Strategy Rev. 2021, 33, 100580. [Google Scholar]
- Jin, W.; Zhang, H.; Mao, G.; Chen, S.; Zhang, C. Influence of transportation infrastructure investment on energy consumption in China from 1994 to 2014. Res. Sci. 2016, 38, 2283–2294. [Google Scholar]
- Song, D.; Li, C.; Li, X. Does the construction of new infrastructure promote the ‘quantity’ and ‘quality’ of green technological innovation--evidence from the national smart city pilot. China Popul. Resour. Environ. 2021, 11, 155–164. [Google Scholar]
- Zhang, L.; Qin, Q. China’s new energy vehicle policies: Evolution, comparison and recommendation. Transp. Res. Part A Policy Pract. 2018, 110, 57–72. [Google Scholar] [CrossRef]
- Du, H.; Liu, D.; Sovacool, B.K.; Wang, Y.; Ma, S.; Li, R.Y.M. Who buys new energy vehicles in China? Assessing social-psychological predictors of purchasing awareness, intention, and policy. Transp. Res. Part F Traffic Psychol. Behav. 2018, 58, 56–69. [Google Scholar] [CrossRef]
- Ma, S.C.; Fan, Y.; Feng, L. An evaluation of government incentives for new energy vehicles in China focusing on vehicle purchasing restrictions. Energy Policy 2017, 110, 609–618. [Google Scholar] [CrossRef]
- Li, X.; Liu, Y. Research on the impact of charging infrastructure on the promotion of new energy vehicles. China Soft Sci. 2023, 1, 63–72. [Google Scholar]
- Xiong, Y.; Lin, Y. On how the local protectionist policies affect the promotion of China’s new energy vehicle market. J. Cent. South Univ. Soc. Sci. 2024, 30, 85–100. [Google Scholar]
- Zhao, T.; Zhang, Z.; Liang, S. Digital economy, entrepreneurship, and high-quality economic development: Empirical evidence from urban China. J. Manag. World 2020, 36, 65–76. [Google Scholar]

| References | Explained Variable | Explanatory Variable | Mediating Variables |
|---|---|---|---|
| Wang et al., 2025 [15] | Carbon intensity | Promote and apply pilot policies for new energy vehicles | The upgrading of the transportation industry structure and innovation of green technology |
| Tan et al., 2018 [57] | Nitrogen dioxide concentration | Policy of “Ten Cities, Ten Thousand New Energy Vehicles Project” | |
| Wang et al., 2022 [64] | Carbon intensity | Policy implementation of “Thousands of Vehicles, Ten of Cities” (TVTC) | The number of newly registered electric vehicles, trams, pure electric vehicles, hybrid buses, taxis, buses, and trams |
| Gu et al., 2022 [8] | Greenhouse gas emissions (GHGs) | New energy vehicle ownership | Fuel-fired car ownership, the number of end-of-life vehicles, and the traffic congestion index |
| Xie et al., 2021 [65] | Urban air pollution | NEV subsidy | |
| Cai et al., 2025 [66] | Carbon emission | NEV subsidy policy | |
| Xiong and Cheng, 2023 [16] | Energy efficiency | The total number of NEVs applied in each province | Inter-provincial electricity transmission and renewable energy development |
| This paper | Green development level (GDL) | NEVP | The digital economy level, industrial structure upgrading, and the transport infrastructure construction level |
| Province | 2011 | 2012 | 2013 | 2014 | 2015 | 2016 | 2017 | 2018 | 2019 | 2020 | 2021 | 2022 |
|---|---|---|---|---|---|---|---|---|---|---|---|---|
| Anhui | 0.445 | 0.462 | 0.477 | 0.476 | 0.493 | 0.498 | 0.527 | 0.523 | 0.519 | 0.538 | 0.537 | 0.542 |
| Beijing | 0.489 | 0.513 | 0.538 | 0.571 | 0.573 | 0.587 | 0.609 | 0.584 | 0.576 | 0.556 | 0.571 | 0.579 |
| Fujian | 0.455 | 0.491 | 0.493 | 0.493 | 0.506 | 0.512 | 0.539 | 0.516 | 0.542 | 0.561 | 0.559 | 0.530 |
| Gansu | 0.334 | 0.353 | 0.359 | 0.372 | 0.394 | 0.406 | 0.444 | 0.437 | 0.449 | 0.475 | 0.456 | 0.401 |
| Guangdong | 0.497 | 0.517 | 0.535 | 0.528 | 0.555 | 0.546 | 0.578 | 0.588 | 0.592 | 0.599 | 0.606 | 0.615 |
| Guangxi | 0.420 | 0.425 | 0.438 | 0.428 | 0.445 | 0.457 | 0.451 | 0.454 | 0.466 | 0.480 | 0.474 | 0.487 |
| Guizhou | 0.354 | 0.394 | 0.409 | 0.410 | 0.440 | 0.444 | 0.438 | 0.458 | 0.477 | 0.492 | 0.496 | 0.492 |
| Hainan | 0.402 | 0.418 | 0.428 | 0.411 | 0.436 | 0.463 | 0.445 | 0.452 | 0.444 | 0.471 | 0.492 | 0.511 |
| Hebei | 0.390 | 0.426 | 0.440 | 0.445 | 0.484 | 0.493 | 0.509 | 0.508 | 0.512 | 0.529 | 0.502 | 0.413 |
| Henan | 0.407 | 0.410 | 0.416 | 0.423 | 0.441 | 0.469 | 0.474 | 0.475 | 0.471 | 0.498 | 0.486 | 0.499 |
| Heilongjiang | 0.356 | 0.364 | 0.399 | 0.399 | 0.426 | 0.435 | 0.435 | 0.432 | 0.459 | 0.470 | 0.462 | 0.473 |
| Hubei | 0.412 | 0.434 | 0.456 | 0.458 | 0.468 | 0.497 | 0.486 | 0.494 | 0.499 | 0.523 | 0.516 | 0.521 |
| Hunan | 0.422 | 0.433 | 0.441 | 0.451 | 0.469 | 0.493 | 0.491 | 0.505 | 0.518 | 0.533 | 0.527 | 0.534 |
| Jilin | 0.365 | 0.396 | 0.417 | 0.419 | 0.432 | 0.462 | 0.408 | 0.440 | 0.449 | 0.471 | 0.473 | 0.483 |
| Jiangsu | 0.504 | 0.518 | 0.537 | 0.540 | 0.562 | 0.566 | 0.580 | 0.575 | 0.581 | 0.607 | 0.603 | 0.605 |
| Jiangxi | 0.431 | 0.445 | 0.447 | 0.444 | 0.452 | 0.453 | 0.505 | 0.501 | 0.496 | 0.525 | 0.523 | 0.545 |
| Liaoning | 0.380 | 0.407 | 0.425 | 0.407 | 0.431 | 0.458 | 0.456 | 0.461 | 0.470 | 0.491 | 0.489 | 0.418 |
| Inner Mongolia | 0.406 | 0.420 | 0.436 | 0.457 | 0.478 | 0.482 | 0.483 | 0.473 | 0.477 | 0.494 | 0.492 | 0.510 |
| Shandong | 0.491 | 0.515 | 0.529 | 0.516 | 0.538 | 0.556 | 0.553 | 0.543 | 0.542 | 0.560 | 0.560 | 0.560 |
| Shanxi | 0.404 | 0.416 | 0.431 | 0.426 | 0.430 | 0.441 | 0.446 | 0.460 | 0.476 | 0.480 | 0.480 | 0.497 |
| Shaanxi | 0.434 | 0.452 | 0.466 | 0.470 | 0.485 | 0.492 | 0.476 | 0.479 | 0.480 | 0.500 | 0.490 | 0.508 |
| Shanghai | 0.416 | 0.452 | 0.457 | 0.462 | 0.489 | 0.510 | 0.529 | 0.508 | 0.505 | 0.517 | 0.512 | 0.523 |
| Sichuan | 0.403 | 0.414 | 0.420 | 0.413 | 0.431 | 0.448 | 0.446 | 0.456 | 0.460 | 0.480 | 0.466 | 0.479 |
| Tianjin | 0.482 | 0.501 | 0.513 | 0.500 | 0.518 | 0.540 | 0.531 | 0.487 | 0.534 | 0.522 | 0.515 | 0.510 |
| Yunnan | 0.370 | 0.417 | 0.422 | 0.437 | 0.432 | 0.432 | 0.467 | 0.453 | 0.455 | 0.456 | 0.472 | 0.489 |
| Zhejiang | 0.507 | 0.522 | 0.529 | 0.542 | 0.557 | 0.568 | 0.569 | 0.579 | 0.591 | 0.604 | 0.588 | 0.576 |
| Chongqing | 0.489 | 0.491 | 0.496 | 0.490 | 0.504 | 0.518 | 0.511 | 0.497 | 0.498 | 0.530 | 0.527 | 0.527 |
| Variables | Definitions | Types |
|---|---|---|
| GDL | Green development level | Explained variable |
| PLNEV | Promotion level of new energy vehicles | Explanatory variable |
| FD | Fiscal decentralization | Control variable |
| FDI | Foreign direct investment | Control variable |
| DO | Degree of opening up | Control variable |
| ER | Environmental regulation | Control variable |
| DEL | Digital economy level | Mediating variable |
| ISU | Industrial structure upgrading | Mediating variable |
| TICL | Transport infrastructure construction level | Mediating variable |
| Primary Indicator | Secondary Indicators | Indicator Measurement Method | Unit | Indicator Direction |
|---|---|---|---|---|
| Economic benefits | Government financial capacity | Per capita local fiscal revenue | Yuan/person | + |
| Economic development level | Per capita gross domestic product (GDP) | Yuan/person | + | |
| Socioeconomic contribution rate | Industrial added value/GDP | % | + | |
| Economic growth quality | The proportion of added value of the tertiary industry to the GDP | % | + | |
| Green innovation | Green R&D funding investment | Expenditure on R&D and experimental development funds for industrial enterprises above a designated size/GDP | % | + |
| Green R&D personnel intensity | Full-time equivalent R&D personnel of industrial enterprises above a designated size | Person/year | + | |
| Green innovation capability | Number of green invention patent authorizations | Number/year | + | |
| Efficiency of achievement conversion | Technology market turnover/GDP | % | + | |
| Environmental governance | Pollution control | Proportion of local government environmental protection expenditure to general budget expenditure | % | + |
| Cycle regeneration | Utilization rate of general industrial solid waste | % | + | |
| The total amount of industrial wastewater has decreased | (Total amount of industrial wastewater in the previous period-total amount of industrial wastewater in the current period)/total amount of industrial wastewater in the previous period | % | + | |
| Reduction in total industrial sulfur dioxide emissions | (Total amount of industrial sulfur dioxide in the previous period-total amount of industrial sulfur dioxide in the current period)/total amount of industrial sulfur dioxide in the previous period | % | + | |
| Reduction in total industrial smoke and dust | (Total amount of industrial smoke and dust in the previous period-total amount of industrial smoke and dust in the current period)/total amount of industrial smoke and dust in the previous period | % | + | |
| Green life | Green travel | Number of standard urban public transportation vehicles/total population of the city | Standard platform/10,000 people | + |
| Wastewater treatment level | Wastewater treatment capacity/total sewage discharge | % | + | |
| Harmless level of household waste disposal | Harmless treatment capacity of household waste/output of household waste | % | + | |
| Forest greening level | Forest area/total land area | % | + | |
| Park greening level | Urban park green area/total urban population | Square meters/person | + | |
| Road traffic level | Urban road area/urban population | Square meters | + |
| Project | Index | Variables | Positive or Negative |
|---|---|---|---|
| Comprehensive development index of the digital economy | Internet penetration | Number of Internet users per 100 people | Positive |
| Number of Internet-related employees | Proportion of computer services and software employees | Positive | |
| Internet-related output | Total telecom services per capita | Positive | |
| Number of mobile Internet users | Number of mobile phone users per 100 people | Positive | |
| Digital finance inclusive development | China digital inclusive finance index | Positive |
| Variables | Obs. | Mean | Std. Dev. | Min | Max |
|---|---|---|---|---|---|
| GDL | 324 | 0.480 | 0.050 | 0.356 | 0.606 |
| PLNEV | 324 | 2.380 | 1.720 | 0.000 | 5.793 |
| FD | 324 | 6.500 | 2.500 | 3.812 | 14.586 |
| FDI | 324 | 0.020 | 0.020 | 0.001 | 0.105 |
| DO | 324 | 0.290 | 0.280 | 0.033 | 1.294 |
| ER | 324 | 0.000 | 0.000 | 0.000 | 0.011 |
| DEL | 324 | 0.600 | 0.070 | 0.485 | 0.850 |
| ISU | 324 | 1.390 | 0.770 | 0.638 | 5.022 |
| TICL | 324 | 1.040 | 0.470 | 0.143 | 2.125 |
| Variables | LLC | IPS | Whether It Is Stable |
|---|---|---|---|
| GDL | −5.66 *** | −2.15 *** | Yes |
| PLNEV | −6.64 *** | −6.95 *** | Yes |
| FD | −5.93 *** | −5.23 *** | Yes |
| FDI | −6.17 *** | −2.53 *** | Yes |
| DO | −3.30 *** | −2.89 *** | Yes |
| ER | −9.27 *** | −3.57 *** | Yes |
| DEL | −9.25 *** | −2.38 *** | Yes |
| ISU | −2.52 *** | −5.20 *** | Yes |
| TCIL | −7.85 *** | −2.48 *** | Yes |
| Variables | GDL | PLNEV | FD | FDI | DO | ER |
|---|---|---|---|---|---|---|
| GDL | 1 | |||||
| PLNEV | 0.68 *** | 1 | ||||
| FD | 0.22 *** | 0.07 | 1 | |||
| FDI | 0.12 ** | −0.09 | 0.40 *** | 1 | ||
| DO | 0.47 *** | 0.15 *** | 0.65 *** | 0.42 *** | 1 | |
| ER | −0.37 *** | −0.43 *** | 0.04 | 0.02 | −0.22 *** | 1 |
| Variables | PLNEV | FD | FDI | DO | ER | DEL | ISU | TCIL |
|---|---|---|---|---|---|---|---|---|
| VIF | 4.01 | 3.39 | 1.54 | 2.59 | 1.45 | 6.09 | 1.98 | 1.99 |
| Variables | Model (1) | Model (2) | Model (3) | Model (4) | Model (5) |
|---|---|---|---|---|---|
| GDL | GDL | GDL | GDL | GDL | |
| PLNEV | 0.017 *** | 0.016 *** | 0.016 *** | 0.015 *** | 0.015 *** |
| (0.001) | (0.001) | (0.001) | (0.001) | (0.001) | |
| FD | 0.008 *** | 0.010 *** | 0.010 *** | 0.010 *** | |
| (0.002) | (0.002) | (0.002) | (0.002) | ||
| FDI | −0.189 * | −0.191 * | −0.175 | ||
| (0.108) | (0.107) | (0.108) | |||
| DO | −0.016 | −0.019 | |||
| (0.015) | (0.015) | ||||
| ER | −0.823 | ||||
| (0.713) | |||||
| Constant term | 0.443 *** | 0.394 *** | 0.388 *** | 0.389 *** | 0.392 *** |
| (0.007) | (0.014) | (0.015) | (0.015) | (0.015) | |
| LR test | Pass | Pass | Pass | Pass | Pass |
| Model selection | Random effect | Random effect | Random effect | Random effect | Random effect |
| N | 324 | 324 | 324 | 324 | 324 |
| Variables | Digital Economy Level | Industrial Structure Upgrading | Transportation Infrastructure Construction Level | ||||
|---|---|---|---|---|---|---|---|
| DEL | GDL | ISU | GDL | TICL | GDL | ||
| Core explanatory variable | PLNEV | 0.026 *** | 0.003 ** | 0.075 *** | 0.012 *** | 0.048 *** | 0.012 *** |
| (0.001) | (0.001) | (0.008) | (0.001) | (0.004) | (0.001) | ||
| Mediating variables | DEL | - | 0.420 *** | - | - | - | - |
| (0.041) | |||||||
| ISU | - | - | - | 0.032 *** | - | - | |
| (0.006) | |||||||
| TICL | - | - | - | - | - | 0.050 *** | |
| (0.012) | |||||||
| Control variables | FD | 0.013 *** | 0.008 *** | 0.070 *** | 0.008 *** | 0.017 * | 0.009 *** |
| (0.002) | (0.002) | (0.023) | (0.002) | (0.010) | (0.002) | ||
| FDI | −0.606 *** | −0.010 | −3.995 *** | −0.044 | −0.327 | −0.170 | |
| (0.121) | (0.097) | (0.973) | (0.106) | (0.425) | (0.104) | ||
| DO | −0.002 | −0.013 | −0.796 *** | −0.004 | 0.226 *** | −0.036 ** | |
| (0.015) | (0.013) | (0.144) | (0.015) | (0.063) | (0.015) | ||
| ER | −3.307 *** | 0.615 | −1.537 *** | −0.320 | −1.072 | −0.752 | |
| (0.847) | (0.627) | (6.248) | (0.679) | (2.740) | (0.695) | ||
| Bootstrap test | Digital economy level | Industrial structure upgrading | Transportation infrastructure construction level | ||||
| upper bound | lower bound | upper bound | lower bound | upper bound | lower bound | ||
| Mediation path | 0.0049 | 0.0108 | 0.0002 | 0.0019 | 0.0002 | 0.0028 | |
| Direct path | 0.0088 | 0.0157 | 0.0166 | 0.0218 | 0.0153 | 0.0218 | |
| Variables | Eastern Region | Central Region | Western Region |
|---|---|---|---|
| GDL | GDL | GDL | |
| PLNEV | 0.013 *** | 0.017 *** | 0.011 *** |
| (0.002) | (0.001) | (0.002) | |
| FD | 0.006 ** | 0.031 *** | 0.012 *** |
| (0.003) | (0.006) | (0.004) | |
| FDI | −0.119 | −0.254 | −0.312 |
| (0.127) | (0.290) | (0.395) | |
| DO | −0.040 ** | −0.220 *** | −0.056 |
| (0.020) | (0.069) | (0.071) | |
| ER | 1.359 | −0.696 | −4.200 *** |
| (1.062) | (1.339) | (1.177) | |
| _cons | 0.458 *** | 0.289 *** | 0.385 *** |
| (0.024) | (0.030) | (0.033) | |
| LR test | Pass | Pass | Pass |
| Model selection | Random effect | Random effect | Random effect |
| N | 132 | 96 | 96 |
| Regions | Variables | DEL | GDL | ISU | GDL | TICL | GDL |
|---|---|---|---|---|---|---|---|
| Eastern region | PLNEV | 0.024 *** | 0.008 *** | 0.054 *** | 0.012 *** | 0.037 *** | 0.010 *** |
| (0.002) | (0.002) | (0.015) | (0.002) | (0.005) | (0.002) | ||
| DEL | 0.225 *** | ||||||
| (0.072) | |||||||
| ISU | 0.014 * | ||||||
| (0.008) | |||||||
| TICL | 0.081 *** | ||||||
| (0.027) | |||||||
| Central region | PLNEV | 0.026 *** | 0.003 | 0.101 *** | 0.012 *** | 0.038 *** | 0.014 *** |
| (0.002) | (0.002) | (0.013) | (0.002) | (0.007) | (0.002) | ||
| DEL | 0.535 *** | ||||||
| (0.053) | |||||||
| ISU | 0.048 *** | ||||||
| (0.011) | |||||||
| TICL | 0.065 *** | ||||||
| (0.014) | |||||||
| Western region | PLNEV | 0.028 *** | 0.000 | 0.068 *** | 0.007 *** | 0.057 *** | 0.009 *** |
| (0.002) | (0.002) | (0.015) | (0.002) | (0.007) | (0.002) | ||
| DEL | 0.421 *** | ||||||
| (0.072) | |||||||
| ISU | 0.055 *** | ||||||
| (0.011) | |||||||
| TICL | 0.033 *** | ||||||
| (0.012) | |||||||
| Control variable | Yes | Yes | Yes | Yes | Yes | Yes |
| Variables | GE | DEL | GE | ISU | GE | TICL | GE |
|---|---|---|---|---|---|---|---|
| PLNEV | 0.005 ** | 0.026 *** | 0.006 * | 0.075 *** | 0.003 | 0.048 *** | 0.001 |
| (0.002) | (0.001) | (0.004) | (0.008) | (0.003) | (0.004) | (0.003) | |
| DEL | 0.403 ** | ||||||
| (0.111) | |||||||
| ISU | 0.023 | ||||||
| (0.015) | |||||||
| TICL | 0.070 ** | ||||||
| (0.034) | |||||||
| Control variable | Yes | Yes | Yes | Yes | Yes | Yes |
| Variables | GE | DEL | GE | ISU | GE | TICL | GE |
|---|---|---|---|---|---|---|---|
| PLNEV | 0.006 | 0.002 | 0.012 | 0.001 | 0.006 | 0.018 | 0.005 |
| (0.009) | (0.001) | (0.009) | (0.030) | (0.009) | (0.013) | (0.009) | |
| DEL | −2.662 ** | ||||||
| (1.035) | |||||||
| ISU | −0.112 * | ||||||
| (0.055) | |||||||
| TICL | 0.027 | ||||||
| (0.065) | |||||||
| Control variable | Yes | Yes | Yes | Yes | Yes | Yes |
| Variables | DEL_new | GDL | ISU_new | GDL | TICL_new | GDL |
|---|---|---|---|---|---|---|
| PLNEV | 0.070 *** | 0.003 *** | 0.025 *** | 0.008 *** | 0.063 *** | 0.013 *** |
| (0.003) | (0.001) | (0.002) | (0.001) | (0.006) | (0.001) | |
| DEL_new | 0.159 *** | |||||
| (0.014) | ||||||
| ISU_new | 0.253 *** | |||||
| (0.031) | ||||||
| TICL_new | 0.029 *** | |||||
| (0.007) | ||||||
| Control variable | Yes | Yes | Yes | Yes | Yes | Yes |
| Variables | DEL_new | GDL | ISU_new | GDL | TICL_new | GDL |
|---|---|---|---|---|---|---|
| PLNEV | 0.006 * | −0.003 ** | 0.010 *** | −0.004 ** | 0.029 | −0.004 ** |
| (0.003) | (0.002) | (0.003) | (0.002) | (0.026) | (0.001) | |
| DEL_new | −0.020 | |||||
| (0.065) | ||||||
| ISU_new | 0.059 | |||||
| (0.049) | ||||||
| TICL_new | 0.004 | |||||
| (0.006) | ||||||
| Control variable | Yes | Yes | Yes | Yes | Yes | Yes |
| Methods | Explanatory Variable Lag Phase I | Random Elimination Year |
|---|---|---|
| Variables | GDL | GDL |
| PLNEV | 0.013 *** | |
| (0.001) | ||
| L.PLNEV | 0.013 *** | |
| (0.001) | ||
| Control variable | Yes | Yes |
| Methods | Explanatory Variable Lag Phase I | Random Elimination Year |
|---|---|---|
| Variables | GDL | GDL |
| PLNEV | −0.003 | |
| (0.002) | ||
| L.PLNEV | −0.003 * | |
| (0.002) | ||
| Control variable | Yes | Yes |
| Variables | Phase I: PLNEV | Phase II: GDL | ||
|---|---|---|---|---|
| PLNEV | 0.042 *** | 0.041 *** | ||
| (0.004) | (0.005) | |||
| L.GDL | 14.663 *** | 13.827 *** | ||
| (2.962) | (3.644) | |||
| L2.GDL | 22.120 *** | 16.794 *** | ||
| (3.100) | (3.891) | |||
| Control variable | No | Yes | No | Yes |
| Hausman test | p< 0.01 | p < 0.01 | ||
| Unrecognizable inspection | 41.33 *** | 28.08 *** | ||
| Weak instrumental variable test | 59.15 *** | 61.02 *** | ||
| Over identification test | Pass | Pass | ||
| N | 324 | 324 | 324 | 324 |
Disclaimer/Publisher’s Note: The statements, opinions and data contained in all publications are solely those of the individual author(s) and contributor(s) and not of MDPI and/or the editor(s). MDPI and/or the editor(s) disclaim responsibility for any injury to people or property resulting from any ideas, methods, instructions or products referred to in the content. |
© 2025 by the authors. Licensee MDPI, Basel, Switzerland. This article is an open access article distributed under the terms and conditions of the Creative Commons Attribution (CC BY) license (https://creativecommons.org/licenses/by/4.0/).
Share and Cite
Wu, J.; Yi, H.; Zheng, X.; Liu, K. The Impact Path of New Energy Vehicle Promotion on Green Development—Empirical Research from the Provincial Level in China. Sustainability 2025, 17, 5684. https://doi.org/10.3390/su17135684
Wu J, Yi H, Zheng X, Liu K. The Impact Path of New Energy Vehicle Promotion on Green Development—Empirical Research from the Provincial Level in China. Sustainability. 2025; 17(13):5684. https://doi.org/10.3390/su17135684
Chicago/Turabian StyleWu, Jiang, Hongquan Yi, Xi Zheng, and Ke Liu. 2025. "The Impact Path of New Energy Vehicle Promotion on Green Development—Empirical Research from the Provincial Level in China" Sustainability 17, no. 13: 5684. https://doi.org/10.3390/su17135684
APA StyleWu, J., Yi, H., Zheng, X., & Liu, K. (2025). The Impact Path of New Energy Vehicle Promotion on Green Development—Empirical Research from the Provincial Level in China. Sustainability, 17(13), 5684. https://doi.org/10.3390/su17135684