Article

Going Deeper: Development and Validation of a Multidimensional DEEP Connection to Nature Scale

Psychology Department, University of California, San Diego, CA 92093, USA
*
Author to whom correspondence should be addressed.
Sustainability 2025, 17(13), 5680; https://doi.org/10.3390/su17135680
Submission received: 5 May 2025 / Revised: 10 June 2025 / Accepted: 16 June 2025 / Published: 20 June 2025
(This article belongs to the Section Psychology of Sustainability and Sustainable Development)

Abstract

:
This study develops and provides psychometric validity of a new multidimensional measure of connection to nature (CTN)—the DEEP Connection to Nature Scale. Addressing limitations of existing scales, the new scale attempts to emphasize self-integration with nature while capturing the three commonly accepted aspects of connection to nature—Cognitive, Emotional, and Behavioral. Using both exploratory and confirmatory factor analyses across a sample of 1152 and 657 adults, respectively, a four-factor structure was validated: Depth of identity, Emotional connection, Experiential connection, and Presence within nature. The scale demonstrated good internal consistency, convergent validity with existing CTN measures, and predictive validity for pro-environmental behavior (PEB). Notably, the DEEP CTN Scale explained more variance in PEB (30%) compared to two widely used unidimensional measures. Specifically, people who are high Emotional connection and high Presence within nature report more PEB. These relationships remain robust when controlling for relevant covariates. As a point of comparison, predictive validity was conducted with a composite score of psychological well-being. People who are high in Presence within nature and low in Emotional connection report higher well-being. In sum, the DEEP CTN scale is a psychometrically sound, theory-driven measure that addresses key limitations of previous scales. As such, we hope it offers researchers and practitioners a tool to better understand and cultivate meaningful connections with nature.

1. Introduction

We are currently in the midst of several human-created environmental crises. To name a few: global heating from increased greenhouse gases, leading to increasing ocean levels from melting sea ice; increased likelihood of extreme weather events, mass species extinctions, and destruction and degradation of Earth’s rainforests; and mass dieback of coral reefs [1,2,3,4]. Despite growing concern for these environmental crises [5], researchers have sought to understand why actions addressing them are lacking. One proposed explanation is that humans are becoming more disconnected from the natural environment (e.g., referred to as “nature deficit disorder” [6] and “extinction of experience” [7]). With an increasing number of Earth’s population living in heavily industrialized societies, their daily connection with the ecosystem that sustains them is limited. As examples, food is delivered pre-packaged, grown in soil thousands of miles away; summer heats and winter chills have little impact on daily lives when climate-controlled conveniences keep homes and workplaces at a stable temperature year-round; a drought may result in a dead lawn, but the average American can still turn one of several taps in their home to access clean drinking water. In sum, there is growing evidence that humans have become more physically, emotionally, and cognitively disconnected from the natural world (see [8,9] for review).
Given that people’s growing disconnection with nature is likely to underlie their impassivity with respect to pro-environmental behaviors (PEBs), there has been an effort by researchers to find ways to enhance people’s connection to nature (CTN) by exploring its correlates. As an example, studies have shown that greater CTN is associated with more exposure to nature (e.g., taking frequent walks in nature), and these correlational findings have inspired the development of interventions showing that encouraging people to take more nature walks increases CTN (see [10,11] for a meta-analysis), with the hope that this then increases PEB. As part of this endeavor to understand the relationship between CTN and PEB, it is crucial to critically assess how CTN is defined and measured within the context of research studies. As such, the purpose of the current paper is to review what we see as the limitations of CTN measures and to present a newly validated scale, the DEEP Connection to Nature Scale, which we believe overcomes some of these limitations. Table 1 provides a list of CTN measures relevant to the discussion of these limitations.
The first limitation concerns how the conception of CTN tends to get muddied when researchers translate it into a measure. Specifically, one of the most agreed upon ways CTN has been conceptualized is in terms of the individual being integrated with the natural environment, using terms such as interconnectedness, a sense of we-ness, a fundamental sameness, feelings of oneness, or continuity with nature [12,13,14,15,16,17]. The idea of self-integration with nature is influenced heavily by early conservationists (e.g., Aldo Leopold [18]) and ecological philosophers (e.g., Aerne Naess [19] and Theodore Roszak [20]) who called for the elimination of the human–nature binary. They argued that it is the perceived separateness of humans from nature that leads to decreased concern for, and protection of, nature [19,20,21,22]. So important is the influence of these ecological philosophies that they are routinely cited in the introductory paragraph of papers that create and/or use CTN measures. Unfortunately, when researchers begin to develop CTN scales, the sense of self-integration with nature tends to get lost, as many of the items on such measures couch “nature” as an external entity existing “out there”, separate from humanity. For example, “My ideal vacation spot would be a remote, wilderness area” positions nature as a separate entity from humans. To address this issue, the scale development of the current paper attempted to use items that capture the spirit of self-integration with nature, such as “I think about the ‘shared breath’ between myself and plants; I breathe in the oxygen released by plants, and plants use the carbon dioxide I exhale.”
A second limitation with current CTN scales concerns the controversy regarding whether CTN is multidimensional or not. In its conceptualization, CTN has three commonly accepted aspects: (1) Cognitive—which includes beliefs, attitudes, motivations, and goals relating to nature; (2) Emotional—which taps into self-reported positive emotions that are often experienced within nature; and (3) Behavioral—which covers past and present experiences in nature and the frequency those experiences take place (see [22] for a review of these aspects, noting that there exists variance across studies in how these dimensions are named). Despite this, historically, CTN scales have been created as unidimensional, with researchers developing scales that emphasize only one of these three dimensions. For example, the Connectedness to Nature Scale [15,23] and the Inclusion of Nature in the Self scale [17] focus on the Cognitive component of CTN, while the Emotional Affinity with Nature scale [24] and the Love of Nature scale [25] focus on the Emotional component of CTN. This inconsistency has sparked a debate amongst researchers as to whether CTN should be considered a unidimensional (e.g., [26]) vs. multidimensional construct (e.g., [27,28,29,30]), as well as what these dimensions should be.
The recommended statistical way to identify if CTN is composed of multiple dimensions is to conduct some sort of structural analysis, e.g., factor analysis (see [22,27] for discussion). Only two of the early CTN measures have reported multidimensional structures through factor analysis with differing factor structures: the Nature Relatedness scale (NR) [31] and the Environmental Identity scale (EID) [32] (see [33] for factor analysis). Both the NR and EID share dimensions that map onto the Cognitive and Behavioral aspects of CTN, while the EID also includes the Emotional dimension. However, both scales contain items that map onto additional dimensions not traditionally thought to be related to CTN (a topic we return to in the Section 4). Specifically, the NR scale includes a dimension that represents one’s worldviews about the relationship between humans and nature. Note that this worldview, which includes beliefs about humans in general is thought to be distinct from how the field generally conceptualizes CTN, which is an individual belief that the self is integrated with nature [17,34,35,36]. Likewise, the EID includes a dimension that is not part of the general conceptualization of CTN, referred to as “Environmentalism”, which represents the degree to which one believes that environmentalism is important and moral. Interestingly, although the factor structures of both the NR and EID were once shown to be multidimensional, factor analyses applied to more recent revisions of those scales (aimed to improve clarity and conciseness) have shown them to be unidimensional (EID-revised [12]; NR-6 short form [16,37]).
Despite the NR-6 short form and EID-revised currently being used as unidimensional scales, there continues to be exploration into the multidimensionality of CTN. Of specific interest are two measures (the AIMES scale [29] and the CN-12 [28]) based on Ives and colleagues’ Human–Nature-Relations (HNR) framework [38] (The HNR framework identifies five ways in which humans can relate to nature, ranging from shallow to deep connections, with the deeper connections being proposed as the most likely to lead to both individual and systemic change in pro-environmental behavior. Three of these five are able to be directly mapped onto the three commonly accepted CTN dimensions: Cognitive (attitudes and values), Emotional (various emotions relating to nature), and Behavioral (engaging in activities within nature), as these capture beliefs about ones’ individual relationship with nature. Two other dimensions are more appropriately viewed as human–nature worldviews, as they capture beliefs about humans’ relationship with nature in general: Material (using nature to extract value for humans) and Philosophical (beliefs of what nature is in relation to humans).). Both the AIMES and the CN-12 were created and validated using survey items and response data from a 2019 large-scale survey on residents’ values of nature [39], which was inspired by the HNR framework. Despite using this same dataset, the AIMES and CN-12 scales have different factor structures, due to using different structural analytic approaches. The AIMES scale used a confirmatory factor analysis (CFA), wherein they assigned items to one of five dimensions based on Ives’ framework and confirmed a five-factor structure. These included the three commonly accepted aspects of CTN (Cognitive, Emotional, and Behavioral; see above) plus the two human–nature worldview dimensions of Ives (see footnote 1). By contrast, the CN-12 employed an exploratory factor analysis (EFA), which revealed a three-factor structure: two of the three commonly accepted aspects of CTN (Cognitive and Behavioral), plus a single human–nature worldview dimension. This difference in analytical approaches between the AIMES and CN-12 studies highlights the ongoing debate in psychometrics about the roles of EFA and CFA in scale development and validation (see [40] for discussion). While each method has its strengths, some researchers argue that a combination of both approaches (data-driven discovery and theoretical confirmation) may provide a more comprehensive understanding of scale structure [41]. As such, in the current study, we adopted this integrated approach to create a new multidimensional scale—the DEEP CTN scale—with the ultimate goal of asking the degree to which different dimensions of the scale can successfully predict PEB, which we turn to in the next section.
To date, several studies have shown a positive association between various scales of CTN and PEB, with several meta-analyses reporting moderate (r = 0.35 to 0.52) effect sizes [11,30,42,43]. Most of these studies measured PEB using self-reported participation in PEB and/or intentions to participate in PEB. When instead the outcome measure is observed behaviors (e.g., volunteering to participate in a river cleanup), smaller effect sizes are seen (r = 0.21 to 0.29 [30,42]). In addition, the majority of studies investigating the relationship between CTN and PEB have used a unidimensional CTN scale, leaving open the question of whether certain dimensions of CTN may be more or less associated with PEB. Determining the degree to which cognitive, emotional, and behavioral aspects of CTN (as described above) differentially impact PEB would allow the creation of interventions that target aspects of CTN most likely to increase PEB.
To our knowledge, only two studies have explored whether dimensions of CTN (from the EID and the CN-12, above) differentially predict self-reported participation in PEB. A multiple (stepwise) regression using the four-dimensional structure of the EID revealed that the Environmentalism dimension was the strongest predictor of PEB [33]. However, this is unsurprising given that their measure of PEB was self-reported behaviors (e.g., switching to green products and driving less frequently) and the items from the Environmentalism dimension asked if engaging in PEB was important and morally good. Unfortunately, this paper did not report the results of the other dimensions of CTN (i.e., Cognitive, Emotional, and Behavioral dimensions), leaving one to conclude that these more commonly accepted dimensions do not contribute to PEB. For the other scale, CN-12, the authors reported zero-order (i.e., pairwise) correlations between all their variables and showed that the Cognitive dimension of CTN was the strongest predictor of PEB [28]. However, because they did not conduct a multiple linear regression (where PEB is simultaneously regressed against all dimensions of CTN), we cannot know the unique contribution of each CTN dimension to PEB (see [44,45] for discussion).
The purpose of the current study was to develop and validate a multidimensional CTN scale that addresses the above-described limitations of the previous measures. Our approach focused on two key goals. First, we wanted to test if the three aspects of CTN referred to throughout the literature (Cognitive, Emotional, and Behavioral) exist as latent variables of CTN. To achieve this as thoroughly as possible, we collected items across a wide range of the currently available CTN scales, with a focus on scales that were theoretically grounded and addressed issues of self-report bias. We were careful to ensure sufficient items represented each of the three aspects of CTN, remove redundancy across items from various scales, and adapt items to be more generalizable across diverse populations. We then used both EFA and CFA to make sure that our scale was created using a data-driven approach, given the inconsistency of multidimensional models of CTN, while at the same time acknowledging Ives’ theoretically driven HNR framework [38].
Second, we wanted our new scale to be composed of items that captured humans as integrated with nature, specifically, being more of an embodied and/or spiritual lived experience. While this idea is fundamental to the concept of CTN, it is our opinion that this has gotten lost in the currently existing measures. To this end, we added several items (e.g., “I view nature as a mother who nurtures and cares for me”). In addition, while we included worldview items from previous scales, we were mainly interested in the items that align with philosophical/spiritual worldviews (e.g., “every part of nature is sacred”) rather than materialistic worldviews (e.g., “forests are valuable mostly because they produce wood products, jobs, and incomes for people”).
Over a series of four pilot studies, we developed the DEEP CTN Scale and explored its factor structure using both EFA and CFA. The pre-registered study presented in this paper confirms the factor structure identified in the pilot studies using an independent sample and further investigates the following additional forms of measurement validity for the DEEP CTN Scale: convergent validity (testing whether the new DEEP CTN scale is related to established measures of CTN), predictive validity (testing whether the new DEEP CTN scale is predictive of a dependent variable, like PEB, in an expected way), and incremental validity (testing whether the predictive value of the new DEEP CTN scale remains robust after accounting for covariates that are related to the dependent variable). For a point of comparison, all measurement validity analyses were also conducted with a different outcome measure, namely, a composite score of psychological well-being. This is of interest, as there is increasing literature showing that CTN has a small-to-moderate relationship with well-being [46,47,48].

2. Materials and Methods

2.1. Pilot—Developing the DEEP CTN Scale

The development of the DEEP CTN Scale was conducted in our lab over the past 2.5 years in multiple phases:

2.1.1. Phase 1: Item Creation

We initially considered conducting a large factor analysis using items from every CTN scale identified in an extensive search of the literature of all existing adult measures of CTN (similar to [26]). However, this approach would have been burdensome for participants, as this would include over 350 items, many of which were extremely similar in wording. We ultimately used the AIMES scale [29] as a starting point, as it appeared to tap into the commonly accepted aspects of CTN (Cognitive, Emotional, Behavioral; as discussed in the Section 1). We supplemented the AIMES scale with the Disposition to Connect with Nature Scale [49], as it included more Behavioral aspects of CTN and because this scale was created to be less susceptible to self-report bias. The items from these two scales total 56 (AIMES = 16 items; Dispositional CTN = 40 items). Several items from each scale were removed due to redundancy. We reworded several items for generalizability (e.g., “It makes me miserable to see a hedgehog that was hit by a car” was reworded to “It makes me upset to see an animal that was hit by a car”) and clarity (e.g., “If one of my plants dies, I reproach myself” was reworded to “If one of my plants died, I would blame myself”). Any direct references to “connection to nature” were removed to avoid concerns about participants not fully understanding this concept (see [50] for discussion on this). This resulted in 43 items retained from previous measures (AIMES = 13 items; Dispositional CTN = 30 items).
We created seven new items designed to capture behavioral, embodied, and experiential relationships with nature (in line with the Disposition CTN [49]). This resulted in items that asked about conscious attendance to nature. We created five new items tapping into an integrated spiritual relationship with nature, which could better reflect one’s individual lived experience instead of broader human–nature worldviews that describe beliefs about humans in general. We also adapted two items from the Ecospirituality Scale [51] that reflected this integrated spiritual relationship with nature. This resulted in a total of 58 items. See Supplementary Materials for details of item selection, adaptation, and creation.

2.1.2. Phase 2: Pilot Exploratory Factor Analysis

Exploratory Factor Analyses (EFAs) were conducted on three samples: two general population Prolific samples (N = 575, N = 577) and one student sample (N = 485) between November 2022 and April 2023. An EFA uses a data-driven approach to determine the multidimensional structure. Here, the number of factors is not fixed, no loadings are forced to be zero, and rotations are allowed to occur. This was conducted on the 58 items as detailed in Phase 1 above. As a first step in our EFA, we eliminated all items that failed to load greater than or equal to 0.40 onto any one factor and items that showed a cross-loading of greater than or equal to 0.20. This resulted in a total of 30 items to be included in the confirmatory factor analysis (CFA) (see Phase 3 below).
The results of the three EFAs are presented in Supplementary Materials. The results consistently revealed a four-factor structure as the best fitting model, which we named the following based on the representation of the items in each dimension and how they related to the commonly accepted aspects of CTN (see Section 1):
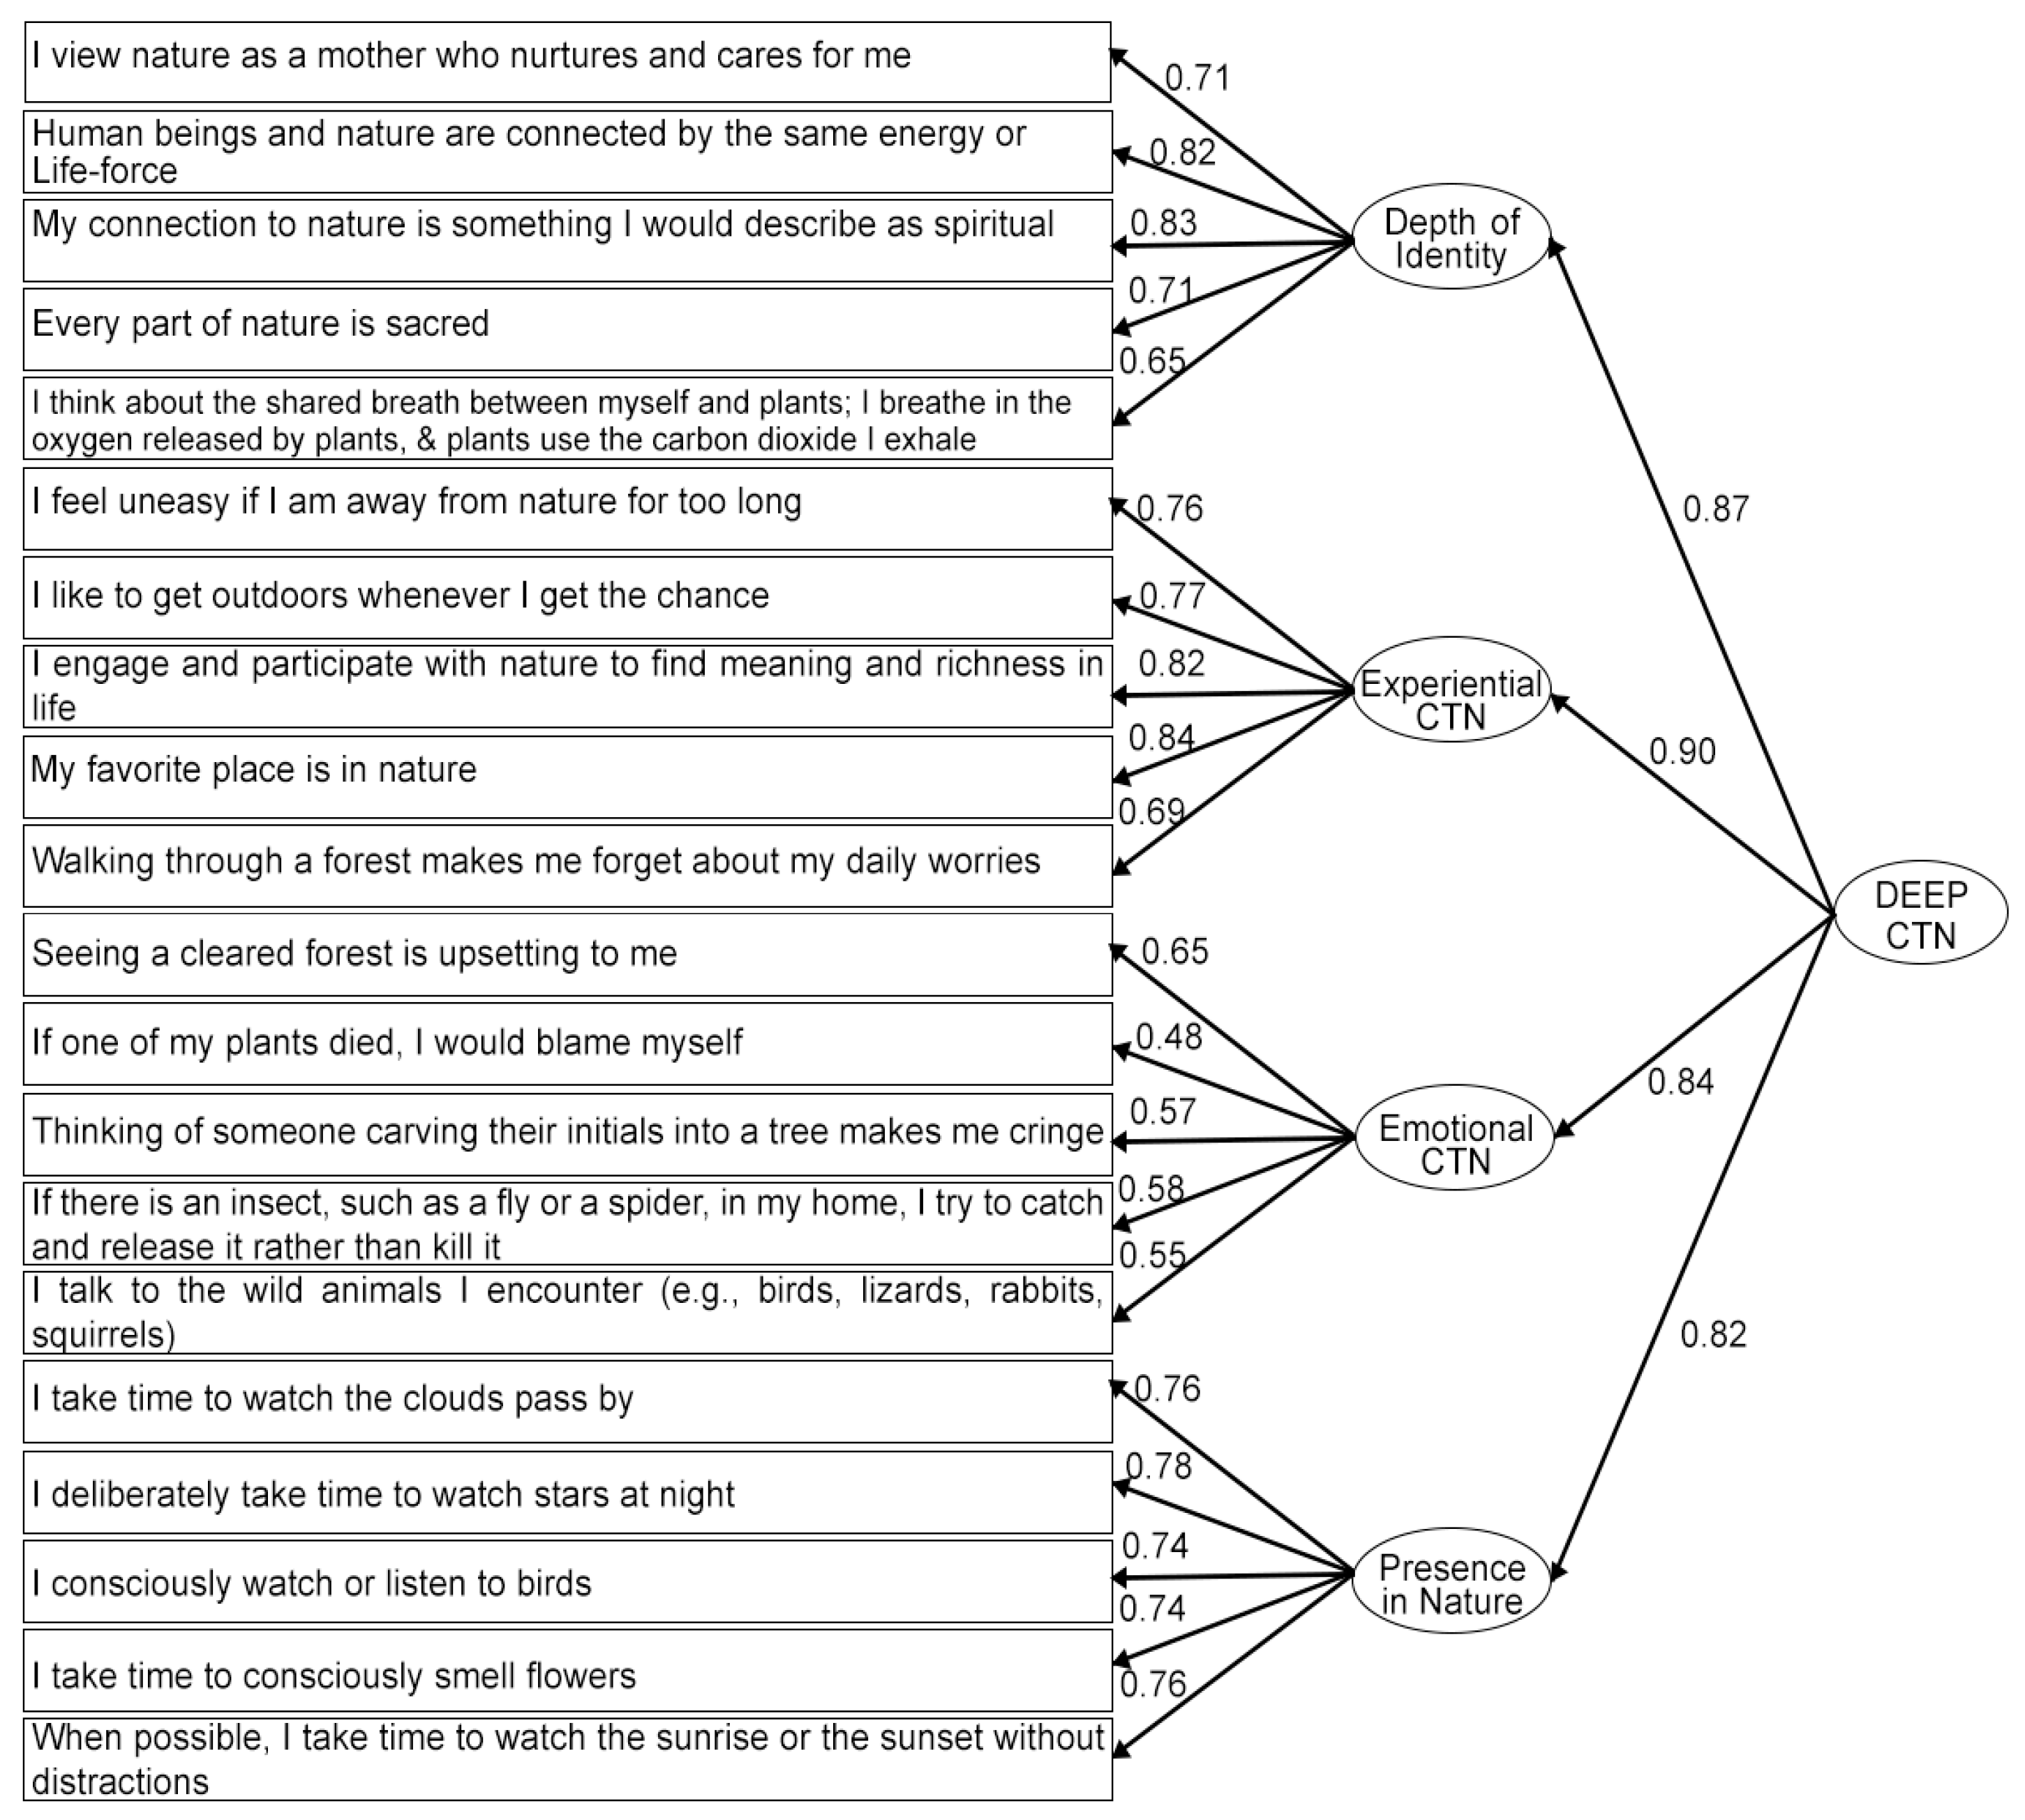
  • Depth of identity (deeply seeing the self as part of nature, which represents the Cognitive component of CTN);
  • Emotional connection (emotional desire to connect with and care for nature, which represents an Emotional component of CTN);
  • Experiential connection (spending and enjoying time in nature, which represents one aspect of the Behavioral component of CTN);
  • Presence within nature (engaging mindfully and consciously with nature, which represents a second aspect of the Behavioral component of CTN).

2.1.3. Phase 3: Pilot Confirmatory Factor Analysis

The 30 items that were retained from the EFA were then analyzed in a CFA, wherein the above four dimensions from phase 2 were fixed (see below for full explanation of this analysis, which we replicated in our pre-registered study). Using a student sample (N: 341), the analysis found that the proposed four-factor model was an adequate fit. It also showed that a hierarchical model had adequate fit. Further, both models fitted better than a unidimensional model with only one overall CTN dimension. These results were used to create the scale, which we pre-registered to conduct the CFA and validation analyses described in this paper. See Supplementary Materials for full methods and results of these pilot studies.

2.2. Pre-Registered CFA and Validation

The hypotheses, study design, exclusion criteria, and analysis plan for this study were pre-registered with the Open Science Foundation (https://osf.io/5xbvp/, registered on 22 January 2024).

2.2.1. Power Analysis

To ensure an adequate sample size for this analysis, we used a common rule of thumb of including 10–15 subjects per variable [52]. Because our analysis involves 30 items, we aimed to obtain usable data from 10 × 30 = 300 participants. We expected some attrition and removals during data cleaning (estimated to be about 5% based on pilot data); we therefore aimed to collect data from 315 participants. This number was very close to the sample size resulting from a separate analysis applied to the multiple linear regression analyses calculated for the predictive validity confirmatory analysis, with the following parameters: anticipated effect size f2 = 0.17 (based on pilot data and the previous literature, we anticipate a moderate effect size); statistical power = 0.8; up to seven predictor variables (plus 6 covariates) in the largest confirmatory model; and an alpha of 0.0125 (to account for a Bonferroni correction for conducting four models). This results in a sample size of 290 participants. We similarly estimated 5% attrition and removals during data cleaning, resulting in us aiming to collect data from 305 participants. As our CFA required a larger sample size than the validity analyses, the total sample size required is determined by this analysis. Thus, we planned for a sample size of 315 participants.

2.2.2. Participants

Using an online survey distribution platform to recruit participants (Prolific.com), 316 participants agreed to participate in a study on “attitudes and behaviors towards nature” in January 2023. One participant failed to pass sufficient attention checks (minimum required to pass was two out of three checks); as such, their data were not analyzed. The final analysis consisted of 315 participants with ages ranging from 18 to 83 (M = 43.76, SD = 14.53). The sample included 182 women, 120 men, 3 trans women, 1 trans man, 8 non-binary, and 1 unreported. The racial make-up of the sample was 197 White, 59 Black, 23 Asian, 16 Hispanic/Latinx, 12 mixed race, 2 Middle Eastern, 1 Indigenous, and 5 unreported. The study was approved by the IRB committee at UCSD (#806617). All participants gave their informed consent before participating and were compensated at USD 9/h (approximately USD 2.18 for completing a 14.5 min survey).

2.2.3. Materials and Procedure

The study was conducted entirely online and remotely (through the Prolific platform using Qualtrics surveys). Participants answered several questionnaires, which were used for validation of the scale (see below): (1) the newly developed 30-item DEEP CTN Scale, (2) the Connectedness to Nature Scale (CNS) [15], (3) the Environmental Identity Scale- Revised (EID-r) [12], (4) the Recurring Pro-Environmental Behavior Scale (RPEBs) [53], (5) the Primal Beliefs Inventory–Interconnected sub-scale [54], (6) the Ryff Well-being scale [55], (7) the PANAS positivity sub-scale [56], and (8) the Subjective Vitality Scale [57] (described in detail further below). Next, participants completed a demographics question block (e.g., political ideology, socioeconomic status, and age). Last, participants were instructed to rate their effort and attention levels on the questionnaires, which were used to clean the data (see Supplementary Materials for details of this question). Participants were also asked to submit an open-ended definition of nature, which was collected for a future exploratory qualitative study.
New 20-Item DEEP Connection to Nature Scale. The new DEEP Connection to Nature scale included 20 items developed from the EFA and pilot CFA studies (see above). Table 2 displays the full list of items with titles based on the factor loadings found in the pilot CFA. A long-form 30-item version of this scale was initially created. As all results were similar for both the 30-item long form scale and the 20-item DEEP CTN Scale, all results below are for the 20-item DEEP CTN Scale. All CFA results for the 30-item long-form scale are included in Supplementary Materials.
Connectedness to Nature Scale. The CNS [15] is a 14-item unidimensional scale designed to measure the cognitive beliefs about how interconnected one’s self is to nature. It is measured on a Likert scale ranging from 1 (strongly disagree) to 5 (strongly agree). Cronbach’s alpha was 0.82. This scale was used for predictive validity.
Environmental Identity Scale revised. The EID-r [12] is a 14-item unidimensional scale designed to measure how interconnected one’s self is to nature. It is measured on a Likert scale ranging from 1 (not at all true of me) to 7 (completely true of me). Cronbach’s alpha was 0.93. This scale was used for predictive validity.
Pro-Environmental Behavior. The Recurring Pro-Environmental Behavior scale (RPEBs) [53] asks people to report how often they engage in various pro-environmental behaviors. Modifications were made to clarify existing items (to view the scale used in this study, view Supplementary Materials). This scale includes 20 items measured on a Likert scale ranging from 1 (never) to 5 (always). Cronbach’s alpha was 0.79. This scale was used for predictive and incremental validity.
Well-being. A single measure of well-being was created by combining scores from three established measures: (1) the Ryff Well-being Scale [55]; (2) the 10-item positive affect sub-scale of the PANAS [56]; and (3) the Subjective Vitality Scale [57]. Cronbach’s alpha for this combined measure was 0.86. This scale was used to explore the relationship between the new DEEP CTN Scale dimensions and well-being.
Interconnected Beliefs. Beliefs that the world is interconnected were measured using the Interconnected sub-scale of the Primal Beliefs Inventory [54]. This was included as a covariate when measuring incremental validity, as pilot data showed that this measure is correlated to both the DEEP CTN Scale and PEB (see Supplementary Materials for a full analysis of the pilot data). The Interconnected sub-scale consists of four items asking how connected or atomistic one believes the world to be (e.g., most things are basically unconnected and independent from each other [reversed]). All items are measured on a Likert scale ranging from 1 (strongly disagree) to 6 (strongly agree). Cronbach’s alpha was 0.30 (While the Cronbach’s alpha within this sample was low, the alpha in the original paper was 0.87 [53], and 0.73 in our pilot study, which suggests adequate internal consistency. However, we note that the Primal Beliefs Inventory is a relatively new scale and may show variability in internal consistency across samples as more data are collected.).
Other Demographics. Previous reviews on individual difference predictors of PEB have found mixed evidence for age, gender, political ideology, and socioeconomic status (SES) on PEB [30,43,58]. As such, these items were included in the study to account for possible covariation in PEB. The Subjective Socioeconomic Ladder [59] was used to measure SES. Participants mark where they believe they are on the ladder, with 10 representing people who are the best off and 1 representing people who are the worst off. Political ideology was measured using the average of three items asking about overall political ideology, economic political ideology, and social political ideology measured on a Likert scale ranging from 1 (extremely liberal) to 4 (middle of the road) to 7 (extremely conservative) (the mean political ideology was 3.11 (1.7), and there was a skew towards more liberal ideologies). Cronbach’s alpha was 0.94. These items were used for incremental validity.

2.2.4. Data Analysis

Basic descriptive analyses reported on means, standard deviations, and frequencies of relevant variables. Normality, as assessed with visual inspection of histograms and tests of kurtosis and skewness, was verified and met for all variables of interest. The assumptions of all statistical tests were checked and met. The level of significance was set to 2.5% (p < 0.025) for all tests; however, we emphasized effect sizes rather than statistical significance since the latter is often misleading. Effect sizes were reported as the following: Pearson r values for bivariate correlations, with the rule of thumb that absolute values of 0.10–0.30 are weak effects, 0.30–0.50 are medium effects, and 0.50 and over are large effects; Standardized Beta for linear regressions, with the rule of thumb that values of 0.10–0.29 are weak effects, 0.30–0.49 are medium effects, and 0.50 and over are large effects. All regression models in this study use Type II sum of squares, which examines individual effects in light of all other model effects, regardless of order. All data were analyzed using R (version 4.3.2).
CFA Analysis. The main goal of the CFA was to confirm the accuracy of the four-factor structure of the DEEP CTN Scale that emerged during pilot studies through EFA. Prior to conducting the CFA, we first calculated bivariate correlations among the DEEP CTN Scale dimensions. Based on the results of pilot studies and the expectation that the dimensions would be different enough to be separable dimensions (as would be revealed in the four-factor CFA models), yet similar enough to be associated via one superordinate CTN construct (as would be supported by a hierarchical CFA structure), weak-to-moderate positive correlations between all dimensions were predicted. We also assessed the internal consistency of the DEEP CTN Scale with Cronbach’s alpha statistics for each dimension. To verify the suitability of the data for CFA, the DEEP CTN Scale items were checked for univariate normality via extreme values for skewness (>|1.0|) and excess kurtosis (>|3.0|) and visual inspection of histograms [60]. The items were also checked for multivariate normality with Mardia’s multivariate skew and kurtosis tests [61]. Using the R-package lavaan [62], we conducted a CFA on these items to test a four-factor solution. The number of factors was set to four, and covariances were allowed between the factors.
We hypothesized that (1) the results of the CFA would confirm a multidimensional structure with four distinct dimensions (i.e., a four-factor solution without a superordinate CTN factor, which we refer to as the four-factor nonhierarchical model), and (2) in a four-factor hierarchical CFA, the factors would strongly load onto a superordinate CTN factor (i.e., a four-factor solution with a superordinate CTN factor, which we refer to as a hierarchical model). The finding of a hierarchical structure would suggest that the four dimensions are sufficiently interrelated to be considered part of one overarching CTN construct. The following indices, with suggested benchmarks [63,64], were evaluated collectively to provide an evaluation of how well each model fit the data: chi-square statistic (χ2; p > 0.05), root mean square error of approximation (RMSEA < 0.06) with its 90% confidence interval (0.00–0.08), Tucker–Lewis fit index (TLI > 0.90), and comparative fit index (CFI > 0.95).
In addition to our two main models described above, we also tested a one-factor model containing only a total CTN score (which assumes that the DEEP CTN Scale has a unidimensional structure). We hypothesized that the one-factor model would provide the worst fit but had no a priori hypothesis about which of the two other models (i.e., the four-factor nonhierarchical or hierarchical) would provide the best fit given the range of dimensional structures found for CTN, as described in the introduction. Note that determining the best-fitting factor structure of the DEEP CTN Scale affects the scoring guidelines of the measure. Specifically, a four-factor hierarchical model would support the use of both dimensional scores and a total score. By contrast, a four-factor nonhierarchical model would support the use of individual dimensions but not a total score, and a one-factor model would support only the use of a total score. Model comparisons were conducted using an ANOVA comparison of model fit, although we also reported the Akaike information criterion (AIC), where scores closer to 0 indicate a more parsimonious and better-fitting model.
Convergent Validity. We assessed convergent validity via bivariate correlations between the DEEP CTN Scale (including its dimensions) and two existing measures of CTN: the CNS [15] and the EID-r [12]. We expected that the total DEEP CTN Scale score would correlate moderately with both preexisting measures. Further, we expected variability across the correlations between the DEEP CTN Scale dimensions and these preexisting measures. Specifically, we predicted that the Depth of identity dimension will strongly correlate with the CNS, while the other three dimensions will only weakly–moderately correlate. This is based on past research identifying the CNS as a unidimensional measure of nature connectedness that focuses on the Cognitive aspect of connection to nature [15]. Additionally, we expected that the Experiential connection and Emotional connection dimensions of the DEEP CTN Scale will strongly correlate with the EID-r, while the other two dimensions will weakly (or not at all) correlate. This is based on previous research that identified multiple dimensions measuring Behavioral and Emotional aspects of CTN [33].
Predictive Validity. Here, we tested whether any (or all) of the dimensions of the DEEP CTN Scale predict PEB (in the form of the RPEBs). Bivariate correlations were used to assess the relationship between PEB and the dimensions of the DEEP CTN Scale. We expected there would be variability among the DEEP CTN Scale dimensions regarding the strength of their correlation to PEB. Additionally, (though not pre-registered) we conducted two multiple linear regressions, using PEB and well-being as dependent variables, and the DEEP CTN Scale dimensions were entered simultaneously as predictor variables. This allowed us to test the unique predictability of each dimension, allowing us to identify which DEEP CTN Scale dimension best predicts PEB, which we address by comparing the change in R2 across models. By including existing measures of CTN, we can assess if the DEEP CTN Scale is adding predictive ability above and beyond these measures.
Incremental Validity. If predictive validity was supported, the next step was to test whether the strength of the relationship between the DEEP CTN Scale dimensions and PEB remained robust after accounting for covariates that are related to the measure and/or outcome variable (interconnected primal worldviews, political ideology, and age). Interconnected primal worldviews were included based on findings in pilot studies that suggested it shared variance with both PEB and one or more DEEP CTN Scale dimensions. Political ideology and age were included as covariates based on previous research suggesting they are moderate predictors of PEB [30,43,58]. There are two reasons to include covariates in a model. First, if a covariate is strongly correlated with PEB and weakly (or not) correlated with the DEEP CTN Scale dimensions, its inclusion in the model can reduce variance in PEB that would otherwise be unaccounted for, thereby enhancing the significant effects of the DEEP CTN Scale. Second, if a covariate is strongly correlated with both PEB as well as the DEEP CTN Scale dimensions, its inclusion in the model can potentially account for the relationship between DEEP CTN Scale dimensions and PEB. In this case, we would want to ensure that the relationship observed between the DEEP CTN Scale dimensions and PEB (in the original predictive validity analysis, above) was not entirely accounted for by this covariate. We confirmed whether each covariate had the potential to behave in either the first or second way by looking at bivariate relationships between the DEEP CTN Scale dimension scores and the three covariates and between the three covariates and PEB (separately).
Exploratory Analyses. We additionally ran the same analyses as above in predictive and incremental validity with well-being as the outcome variable. These results are exploratory, as they were not pre-registered. Results for these exploratory findings are included below under both predictive and incremental sections for conciseness and ease of reading.

3. Results

3.1. CFA Analysis

Descriptive statistics and bivariate correlations for the DEEP CTN Scale dimensions are presented in Table 3. The means of all dimensions scores were approximately at the midpoint (4.00) of the scale (range M = 4.56 to 4.88). We found moderate to strong correlations (r’s(315) = 0.54 to 0.85, p’s < 0.001) between all dimensions. This suggests that the dimensions represent related but distinct constructs and supports the possibility of a hierarchical CFA solution. Internal consistency reliability scores indicated that all dimensions and the total of the DEEP CTN Scale demonstrated good internal consistency (Cronbach’s alphas ranging from 0.70 to 0.88).
Preliminary analyses showed that all 20 items of the DEEP CTN Scale were approximately normally distributed, as assessed by levels of skewness (range −0.10 to −1.00) and excess kurtosis (range 1.56 to 3.03), and visual inspection of histograms. A violation of multivariate normality was indicated by Mardia’s skewness and kurtosis tests, both being significant at p < 0.001. Since this multivariate normality assumption was not met in our sample, rather than conducting CFAs using the default maximum likelihood estimation, we instead used a maximum likelihood estimation with robust standard errors and a Satorra–Bentler scaled test statistic, which is less dependent on the assumption of normality [65].
The new DEEP CTN Scale showed adequate fit indices for the four-factor nonhierarchical and hierarchical models (RMSEA < 0.08; CFI/TLI > 0.90. The one-factor model failed to approach any acceptable model fit indices, suggesting that this model was a poor representation of the data. In terms of model comparisons, the following was found: (1) the multidimensional models had a significantly improved fit compared to the unidimensional model (χ2 = 839.377(170), p = < 0.001); and (2) the four-factor model was a slightly better fit than the four-factor hierarchical model (χ2 = 450.122(166), p = 0.015), though not significantly different. These findings suggest the new DEEP CTN Scale is best described as a multidimensional construct and has improved fit over a single unidimensional model. See Table 4 for all model fit statistics and model comparisons.
The results of this CFA revealed that all items significantly loaded onto their a priori factors (p < 0.001) identified during pilot analysis (see above). Figure 1 shows the standardized estimates for each item regressed onto the four factors and a second-order CTN factor. Our results suggest that CTN, when measured with the DEEP CTN Scale, is best described as a multidimensional construct with four dimensions: Depth of identity (Cognitive), Emotional connection (Emotional), Experiential connection (Behavioral), and Presence within nature (Behavioral). The items in the Presence within nature domain were originally created as ways to tap a deeper behavioral relationship with nature. That they separate into two distinct dimensions suggests that there is something fundamentally different about these two ways of interacting with nature behaviorally and serves to point out the importance of not flattening behavioral experiences into a single dimension.

3.2. Further Validation Analyses

3.2.1. Convergent Validity

Convergent validity was tested by investigating whether the DEEP CTN Scale is related to two established measures of connection to nature: the CNS and the EID-r. Table 5 shows the zero-order Spearman correlations between the total score of the DEEP CTN Scale, each of the four DEEP CTN Scale dimensions, the CNS, and the EID-r. As predicted, there was a strong correlation between our new DEEP CTN Scale (total score) and existing measures (r = 0.72 and 0.78 for CNS and EID-r, respectively), providing good support for convergent validity. When looking at the individual dimensions of the DEEP CTN Scale, we found that the Depth of identity dimension was most strongly related to CNS, whereas the Experiential connection dimension was most strongly related to the EID-r.

3.2.2. Predictive Validity

As a first step, we asked whether any of the dimensions of the DEEP CTN Scale showed strong associations with PEB. Table 6 shows the zero-order Spearman correlations between the total score of the DEEP CTN Scale, each of the four DEEP CTN Scale dimensions, and PEB. We found moderate correlations between DEEP CTN Scale dimensions and PEB (r’s = 0.44 to 0.46, p’s < 0.001), providing good support for predictive validity. To investigate the unique contribution of each, all dimensions were included in the same model as part of our predictive validity analysis. As shown in Table 7 (left panel), the Emotional connection and Presence within nature dimensions were significant predictors with small effect sizes (p’s < 0.01, std Beta’s = 0.17 to 0.21) explaining 8% of the variance in PEB each, while the Depth of identity and Experiential connection dimensions did not predict PEB. Based on the model R2, these models show that, overall, the DEEP CTN Scale accounts for 30% of the variance in PEB. For comparison, we explored the predictive validity of two previous measures of connection to nature: CNS and EID-r. These measures accounted for 22% (CNS) and 19% (EID-r) of the variance in PEB, revealing that the DEEP CTN Scale can explain more variance in PEB.
Although not intended for testing predictive validity, the same analyses were run with well-being as the outcome variable. Table 6 shows the zero-order Spearman correlations between the total score of the DEEP CTN Scale, each of the four DEEP CTN Scale dimensions, and well-being. We found small-to-moderate correlations between DEEP CTN Scale dimensions and well-being (r’s = 0.17 to 0.42, p’s < 0.001). As shown in Table 8 (left panel), all but one dimension (Experiential connection) were significant unique predictors of well-being with small effect sizes (p’s < 0.01, std Beta’s = −0.15 to 0.23). Interestingly, when looking at the variance explained, the Emotional connection dimension arose as a negative predictor of well-being. The R2 shows that DEEP CTN Scale accounts for 24% of the variance in well-being. By comparison, CNS and EID-r accounted for 24% and 12% of the variance, respectively, noting that whereas the CNS showed similar predictive ability for well-being as the new DEEP CTN Scale, the EID-r underperformed.

3.2.3. Incremental Validity

Here, we asked whether the predictive validity of the dimensions seen in the above analysis remained robust when three covariates (i.e., interconnected primal worldviews, political ideology, and age) were added to the model predicting PEB. These variables were found to be suitable as covariates, as they correlated with both the main predictor variables (i.e., the DEEP CTN Scale dimensions) and the outcome variables (i.e., PEB and well-being). Specifically, primal worldviews positively correlated with all DEEP CTN Scale dimensions scores (r’s(315) = 0.30 to 0.53, p’s < 0.001), as well as positively correlated with both PEB and well-being (r’s(315) = 0.36 to 0.37, p’s < 0.001). Age positively correlated with three of the DEEP CTN Scale dimensions (Depth of identity, Experiential connection, and Presence within nature) (r’s(315) = 0.13 to 0.27, p’s < 0.05), as well as positively correlated with both PEB and well-being (r’s(315) = 0.14 to 0.21, p’s < 0.05). Political ideology was included in analyses for well-being, as it negatively correlated with the Emotional connection dimension of the DEEP CTN Scale (r(315) = −0.14, p < 0.05) and positively correlated with well-being (r(315) = 0.21, p < 0.001) (see Supplementary Materials for a table of these correlations).
To investigate the incremental validity, the relevant covariates were added into the model predicting PEB. As shown in Table 7 (right panel), the two dimensions (Emotional connection and Presence within nature) of the DEEP CTN Scale that were predictive of PEB (left panel) remained robust when primal worldviews and age were included in the model. Note that primal worldviews, but not age, continued to account for a significant amount of unique variance in PEB when included in the multiple regression model.
Although not intended for testing incremental validity, the same analyses were run with well-being as the outcome variable. As shown in Table 8 (right panel), two of the three DEEP CTN Scale dimensions that were predictive of well-being (Depth of identity and Presence within nature) remained robust when including primal worldviews, political ideology, and age. All covariates also remained significant predictors of well-being in this larger model (although the effect of age became quite small).

4. Discussion

This paper introduces and validates the multidimensional 20-item DEEP CTN Scale, which addresses several limitations of previous scales. Specifically, the DEEP CTN Scale emphasizes the individual as integrated with nature, thus overcoming the human–nature binary, where nature is often viewed as separate from humanity. This was an important step, as our review of extant measures reveals that while integration with nature was a predominant conceptual definition of CTN, it appears to be incompletely represented in existing measures. The DEEP CTN Scale confirms the existence of the three commonly accepted aspects of CTN. Specifically, we observe a (1) Cognitive component, which we name Depth of identity because it represents a deeply held self-construct that includes nature and views the self as “one with nature”, and a (2) Emotional component, which we name Emotional connection because it includes deep empathy towards nature that manifests in a need to care for nature. However, for the commonly accepted Behavioral aspect of CTN, we observe two distinct dimensions: (3) Experiential connection, which represents the time an individual spends in, and in enjoyment of, nature; and (4) Presence within nature, which reflects habitual mindful and conscious engagement with nature.
The new DEEP CTN scale shows good convergent validity with two widely used existing CTN measures (the Connectedness to Nature scale and the Environmental Identity scale revised version). It also shows good predictive validity for self-reported pro-environmental behaviors (PEBs), improving upon these two existing measures, while also remaining robust when included in a model with known covariates. Of note, a recent review raised concerns regarding the validation of CTN measures, including a lack of clarity regarding the construct definition of CTN and poor validation methods [22]. We believe this paper addresses many of these concerns, as well as being among the first CTN measures to pre-register a thorough statistical plan for validation. In sum, our hypotheses were supported, providing psychometric validity for the new four-factor DEEP CTN Scale. For the remainder of the discussion, we address three important findings: (1) the Behavioral aspect of CTN splitting into two distinct dimensions, and the differential predictability of the DEEP CTN Scale dimensions on (2) PEB and (3) well-being. We then end with a discussion of the limitations and strengths of the current research and make suggestions for future directions.

4.1. Dimensionality

One of the surprising findings of our EFA (replicated across three independent samples) and later confirmed through our CFA (replicated across two independent samples) was the emergence of two distinct Behavior dimensions, which we name Experiential connection and Presence within nature, something previous scales have not observed. We note that all of the items in the Presence within nature dimension originated from the Dispositional Connect to Nature scale, whereas the items that constitute the Experiential connection dimension came from diverse scales (two items from the Dispositional Connection to Nature scale, two items from the AIMES scale, and one item from the Ecospirituality scale). Whereas the Experiential connection dimension is about a preference for spending time in nature, the Presence within nature dimension is about being deliberate, habitual, and mindful about one’s engagement with nature. Interestingly, the results of our predictive validity models show that only Presence within nature, and not Experiential connection, dimensions of DEEP CTN uniquely predicted PEB and well-being, suggesting that encouraging people to be mindfully present with nature, and not simply enjoy/spend time in nature, should be woven into interventions that attempt to increase PEB and/or well-being.

4.2. Predicting Pro-Environmental Behavior (PEB)

As noted above, the new DEEP CTN scale met the criteria of predictive validity, i.e., significantly predicting PEB. Moreover, the new scale was found to predict more variance (30%) in PEB than two existing CTN measures (22% and 19% for the CNS and EID-revised, respectively). In addition, the current study’s predictive validity analysis is the first, to our knowledge, to investigate the unique contribution of different factor analysis-qualified dimensions to PEB. Here, we found that the Presence within nature (mentioned above) and the Emotional connection dimensions of the DEEP CTN Scale were the strongest predictors of PEB (with the Experiential connection and Depth of identity dimensions not reaching significance). As noted in the above section for the Presence within nature dimension, the additional finding of a relationship between the Emotional connection dimension and PEB suggests that encouraging people to be mindfully present with nature and promoting an emotional connection with nature should be considered when creating into interventions to increase PEB.
In general, our predictive validity findings suggest that interventions aiming to increase PEB through CTN should focus on fostering deeper, more engaged aspects of the human–nature relationship. It is not enough to simply be exposed to nature; there appears to be something critical about emotionally connecting with nature and being mindfully present in natural environments that more strongly predicts PEB. While previous work has suggested a pathway in which nature exposure increases CTN, and that this then increases PEB (see [11] for a meta-analysis; see [66] for a specific example), these studies are unable to untangle the ways people are interacting with nature during these visits. In future intervention work that exposes people to nature, researchers might consider examining whether PEB is higher for people who report experiencing more emotional and mindful connection to nature during the intervention. In addition, those same interventions can examine whether different instructions provided to participants during the intervention—relating to nature mindfully, relating to nature emotionally, or simply increasing the amount of time in nature—differ in their impact on self-reported PEB.

4.3. Predicting Well-Being

While not the main focus of this paper, we explored the relationship between the DEEP CTN Scale and psychological well-being. Similar to results for PEB (above), dimensions of DEEP CTN varied in how they predicted well-being. Notably, we found that the Presence within nature and Emotional connection dimensions of the DEEP CTN Scale were significant predictors of well-being, albeit in different directions. The Presence within nature dimension showed a positive relationship with well-being (which remained robust after controlling for interconnected worldviews, political ideology, and age), meaning that people who more mindfully relate to nature report higher well-being. However, the Emotional connection dimension (which had no effect on PEB; see above) showed a negative relationship with well-being (before controlling for covariates), meaning that people who are more emotionally connected to nature report having lower well-being.
Past reviews have concluded that there is an overall positive relationship between CTN and well-being, which varies in effect size depending on the CTN measure used [46,47,48]. Although these reviews do not disentangle how latent dimensions of CTN may impact well-being differentially, there does exist some evidence from intervention studies that is consistent with our finding of a positive relationship between the Presence within nature dimension of DEEP CTN and well-being. Specifically, studies have shown that instructing people to mindfully engage with nature can enhance psychological health [67,68,69]. In a similar vein, our findings of a negative relationship between the Emotional connection dimension of DEEP CTN and well-being can also be seen as consistent with emerging theories around climate anxiety. Specifically, it has been conjectured that connecting to nature can lead to heightened awareness of the current ecological crises, which, in turn, heightens climate anxiety [70,71]. That is, individuals with a high emotional connection to nature may experience distress related to environmental degradation or feel a heightened sense of eco-anxiety, which could negatively impact their overall well-being [72,73]. In fact, the more one incorporates the self as part of nature, the more the harms being done to nature may feel like harm to the self.
On a final note, it is interesting to point out that when controlling for interrelated covariates (i.e., worldviews and political orientations), the relationship between the Emotional connection dimension and well-being no longer reached significance. This suggests that the negative association we initially observed may be explained by broader belief systems and ideological factors. It highlights the complex interplay between environmental attitudes, political beliefs, and well-being, underscoring the need for nuanced approaches in this area of research. Overall, our findings call for more in-depth investigation into the mechanisms by which different aspects of CTN influence well-being, particularly exploring potential mediators and moderators of these relationships.

4.4. Limitations and Future Directions

We acknowledge some limitations in the development of the DEEP CTN scale and suggest ways to improve it in the future. First, creating any measurement scale involves subjective decisions that may introduce bias. To mitigate this, we conducted an exploratory factor analysis rather than starting with a confirmatory approach. We also carefully collected items from a wide range of existing theoretically grounded CTN scales, ensured representation of previously identified CTN aspects, removed redundancy, and adapted items for broader applicability. These types of rigor should be incorporated into future studies attempting to modify the scale.
Second, our DEEP CTN scale contains no reversed scored items. Initially, we included reversed items in our scale to mitigate potential response biases. However, these items consistently failed to load on any dimension across all three EFA pilot studies, leading to their exclusion. While this decision improved the psychometric properties of our scale, we acknowledge that the lack of reversed items could potentially introduce acquiescence bias. Future research could explore alternative methods to incorporate reversed items or investigate why they failed to load in our studies. Ultimately, we prioritized psychometric strength when selecting the final items, but we encourage researchers to explore alternative approaches.
Third, our samples were predominantly from WEIRD (Western, educated, industrialized, rich, democratic) populations. This limits cross-cultural validity and may fail to capture experiences driven by cultural differences. Validating the DEEP CTN Scale with more diverse populations globally is an important next step, as, while we attempted to make the language in the items inclusive to many nature-based experiences, it is unclear that we have succeeded in this aspect. Additionally, we focused on adult populations, as solidifying the CTN construct in adults was our priority before adapting for different age groups. We encourage future studies to explore our new DEEP CTN scale across different cultures and age groups, as it has been shown that CTN appears to shift across the lifespan [74,75].
Fourth, the DEEP CTN Scale was designed as a trait measure, capturing relatively stable individual differences in connectedness to nature. We have not tested its sensitivity to short-term fluctuations or its utility as a state measure. Future research could explore whether the dimensions we have identified are applicable to state-level assessments of CTN, potentially leading to the development of complementary state and trait measures.
Fifth, Future research should also consider alternative conceptualizations of CTN beyond the three-dimensional framework we utilized (i.e., Cognitive, Emotional, and Behavioral). Several measures have found support for multidimensional structures of varying complexity and conceptualizations [14,25,51,76,77]. These measures have approached CTN from an emotional perspective [25,76] or through sensory and cognitive experiences [77]. Some have also attempted to deconstruct the Western-centric view of the human–nature binary and take instruction from other ways of knowing (e.g., Indigenous practices and Buddhism) [14,51]. These alternative frameworks may provide opportunities to decompose existing dimensions into more nuanced categories or introduce non-Western perspectives that could enhance future iterations of CTN measurement.
Additionally, this paper seeks to address the definitional complexity around CTN within the literature, but it is also important to consider the way “nature” is defined as a lay term, as this directly influences how people interpret any measure of CTN [78]. Qualitative research, such as structured interviews, could be helpful for understanding the various ways nature is conceptualized among the general public and how this interacts with the different dimensions of CTN identified in this paper.
While we believe the DEEP CTN Scale represents a significant advancement in the measurement of connectedness to nature, we view it as an important next step in the CTN measure literature upon which to build further rather than a final, definitive measure. We encourage researchers to adapt and refine this scale as our collective understanding of CTN evolves. The multidimensional structure we have identified provides a robust framework for future investigations, but we anticipate that ongoing research will continue to uncover nuances and potentially new aspects of CTN. In conclusion, the DEEP CTN Scale offers a psychometrically sound, theoretically grounded measure of connectedness to nature that addresses many limitations of previous scales. By providing a clear conceptual definition and a multidimensional assessment tool, we hope to facilitate more precise and comprehensive research on CTN and its relationships with pro-environmental behaviors and well-being.

Supplementary Materials

The following supporting information can be downloaded at: https://www.mdpi.com/article/10.3390/su17135680/s1, details of item selection, adaptation and creation; methods and results from pilot studies, confirmatory factor analysis of 30-item long form DEEP CTN scale; adaptations of the RPEBs; instructions for the DEEP CTN Scale; covariate correlation tables [12,13,14,15,16,17,24,25,26,27,28,29,31,32,33,49,51,60,75,76,79,80,81,82,83,84,85,86,87,88,89,90,91,92,93].

Author Contributions

Conceptualization, D.L.; methodology, D.L. and K.D.; validation, D.L. and K.D.; formal analysis, D.L.; investigation, D.L.; writing—original draft preparation, D.L.; writing—review and editing, D.L. and K.D.; visualization, D.L.; supervision, K.D.; project administration, D.L. and K.D. All authors have read and agreed to the published version of the manuscript.

Funding

This research received no external funding.

Institutional Review Board Statement

The study was conducted in accordance with the Declaration of Helsinki and approved by the Institutional Review Board of the University of California, San Diego (protocol code 806617, approved 4 July 2023).

Informed Consent Statement

Informed consent was obtained from all subjects involved in the study.

Data Availability Statement

The raw data supporting the conclusions of this article will be made available by the authors upon request.

Conflicts of Interest

The authors declare no conflicts of interest.

Abbreviations

The following abbreviations are used in this manuscript:
CTNConnection to nature
PEBPro-environmental Behavior
HNRHuman–nature relations
WBWell-being
DEEPDepth of identity, emotional connection, experiential connection, presence in nature CTN scale
NRNature relatedness scale [31]
EIDEnvironmental identity scale [32]
CNSConnectedness with nature scale [15]
AIMESAttachment, identity, materialism, experiential, spiritual CTN scale [29]
CN-12Connection with Nature 12-item scale [28]
RPEBsRecurring pro-environmental behavior scale [53]
EFAExploratory factor analysis
CFAConfirmatory factor analysis
RMSEARoot mean square error
RMSRStandardized root mean square residual
CFIComparative fit index
TLITucker–Lewis index
AICAkaike information criterion

References

  1. IPCC. Summary for Policymakers. In Climate Change 2022: Mitigation of Climate Change. Contribution of Working Group III to the Sixth Assessment Report of the Intergovernmental Panel on Climate Change; Shukla, P.R., Skea, J., Reisinger, A., Slade, R., Fradera, R., Pathak, M., Al Khourdajie, A., Belkacemi, M., van Diemen, R., Hasija, A., et al., Eds.; Cambridge University Press: Cambridge, UK; New York, NY, USA, 2022. [Google Scholar]
  2. Ceballos, G.; Ehrlich, P.R.; Raven, P.H. Vertebrates on the Brink as Indicators of Biological Annihilation and the Sixth Mass Extinction. Proc. Natl. Acad. Sci. USA 2020, 117, 13596–13602. [Google Scholar] [CrossRef]
  3. Zylstra, M.J.; Knight, A.T.; Esler, K.J.; Le Grange, L.L.L. Connectedness as a Core Conservation Concern: An Interdisciplinary Review of Theory and a Call for Practice. Sci. Rev. 2014, 2, 119–143. [Google Scholar] [CrossRef]
  4. Virgen-Urcelay, A.; Donner, S.D. Increase in the Extent of Mass Coral Bleaching over the Past Half-Century, Based on an Updated Global Database. PLoS ONE 2023, 18, e0281719. [Google Scholar] [CrossRef]
  5. Leiserowitz, A.; Roser-Renouf, C.; Marlon, J.; Maibach, E. Global Warming’s Six Americas: A Review and Recommendations for Climate Change Communication. Curr. Opin. Behav. Sci. 2021, 42, 97–103. [Google Scholar] [CrossRef]
  6. Louv, R. Last Child in the Woods: Saving Our Children from Nature-Deficit Disorder; Algonquin Books: Chapel Hill, NC, USA, 2005. [Google Scholar]
  7. Soga, M.; Gaston, K.; Yamaura, Y.; Kurisu, K.; Hanaki, K. Both Direct and Vicarious Experiences of Nature Affect Children’s Willingness to Conserve Biodiversity. Int. J. Environ. Res. Public Health 2016, 13, 529. [Google Scholar] [CrossRef]
  8. Kesebir, S.; Kesebir, P. A Growing Disconnection from Nature Is Evident in Cultural Products. Perspect. Psychol. Sci. 2017, 12, 258–269. [Google Scholar] [CrossRef]
  9. Soga, M.; Gaston, K.J. Do People Who Experience More Nature Act More to Protect It? A Meta-Analysis. Biol. Conserv. 2024, 289, 110417. [Google Scholar] [CrossRef]
  10. Mayer, F.S.; Frantz, C.M.; Bruehlman-Senecal, E.; Dolliver, K. Why Is Nature Beneficial? The Role of Connectedness to Nature. Environ. Behav. 2009, 41, 607–643. [Google Scholar] [CrossRef]
  11. Barragan-Jason, G.; de Mazancourt, C.; Parmesan, C.; Singer, M.C.; Loreau, M. Human–Nature Connectedness as a Pathway to Sustainability: A Global Meta-analysis. Conserv. Lett. 2021, 15, e12852. [Google Scholar] [CrossRef]
  12. Clayton, S.; Czellar, S.; Nartova-Bochaver, S.; Skibins, J.C.; Salazar, G.; Tseng, Y.-C.; Irkhin, B.; Monge-Rodriguez, F.S. Cross-Cultural Validation of A Revised Environmental Identity Scale. Sustainability 2021, 13, 2387. [Google Scholar] [CrossRef]
  13. Dutcher, D.D.; Finley, J.C.; Luloff, A.E.; Johnson, J.B. Connectivity with Nature as a Measure of Environmental Values. Environ. Behav. 2007, 39, 474–493. [Google Scholar] [CrossRef]
  14. Kurth, A.M.; Narvaez, D.; Kohn, R.; Bae, A. Indigenous Nature Connection: A 3-Week Intervention Increased Ecological Attachment. Ecopsychology 2020, 12, 101–117. [Google Scholar] [CrossRef]
  15. Mayer, F.S.; Frantz, C.M. The Connectedness to Nature Scale: A Measure of Individuals’ Feeling in Community with Nature. J. Environ. Psychol. 2004, 24, 503–515. [Google Scholar] [CrossRef]
  16. Nisbet, E.K.; Zelenski, J.M. The NR-6: A New Brief Measure of Nature Relatedness. Front. Psychol. 2013, 4, 813. [Google Scholar] [CrossRef]
  17. Schultz, W.P. The Structure of Environmental Concern: Concern for Self, Other People, and the Biosphere. J. Environ. Psychol. 2001, 21, 327–339. [Google Scholar] [CrossRef]
  18. Leopold, A. The Land Ethic. In A Sand County Almanac; Oxford University Press: New York, NY, USA, 1949; pp. 201–226. [Google Scholar]
  19. Naess, A. The Shallow and the Deep, Long-Range Ecology Movement. A Summary. Interdiscip. J. Philos. 1973, 16, 95–100. [Google Scholar] [CrossRef]
  20. Theodore, R. The Voice of the Earth: An Exploration of Ecopsychology; Simon & Schuster: New York, NY, USA, 1992. [Google Scholar]
  21. Kurle, C.M.; Cadotte, M.W.; Seo, M.; Dooner, P.; Jones, H.P. Considering Humans as Integral Comonents of “Nature”. Ecol. Solut. Evid. 2023, 4, e12220. [Google Scholar] [CrossRef]
  22. Tiscareno-Osorno, X.; Demetriou, Y.; Marques, A.; Peralta, M.; Jorge, R.; MacIntyre, T.E.; MacIntyre, D.; Smith, S.; Sheffield, D.; Jones, M.V.; et al. Systematic Review of Explicit Instruments Measuring Nature Connectedness: What Do We Know and What Is Next? Environ. Behav. 2023, 55, 00139165231212321. [Google Scholar] [CrossRef]
  23. Perrin, J.L.; Benassi, V.A. The Connectedness to Nature Scale: A Measure of Emotional Connection to Nature? J. Environ. Psychol. 2009, 29, 434–440. [Google Scholar] [CrossRef]
  24. Kals, E.; Schumacher, D.; Montada, L. Emotional Affinity toward Nature as a Motivational Basis to Protect Nature. Environ. Behav. 1999, 31, 178–202. [Google Scholar] [CrossRef]
  25. Dong, X.; Liu, S.; Li, H.; Yang, Z.; Liang, S.; Deng, N. Love of Nature as a Mediator between Connectedness to Nature and Sustainable Consumption Behavior. J. Clean. Prod. 2020, 242, 118451. [Google Scholar] [CrossRef]
  26. Tam, K.-P. Concepts and Measures Related to Connection to Nature: Similarities and Differences. J. Environ. Psychol. 2013, 34, 64–78. [Google Scholar] [CrossRef]
  27. Balundė, A.; Jovarauskaitė, L.; Poškus, M.S. Exploring the Relationship Between Connectedness with Nature, Environmental Identity, and Environmental Self-Identity: A Systematic Review and Meta-Analysis. SAGE Open 2019, 9, 215824401984192. [Google Scholar] [CrossRef]
  28. Hatty, M.A.; Graham Smith, L.D.; Goodwin, D.; Tinoziva Mavondo, F. The CN-12: A Brief, Multidimensional Connection with Nature Instrument. Front. Psychol. 2020, 11, 1566. [Google Scholar] [CrossRef]
  29. Meis-Harris, J.; Borg, K.; Jorgensen, B.S. The Construct Validity of the Multidimensional AIMES Connection to Nature Scale: Measuring Human Relationships with Nature. J. Environ. Manag. 2021, 280, 111695. [Google Scholar] [CrossRef]
  30. Whitburn, J.; Linklater, W.; Abrahamse, W. Meta-analysis of Human Connection to Nature and Proenvironmental Behavior. Conserv. Biol. 2020, 34, 180–193. [Google Scholar] [CrossRef]
  31. Nisbet, E.K.; Zelenski, J.M.; Murphy, S.A. The Nature Relatedness Scale: Linking Individuals’ Connection with Nature to Environmental Concern and Behavior. Environ. Behav. 2009, 41, 715–740. [Google Scholar] [CrossRef]
  32. Clayton, S. Environmental Identity: A Conceptual and an Operational Definition. In Identity and the Natural Environment: The Psychological Significance of Nature; MIT Press: Cambridge, MA, USA, 2003; pp. 45–65. [Google Scholar]
  33. Olivos, P.; Aragonés, J.-I. Psychometric Properties of the Environmental Identity Scale (EID). Psyecology 2011, 2, 65–74. [Google Scholar] [CrossRef]
  34. Schwartz, S.H. Universals in the Content and Structure of Values: Theoretical Advances and Empirical Tests in 20 Countries. In Advances in Experimental Social Psychology; Elsevier: Amsterdam, The Netherlands, 1992; Volume 25, pp. 1–65. ISBN 978-0-12-015225-4. [Google Scholar]
  35. Schwartz, S.H. A Theory of Cultural Values and Some Implications for Work. Appl. Psychol. 1999, 48, 23–47. [Google Scholar] [CrossRef]
  36. Stern, P.C.; Dietz, T. The Value Basis of Environmental Concern. J. Soc. Issues 1994, 50, 65–84. [Google Scholar] [CrossRef]
  37. Chew, P.K.H. Psychometric Evaluation of Two Instruments to Assess Connection to Nature/Evaluación Psicométrica de Dos Instrumentos Que Miden La Conexión Con La Naturaleza. PsyEcology 2019, 10, 313–343. [Google Scholar] [CrossRef]
  38. Ives, C.D.; Abson, D.J.; von Wehrden, H.; Dorninger, C.; Klaniecki, K.; Fischer, J. Reconnecting with Nature for Sustainability. Sustain. Sci. 2018, 13, 1389–1397. [Google Scholar] [CrossRef]
  39. Meis-Harris, J.; Saeri, A.; Boulet, M.; Borg, K.; Faulkner, N.; Jorgensen, B. Victorians Value Nature—Survey Results; BehaviourWorks Australia: Melbourne, Australia; Monash University: Melbourne, Australia, 2019. [Google Scholar]
  40. Sellbom, M.; Tellegen, A. Factor Analysis in Psychological Assessment Research: Common Pitfalls and Recommendations. Psychol. Assess. 2019, 31, 1428–1441. [Google Scholar] [CrossRef]
  41. Rosellini, A.J.; Brown, T.A. Developing and Validating Clinical Questionnaires. Annu. Rev. Clin. Psychol. 2021, 17, 55–81. [Google Scholar] [CrossRef]
  42. Mackay, C.M.L.; Schmitt, M.T. Do People Who Feel Connected to Nature Do More to Protect It? A Meta-Analysis. J. Environ. Psychol. 2019, 65, 101323. [Google Scholar] [CrossRef]
  43. Vesely, S.; Masson, T.; Chokrai, P.; Becker, A.M.; Fritsche, I.; Klöckner, C.A.; Tiberio, L.; Carrus, G.; Panno, A. Climate Change Action as a Project of Identity: Eight Meta-Analyses. Glob. Environ. Change 2021, 70, 102322. [Google Scholar] [CrossRef]
  44. Nathans, L.L.; Oswald, F.L.; Nimon, K. Interpreting Multiple Linear Regression: A Guidebook of Variable Importance. Pract. Assess. Res. Eval. 2012, 17, 9. [Google Scholar] [CrossRef]
  45. Tonidandel, S.; LeBreton, J.M. Relative Importance Analysis: A Useful Supplement to Regression Analysis. J. Bus. Psychol. 2011, 26, 1–9. [Google Scholar] [CrossRef]
  46. Capaldi, C.A.; Dopko, R.L.; Zelenski, J.M. The Relationship between Nature Connectedness and Happiness: A Meta-Analysis. Front. Psychol. 2014, 5, 976. [Google Scholar] [CrossRef]
  47. Kasap, E.Z.; Ağzıtemiz, F.; Ünal, G. Cognitive, Mental and Social Benefits of Interacting with Nature: A Systematic Review. J. Happiness Health 2021, 1, 16–27. [Google Scholar]
  48. Pritchard, A.; Richardson, M.; Sheffield, D.; McEwan, K. The Relationship between Nature Connectedness and Eudaimonic Well-Being: A Meta-Analysis. J. Happiness Stud. 2020, 21, 1145–1167. [Google Scholar] [CrossRef]
  49. Brügger, A.; Kaiser, F.G.; Roczen, N. One for All?: Connectedness to Nature, Inclusion of Nature, Environmental Identity, and Implicit Association with Nature. Eur. Psychol. 2011, 16, 324–333. [Google Scholar] [CrossRef]
  50. Gould, R.K.; Schultz, P.W. Challenges to Understanding Nonmaterial Dimensions of Human-Nature Connections, and How to Address Them. Ecol. Soc. 2021, 26, art14. [Google Scholar] [CrossRef]
  51. Suganthi, L. Ecospirituality: A Scale to Measure an Individual’s Reverential Respect for the Environment. Ecopsychology 2019, 11, 110–122. [Google Scholar] [CrossRef]
  52. Pett, M.; Lackey, N.; Sullivan, J. Making Sense of Factor Analysis; SAGE Publications: Thousand Oaks, CA, USA, 2003; ISBN 978-0-7619-1950-6. [Google Scholar]
  53. Brick, C.; Sherman, D.K.; Kim, H.S. “Green to Be Seen” and “Brown to Keep down”: Visibility Moderates the Effect of Identity on pro-Environmental Behavior. J. Environ. Psychol. 2017, 51, 226–238. [Google Scholar] [CrossRef]
  54. Clifton, J.D.W.; Baker, J.D.; Park, C.L.; Yaden, D.B.; Clifton, A.B.W.; Terni, P.; Miller, J.L.; Zeng, G.; Giorgi, S.; Schwartz, H.A.; et al. Primal World Beliefs. Psychol. Assess. 2019, 31, 82–99. [Google Scholar] [CrossRef]
  55. Ryff, C.D.; Keyes, C.L.M. The Structure of Psychological Well-Being Revisited. J. Personal. Soc. Psychol. 1995, 69, 719–727. [Google Scholar] [CrossRef]
  56. Watson, D.; Anna, L.; Tellegen, A. Development and Validation of Brief Measures of Positive and Negative Affect: The PANAS Scales. J. Personal. Soc. Psychol. 1988, 54, 1063–1070. [Google Scholar] [CrossRef]
  57. Ryan, R.M.; Frederick, C. On Energy, Personality, and Health: Subjective Vitality as a Dynamic Reflection of Well-Being. J. Personal. 1997, 65, 529–565. [Google Scholar] [CrossRef]
  58. Gifford, R. Environmental Psychology Matters. Annu. Rev. Psychol. 2014, 65, 541–579. [Google Scholar] [CrossRef]
  59. Adler, N.; Epel, E.S.; Catellazzo, G.; Ickovics, J.R. Relationship of Subjective and Objective Social Status with Psychological and Physiological Functioning: Preliminary Data in Healthy White Women. Health Psychol. 2000, 19, 586–592. [Google Scholar] [CrossRef]
  60. Hair, J.F.; Hult, G.T.M.; Ringle, C.M.; Sarstedt, M. A Primer on Partial Least Squares Structural Equation Modeling (PLS-SEM), 3rd ed.; SAGE: Los Angeles, CA, USA, 2017. [Google Scholar]
  61. Mardia, K.V. Measures of Multivariate Skewness and Kurtosis with Applications. Biometrika 1970, 57, 519–530. [Google Scholar] [CrossRef]
  62. Rosseel, Y. Lavaan: An R Package for Structural Equation Modeling. J. Stat. Softw. 2012, 48, 1–36. [Google Scholar] [CrossRef]
  63. Hu, L.; Bentler, P.M. Cutoff Criteria for Fit Indexes in Covariance Structure Analysis: Conventional Criteria versus New Alternatives. Struct. Equ. Model. A Multidiscip. J. 1999, 6, 1–55. [Google Scholar] [CrossRef]
  64. Brown, T. Confirmatory Factor Analysis for Applied Research, 2nd ed.; The Guilford Press: New York, NY, USA, 2015. [Google Scholar]
  65. Li, C.-H. Confirmatory Factor Analysis with Ordinal Data: Comparing Robust Maximum Likelihood and Diagonally Weighted Least Squares. Behav. Res. 2016, 48, 936–949. [Google Scholar] [CrossRef]
  66. Rickard, S.C.; White, M.P. Barefoot Walking, Nature Connectedness and Psychological Restoration: The Importance of Stimulating the Sense of Touch for Feeling Closer to the Natural World. Landsc. Res. 2021, 46, 975–991. [Google Scholar] [CrossRef]
  67. Nisbet, E.K.; Zelenski, J.M.; Grandpierre, Z. Mindfulness in Nature Enhances Connectedness and Mood. Ecopsychology 2019, 11, 81–91. [Google Scholar] [CrossRef]
  68. Passmore, H.-A.; Holder, M.D. Noticing Nature: Individual and Social Benefits of a Two-Week Intervention. J. Posit. Psychol. 2017, 12, 537–546. [Google Scholar] [CrossRef]
  69. Richardson, M.; Hamlin, I.; Butler, C.W.; Thomas, R.; Hunt, A. Actively Noticing Nature (Not Just Time in Nature) Helps Promote Nature Connectedness. Ecopsychology 2022, 14, 8–16. [Google Scholar] [CrossRef]
  70. Doherty, T.J.; Clayton, S. The Psychological Impacts of Global Climate Change. Am. Psychol. 2011, 66, 265–276. [Google Scholar] [CrossRef]
  71. Albrecht, G.A. Negative Psychoterratic Emotions. In Earth Emotions; Cornell University Press: Ithaca, NY, USA, 2019. [Google Scholar]
  72. Clayton, S.; Karazsia, B.T. Development and Validation of a Measure of Climate Change Anxiety. J. Environ. Psychol. 2020, 69, 101434. [Google Scholar] [CrossRef]
  73. Jalin, H.; Sapin, A.; Macherey, A.; Boudoukha, A.H.; Congard, A. Understanding Eco-Anxiety: Exploring Relationships with Environmental Trait Affects, Connectedness to Nature, Depression, Anxiety, and Media Exposure. Curr. Psychol. 2024, 43, 23455–23468. [Google Scholar] [CrossRef]
  74. Hughes, J.; Rogerson, M.; Barton, J.; Bragg, R. Age and Connection to Nature: When Is Engagement Critical? Front. Ecol. Environ. 2019, 17, 265–269. [Google Scholar] [CrossRef]
  75. Reese, R.F.; Lewis, T.F.; Kothari, B.H. Nature Connection Changes throughout the Life Span: Generation and Sex-based Differences in Ecowellness. Adultspan J. 2020, 19, 94–106. [Google Scholar] [CrossRef]
  76. Davis, J.L.; Le, B.; Coy, A.E. Building a Model of Commitment to the Natural Environment to Predict Ecological Behavior and Willingness to Sacrifice. J. Environ. Psychol. 2011, 31, 257–265. [Google Scholar] [CrossRef]
  77. Reese, R.F.; Myers, J.E.; Lewis, T.F.; Willse, J.T. Construction and Initial Validation of the Reese EcoWellness Inventory. Int. J. Adv. Couns. 2015, 37, 124–142. [Google Scholar] [CrossRef]
  78. Lindsay, D.; Wang, E. Analyzing Differences in the Definition of Nature; Western Psychological Convention: Riverside, CA, USA, 2023. [Google Scholar]
  79. Briggs, N.E.; MacCallum, R.C. Recovery of Weak Common Factors by Maximum Likelihood and Ordinary Least Squares Estimation. Multivar. Behav. Res. 2003, 38, 25–56. [Google Scholar] [CrossRef] [PubMed]
  80. Davis, J.L.; Green, J.D.; Reed, A. Interdependence with the environment: Commitment, interconnectedness, and environmental behavior. J. Environ. Psychol. 2009, 29, 173–180. [Google Scholar] [CrossRef]
  81. Dunlap, R.E.; Van Liere, K.D. The “New Environmental Paradigm”. J. Environ. Educ. 1978, 9, 10–19. [Google Scholar] [CrossRef]
  82. Galway, L.P.; Beery, T.; Buse, C.; Gislason, M.K. What drives climate action in Canada’s provincial north? Exploring the role of connectedness to nature, climate worry, and talking with friends and family. Climate 2021, 9, 146. [Google Scholar] [CrossRef]
  83. Hanley, A.W.; Deringer, S.A.; Sneed, J.C.; Bettmann, J.E.; Gonzalez-Pons, K.M. The State of Interdependence with Nature Scale: Development and Initial Validation. Ecopsychology 2022, 14, 47–57. [Google Scholar] [CrossRef]
  84. Kleespies, M.W.; Braun, T.; Dierkes, P.W.; Wenzel, V. Measuring Connection to Nature—A Illustrated Extension of the Inclusion of Nature in Self Scale. Sustainability 2021, 13, 1761. [Google Scholar] [CrossRef]
  85. Komasta, L.; Novomestky, F. Moments, Cumulants, Skewness, Kurtosis and Related Tests (Version 0.14.1) [R]. 2015. Available online: https://cran.r-project.org/web//packages//moments/moments.pdf (accessed on 14 June 2025).
  86. Korkmaz, S.; Göksülük, D.; Zararsız, G. MVN: An R Package for Assessing Multivariate Normality (Version 5.9) [R]. 2021. Available online: https://journal.r-project.org/archive/2014-2/korkmaz-goksuluk-zararsiz.pdf (accessed on 14 June 2025).
  87. Leary, M.R.; Tipsord, J.M.; Tate, E.B. Allo-inclusive identity: Incorporating the social and natural worlds in one’s sense of self. In Transcendingn Self-Interest: Psychological Explorations of the Quiet Ego; American Psychological Association: Washington, DC, USA, 2008; pp. 137–147. [Google Scholar]
  88. Martin, C.; Czellar, S. The extended Inclusion of Nature in Self scale. J. Environ. Psychol. 2016, 47, 181–194. [Google Scholar] [CrossRef]
  89. Perkins, H.E. Measuring love and care for nature. J. Environ. Psychol. 2010, 30, 455–463. [Google Scholar] [CrossRef]
  90. Restall, B.; Conrad, E. A literature review of connectedness to nature and its potential for environmental management. J. Environ. Manag. 2015, 159, 264–278. [Google Scholar] [CrossRef]
  91. Richardson, M.; Hunt, A.; Hinds, J.; Bragg, R.; Fido, D.; Petronzi, D.; Barbett, L.; Clitherow, T.; White, M. A measure of nature connectedness for children and adults: Validation, performance, and insights. Sustainability 2019, 11, 3250. [Google Scholar] [CrossRef]
  92. Schultz, P.W.; Shriver, C.; Tabanico, J.J.; Khazian, A.M. Implicit connections with nature. J. Environ. Psychol. 2004, 24, 31–42. [Google Scholar] [CrossRef]
  93. Walton, T.N.; Jones, R.E. Ecological Identity: The Development and Assessment of a Measurement Scale. Environ. Behav. 2018, 50, 657–689. [Google Scholar] [CrossRef]
Figure 1. Twenty-item DEEP CTN Scale four-factor hierarchical structure with standardized estimates of factor loadings for each latent variable and item; CTN = Connection to Nature.
Sustainability 17 05680 g001
Table 1. Measures of connection to nature and their dimensional structure.
CitationMeasureDimensions Identified
(Name Given by Researchers)
Current paperDEEP Connection to NatureCognitive (Depth of identity)
Emotional (Emotional connection)
Behavioral (Experiential connection)
Behavioral (Presence within nature)
15, 23Connectedness to NatureCognitive (unidimensional)
17Inclusion of Nature in the SelfCognitive (unidimensional)
24Emotional Affinity with NatureEmotional (unidimensional)
25Love of NatureEmotional (unidimensional)
31Nature RelatednessCognitive (NR-self)
Behavioral (NR-experience)
Human–Nature Worldviews (NR-perspective)
16, 37NR-6Cognitive (unidimensional)
32, 33Environmental IdentityCognitive (Environmental identity)
Emotional (Appreciation of nature)
Behavioral (Enjoying nature)
Environmentalism a
12Environmental Identity RevisedCognitive (unidimensional)
29AIMESCognitive (Identity)
Emotional (Affect)
Behavioral (Experiential)
Human–Nature Worldviews (Materialism)
Human–Nature Worldviews (Spirituality)
28CN-12Cognitive (Identity)
Behavioral (Experience)
Human–Nature Worldviews (Philosophy)
48Disposition to connect with natureBehavioral (unidimensional)
49Ecospirituality scale bDwelling
Caring
Revering
Experiencing
Relating
Note: while this is not an exhaustive list of all CTN measures, it is meant to give a sense of the variety of dimensions explored in the literature. a This dimension represents an identity that sees oneself as an environmentalist. b The Ecospirituality scale was developed using a different theoretical background from traditional CTN scales and, as such, displays different dimensional components.
Table 2. New 20-item DEEP Connection to Nature Scale.
ItemDimension
I view nature as a mother who nurtures and cares for me.Depth of Identity
Human beings and nature are connected by the same energy or Life-force.Depth of Identity
My connection to nature is something I would describe as spiritualDepth of Identity
Every part of nature is sacred.Depth of Identity
I think about the shared breath between myself and plants; I breathe in the oxygen released by plants, and plants use the carbon dioxide I exhale.Depth of Identity
Seeing a cleared forest is upsetting to me.Emotional Connection
If one of my plants died, I would blame myself.Emotional Connection
Thinking of someone carving their initials into a tree makes me cringe.Emotional Connection
If there is an insect, such as a fly or a spider, in my home, I try to catch and release it rather than kill it.Emotional Connection
I talk to the wild animals I encounter (e.g., birds, lizards, rabbits, squirrels).Emotional Connection
I like to get outdoors whenever I get the chance.Experiential Connection
I feel uneasy if I am away from nature for too long.Experiential Connection
I engage and participate with nature to find meaning and richness in life.Experiential Connection
My favorite place is in nature.Experiential Connection
Walking through a forest makes me forget about my daily worries.Experiential Connection
I take time to watch the clouds pass by.Presence within Nature
I deliberately take time to watch stars at night.Presence within Nature
I consciously watch or listen to birds.Presence within Nature
I take time to consciously smell flowers.Presence within Nature
When possible, I take time to watch the sunrise or the sunset without distractions.Presence within Nature
Note: This table displays the full list of items for the new DEEP Connection to Nature scale. CFA confirmed a four-factor structure. The Cronbach’s alpha for each dimension was Depth = 0.86, Experience = 0.88, Emotional = 0.70, and Presence = 0.87 (see Section 3 for details).
Table 3. Descriptive statistics, internal consistency, and bivariate correlations of the DEEP CTN Scale.
DimensionαM (SD)1234
1. Depth of Identity0.864.69 (1.46)
2. Emotional0.704.59 (1.34)0.54 ***
3. Experiential0.884.88 (1.44)0.70 ***0.57 ***
4. Presence within nature0.874.56 (1.37)0.61 ***0.57 ***0.58 ***
5. Total0.934.68 (1.18)0.85 ***0.80 ***0.85 ***0.81 ***
Note: M represents mean, SD represents standard deviation, and α represents Cronbach’s alpha. All correlations had 315 degrees of freedom; *** p < 0.001.
Table 4. Comparative fit indices for each model.
Modelχ2 (df)RMSEA (95% CI)RMSRTLICFIAIC.
1-factor676.43 (170)0.11 (0.1–0.12)0.070.780.822,833.50
4-factor hierarchical358.4 (164)0.07 (0.06–0.08)0.050.910.9322,446.42
4-factor366.6 (166)0.07 (0.06–0.08)0.050.910.9222,452.24
Note: Chi-Square (χ2): closer to 0 indicates better fit; Root mean square error (RMSEA): 0.01 = Excellent, 0.05 = Good, 0.08 = Mediocre; Standardized root mean square residual (RMSR): closer to 0 indicates better fit; Tucker Lewis Index (TLI): closer to 1 indicates better fit; Comparative fit index (CFI): closer to 1 indicates better fit; Akaike Information Criterion (AIC): the lower the AIC, the more predictive.
Table 5. Spearman correlations between DEEP CTN Scale dimensions and existing measures of Connection to Nature.
Depth of IdentityEmotionalExperientialPresence Within NatureTotal Score
CNS0.75 ***0.50 ***0.62 ***0.53 ***0.72 ***
EID-r0.63 ***0.58 ***0.81 ***0.55 ***0.78 ***
Note: CNS = Connectedness to Nature Scale; EID-r = Environmental Identity Scale—revised; *** p < 0.001.
Table 6. Correlations between DEEP CTN Scale dimensions, PEB, and well-being.
Depth of IdentityEmotionalExperientialPresence Within NatureTotal Score
PEB0.44 ***0.45 ***0.44 ***0.46 ***0.53 ***
WB0.42 ***0.17 **0.34 ***0.39 ***0.39 ***
Note: PEB = Pro-environmental behavior; WB = Well-being; ** p < 0.01; *** p < 0.001.
Table 7. Linear regressions showing predictive and incremental validity of the new DEEP CTN Scale dimensions when predicting PEB.
Predictive ValidityIncremental Validity
VariableStd Beta (99% CI)pPartial R2Std Beta (99% CI)pPartial R2
Depth of Identity0.14 (0–0.28)0.050.070.07 (−0.08–0.22)0.360.06
Emotional0.21 (0.08–0.34)00.08 ***0.22 (0.1–0.35)00.08 ***
Experiential0.12 (−0.02–0.27)0.080.070.12 (−0.02–0.26)0.090.06
Presence within nature0.17 (0.04–0.31)0.010.08 **0.14 (0.01–0.28)0.040.07 *
Primal Worldviews 0.14 (0.03–0.25)0.010.04 **
Age 0 (0–0.01)0.170.01
Model R20.30.31
Note: Std Beta < 0.29 = small; Std Beta < 0.49 = medium; Std Beta > 0.50 = large; * p < 0.05; ** p < 0.01; *** p < 0.001.
Table 8. Linear regressions showing exploratory findings of the new DEEP CTN Scale dimensions and covariates when predicting well-being.
Predictive ValidityIncremental Validity
VariableStd Beta (99% CI)pPartial R2Std Beta (99% CI)pPartial R2
Depth of Identity0.22 (0.1–0.34)0.000.09 ***0.13 (0–0.25)0.040.06 *
Emotional−0.15 (−0.26–−0.04)0.010.02 **−0.1 (−0.2–0.01)0.070.01
Experiential0.10 (−0.02–0.22)0.110.050.07 (-0.05–0.18)0.270.04
Presence within nature0.23 (0.11–0.34)0.000.08 ***0.19 (0.08–0.3)0.000.07 ***
Worldviews 0.18 (0.09–0.27)0.000.07 ***
Politics 0.14 (0.06–0.22)0.000.04 ***
Age 0.01 (0–0.01)0.040.02 *
Age 0.13 (0–0.25)0.040.06 *
Model R20.310.24
Note: std Beta < 0.29 = small; std Beta < 0.49 = medium; std Beta > 0.50 = large; * p < 0.05; ** p < 0.01; *** p < 0.001.
Disclaimer/Publisher’s Note: The statements, opinions and data contained in all publications are solely those of the individual author(s) and contributor(s) and not of MDPI and/or the editor(s). MDPI and/or the editor(s) disclaim responsibility for any injury to people or property resulting from any ideas, methods, instructions or products referred to in the content.

