Article

A Microcirculation Optimization Model for Public Transportation Networks in Low-Density Areas Considering Equity—A Case of Lanzhou

1
School of Architecture and Urban Planning, Lanzhou Jiaotong University, Lanzhou 730070, China
2
School of Transportation, Lanzhou Jiaotong University, Lanzhou 730070, China
*
Author to whom correspondence should be addressed.
Sustainability 2025, 17(13), 5679; https://doi.org/10.3390/su17135679
Submission received: 22 May 2025 / Revised: 13 June 2025 / Accepted: 16 June 2025 / Published: 20 June 2025

Abstract

With the increase in urban–rural disparities in China, rural public transportation systems in low-density areas face unique challenges, especially in the contexts of sparse population, complex topography, and uneven resource allocation; research on public transportation in low-density areas has had less attention compared to high-density urban areas. Therefore, how to solve the dilemma of public transportation service provision in low-density rural areas due to sparse population and long travel distances has become an urgent problem. In this paper, a dynamic optimization model based on a two-layer planning framework was constructed. The upper layer optimized the topology of multimodal transportation nodes through the Floyd shortest path algorithm to generate a composite network of trunk roads and feeder routes; the lower layer adopted an improved Logit discrete choice model, integrating the heterogeneous utility parameters, such as time cost, economic cost, and comfort, to simulate and realize the equilibrium allocation of stochastic users. It was found that the dynamic game mechanism based on the “path optimization–fairness measurement” can optimize the travel time, mode, route, and bus stop selection of rural residents. At the same time, the mechanism can realize the fair distribution of rural transportation network subjects (people–vehicles–roads). This provides a dynamic, multi-scenario macro policy reference basis for the optimization of a rural transportation network layout.

1. Introduction

The structural characteristics of dispersed population and uneven spatial and temporal distributions of travel demand have long constrained the development of public transportation in low-density rural areas. It is generally faced with the dual challenges of insufficient service coverage and operational inefficiency, which are deeply mired in the structural contradiction of imbalance between supply and demand [1]. This low accessibility not only significantly increases the travel costs of residents but also reinforces their reliance on private motorized travel, leading to increased carbon emissions and loss of social welfare. A particular operational dilemma in such systems is the “pulse service” model. While this model guarantees minimum accessibility in the spatial dimension, it faces long waiting times at the expense of convenience. To solve this systemic problem, policies such as the Action Plan for the Construction of Digital Villages (2022–2025) explicitly propose the construction of an “integrated transport and postal” logistics service network to improve resource utilization efficiency. In this context, how to build a scientific transportation resource allocation model to effectively alleviate or even reconstruct the prevalent “pulse service” [2] mode under the established resource constraints, to bridge the “service faults” caused by it, and to enhance the convenience and fairness of the service become key issues that need to be resolved urgently to promote the equalization of public services in urban and rural areas.
Transportation as an important basis for social activities, resource allocation, and service provision must reflect the concept of social equity [3]. In the field of transportation, the core of the fairness problem is reflected in the spatial displacement capacity constraints caused by the uneven distribution of resources [4]. Existing empirical studies based on the theoretical framework of transportation equity show that the resource allocation of the transportation system presents significant three-dimensional spatial heterogeneity (accessibility, affordability, and quality of service), resulting in disadvantaged groups facing multi-dimensional institutional barriers superimposed on each other, forming a spatial equity allocation of the justice gap [5,6].
Accessibility and equity centrality: Accessibility, classically defined as an individual’s access to jobs and urban services under specific spatio-temporal constraints (e.g., 30-min thresholds), is a core dimension of transportation equity [7,8] (usually based on a 30-min threshold) [9,10]. Martens and Golub [11] emphasized that accessibility is not only a spatial mobility metric but also an essential condition for social participation and pointed out the public responsibility of the government in providing accessibility, laying down an important benchmark for subsequent studies. From the dimension of resource allocation, Guzman et al. [12] constructed a mobility equity index to reveal the spatial differentiation pattern of urban and rural transportation services. In environmental justice, the latest research confirms that the negative externality of the transportation infrastructure has a spatial transfer phenomenon, forming a typical “spatial deprivation” effect [13]. At the methodological level, academics have made important progress in indicator innovation. Caggiani et al. [14] used the road network affiliation function constructed by the fuzzy set theory to successfully portray the nonlinear characteristics of accessibility decay in marginal areas; Ballantyne [15] developed a small-scale multi-modal transportation evaluation system, which provides a refined analytical tool for urban decision-making; and Palm et al. [16] developed a social equity impact assessment model for NMT and transit integration based on new transit pilot data. However, there are still obvious limitations in the existing studies. First, it is difficult for traditional evaluation indicators to effectively characterize the imbalance between supply and demand in low-density areas [17,18]; second, there is a group selection bias in the perspective of the study, which overly focuses on the disadvantaged groups and neglects the spatial benefit mechanism of the advantaged groups [19,20], resulting in a lack of holistic knowledge of the structure of the distribution of the benefits of transportation; third, the established results mostly use cross-sectional data analysis, which is difficult for revealing the dynamic evolution law of transportation resource allocation and its institutional causes [21].
The bus route network optimization research paradigm has shifted from the traditional stage of demand forecasting to intelligent algorithm-driven forecasting. The classical path assignment model relies on the shortest path principle to construct a static demand response mechanism [22]. Subsequent scholars have improved the prediction accuracy by introducing a generalized path selection mechanism (GNL model) [23], and the hybrid perturbation assignment method further incorporates the traveler behavioral heterogeneity parameter, which significantly enhances the reliability of the model [24]. Along with the advancement of computing technology, the bionic optimization algorithm triggers methodological innovation. Bionic optimization algorithms, such as immunogenetic algorithms [25] and improved particle swarm algorithms [26], promote methodological innovations, and multidimensional resource allocation models [27] mark the evolution of optimization frameworks towards systematization. Stochastic planning models [28] have made a breakthrough in dynamic resource allocation. There is the multi-objective synergistic optimization trend, where research is shifting from single cost minimization [29,30,31] to multi-objective synergy, such as efficiency, equity, and sustainability. Lin [32] integrated economic and environmental costs to achieve the synergistic optimization of service coverage and route efficiency; Ma et al. [33] integrated a mixed-integer planning model that jointly optimized vehicle paths and passenger assignments to enhance the resilience of customized buses. However, there are three core shortcomings in the established studies. First, there is insufficient modeling of the stochastic nature of OD (origin–destination) passenger flows and a lack of effective portrayal of how demand fluctuations dynamically affect resource utilization [34,35]; second, with the weak design of the multi-objective synergistic mechanism, linear weighting method-dominated solutions are susceptible to the interference of subjective weighting, and it is difficult to resolve the nonlinear coupling relationship between objectives [36,37]; and third, algorithmic innovation is disconnected from the quantification of equity. Although evolutionary algorithms such as NSGA-II maintain population diversity through crowding strategies [38], they fail to construct an evaluation system that is articulated with spatial fairness theories. Sun et al. [39] and their multi-site vehicle scheduling model made progress in cost control, but it still has not broken through the above bottlenecks. The deterministic assumption also limits the application scope of the improved immunogenetic algorithm (IIGA) of Ma et al. [40].
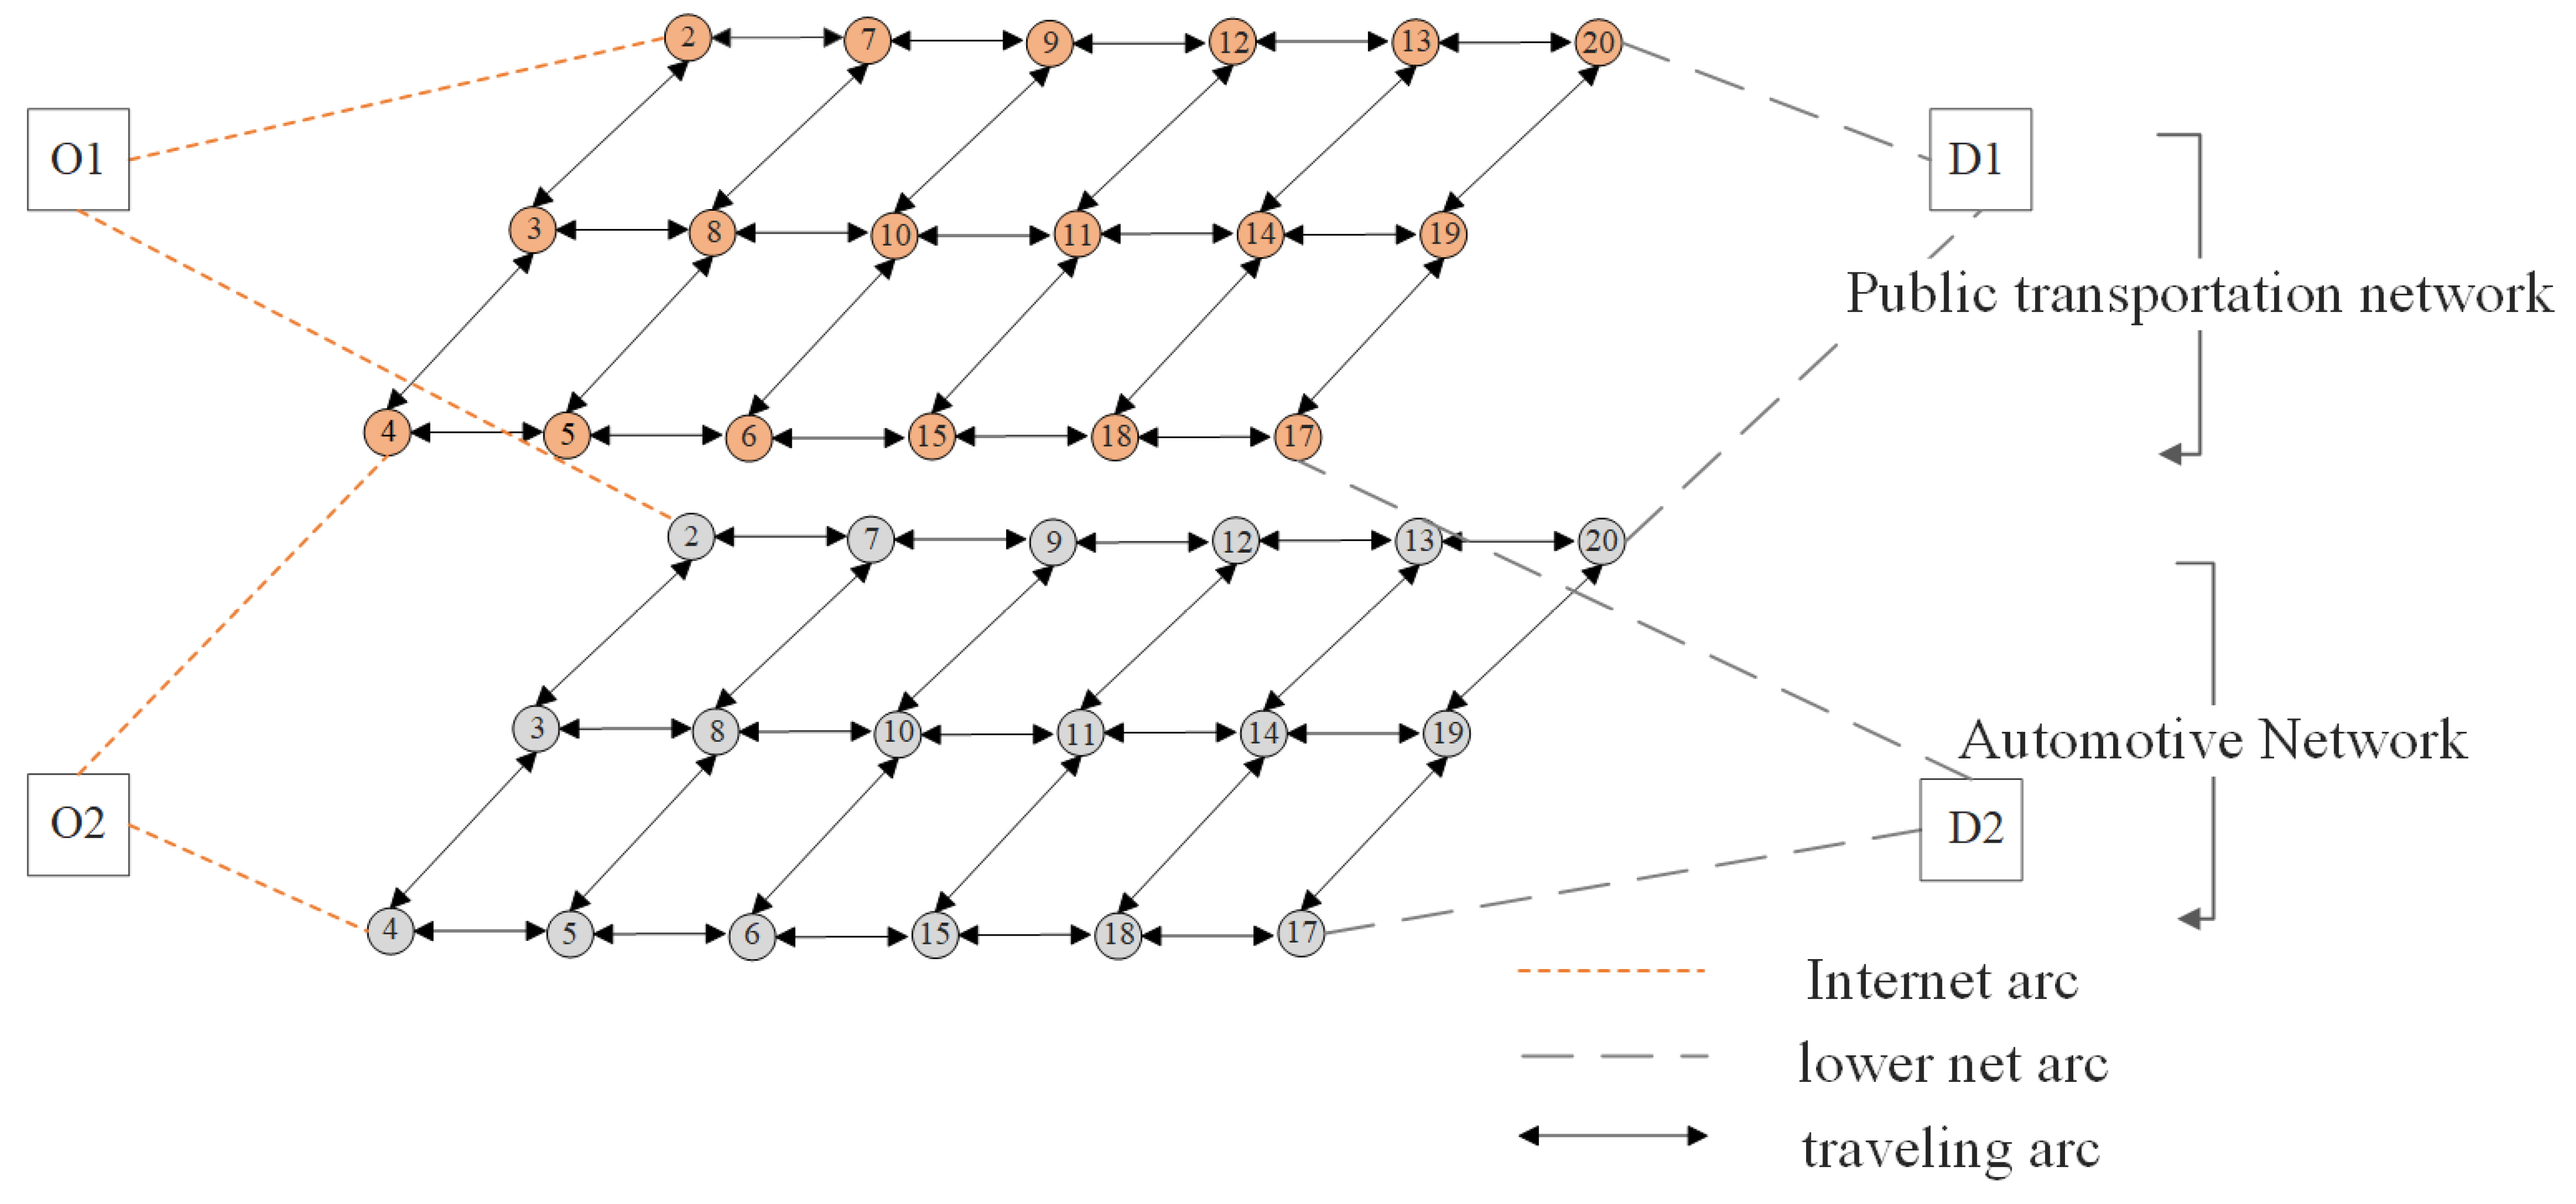
Aiming at the above research limitations, this paper proposed a two-layer planning model integrating transportation equity constraints, focusing on the multidimensional equity imbalance in the “county–village–village” transportation system, and constructing a multimodal transportation equity analysis framework including spatial accessibility, right-of-way allocation, and cost internalization. The main contents were to (i) establish a two-dimensional fairness evaluation system based on the Gini coefficient of road area and the relative deprivation coefficient of travel cost that breaks through the limitations of the traditional single-indicator metrics; (ii) construct a two-layer planning traffic network model, considering the differentiation of the right-of-way allocation, which realizes the synergistic operation of the bus-only lanes and the conventional roads through physical segregation; and (iii) design multi-objective optimization algorithms, combining the NSGA-II intelligent algorithm and two-layer planning model to realize the optimization of efficiency and fairness. By constructing a systematic framework of “demand analysis, road network modeling, costing, algorithmic optimization”, a new methodology was provided to support the allocation of transportation resources in low-density rural areas.

2. Methods

2.1. Upper-Level Model

2.1.1. Indicators of Equity in the Distribution of Benefits

Under the perspective of spatial equity, the social utility generated by the transportation system should not be tilted towards specific users or social groups, and the benefits enjoyed by various groups of travelers should be balanced [41,42,43]. Based on this principle, this study divided travel demand into different origin–destination combination units according to spatial distribution characteristics. It ensured horizontal equity in the distribution of benefits generated by road network optimization measures through establishing a constraint mechanism, thus reflecting the principle of universality in the allocation of transportation resources [44]. The specific form is as follows:
α ( y ) = max w W μ w ( y ) μ ¯ w
μ w ( y ) denotes the equilibrium travel cost between OD pairs of w after road network improvement, and μ ¯ w denotes the equilibrium travel cost between the pair w before the road network improvement. When α ( y ) < 1 , this coefficient was lower than the baseline value, and the roadway network adjustment measures led to an overall reduction in traveler costs between all origin–destination combinations and achieved positive benefit sharing on a region-wide basis; if α ( y ) = 1 , then the access costs of the travel corridors before and after the optimization remained unchanged, and there was no weakening of the benefits of travel for any group; and when α ( y ) > 1 , there was a significant increase in the access costs of at least one travel corridor, compared to the pre-optimization period, leading to a partial travel groups’ benefits being negatively impacted.

2.1.2. Gini Coefficient

In comprehensive transportation system planning, the right-of-way allocation scheme reflects the balance of development rights and interests of various travel modes [45]. To achieve a balanced distribution of resources among transportation modes, it is necessary to ensure that each transportation system’s right to use of road space remains relatively equal. At the same time, the management generally pursues the goal of intensive utilization of transportation resources under the constraint of limited resources, i.e., to reduce the intensity of per capita resource consumption under the premise of meeting travel demand. Therefore, the fairness of resource allocation was utilized to scientifically evaluate the fairness of resource rationing in the multi-modal transportation network by quantitatively analyzing the differences in road space occupancy by users of different modes of transportation. The specific forms are as follows [46]:
G i n i = 1 2 P 2 X ¯ k = 1 P l p x k x l
P is the total population of the study area; X ¯ represents the overall per capita accessibility value, reflecting the overall accessibility of the region; x k and x l are the per capita accessibility values of the k and l person in the overall residents belonging to the transportation station; and k   a n d   l   take the value range of 1 P , reflecting the accessibility characteristics of the residents of different transportation stations. The value of Gini was between [0, 1] if Gini [0.2, 0.3), indicating that the allocation of transportation resources presented a high degree of equilibrium. If Gini [0.3, 0.4), it indicated the difference in resource allocation was at a socially acceptable level. If Gini [0.4, 0.5), it indicated that that the disparity of resource acquisition among different groups needed to be paid attention to. If Gini [0.6, 1], it signified a significant imbalance in resource possession.

2.1.3. Per Capita Social Cost Sharing

In areas of dense transit service, differences in route layout and frequency of operation can trigger dynamic changes in the distribution of social costs. To systematically assess the fairness of public cost allocation in the multi-modal transportation system, it was necessary to construct a quantitative evaluation system based on the degree of burden difference between groups, which should be able to objectively reflect the degree of occupancy of public resources by various types of travel modes and their cost-sharing proportion of the matching relationship. The specific form is as follows:
A C = m w B N m   B S w q w
B N m indicates the number of vehicles passing through the station, B S w denotes the constraint on the number of lines passing through the station, m denotes the mode of transportation chosen by the passenger, w denotes the OD point pair, q w indicates total OD demand, and A C is a social cost-sharing equity indicator, reflecting a measure of the level of public resource costs borne by individuals in the transportation system. The larger value of A C reflected that the density or frequency of bus service between neighboring stations exceeded the reasonable threshold, resulting in a significant increase in the consumption of public resources per unit of passenger, showing that there was a risk of imbalance in the cost-sharing mechanism. The smaller value of A C indicated that the allocation of public transport resources in the region matched the travel demand, the efficiency of the use of public resources improved, and the distribution of costs among the various groups of travelers became more reasonable.

2.2. Low-Level Model

This paper focused on the two modes of individual motorized travel and intensive public transportation that widely exist in the rural area transportation system and took travel cost as the core element influencing decision-making. The travel cost system consisted of two types of direct economic expenditures and comprehensive consumption, in which the comprehensive consumption covered the quantitative assessment of various types of resource losses in the travel process, and its specific content can be adapted according to the research scenario. To comprehensively reflect the characteristics of travel cost components, the generalized cost framework was set up differently for different transportation modes, mainly integrating the two dimensions of time cost and economic cost. As a result, a multi-modal stochastic transportation network equilibrium model was established:
m i n Z = a 0 x a t a x d x + 1 θ r f w , r m ( l n f w , r m 1 )
m M q w m = q w , w W
r f w , r m = q w m , w W , m M
f w , r m 0 , w W , m M
q w m 0 , w W , m M
x a m = w r f w , r m a , r k , w , a A , k K
x a = m x a m , m M
θ indicates the traveler’s information level, i.e., how much he/she knows about the transportation and roads in the regional network. A larger θ indicates that the traveler knows more about the regional network.
q w m represents the demand for transportation mode m between w at point OD.
q w represents total OD demand.
f w , r m denotes the demand at point OD for transportation mode m between w on path r .
x a m denotes the total travel demand of transportation mode m on segment a .
a , r k , w is the section association coefficient, where if the r path in a w , a , r k , w   = 1; otherwise a , r k , w = 0.
In the modeling process, the framework for measuring the composite travel cost provided a quantitative basis for the composite travel consumption of different transportation modes. In reality, travelers usually choose the path with the lowest estimated cost based on subjective cognition rather than fully possessing the precise cost information of the actual transportation system. Based on this behavioral characteristic, the study established a multi-modal transportation allocation model incorporating the stochastic user equilibrium principle by setting the total demand constant at the origin and destination of the multi-modal transportation network. The model ensured that the sum of the shares of each transportation mode among specific origins and destinations strictly corresponded to the overall travel demand through the constraints of demand conservation to effectively portray the dynamic equilibrium mechanism between the travelers’ choice behavior and the network resource allocation under the condition of finite rationality.

2.3. Algorithmic Design

2.3.1. Upper-Level Problem

Steps of Genetic Particle Swarm Algorithm for Solving Bi-Level Planning Models (Figure 1).
Step 1: Initialize population. The initial population, including the position and velocity of particles, was randomly generated. The position of the particles corresponded to the decision variables in the two-layer planning model, such as the number of station constructions, the number of bus routes, the frequency of bus routes, and so on.
Step 2: The extreme value and global extreme value were calculated. For each particle, the fitness evaluation value of its current iteration cycle was compared in real-time with the quality record of its historical optimal solution, and the quality record and spatial coordinates of its historical optimal solution were dynamically updated when an improvement in the quality of the solution was detected.
Step 3: Particle velocity and position were updated. The velocity and position of each particle in the next generation were calculated according to the velocity and position update formula of the particle swarm optimization algorithm.
Step 4: Genetic manipulation. Firstly, a single-point genetic recombination strategy was implemented to realize the dimensional cross-fertilization of the parental solution. Then, a probability-driven gene mutation mechanism was used to perturb the chromosome sequence locally.
Step 5: Iteration termination condition judgment. The algorithm termination mechanism, combined with the judgment, contained both computational resource constraints, such as the maximum number of iterations threshold setting, and solution quality assessment criteria, such as the fitness value of the population optimal solution fluctuating below the set tolerance threshold in consecutive iteration cycles.

2.3.2. Lower-Level Problem

Logit-Based Algorithm for Solving SUE Models (Figure 2).
Step 1: Constructing road networks and determining effective path sets. First, multi-modal transportation networks were constructed, and effective path sets between OD pairs were determined using effective path search algorithms (e.g., combining Dijkstra’s algorithm and a depth-first search algorithm).
Step 2: Initialization. The flow rate of each path was set.
Step 3: Logit traffic assignment and impedance calculation. A Logit traffic assignment was performed to calculate the selection probability of each traffic mode on different paths, according to the path selection model (which represents the level of travelers’ information), so as to obtain the assigned traffic volume of each road segment and make n = 1. The traffic–impedance coupling mechanism deduced the comprehensive travel cost of each effective path in the current network state.
Step 4: Path flow update and additional traffic calculation. Based on the OD travel demand matrix, the Logit stochastic choice model was used to simulate the distribution decision of passengers in multi-modal paths and then derive the traffic distribution characteristics of each path.
Step 5: Roadway traffic update. The roadway traffic volume was updated.
Step 6: Convergence judgment. Whether the convergence conditions were met was judged. When monitoring the current solution and the preset convergence threshold of the match reached the stability criteria, the system terminated the calculation process and output the steady-state traffic distribution scheme of the multi-modal transportation network; if the standard was not met, then the iterative updating mechanism was updated, making n = n + 1 through the cycle of executing the Logit model based on the calculation of the traffic distribution and the path impedance updating process, gradually approaching the equilibrium state of the system.

3. Results

3.1. Case Selection and Data Sources

The proposed model and solution algorithm were applied to the bus routes in Qinchuan Town, Lanzhou New District, Lanzhou, and the reasons for choosing this area for the case study were as follows: On the one hand, it was because Qinchuan Town is located in the outskirts of the city in the new district of Lanzhou, with a lower population density and more significant network characteristics, which can more accurately reflect the actual situation of the rural transportation network; on the other hand, we mastered the town’s detailed data, such as socio-economic, geographic, and transportation travel modes, so our case study can be constructed for the real scenario. The data came from the Gansu rural passenger transport platform, through the spatial analysis function of the ArcGIS 10.8 software, to construct the traffic association network and topological analysis of the data and to realize the visualization. A total of 12 bus lines and 25 bus stops in the region were selected as the research objects, as shown in Figure 3. Points 1 to 25 represent the numbers of the selected bus stops.

3.2. Model Parameterization

Based on the empirical road network data, topology simplification was implemented, and a computable traffic network model was constructed through station clustering and channel merging techniques while preserving the original traffic nodes and key connectivity relationships. The hierarchical structure of the road network was modeled differently concerning the service characteristics of different travel modes in the multi-modal transportation system. Figure 4 presents the spatial layout of the composite road network integrating infrastructure elements, such as bus-only lanes and conventional roads. In contrast, Figure 5 portrays the network connection relationships of multi-modal path selection through topological abstraction.
The parameter system constructed in this study for the core problem of bus system optimization is shown in Figure 6. In the path selection model, the effective path length extension coefficient of σ = 1.1 [47] and the passenger path perception deviation coefficient of θ = 0.8 [48] were used as the behavioral decision-making parameters; in the upper-level planning model, α = 0.15 and β = 4 were used as the multi-objective regulation parameters, and at the same time, the time unit conversion coefficient of ρ = 60   m i n and the fuel consumption conversion coefficient of f = 0.1   L were introduced as the energy consumption evaluation benchmarks. Based on the characteristics of the two-layer planning model, the bus fare service coverage threshold was set at 50%. The number of populations containing two genetic algorithms was configured to be N = 20 , in which the number of iterations was limited to t i m e s = 200 , the crossover probability P c = 0.9 [49], and the generation gap   G G A P = 0.9 , supplemented by the genetic variation probability of 0.1 to maintain the diversity of the populations. In the algorithm evolution mechanism, the individual and social learning factors were set to be 0.1 and 0.075, respectively, and the dynamic inertia factor interval was set to be 0.8 to 1.0, forming an adaptive search strategy considering global exploration and local optimization. This parameter system ensured the simulation accuracy of the model in a real operation scenario and realized the balance between the algorithm-solving efficiency and stability through the multidimensional synergistic configuration.
Detailed data of the road network are shown in Table 1.
In this case, the data were adapted in the model validation stage for the basic road network characteristics with a low passenger flow base. Since the original passenger flow intensity between the starting and ending points was not enough to trigger the generation threshold of bus routes, if the original data were directly used for the simulation, it would result in most sections of the road network not being able to satisfy the basic flow requirements for bus route deployment or the formed route scheme breaking through the constraint boundaries, which would result in the loss of the effectiveness of the model validation. For this reason, the spatial enhancement method based on travel behavior characteristics was used to calculate the product of the baseline data and the average number of passenger trips to construct a realistic peak hour passenger flow pressure scenario. The spatial analysis tool of the ArcGIS platform was used, as shown in Table 2, to establish the coupling mechanism between bus stops and population distribution by constructing a spatial correlation model of the 500 m buffer zone in the node area ( μ = 3   t i m e s / p e r s o n ). The passenger flow prediction model was established:
Q i = ( P i j × μ )
Q i is the theoretical patronage of site i , and P i j is the population share of the j statistical cell within buffer i . This enhanced passenger flow measurement method achieved two theoretical breakthroughs. First, it broke through the rigid constraints of the traditional gravity model on the critical impedance value in bus route generation by introducing the spatial weight correction factor; second, it maintained the integrity of the topological features of the original road network during the algorithm optimization process.
To develop operation characteristics for rural bus network characteristics, the data in Table 2 show that the selected routes presented significant low-frequency service characteristics. Some of the routes were longer and concentrated in 2–3 shifts, and the average departure interval reached 167.5 min (SD = 118.3), of which the unidirectional service intervals between Route 707 (interval of 330 min) and Route 712 (interval of 360 min) were more than 5 h, which formed a typical impulse-type service pattern. This differentiated operation characteristic effectively simulated the service disconnection phenomenon of urban and rural bus systems, and the following are the statistics of departure intervals as time intervals, as shown in Table 3.

3.3. Model Solving and Result Analysis

3.3.1. Algorithm Convergence

The results of the convergence analysis of the model and the algorithm proposed in this paper, recording the value of the system cost after each operation, respectively, considering the company cost, passenger travel cost, and comprehensive consideration of the two cases, are shown in Figure 7. Through the simulation analysis of the convergence process of the algorithm under different optimization objectives, it can be seen that when the operating cost of the bus company was taken as the optimization objective alone, as shown in Figure 7a, it can be seen that the system reached the preset convergence threshold after 40 iterations; when the passenger travel cost was taken as the optimization objective only, as shown in Figure 7b, it can be seen that the convergence process was prolonged to 45 iterations; and when the comprehensive cost optimization of the two types of subjects was taken into account at the same time, as shown in Figure 7c, it can be seen that the algorithm achieved stable cost after 64 iterations. A total of 64 iterations were required to achieve stable convergence. The characteristics of the convergence curves under the three types of scenarios showed that the number of iterations required by the algorithm showed a reasonable growth trend with the increase in the complexity of the optimization objective, and all the test cases satisfied the termination condition within a finite number of steps. This verifies the robustness and adaptability of the algorithm under different optimization dimensions and fully proves that it can effectively support the solution requirements of the multi-objective cooperative optimization model constructed in this study.

3.3.2. Route After Path Optimization

The path optimization of the line when setting the effective path extension factor of σ = 1.1 is shown below.
(1)
Consider only the cost of the bus company
A total of 10 effective paths were found when considering the company cost on the bus route, as shown in Figure 8. The results of the traffic distribution of each path and the generalized cost are shown in Table 4.
Restructuring the bus company’s route network with the aim to optimize costs led to a significant simplification of the network structure: the average number of stops on a route was reduced from 6.2 to 5.1. For example, Path 3 reduced its operating mileage by 15% by streamlining four stops. However, the service frequency adjustment showed a polarizing trend: the departure interval of high-frequency routes (e.g., Paths 1 and 3) was compressed to 20–30 min, while the departure interval of long-distance routes connecting to the countryside (Paths 6, 7, and 8) remained at a longer interval of 180–360 min. As a result, the overall average service frequency was only improved by 5.8%. The fare mechanism was also adjusted in tandem. The average line fare was adjusted upward from CNY 4.17 to CNY 4.6, creating a stepped pricing structure centered on trunk routes. High-frequency routes maintained their original prices, and fares on rural routes significant increased.
Under the optimization strategy that only considered the company’s cost, its advantage was to reduce the operating cost of the single line through path simplification and to improve the concentration of resources on high-frequency lines. However, this model had significant drawbacks. On the one hand, rural routes increased the average waiting time of residents by 28 min per trip due to node deletion and curing of service intervals; on the other hand, excessive reliance on trunk routes led to reduced network redundancy and weakened anti-interference capability. Although this type of single-objective optimization improves corporate revenue in the short term, it may exacerbate the service imbalance between urban and rural areas in the long term, inducing social welfare losses and policy risks.
(2)
Considering only passenger travel costs
A total of 10 effective paths were found for the bus route when considering the company cost in the example, as shown in Figure 9, and the traffic distribution results and generalized costs for each path are shown in Table 5.
After reconfiguring the bus network according to optimizing passenger travel costs (see Table 5), the average number of stops on a route changed from 6.2 to 7.1. As a result, the service coverage of administrative villages increased by 12.8%; on the other hand, the total number of miles operated increased by 19.3%. Adjustments to departure intervals varied. High-frequency routes like Paths 1 and 9 maintained a 20–30 min headway, the same as before the optimization, while long-distance key routes connecting rural areas, such as Paths 6, 8, and 10, still had 180–360 min headways. Overall, the average frequency of departures (frequency density) was only 4.3% higher than before optimization. There were also changes in fares. The average fare on the optimized routes dropped from CNY 4.17 to CNY 3.91. Notably, the fares of rural routes did not increase significantly in this path adjustment.
Under the optimization strategy that unilaterally focused on passenger costs, its advantages were reflected in reducing passenger walking distance by expanding network coverage, but the model had significant contradictions. Increasing route complexity led to an 18–22% increase in single-line operating costs, while decreasing fares further compressed profit margins and predicted expanding corporate losses; rural routes increased travel time due to node redundancy and the competition for resources with high-frequency routes. Competition for resources with high-frequency routes intensified. While such optimization improved passenger satisfaction in the short term, it led to a double dilemma in the long term. For enterprises, the cost–revenue imbalance may lead to route reductions, while for passengers, the reduced stability of service will offset the fare advantage. Research suggests that a single cost-oriented optimization will exacerbate the structural contradiction between public goods and market-oriented operations and that a combination of fare flexibility and government-purchased services is needed to achieve sustainable development.
(3)
Comprehensive consideration of bus company costs and passenger travel costs
In the example, the company cost and passenger cost of the public transportation line were considered to find 10 effective paths, as shown in Figure 10. The results of the traffic distribution of each path and the generalized cost are shown in Table 6.
From the analysis of the available data, the route optimization met the requirements and satisfied the passengers’ needs. The above results were in line with the actual situation; the amount of OD selected in this calculation example was moderate, and there was no passenger waiting time that was too long, nor was the cost too high. Since local passengers were familiar with the vehicle routes, it was easier and clearer for them to choose the route to take the bus. Secondly, since fewer cabs were in the urban and rural areas, buses were responsible for transporting most of the passengers in the network. The routes with short distances between two stops and duplications were optimized considering the lowest total cost to the passengers and the lowest cost to the operating company.
The data in Table 6 show that the average cost of the combined optimized routes was CNY 4.3, slightly higher than the original network’s CNY 4.17 but significantly lower than the CNY 4.6 of the bus company cost-only scenario. This suggests that the model struck a balance in terms of fare regulation. Headway intervals for high-frequency routes were maintained at 20–30 min, the same as the original network, while headway intervals for long-distance rural routes were shortened to 180–360 min, a 12% reduction from the scenario that only considered corporate cost optimization. This adjustment combined corporate cost and passenger cost considerations and effectively reduced the average waiting time of passengers. The topology analysis showed that the average number of nodes on the optimized routes was 6.5, 4.8% higher than the original network but significantly lower than the 7.1 in the scenario considering only passenger costs. This reflects the synergistic optimization effect of the model on operational efficiency and service coverage. This was demonstrated by improved route efficiency: an 11.2% reduction in operating miles through node streamlining on key routes. Mainline fares were kept stable, while the travel costs of low-income groups were compensated by adding new financially subsidized routes to balance the cost dynamics. Compared to the single optimization scheme, the comprehensive optimization significantly improved multiple benefits. Passenger benefits: The average single trip time was reduced by 9.7 min thanks to optimizing high-frequency route connections.
Enterprise benefits: There were reduced single-line operating costs through path compression and vehicle scheduling algorithm optimization. Social benefits: The service coverage rate of administrative villages rebounded to 93.5%, and the service blind spots were reduced to two. The study shows that the two-layer planning model effectively alleviates the structural contradiction of single-objective optimization.

3.3.3. Road Network Equity Indicators

The initial road network fairness assessment system was constructed through the three dimensions of benefit allocation, road resource allocation, and social cost sharing. Given that the initial road network has not implemented any optimization measures and the benefit allocation dimension has not yet generated actual difference data, to ensure the completeness of the research framework, the benchmark value of this dimension of the initial road network was normalized to a standard reference value. At the same time, the equilibrium value of the travel cost at each starting and ending point obtained through the model calculation provided benchmark data support for the subsequent optimization of benefit distribution fairness. In road resource fairness, the equilibrium travel costs between typical origin and destination points were μ ¯ 18 = 28.4754 and μ ¯ 19 = 28.4708 , respectively, whose small differences reflected the local imbalance in the initial road network traffic distribution. The establishment of the benchmark data not only completely portrayed the initial state characteristics of the road network but also provided a verifiable reference system for the subsequent comparison of the optimization effect through the quantitative results of multi-dimensional indicators, which highlights the practical value of this evaluation method in dynamically tracking the evolution of road network fairness.
Based on the road network structure, this paper analyzed the impact of different cost dimensions on the fluctuation of the Gini index and systematically quantified the fairness evolution law of bus network resource allocation under different cost constraints. As shown in Table 7, the Gini index under the initial network state was 0.48235, reflecting a significant urban–rural road resource allocation imbalance. The single-objective optimization experiment showed that when only considering the cost of the bus company, the Gini coefficient was fine-tuned to 0.48182. Although it improved the operational efficiency through path streamlining, it only made the fairness index decrease slightly by 0.00053, which failed to alleviate the structural contradiction of the resource allocation effectively. When only considering the cost of the passengers, the Gini index was 0.54783, and the network redundancy increased because of the over-expansion of service coverage, which, in turn, made the fairness deteriorate by 13.6%. Instead, it worsened the fairness by 13.6%, which verified the limitation of single-objective optimization. After comprehensively considering the cost of the bus company and the cost of the passengers, the Gini coefficient decreased to 0.47851, lower compared to the initial network by 0.79%.
It can be seen that by controlling the passenger cost and bus company cost separately, the route scheme underwent slight changes. When the bus company cost and passenger cost were controlled comprehensively, the Gini coefficient was further reduced, indicating that the fairness of resource allocation was better balanced. As shown in Figure 11, compared with the traditional model, by choosing appropriate parameters, the optimization scheme proposed in this paper balanced the benefits and fairness under the premise of satisfying different conditions, thus achieving a better resource allocation effect.

4. Discussion

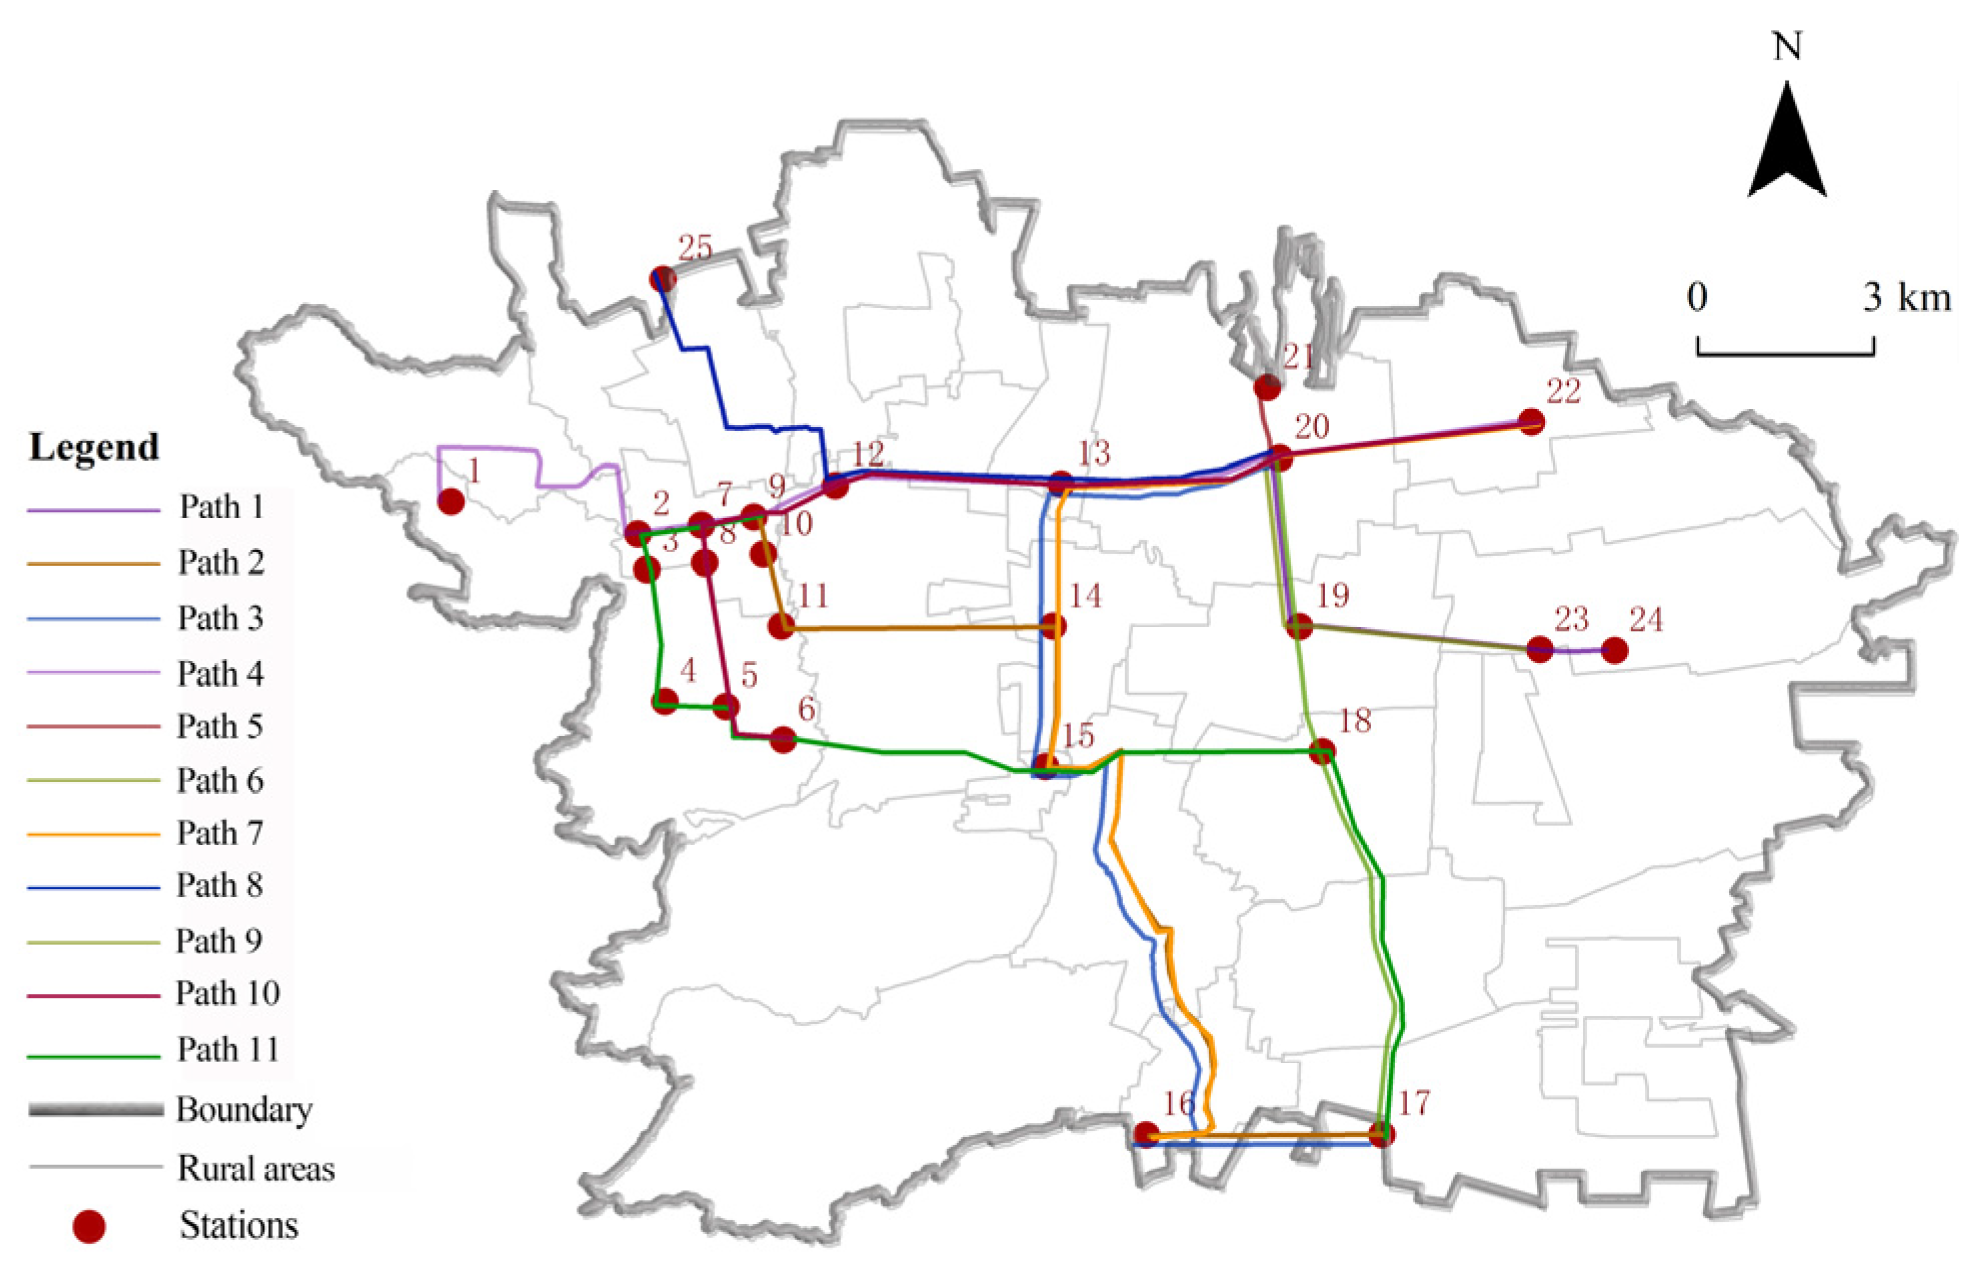
This study achieved a dual breakthrough at the theoretical and practical levels by constructing a fusion framework of a two-layer planning model and an adaptive genetic algorithm. At the theoretical level, the model effectively balanced the conflicts of interests of multiple subjects in urban and rural transit systems, and the integrated optimization scheme reduced the Gini coefficient by 0.79%, which verified the potential of the two-layer planning model to enhance the fairness of resource allocation. Compared with single-objective optimization studies [
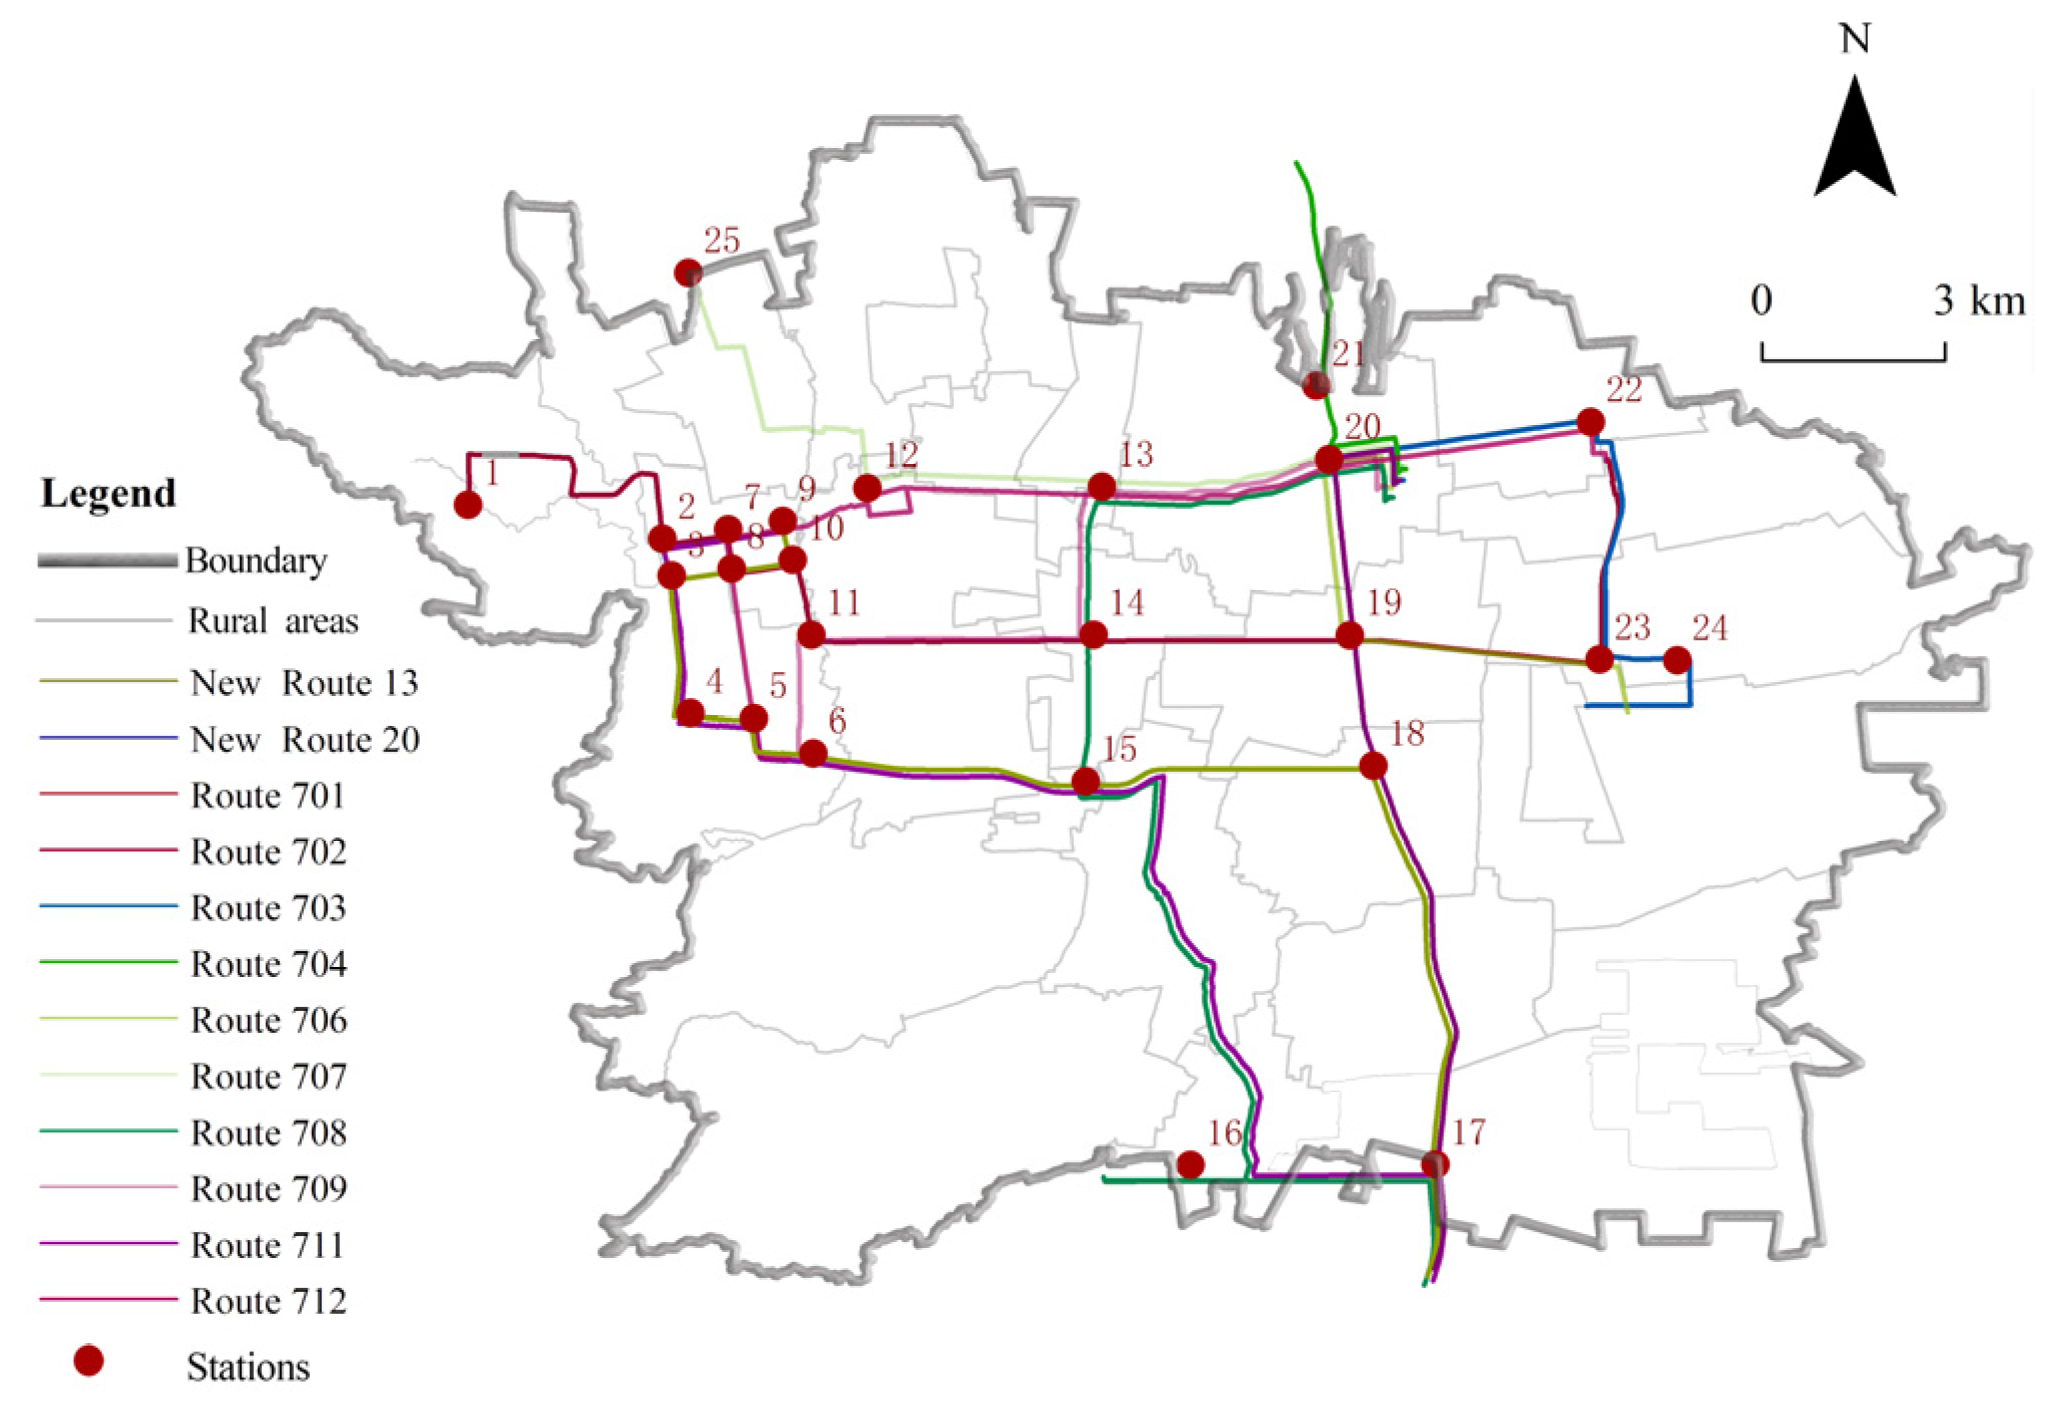
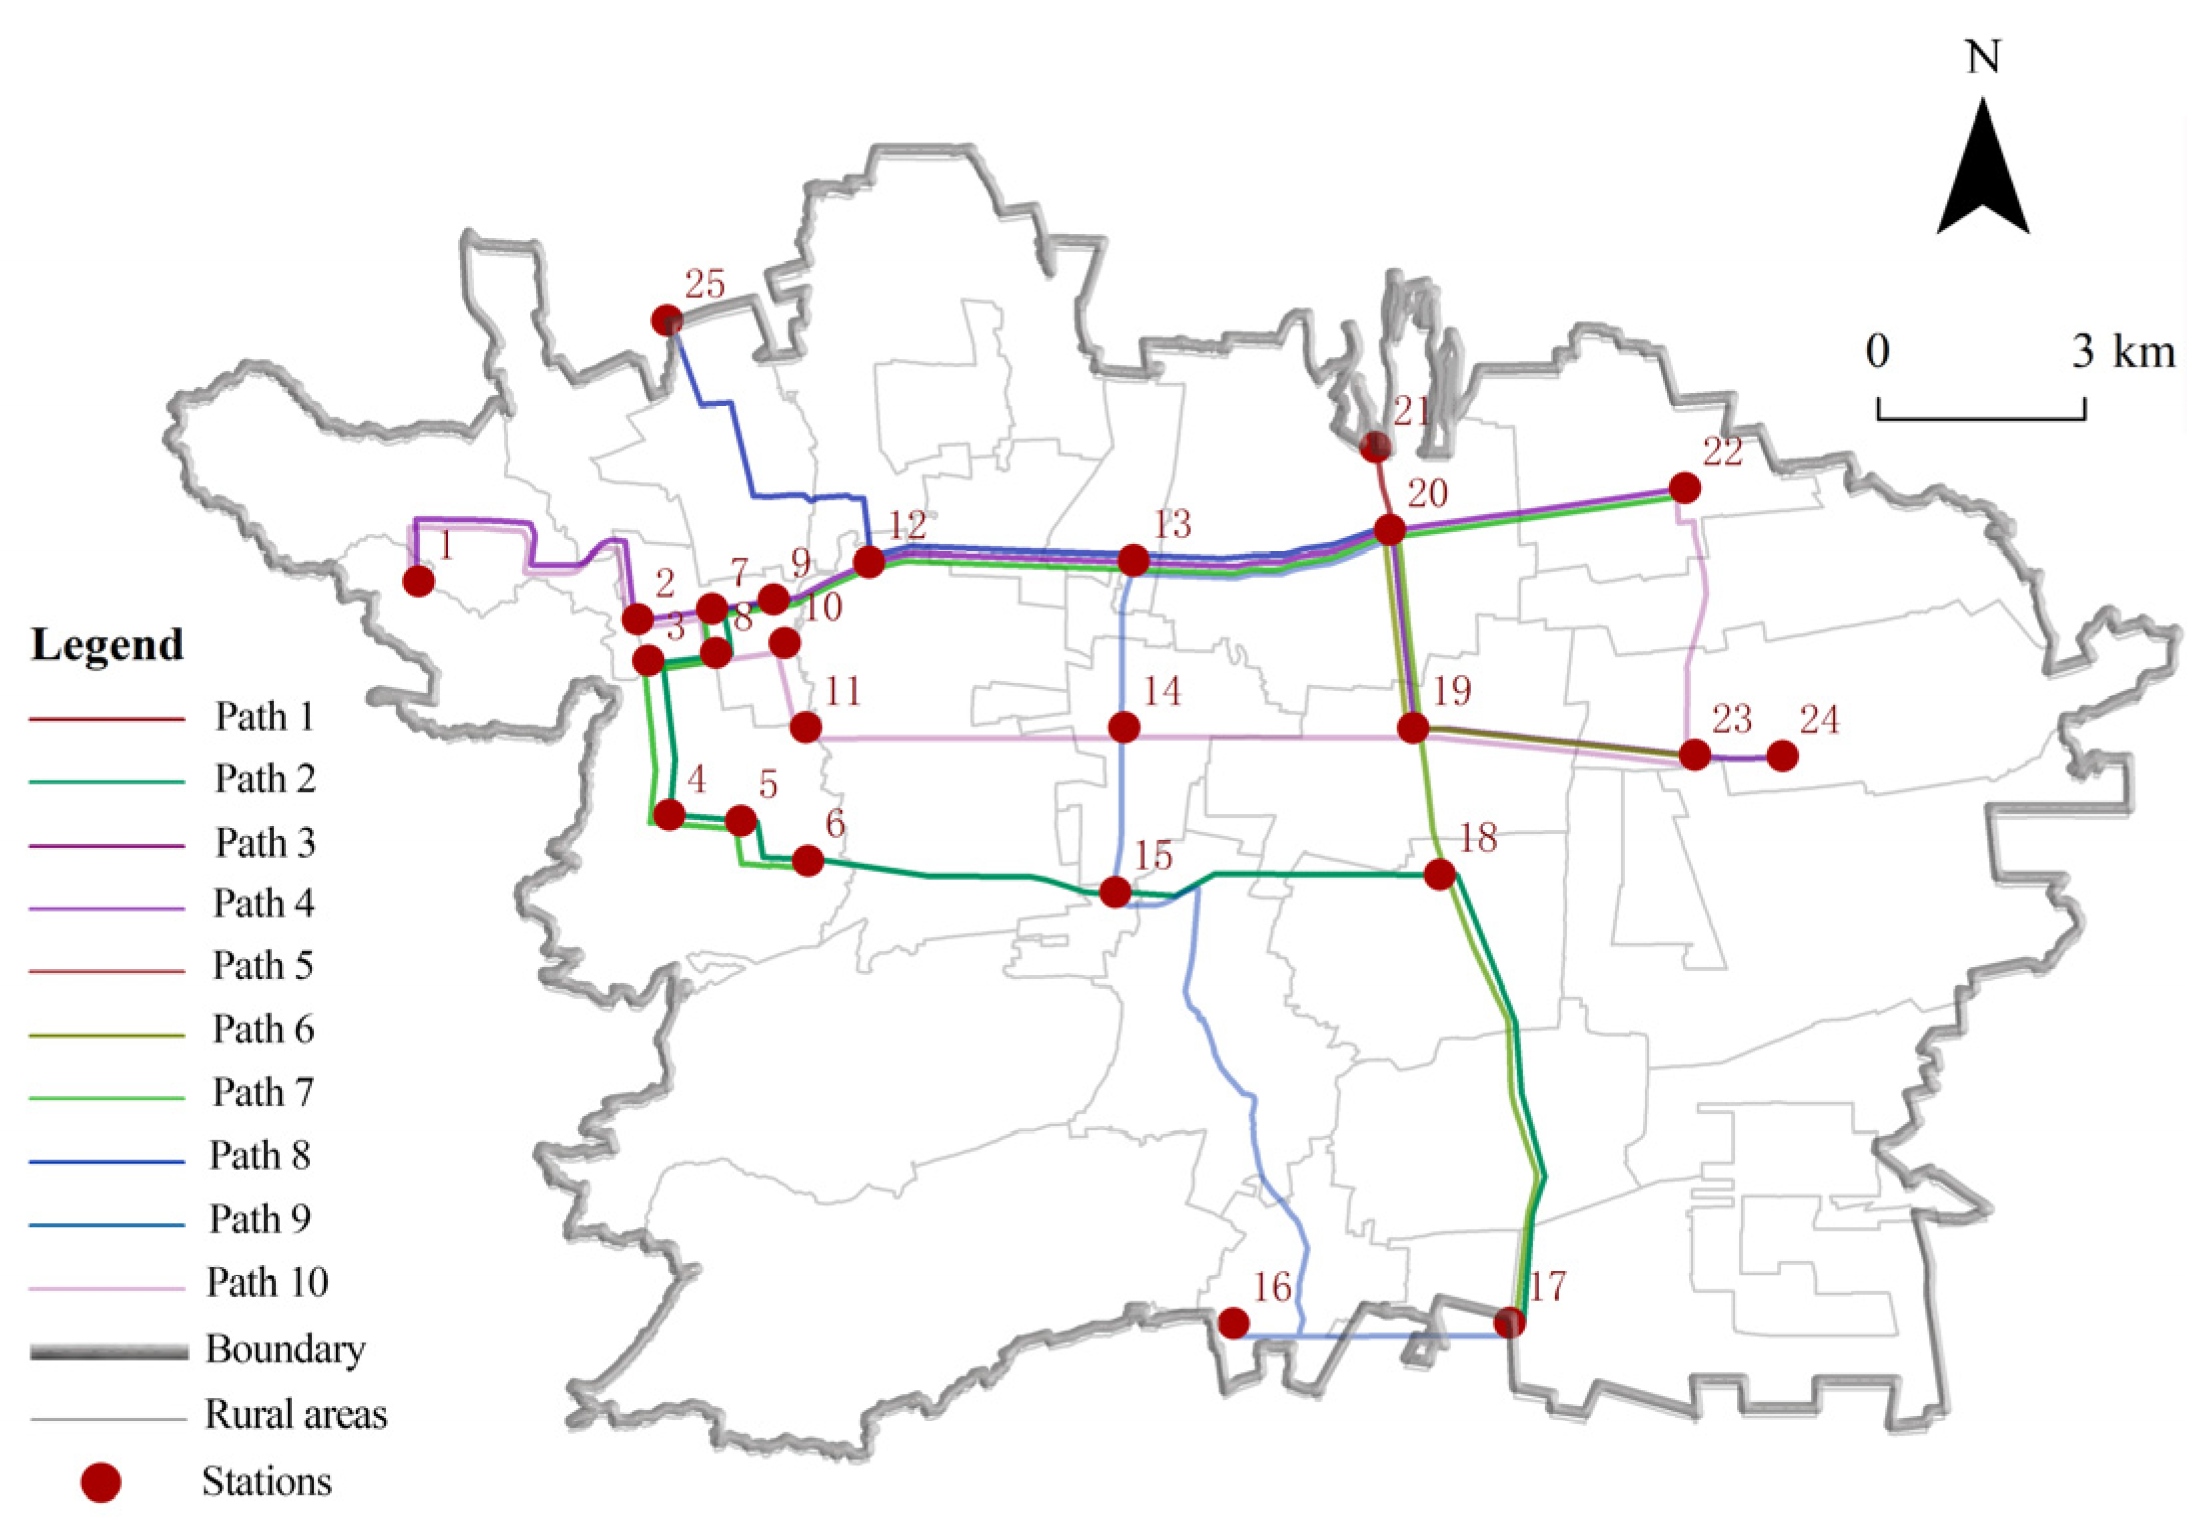
50,
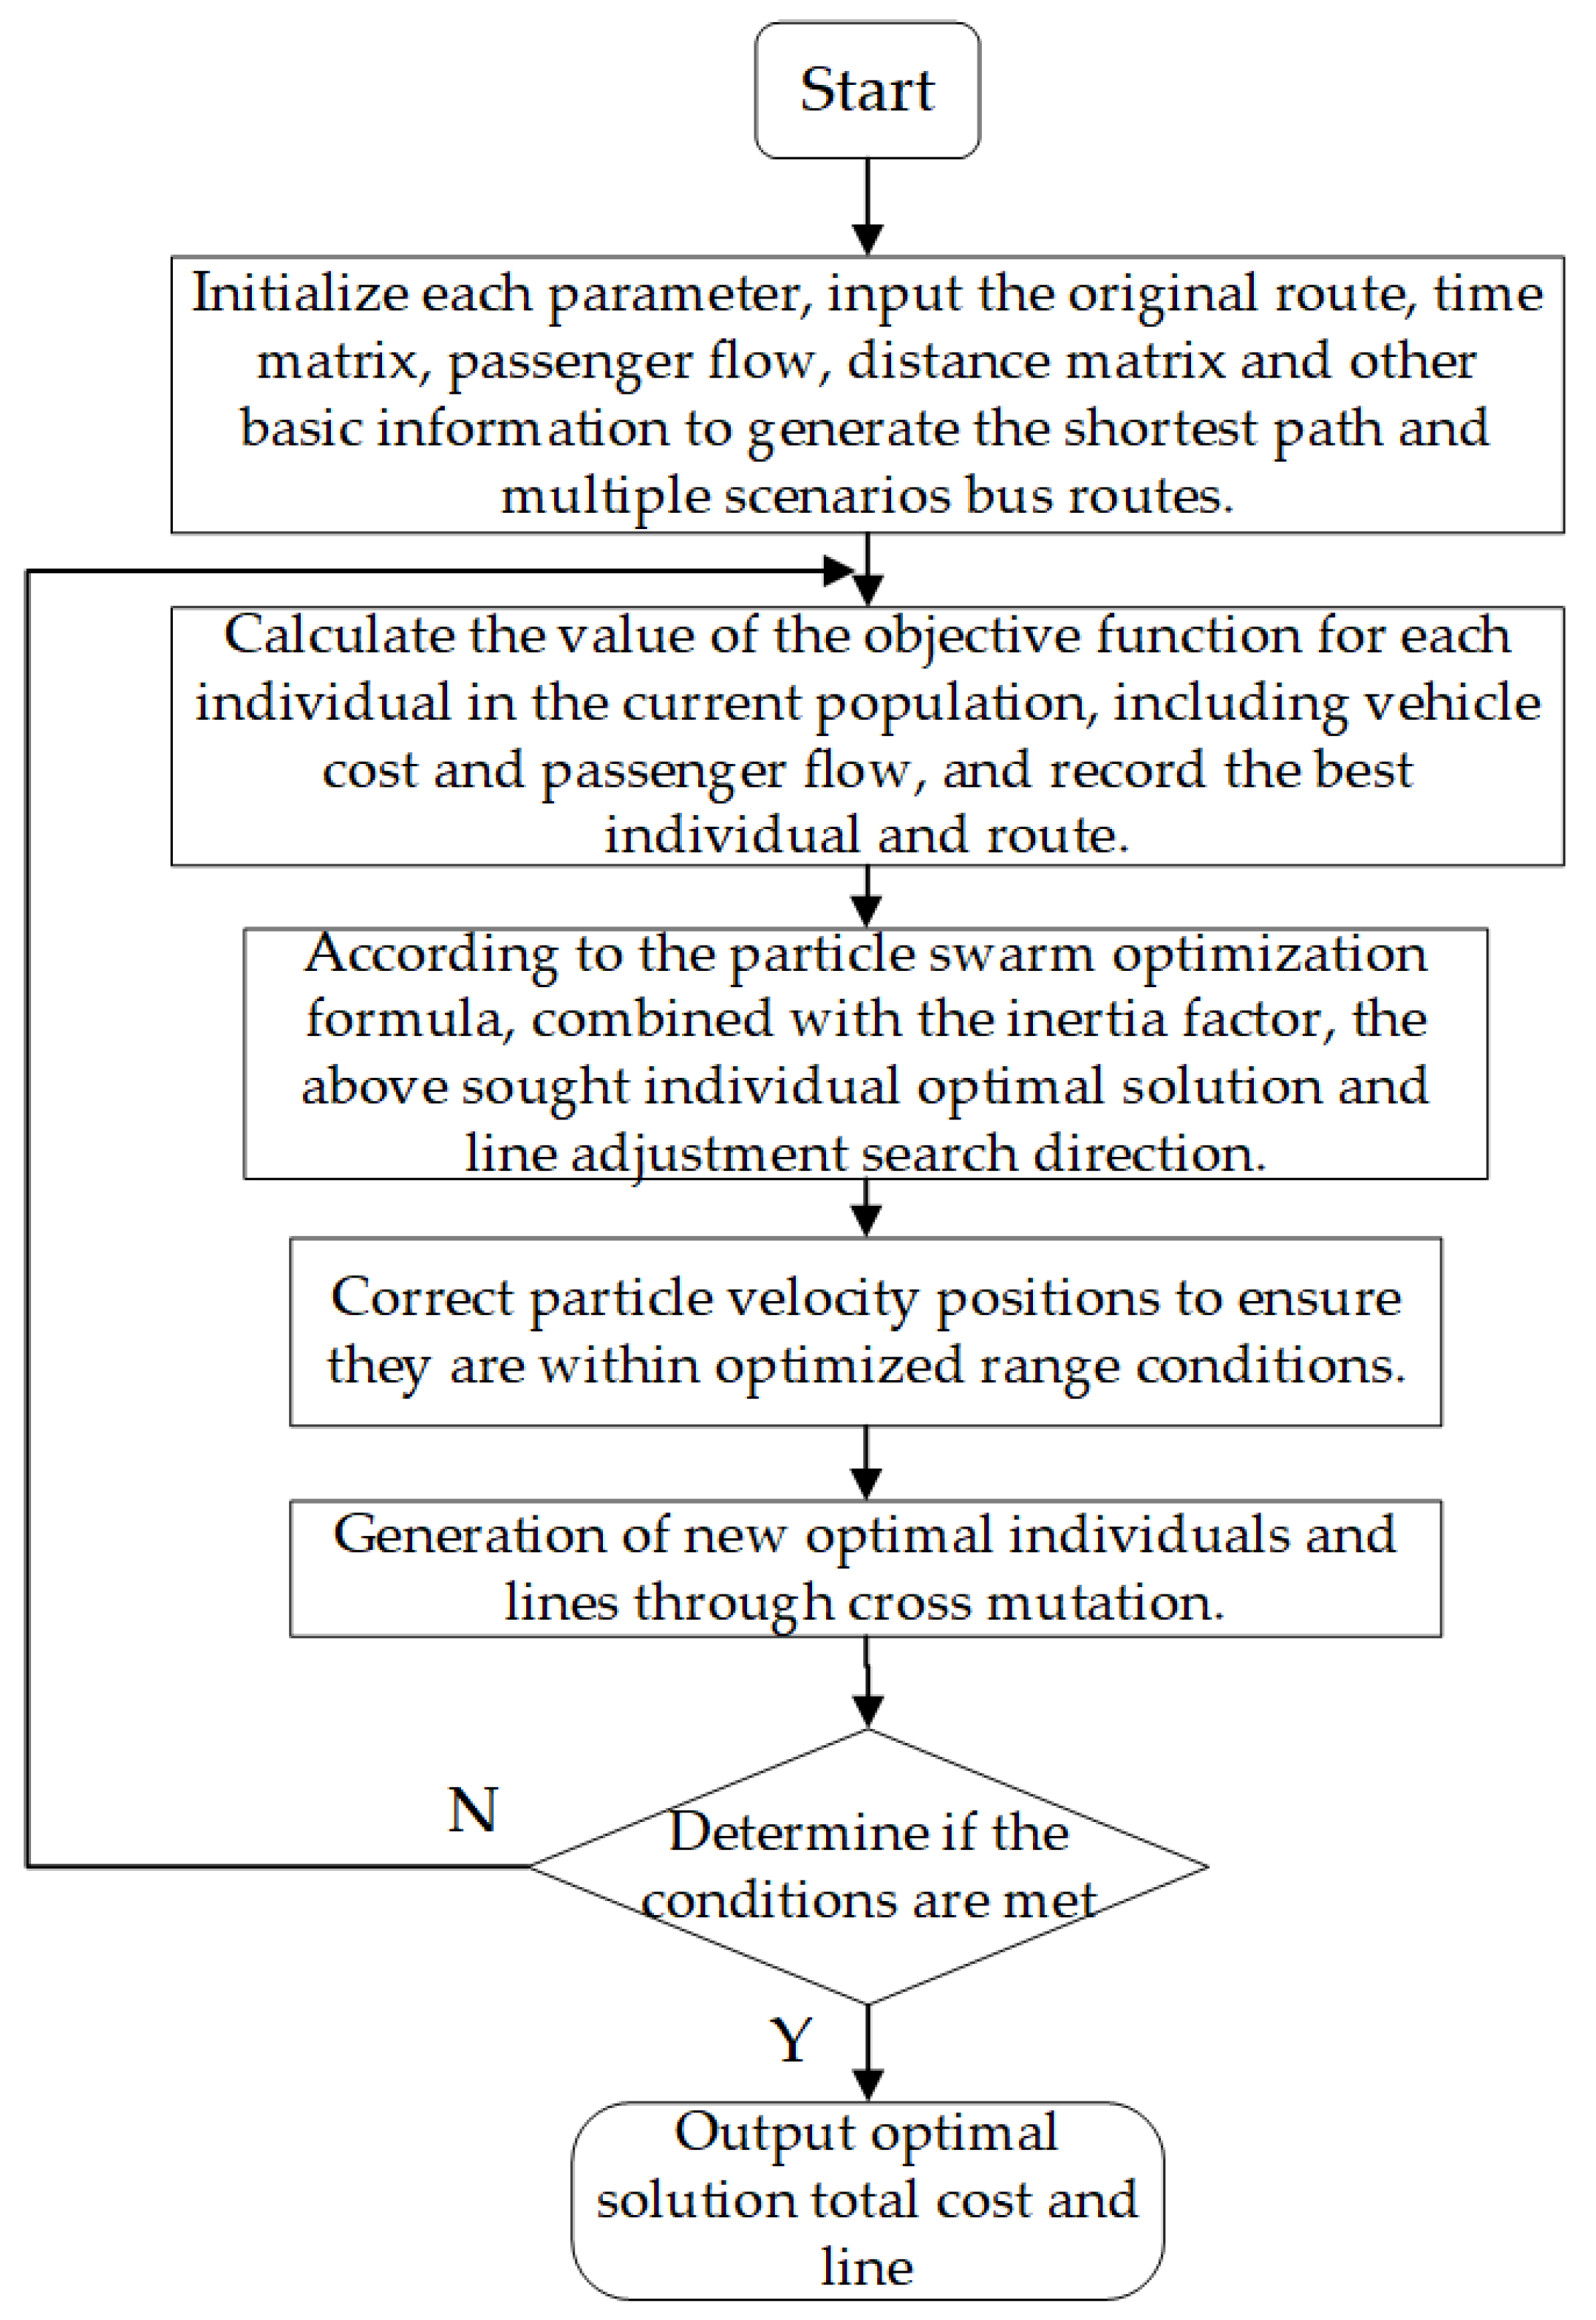
51], the two-layer model avoided the trap of a “zero-sum game” through Pareto improvement and confirmed the necessity of impulse service for low-density road networks in the case of Qinchuan Town, which guaranteed the coverage of basic service at the expense of operational efficiency. Basic service coverage was guaranteed at the expense of operational efficiency. At the practical level, the innovative data enhancement method broke through the traditional gravity model constraints through the spatial weight correction factor, which provided a new paradigm for rural transportation data modeling; at the algorithmic level, the dynamic inertia factor mechanism reduced the number of convergence iterations to 64, which improved the efficiency of the standard genetic algorithm [
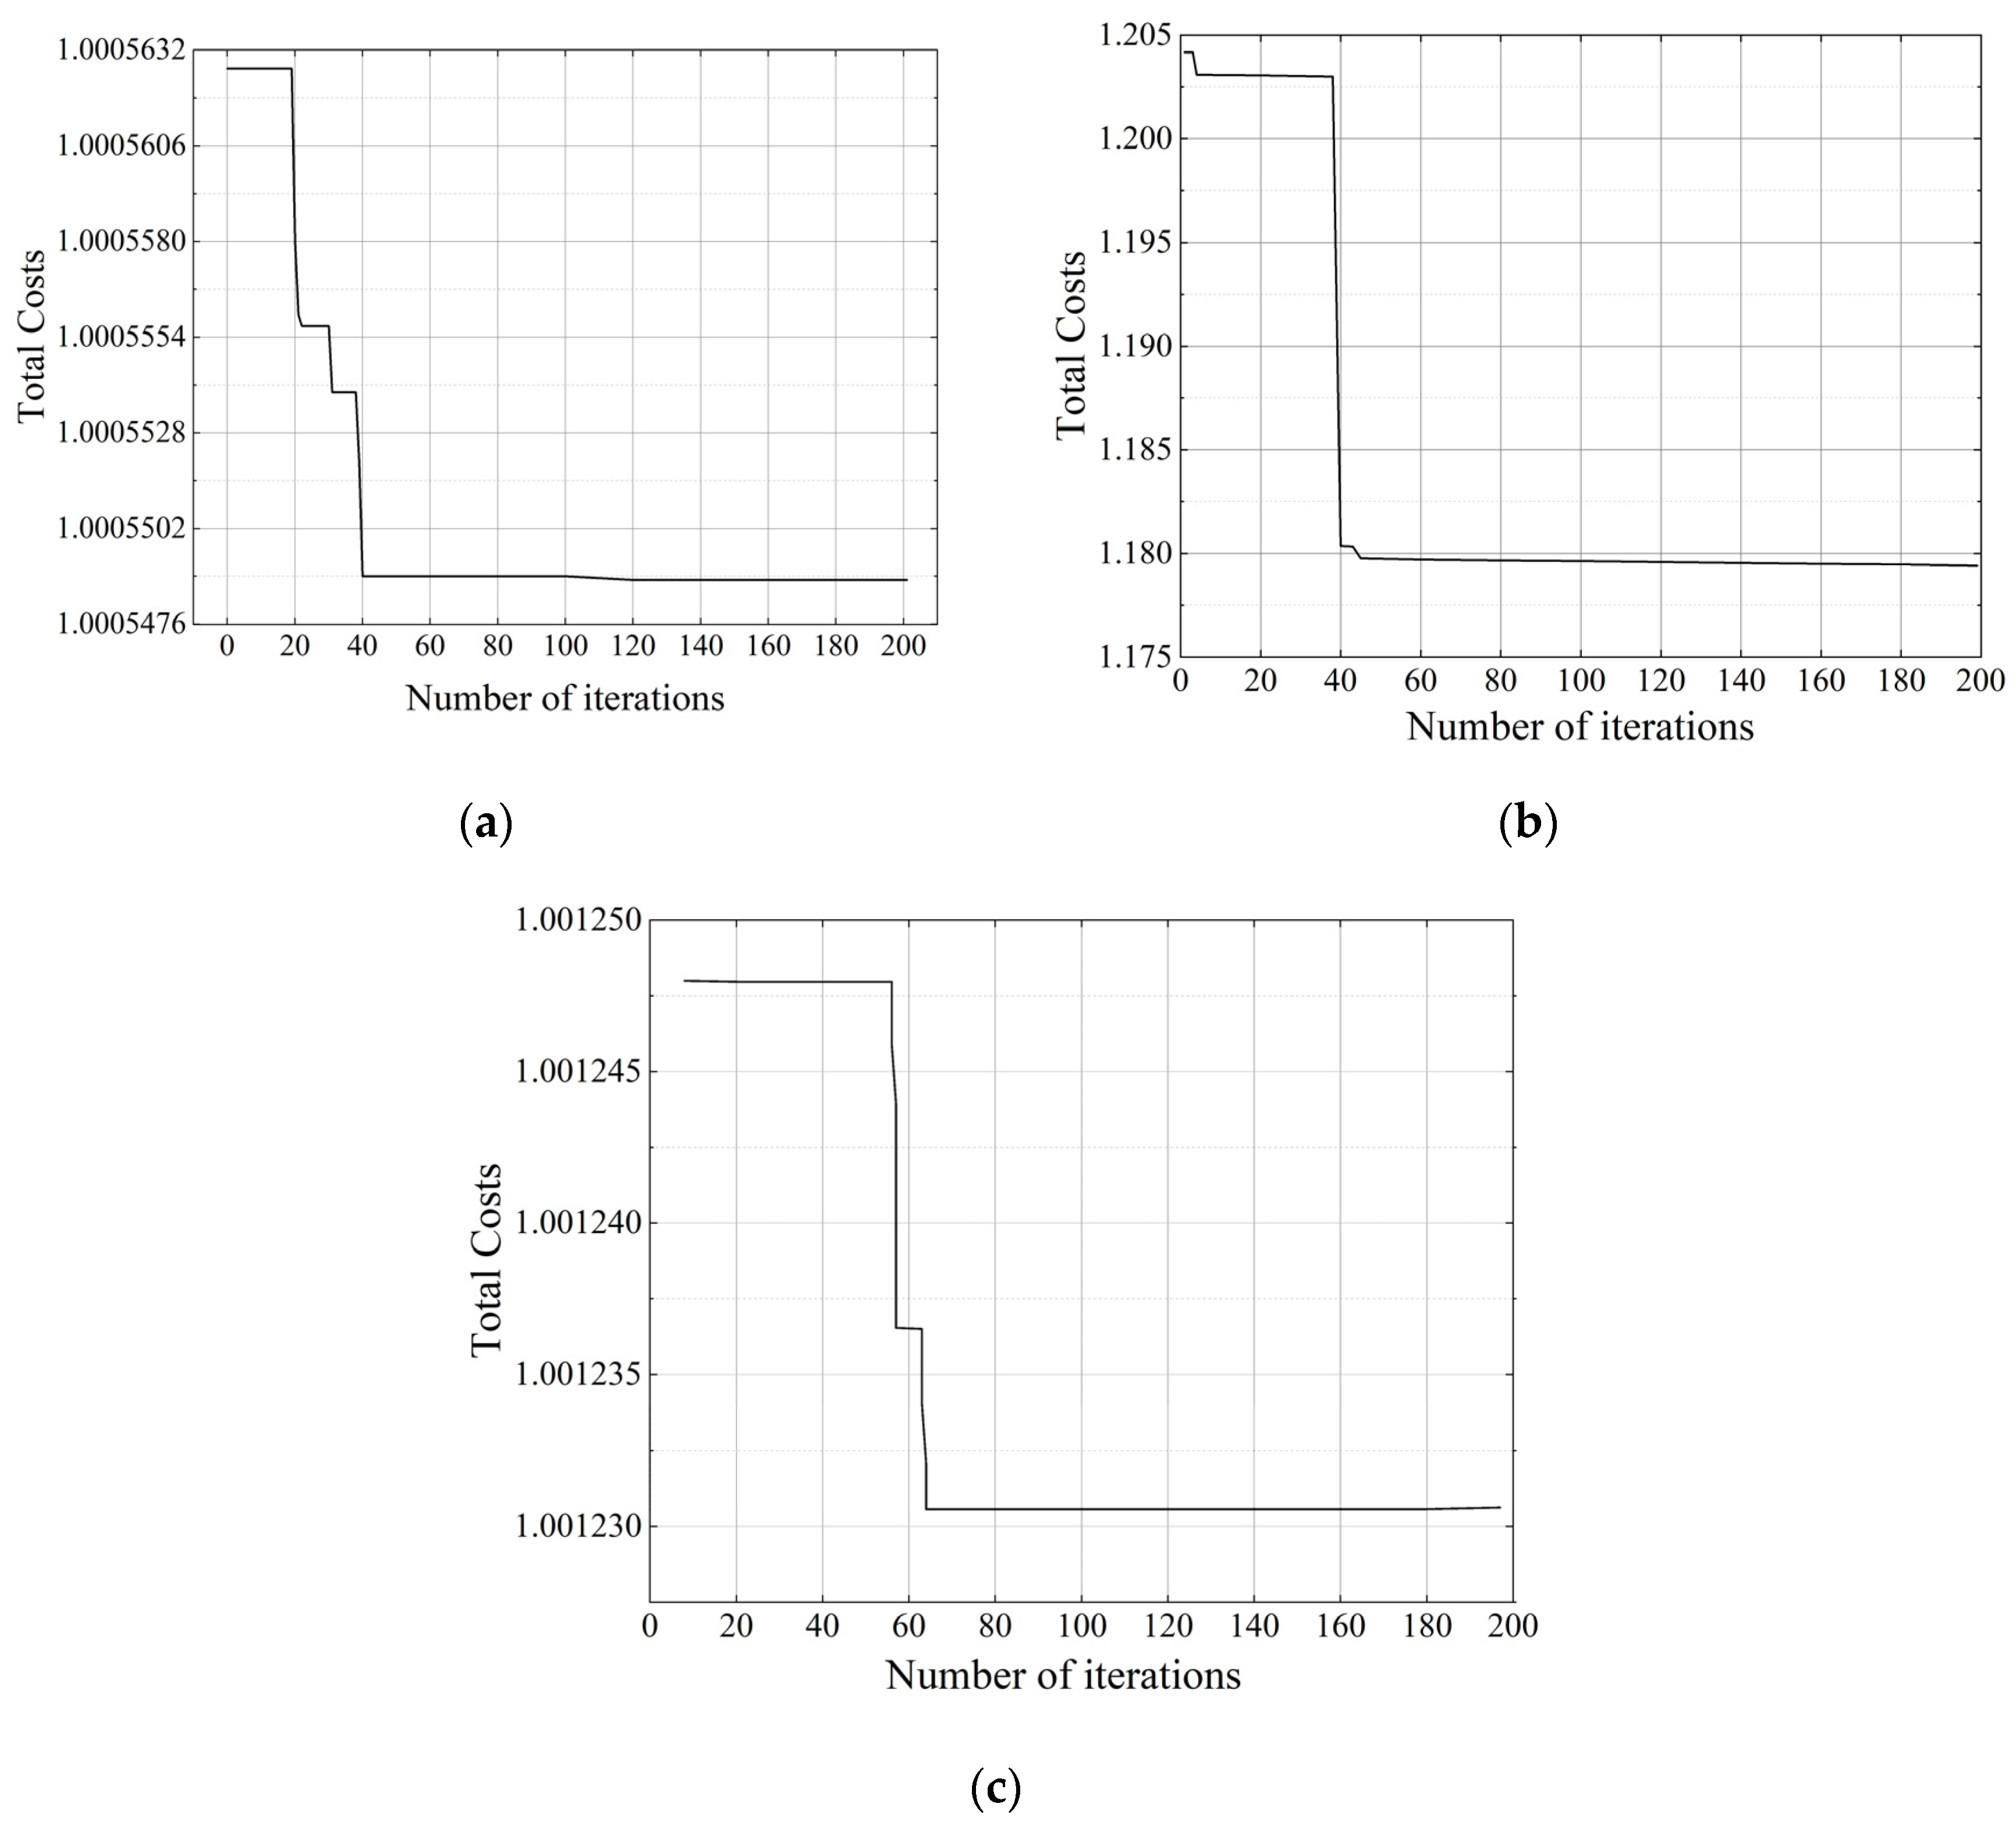
52]. The multidimensional fairness assessment system constructed through the Gini coefficient compensated for the blind spot of the traditional indicators for the imbalance in the allocation of resources.
However, the study still had three limitations. First, the static OD data and peak assumptions did not cover dynamic passenger flow characteristics, such as seasonal population migration, which may weaken the route flexibility. Second, the “Spatial Enhancement Method Based on Travel Behavioral Characteristics” adopted in this study solved the problem of model failure due to small original data flow by amplifying the original sparse OD data. However, it did not consider the dynamic change in travel and the competition of external traffic, and the generated data only represented an average state and could not predict unexpected events. Third, the model simplified the impact of policy variables, such as government subsidies on fares, which led to the deviation of the cost-sharing mechanism from reality. The generalization of the findings from a single suburban case to high-density villages or mountainous areas needs further validation. Future research can make breakthroughs in three aspects: constructing a responsive scheduling system [52] by integrating real-time GPS data to dynamically optimize route resources; exploring the feeder network of buses with shared bicycles and micro-circulation buses to make up for the coverage blindness with multi-modal transportation; and establishing a policy-sensitive analysis framework to quantify the marginal impacts of variables, such as financial subsidies, on the optimization results to provide decision-making support for collaborative governance between government and enterprises.
To achieve a fairer and more efficient urban and rural transportation system, the transportation department should give priority to adopting a multi-objective planning framework, which needs to clearly integrate fairness indicators and operational efficiency goals. The two-layer optimization model constructed in this study proved that it is feasible to achieve Pareto improvement through such a framework, transcending the traditional zero-sum trade-off dilemma. Thus, it provides solid decision support for the government–enterprise collaborative governance model necessary for sustainable rural transportation development.

5. Conclusions

The relative deprivation coefficient of travel cost describes the impact of the difference in the broad travel cost of different groups on transportation equity. In contrast, the Gini coefficient of road area reflects the equilibrium of the distribution of transportation resources among different groups. This paper established a two-layer optimization model of public transportation networks under the constraints of transportation equity. It explored the relationship between the optimization of public transportation networks and the travel opportunities of different groups. The upper-layer optimization was based on minimizing the relative deprivation coefficient of travel cost and the Gini coefficient of road area. In contrast, the lower-layer optimization was based on the objective of minimizing the relative deprivation coefficient of travel cost and the Gini coefficient of road area, optimized as a multi-modal, multi-user stochastic equilibrium traffic allocation model. The complex choice behaviors of different groups of people for different travel modes were further analyzed.
On the one hand, example analysis showed that the public transportation network model considered the constraints of traffic equity. The difference in travel costs between different groups showed a trend of narrowing, and the road resources were distributed more equitably. Along with the increase in the public transportation sharing rate, the strategy guided the traveling groups to choose more public transportation, and on the other hand, it reduced the opportunity of the high-income groups to choose the private car.

Author Contributions

Conception, M.Y. and L.W.; data organization, L.W.; formal analysis, M.Y. and Y.Q.; funding acquisition, Y.Q.; methodology, L.W.; project management, Y.Q.; software, L.W.; supervision, M.Y.; verification, X.L.; writing—original manuscript, L.W. All authors have read and agreed to the published version of the manuscript.

Funding

This research was funded by the Natural Science Foundation of the Gansu Province (23JRRA904), the Social Science Foundation of Gansu (2021YB058), the Gansu Provincial Department of Science and Technology: Natural Science Foundation (Outstanding Doctoral Students) Project (23JRRA906), the National Social Science Foundation of China (15BJY037; 14CJY052), “Double-First Class” Major Research Programs, Educational Department of Gansu Province (GSSYLXM-04), the Gansu Province Key R&D Program Industry (21YF5GA052), the Gansu Higher Educational Institutions Industry Support Program (2021CYZC-60), Lanzhou Jiaotong University–Tianjin University Joint Innovation Fund project (2021057), the 2025 Gansu Provincial Department of Education Excellent Graduate Students “Innovation Star” Program (2025CXZX-645), the National Natural Science Foundation of China Western Program (72361017; 52362047; 71861024), and the Gansu Provincial Natural Science Foundation Program (18JR3RA119; 23JRRA904).

Institutional Review Board Statement

Not applicable.

Informed Consent Statement

Not applicable.

Data Availability Statement

The data presented in this study are available upon request from the corresponding author.

Conflicts of Interest

The authors declare no conflicts of interest.

References

  1. Sharav, N.; Givoni, M.; Shiftan, Y. What transit service does the periphery need? A case study of Israel’s rural country. Transp. Res. Part A Policy Pract. 2019, 125, 320–333. [Google Scholar] [CrossRef]
  2. Petersen, T. Watching the Swiss: A Network Approach to Rural and Exurban Public Transport. Transp. Policy 2016, 52, 175–185. [Google Scholar] [CrossRef]
  3. Du, M.; Zhao, Y.; Fang, T.; Fan, L.; Zhang, M.; Huang, H.; Mei, K. Evaluating the Inequality of Medical Resource Allocation Based on Spatial and Non-Spatial Accessibility: A Case Study of Wenzhou, China. Sustainability 2022, 14, 8331. [Google Scholar] [CrossRef]
  4. Hu, W.; Li, L.; Su, M. Spatial Inequity of Multi-Level Healthcare Services in a Rapid Expanding Immigrant City of China: A Case Study of Shenzhen. Int. J. Environ. Res. Public Health 2019, 16, 3441. [Google Scholar] [CrossRef]
  5. Orrego-Oñate, J.; Marquet, O. The Role of Perceived and Objective Accessibility in Shaping Walking Behavior: Insights from Mid-Sized Spanish Cities. Transp. Res. Part A-Policy Pract. 2025, 192, 104340. [Google Scholar] [CrossRef]
  6. Morrissey, J.; Schwaller, E.; Dickson, D.; Axon, S. Affordability, Security, Sustainability? Grassroots Community Energy Visions from Liverpool, United Kingdom. Energy Res. Soc. Sci. 2020, 70, 101698. [Google Scholar] [CrossRef]
  7. Farrington, J.; Farrington, C. Rural Accessibility, Social Inclusion and Social Justice: Towards Conceptualisation. J. Transp. Geogr. 2005, 13, 1–12. [Google Scholar] [CrossRef]
  8. Hansen, W.G. How Accessibility Shapes Land-Use. J. Am. Inst. Plan. 1959, 25, 73–76. [Google Scholar] [CrossRef]
  9. Allen, J.; Farber, S. Planning Transport for Social Inclusion: An Accessibility-Activity Participation Approach. Transp. Res. Part D Transp. Environ. 2020, 78, 102212. [Google Scholar] [CrossRef]
  10. Karner, A. Planning for Transportation Equity in Small Regions: Towards Meaningful Performance Assessment. Transp. Policy 2016, 52, 46–54. [Google Scholar] [CrossRef]
  11. Martens, K.; Golub, A. A Fair Distribution of Accessibility: Interpreting Civil Rights Regulations for Regional Transportation Plans. J. Plan. Educ. Res. 2021, 41, 425–444. [Google Scholar] [CrossRef]
  12. Guzman, L.A.; Oviedo, D.; Arellana, J.; Cantillo-García, V. Buying a Car and the Street: Transport Justice and Urban Space Distribution. Transp. Res. Part D Transp. Environ. 2021, 95, 102860. [Google Scholar] [CrossRef]
  13. Karner, A.; London, J.; Rowangould, D.; Manaugh, K. From Transportation Equity to Transportation Justice: Within, Through, and Beyond the State. J. Plan. Lit. 2020, 35, 440–459. [Google Scholar] [CrossRef]
  14. Caggiani, L.; Camporeale, R.; Binetti, M.; Ottomanelli, M. A Road Network Design Model Considering Horizontal and Vertical Equity: Evidences from an Empirical Study. Case Stud. Transp. Policy 2017, 5, 392–399. [Google Scholar] [CrossRef]
  15. Ballantyne, P.; Filomena, G.; Rowe, F.; Singleton, A. Developing Two-Dimensional Indicators of Transport Demand and Supply to Promote Sustainable Transportation Equity. Comput. Environ. Urban Syst. 2024, 113, 102179. [Google Scholar] [CrossRef]
  16. Palm, M.; Farber, S.; Shalaby, A.; Young, M. Equity Analysis and New Mobility Technologies: Toward Meaningful Interventions. J. Plan. Lit. 2021, 36, 31–45. [Google Scholar] [CrossRef]
  17. Chen, J.; Chen, J.; Miao, Y.; Song, M.; Fan, Y. Unbalanced development of inter-provincial high-grade highway in China: Decomposing the Gini coefficient. Transp. Res. Part D Transp. Environ. 2016, 48, 499–510. [Google Scholar] [CrossRef]
  18. Chan, H.Y.; Xu, Y.; Chen, A.; Zhou, J. Choice and Equity: A Critical Analysis of Multi-Modal Public Transport Services. Transp. Policy 2023, 140, 114–127. [Google Scholar] [CrossRef]
  19. Boarnet, M.G.; Giuliano, G.; Hou, Y.; Shin, E.J. First/Last Mile Transit Access As an Equity Planning Issue. Transp. Res. Part A-Policy Pract. 2017, 103, 296–310. [Google Scholar] [CrossRef]
  20. Martens, K.; Di Ciommo, F. Travel Time Savings, Accessibility Gains and Equity Effects in Cost–benefit Analysis. Transp. Rev. 2017, 37, 152–169. [Google Scholar] [CrossRef]
  21. Sohn, K.; Yun, J. Separation of Car-Dependent Commuters from Normal-Choice Riders in Mode-Choice Analysis. Transportation 2009, 36, 423–436. [Google Scholar] [CrossRef]
  22. Gelhausen, M.C.; Wilken, D. Airport and Access Mode Choice : A Generalized Nested Logit Model Approach. In Proceedings of the 10th Air Transport Research Society World Conference, Nagoya, Japan, 26–28 May 2006. [Google Scholar]
  23. Liu, L.Q.; Zhang, Y. Research of Urban Bus Stop Planning Based on Optimization Theory. In Proceedings of the 2009 International Conference on Measuring Technology and Mechatronics Automation, Zhangjiajie, China, 11–12 April 2009. [Google Scholar]
  24. Kumar, A.; Peeta, S. A Post-processing Technique for the Four-step Travel Demand Modeling Executed Through a Feedback Loop. Procedia Soc. Behav. Sci. 2013, 104, 611–620. [Google Scholar] [CrossRef]
  25. Tom, V.M.; Mohan, S. Transit Route Network Design Using Frequency Coded Genetic Algorithm. J. Transp. Eng. 2003, 129, 186–195. [Google Scholar] [CrossRef]
  26. Kechagiopoulos, P.N.; Beligiannis, G.N. Solving the Urban Transit Routing Problem Using a Particle Swarm Optimization Based Algorithm. Appl. Soft Comput. 2014, 21, 654–676. [Google Scholar] [CrossRef]
  27. Bhattarai, S.; Golias, M.M.; Mishra, S.; Talebian, A. Multidimensional Resource Allocation for Freight Transportation Project Planning and Decision Making. Transp. Res. Part A Policy Pract. 2020, 137, 95–110. [Google Scholar] [CrossRef]
  28. Churchill, A.M.; Lovell, D.J. Coordinated Aviation Network Resource Allocation under Uncertainty. Procedia Soc. Behav. Sci. 2011, 17, 572–590. [Google Scholar] [CrossRef]
  29. Wang, J.Y.; Yang, H.; Lindsey, R. Locating and Pricing Park-And-Ride Facilities in A Linear Monocentric City with Deterministic Mode Choice. Transp. Res. Part B Methodol. 2004, 38, 709–731. [Google Scholar] [CrossRef]
  30. Chen, X.; Liu, Z.; Hua, D.; Kim, I. A New Model for Rail-Based Park-and-ride with Feeder Bus Services. Transp. Res. Procedia 2017, 21, 79–86. [Google Scholar] [CrossRef]
  31. Wang, J.; Wang, H.; Zhang, X. A Hybrid Management Scheme with Parking Pricing and Parking Permit for a Many-to-one Park and Ride Network. Transp. Res. Part C Emerg. Technol. 2020, 112, 153–179. [Google Scholar] [CrossRef]
  32. Lin, H.; Tang, C. Analysis and Optimization of Urban Public Transport Lines Based on Multiobjective Adaptive Particle Swarm Optimization. IEEE Trans. Intell. Transp. Syst. 2022, 23, 16786–16798. [Google Scholar] [CrossRef]
  33. Ma, H.; Yang, M.; Li, X. Integrated Optimization of Customized Bus Routes and Timetables with Consideration of Holding Control. Comput. Ind. Eng. 2023, 175, 108886. [Google Scholar] [CrossRef]
  34. Zhou, M.; Dong, H.; Zhao, Y.; Ioannou, P.A.; Wang, F.Y. Optimization of Crowd Evacuation with Leaders in Urban Rail Transit Stations. IEEE Trans. Intell. Transp. Syst. 2019, 20, 4476–4487. [Google Scholar] [CrossRef]
  35. Liu, Y.; Cheng, T. Understanding Public Transit Patterns with Open Geodemographics to Facilitate Public Transport Planning. Transp. A-Transp. Sci. 2020, 16, 76–103. [Google Scholar] [CrossRef]
  36. Wood, D.; Stasko, T.; Tarte, L.; Jefferson, D.; Reddy, A. A Real-Time Service Management Decision Support System for Train Dispatching at New York City Transit. In Proceedings of the Transportation Research Board 97th Annual Meeting Transportation Research Board, Washington, DC, USA, 7–11 January 2018. [Google Scholar]
  37. Hermawan, K.; Regan, A.C. Impacts on Vehicle Occupancy and Airport Curb Congestion of Transportation Network Companies at Airports. Transp. Res. Rec. 2018, 2672, 52–58. [Google Scholar] [CrossRef]
  38. Feng, X.; Ruan, Z.; Zhu, X.; Zhang, L. Multi-objective Transport Network Design with a Reversible Simulated Annealing Algorithm. Adv. Prod. Eng. Manag. 2018, 13, 479–491. [Google Scholar] [CrossRef]
  39. Sun, Q.; Chien, S.; Hu, D.; Chen, G.; Jiang, R.S. Optimizing Multi-Terminal Customized Bus Service with Mixed Fleet. IEEE Access 2020, 8, 156456–156469. [Google Scholar] [CrossRef]
  40. Ma, J.; Zhao, Y.; Yang, Y.; Liu, T.; Guan, W.; Wang, J.; Song, C. A Model for the Stop Planning and Timetables of Customized Buses. PLoS ONE 2017, 12, e168762. [Google Scholar] [CrossRef]
  41. Halimi, Z.; SafariTaherkhani, M.; Cui, Q. A Generalized Framework for Assessing Equity in Ground Transportation Infrastructure: Exploratory Study. J. Manag. Eng. 2025, 41, 04024072. [Google Scholar] [CrossRef]
  42. Heydari, M.H.; Shojaei, A.; Naderi, H.; Iorio, J. Paving the Way for Progress: A Systematic Literature Review on Diversity, Equity, and Inclusion in the AEC Industry. J. Manag. Eng. 2024, 40, 03124001. [Google Scholar] [CrossRef]
  43. Halimi, Z.; Bavafa, A.; Cui, Q. Barriers to Community Connectivity: An Assessment of Reconnecting Communities Pilot Program. In Proceedings of the International Conference on Transportation and Development, Atlanta, GA, USA, 15–18 June 2024. [Google Scholar]
  44. Caggiani, L.; Camporeale, R.; Ottomanelli, M. Facing equity in transportation Network Design Problem: A flexible constraints based model. Transp. Policy 2017, 55, 9–17. [Google Scholar] [CrossRef]
  45. Druckman, A.; Jackson, T. Measuring Resource Inequalities: The Concepts and Methodology for an Area-Based Gini Coefficient. Ecol. Econ. 2008, 65, 242–252. [Google Scholar] [CrossRef]
  46. Hörcher, D.; Graham, D.J. The Gini Index of Demand Imbalances in Public Transport. Transportation 2020, 48, 2521–2544. [Google Scholar] [CrossRef]
  47. Sohn, K.; Kim, D. Zonal centrality measures and the neighborhood effect. Transp. Res. Part A Policy Pract. 2010, 44, 733–743. [Google Scholar] [CrossRef]
  48. Caspi, O.; Noland, R.B. Bikesharing in Philadelphia: Do Lower-Income Areas Generate Trips? Travel Behav. Soc. 2019, 16, 143–152. [Google Scholar] [CrossRef]
  49. Deb, K.; Pratap, A.; Agarwal, S.; Meyarivan, T.A.M.T. A fast and elitist multiobjective genetic algorithm: NSGA-II. IEEE Trans. Evol. Comput. 2002, 6, 182–197. [Google Scholar] [CrossRef]
  50. Murray, A.T.; Davis, R. Equity in Regional Service Provision. J. Reg. Sci. 2001, 41, 557–600. [Google Scholar] [CrossRef]
  51. Wang, X.; Song, J.; Wu, Q.; Bao, Y.; Wang, Y. A Novel Bi-Level Programming Model for Structure Sustainability Optimization of Passenger Transport Corridor. PLoS ONE 2022, 17, e266013. [Google Scholar] [CrossRef] [PubMed]
  52. Li, J. Application of Spatial-Temporal Behavioral Trajectory Analysis in the Space Design of Digital Villages. Wirel. Commun. Mob. Comput. 2022, 2022, 2304820. [Google Scholar] [CrossRef]
Figure 1. Particle swarm genetic algorithm flowchart.
Sustainability 17 05679 g001
Figure 2. The Logit model solving the algorithm.
Sustainability 17 05679 g002
Figure 3. Qinchuan Township bus stops distribution and route map.
Sustainability 17 05679 g003
Figure 4. Actual network diagram.
Sustainability 17 05679 g004
Figure 5. Network topology diagram.
Sustainability 17 05679 g005
Figure 6. Map of the bus network.
Sustainability 17 05679 g006
Figure 7. Diagram of the convergence process of iterative evolution. (a) Considering only bus company costs; (b) consideration of passenger costs; (c) integrated.
Sustainability 17 05679 g007
Figure 8. Path optimization diagram after considering only company costs.
Sustainability 17 05679 g008
Figure 9. Optimization diagram for the passenger cost path only.
Sustainability 17 05679 g009
Figure 10. Optimization map of the integrated consideration path.
Sustainability 17 05679 g010
Figure 11. Lorentz curve diagram.
Sustainability 17 05679 g011
Table 1. Time and distance between OD sections.
Road SectionTime (min)Distance (m)Road SectionTime (min)Distance (m)
2-72.439878.0557-81.785642.566
7-92.104757.4758-56.8312459.096
9-123.4221231.9819-101.837661.479
12-138.6783124.19410-68.8733194.729
13-208.5913092.61312-118.8213139.699
3-82.259813.36311-1516.3045869.841
8-102.273818.30213-146.8302458.725
10-113.4621246.23914-1816.4235912.256
11-1410.3653731.54220-198.0242888.493
14-199.4073386.64219-1724.6028856.462
4-52.337841.2431-214.5925253.024
5-63.4371237.32925-1214.8035329.003
6-1510.1463652.58121-203.4531243.195
15-1810.7433867.36220-229.7403506.515
18-1718.5926693.03222-2311.3154073.258
2-31.698611.11619-239.2183318.401
3-46.7322423.65423-242.8951042.057
Table 2. Nodal passenger flow.
NodePassenger TrafficNodePassenger TrafficNodePassenger Traffic
136101461968
2146113620484
3146125021484
436133822144
53614722362
63615542438
71461636256
814617152
91461832
Table 3. OD road trail flow allocation.
Bus RouteTransportation Network PathCost (CNY)Cost (CNY)
701 Route20-22-23-24420
702 Road1-2-4-8-10-11-14-19-23-22530
703 Road20-22-23-24530
704 Road20-21360
706 Road20-19-235180
707 Road25-12-13-205330
708 Road20-13-14-15-16-17560
709 Road20-13-14-11-6560
711 Road9-7-2-3-4-5-6-15-16-17560
712 Road22-20-13-12-9-7-8-5-64360
New District 13 Road20-22-23-24260
New District 209-7-2-3-4-2-6-15-18-172240
Table 4. Equilibrium allocation of OD flows considering firm costs.
Optimized RoutesTransportation Network PathsCost (yuan)Time Intervals
Path 120-19-23-24420
Path 29-7-8-3-4-5-6-15-18-17560
Path 320-19-18-17530
Path 41-2-7-9-12-13-20-22560
Path 520-21360
Path 620-19-235180
Path 722-20-13-12-9-7-8-3-4-5-64360
Path 825-12-13-205330
Path 920-13-4-15-16-17560
Path 101-2-7-8-10-11-14-19-23-22530
Table 5. Equilibrium allocation of OD traffic considering passenger costs.
Optimized RoutesTransportation Network PathsCost (yuan)Time Intervals
Path 120-19-23-24420
Path 29-10-11-14-15-16-17560
Path 320-13-14-15-16-17560
Path 41-2-7-9-12-13-20-22560
Path 520-21360
Path 620-19-235180
Path 722-20-13-14-15-16560
Path 825-12-13-205330
Path 920-19-18-17530
Path 1022-20-13-12-9-7-8-5-64360
Path 119-7-2-3-4-5-6-15-18-17560
Table 6. Combined consideration of transit company costs and passenger travel OD flow equalization allocation.
Optimized RoutesTransportation Network PathsCost (CNY)Time Intervals
Path 120-19-23-24420
Path 21-2-7-8-10-11-14-19-23-22530
Path 320-21360
Path 420-19-235180
Path 525-12-13-205330
Path 620-13-14-15-16-17560
Path 79-7-8-3-4-5-6-15-16-17560
Path 822-20-13-12-9-7-8-3-4-5-64360
Path 91-2-7-9-12-13-20-22560
Path 1020-19-18-17530
Table 7. Calculation of the Gini coefficient for network road resources.
Optimization ProgramGini Coefficient
Initial route0.48235
Considering only bus company costs0.48182
Considering only passenger costs0.54783
Combining bus company costs and passenger costs0.47851
Disclaimer/Publisher’s Note: The statements, opinions and data contained in all publications are solely those of the individual author(s) and contributor(s) and not of MDPI and/or the editor(s). MDPI and/or the editor(s) disclaim responsibility for any injury to people or property resulting from any ideas, methods, instructions or products referred to in the content.

