Article

Dynamic Analysis of a Spar-Type Floating Offshore Wind Turbine Under Extreme Operation Gust

1
Department of Naval Architecture and Ocean Engineering, College of Navigation and Naval Architecture Engineering, Dalian Ocean University, Dalian 116023, China
2
China Ship Design & Research Center Co., Ltd., Qingdao 266520, China
3
CSSC (TIANJIN) SHIPBUILDING Co., Ltd., Tianjin 300452, China
*
Author to whom correspondence should be addressed.
Sustainability 2025, 17(12), 5655; https://doi.org/10.3390/su17125655
Submission received: 21 April 2025 / Revised: 12 June 2025 / Accepted: 13 June 2025 / Published: 19 June 2025
(This article belongs to the Topic Wind, Wave and Tidal Energy Technologies in China)

Abstract

Extreme sea conditions, particularly extreme operation gusts (EOGs), present a substantial threat to structures like floating offshore wind turbines (FOWTs) due to the intense loads they exert. In this work, we simulate EOGs and analyze the dynamic response of floating wind turbines. We conduct separate analyses of the operational state under the rated wind speed, the operational state, and the shutdown state under the EOG, focusing on the motion of the floating platform and the tension of the mooring lines of the FOWT. The results of our study indicate that under the influence of EOGs, the response of the FOWT changes significantly, especially in terms of the range of response variations. After the passage of an EOG, there are notable differences in the average response of each component of the wind turbine under the shutdown strategy. When compared to normal operation during EOGs, the shutdown strategy enables the FOWT to reach the extreme response value more rapidly. Subsequently, it also recovers response stability more quickly. However, a FOWT operating under normal conditions exhibits a larger extreme response value. Regarding pitch motion, the maximum response can reach 10.52 deg, which may lead to overall instability of the structure. Implementing a stall strategy can effectively reduce the swing amplitude to 6.09 deg. Under the action of EOGs, the maximum mooring tension reaches 1376.60 kN, yet no failure or fracture occurs in the mooring system.

1. Introduction

With the continuous growth of global energy demand and the gradual depletion of traditional fossil fuel resources, the research and development of renewable energy sources have become increasingly important [1]. Renewable energy sources can not only meet future energy demands but also effectively reduce greenhouse gas emissions, which is of great significance for environmental protection [2]. In recent years, governments around the world and international organizations have formulated policies and set goals to promote the development of renewable energy [3]. In addition, renewable energy sources have economic and social benefits, as they can create a large number of job opportunities and promote energy independence [4].
Wind energy, as one of the most promising renewable energy sources, has developed rapidly in recent years [5]. Onshore wind power technology has become relatively mature, but due to limitations in land resources and environmental impacts, offshore wind power has become a new research hotspot [6]. Compared with onshore wind power, offshore wind power has advantages such as higher wind speeds, more stable wind directions, and lower noise pollution [7]. However, as offshore wind power moves into deeper waters, it faces technical challenges and high costs [8]. To address these issues, scholars have proposed structures such as floating offshore wind turbines (FOWTs). In deep sea, FOWTs can reduce construction and maintenance costs to some extent while increasing power generation efficiency compared to fixed offshore wind turbines [9].
Compared with fixed offshore wind turbines, FOWTs can be installed in deeper waters and thus have greater development potential [10]. The design of a FOWT integrates marine engineering and wind power generation technology, enabling it to operate stably in complex marine environments [11]. However, due to its complex dynamic characteristics and the influence of external environmental loads, the design and operation of a FOWT face many challenges [12]. For example, changes in waves, ocean currents, and wind speeds can significantly affect the stability of FOWTs, so it is necessary to conduct in-depth research on their dynamic response characteristics to ensure their safety and reliability [13,14,15].
An Extreme Operation Gust (EOG) is an extreme condition that wind turbines may encounter during operation [16]. This type of gust usually has high wind speeds and a short duration, which can significantly impact the structural safety and operational stability of wind turbines [17]. Research on the dynamic response under EOG conditions is of great significance for optimizing wind turbine design, improving their wind resistance, and extending their service life [18]. At present, research on EOGs mainly focuses on the establishment of wind speed models, control strategies for wind turbines, and structural analysis. Lakshmanand et al. used deep learning models for experimental and numerical gust identification [19]. Alam et al. studied the structural integrity of offshore wind turbine blades under extreme gusts and normal operating conditions [20]. Wang et al. conducted a coupled dynamic analysis of the mooring system of floating wind turbines under extreme gusts and analyzed the effects of different gust durations and gust magnitudes on the response of the FOWT system [21]. Zhang et al. studied the mooring line breakage mechanism and shutdown opportunity analysis of semi-submersible offshore wind turbines under extreme gusts [22].
To cope with extreme wind conditions, wind turbines usually adopt a shutdown strategy [23]. Different shutdown strategies have a significant impact on the dynamic response of wind turbines. For example, under EOG conditions, the angle adjustment of the blades, the control of the yaw system, and the stability of the tower are all affected by the shutdown strategy. Therefore, studying the dynamic response of FOWT under different shutdown strategies in EOG conditions is of great significance for optimizing wind turbine design and operation strategies.
In this work, under the condition of gust action, the influence of different unit control strategies on the dynamic response of floating wind turbines is innovatively considered, and the dynamic response performance of different intervals of gust action is analyzed in detail in combination with the unit control mechanism. However, there are still limitations. Due to the length limitation of the article, only the following basic motion and mooring tension are analyzed and discussed, and the impact on the performance of the upper unit is not analyzed, which will be discussed in detail.
The organization of this work is as follows. 
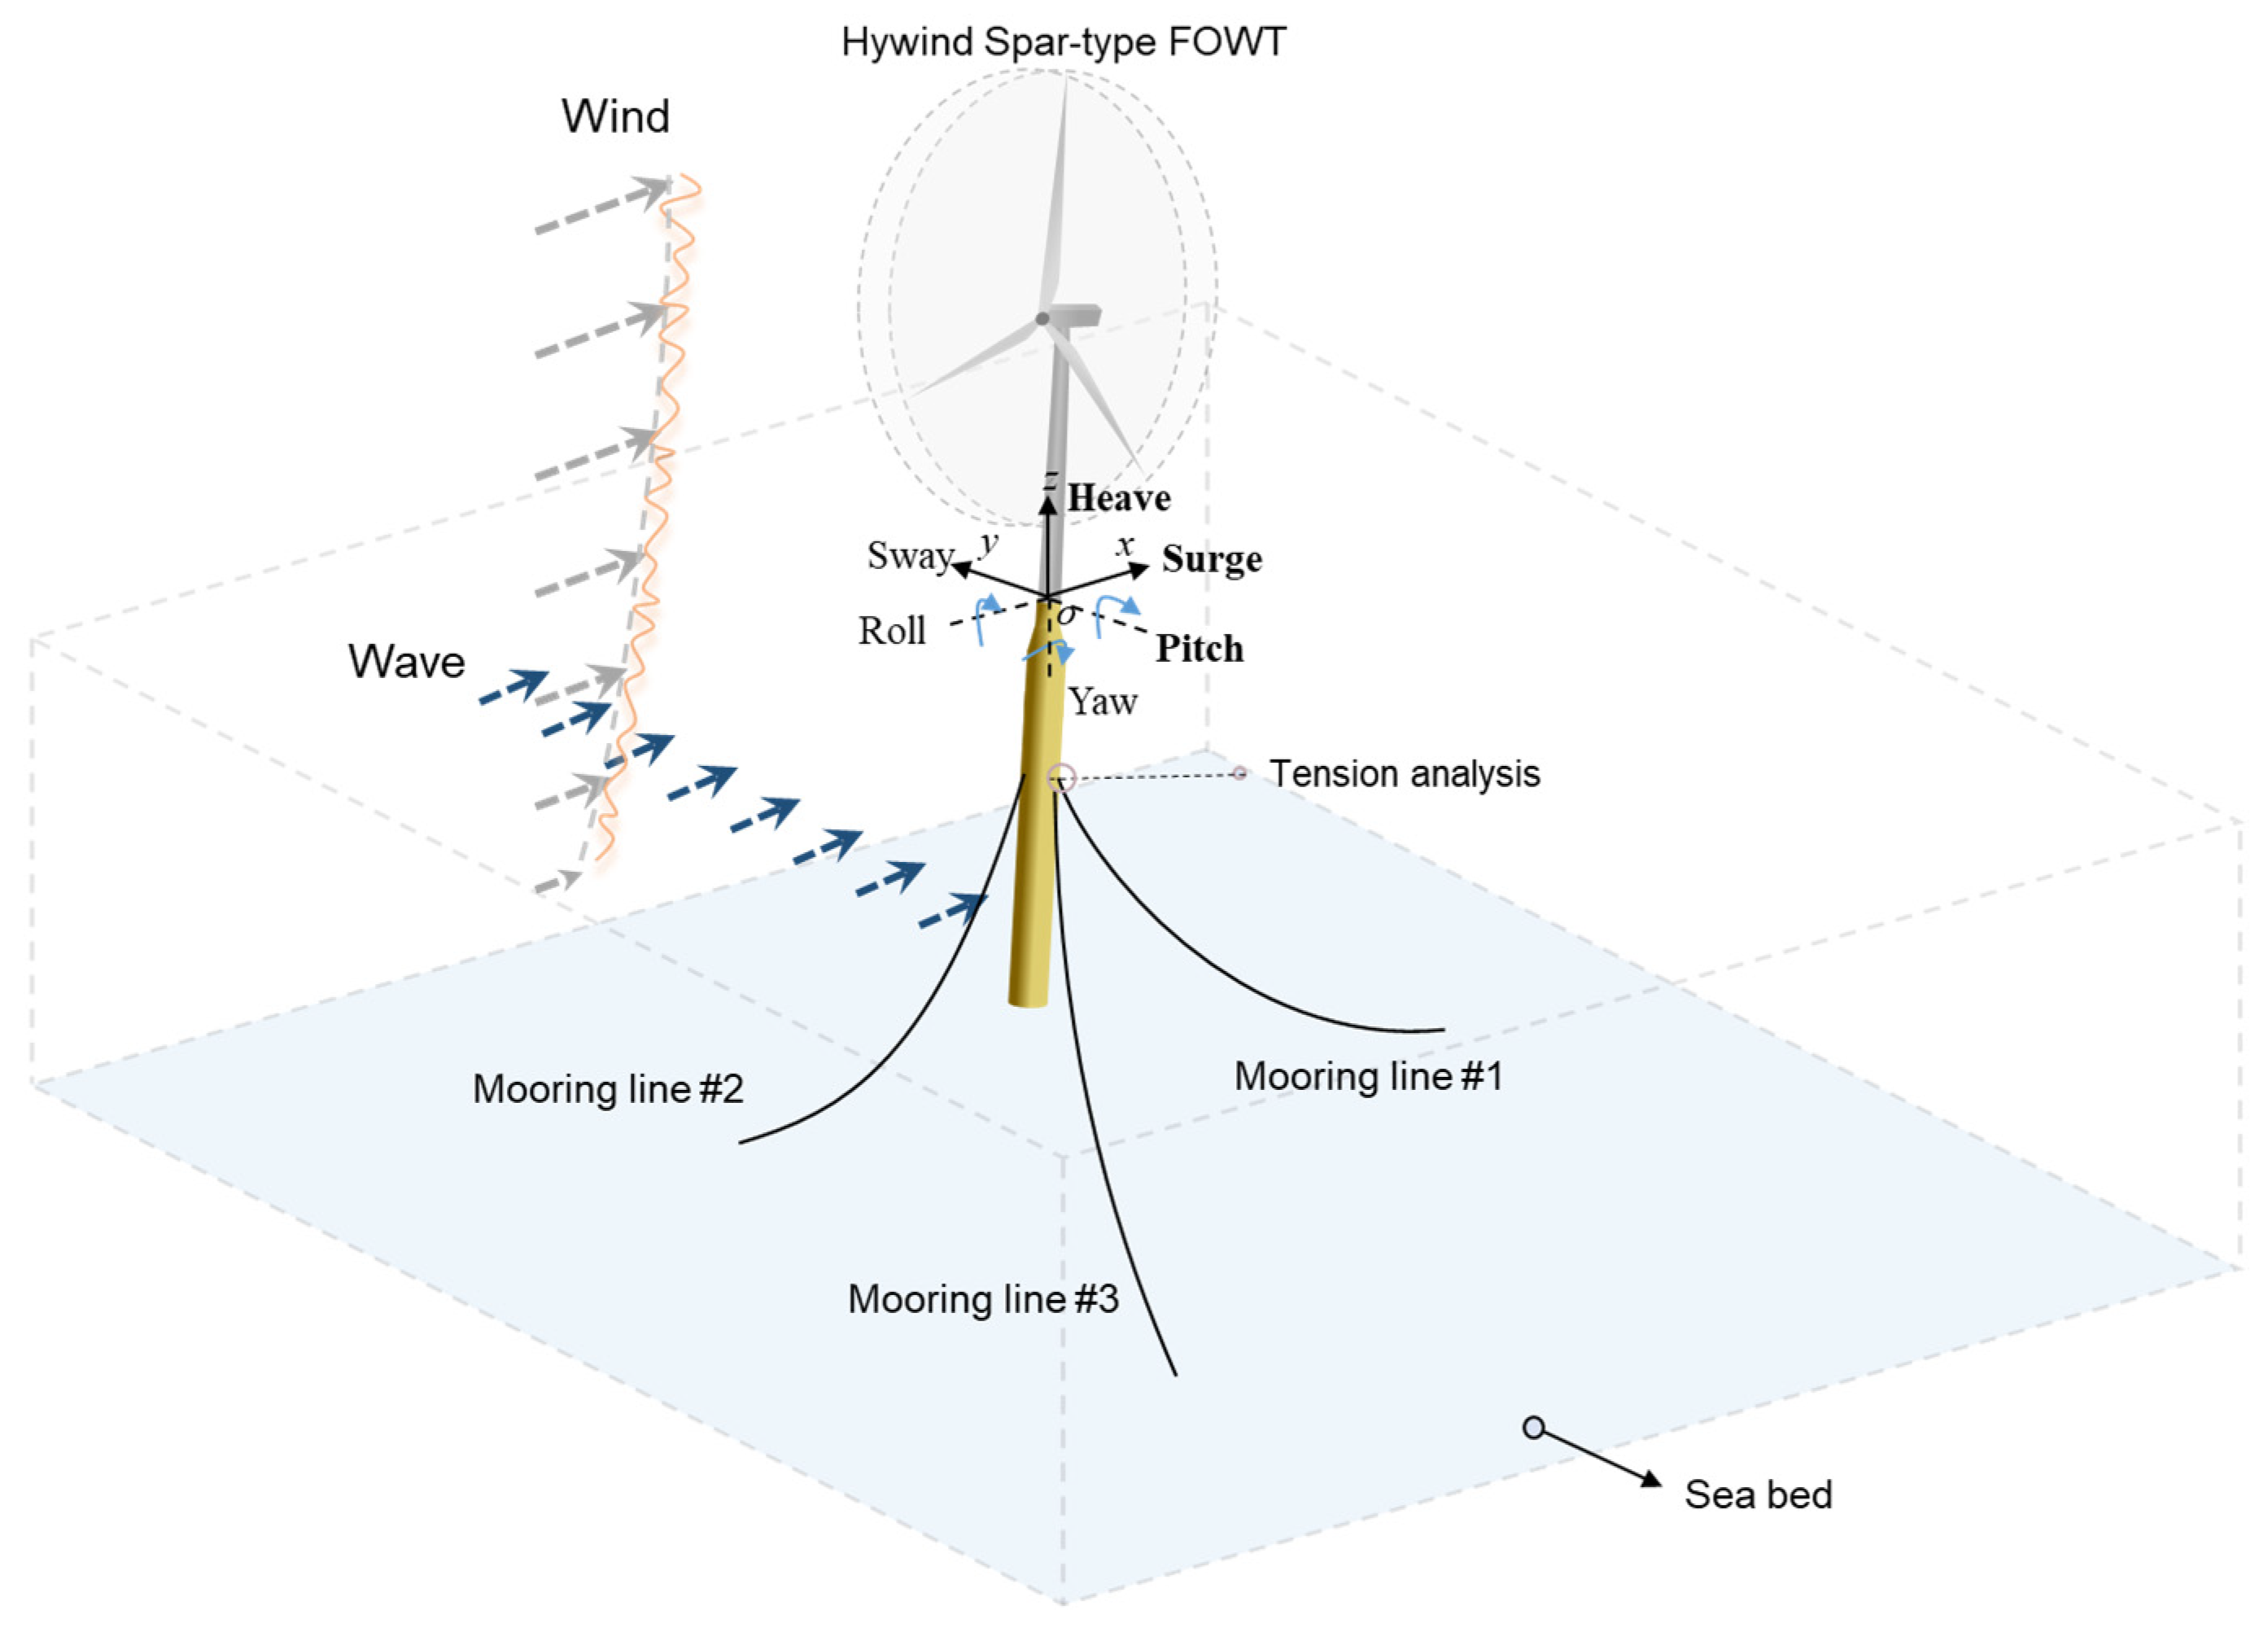
Section 2 offers a characterization of the research subject. Section 3 outlines the approaches used for generating EOG and analyzing the dynamics of the FOWT. Section 4 validates the model by comparing it with existing results, thereby verifying its suitability for subsequent analyses. Section 5 showcases our findings and underscores the significance of the research. Finally, Section 6 concludes the study, emphasizing key insights and suggesting possible directions for future exploration.

2. Physical Problem

In this work, the OC3-Hywind Spar 5 MW FOWT is taken as the research object. The FOWT is composed of the 5 MW wind turbine [24] proposed by the National Renewable Energy Laboratory (NREL) and the Hywind Spar floating platform [25]. The schematic diagram of the FOWT system is shown in Figure 1. The structural parameters of Spar-type FOWT are shown in Table 1. The main structure of the floating platform is composed of a buoyancy tank, a middle section, and a ballast tank. The ballast makes the center of gravity of the platform much lower than the center of buoyancy, and the stability is good. The natural period of motion is outside the range of the wave’s predominant period. The Cartesian coordinate system with the origin at the center of the interface between the waterline surface and the foundation is adopted. The FOWT of this type is chosen due to its status as a widely validated benchmark model in FOWT studies, offering hydrodynamic and structural data for reproducibility. Its deep-draft design ensures exceptional stability under dynamic loads, which is critical for isolating EOG-specific effects on turbine performance. Additionally, the Spar floating platform represents mature technology with real-world deployments, making findings directly relevant to industry applications. The natural frequency decoupling between the spar and wave loads further minimizes interference when analyzing high-frequency gust responses.

3. Methods

3.1. EOG Simulation Method

In this work, the EOG model derived from the ABS rule [26] and Offshore Standard IEC61400 [27] is chosen to represent the studied wind condition. This model serves as a benchmark for the characteristic abrupt variations in wind speed within the time domain, which are inherent in natural wind conditions. By analyzing the damage mechanisms under EOG conditions based on this model, valuable insights can be provided for the design, operation, and maintenance of FOWTs. According to this standard, the wind speed V is formulated as a function of height z and time t in the following manner,
V z , t = V z 0.37 V g u s t sin 3 π t / T 1 cos 2 π t / T , 0 t T V z ,   o t h e r s
where V(z) denotes the wind profile model function, which characterizes how the average wind speed changes with height z. T represents the rise time of the gust, while Vgust signifies the amplitude of the wind gust speed at the hub height.
The expression of the equation for wind speed better reflects the process of gust action. As shown in the formula, the coefficient 0.37 is an empirical value based on actual observations or theoretical derivations, and is used to rationalize the weighting of gust wind speed in the expression. Outside the action range, the wind speed is constant wind speed and does not change. Only in the [0, T] interval, the wind speed changes sharply, which reflects the instantaneous and great influence of the gust. In the variation region, the equation describes the change in gust wind speed through the combination of trigonometric functions, which can accurately capture the fluctuation characteristics of gust in a period T. By adjusting parameters such as Vgust and T, it can adapt to gust conditions with different intensities and periods, and has certain flexibility and can be applied to different scenarios and research needs. However, there may be limitations in the description of complex and changeable gust conditions.

3.2. Aerodynamic Load

The Blade Element Momentum (BEM) method is a prevalent technique for determining aerodynamic forces [28,29,30]. Despite being quasi-static in nature, its accuracy in predicting mean wind forces on a FOWT has been confirmed through validation. The axial induction factor a and the tangential induction factor a’ can be numerically calculated iteratively. Upon determining these factors, the local aerodynamic loads can be computed using the subsequent formula,
d T = 4 π r ρ v 0 2 a ( 1 a ) d r d M = 4 π r 3 ρ v 0 ω ( 1 a ) a d r
where dT represents the thrust of the blade element unit, dM is the torque of the unit, r is the radial distance from the blade element to the shaft, ρ denotes the air density, v0 is the wind speed, and ω is the rotor angular velocity.
Using the base point method of velocity conversion, the linear velocity V1 of each blade element’s movement can be calculated from the linear velocity V0 of the rigid body at the center of mass, the rotational angular velocity ω1 of the rigid body around the center of mass, and the relative position R between the blade element and the center of mass. This relationship can be expressed as follows,
V 1 = V 0 + ω 1 × R
This formula is used to calculate the instantaneous induced velocity generated by the rigid body motion, and the linear velocity is converted to the dynamic coordinate system where the wind wheel is located. The velocity perpendicular to the rotational plane is Vout-pl, and the velocity in the plane is Vin-pl, which is calculated as,
V o u t p l = V 1 · n V i n p l = V 1 · τ
where n and τ are the normal vector of the rotational plane and the tangent vector of the blade element rotation, respectively. The blade element angle of attack is corrected according to the following formula,
tan α = v 0 1 - a V o u t p l ω r 1 + a V i n p l
The modified blade element attack angle is substituted into the iterative process used to solve the induction factor by the BEM theory. This allows for the calculation of the aerodynamic load on the wind turbine blade.

3.3. Hydrodynamic Load

The three-dimensional potential flow theory is used to accurately calculate the wave forces on large marine structures [31]. The three-dimensional potential flow theory assumes of ideal fluid; that is, the fluid is uniform, inviscid, and incompressible, and its velocity potential function needs to satisfy the Laplace equation, that is,
Δ Φ = 2 Φ x 2 + 2 Φ y 2 + 2 Φ z 2 = 0
On this basis, the velocity potential is used to solve the fluid velocity at each unit of the wet surface of the floating platform, and the water pressure of each unit of fluid is solved according to the Bernoulli equation, that is,
p = ρ Φ t + g z + 1 2 | Φ | 2
The wave load acting on the floating platform can be obtained by integrating the obtained water pressure along the wet surface of the floating platform,
F = S 0 p n d S 0
where S0 represents the wet surface of the floating platform, and n represents the vector of the 6-DOF motion of each unit, which is,
n = n 1 , n 2 , n 3 , n 4 , n 5 , n 6 T
The linear potential flow theory shows that the velocity potential Φ in the basin where the floating body is located consists of three parts: the unperturbed incident velocity potential Φw, the diffraction velocity potential Φd under the assumption that the floating platform is stationary, and the radiation velocity potential Φj caused by the 6-DOF motion of the floating platform,
Φ = Φ w + Φ d + j = 1 6 Φ j
For the solution of the boundary conditions of the potential flow theory, the source-sink distribution method is usually used to discretize the wet surface of the object into multiple surface elements, and the source-sink is arranged in each surface element, which is solved in combination with the expression of the Green’s function.
In this work, the wave load on the floating platform can be divided into the first-order wave frequency load F w a v e _ 1 ( t ) and the second-order sum frequency, difference frequency, and constant load F w a v e _ 2 ( t ) . Under the action of random wave η, the wave load time history of the floating platform is,
F w a v e _ 1 ( t ) = Re i = 1 M a i exp i ( ω i t + ε i ) F 1 ( ω i ) F w a v e _ 2 s ( t ) = Re i = 1 M j = 1 M a i a j exp i ( ( ω i + ω j ) t + ε i + ε j ) F 2 s ( ω i , ω j ) F w a v e _ 2 d ( t ) = Re i = 1 M j = 1 M a i a j exp i ( ( ω i ω j ) t + ε i ε j ) F 2 d ( ω i , ω j )
where F 1 ( ω i ) is the linear transfer function, and F 2 s ( ω i , ω j ) and F 2 d ( ω i , ω j ) are the second-order sum frequency and difference-frequency transfer functions, respectively.

3.4. Mooring Method

The rod model is used to simulate the mooring line and describe the dynamic mooring load of the floating wind turbine. Two coordinate systems, the global coordinate system OXYZ and the local coordinate system O’VxVyVz, are assumed. The local coordinate system is attached to the mooring unit, as shown in Figure 2.
For the mooring line, which is mainly subjected to axial tension, the internal force can be simulated by using the deformed bar element, as shown in Figure 3.
Based on Bergan’s method, the space bar element can be expressed by the total Lagrangian formulation and modified by the combined cross-sectional force and small-strain theory. According to the small-strain theory, L0 is assumed to be the initial unstressed element length. Therefore, the axial force N of the element is given by the following formula,
N = L L 0 L 0 E A
In the formula, L is the unit length after deformation, E is the elastic modulus, and A is the cross-sectional area. The tangential stiffness relationship of the element is obtained by the incremental form of the principle of virtual work,
Δ S i n t = ( k G + k M ) Δ v
In the formula, ΔSint is the internal force vector increment, kG and kM are the geometric stiffness matrix and the material stiffness matrix, respectively, and Δv is the displacement increment vector.

3.5. Failure Determination Method

In this study, overall stability and mooring tension are selected as indicators to assess whether a FOWT has failed under the action of an EOG. According to the research findings of Song et al. [32], the stability of a FOWT is determined by the overturning moment acting on the system, which can be translated into a pitch response. Thus, the maximum allowable pitch rotation Pcr can be used to evaluate the stability status of a FOWT, and Pcr is typically set at 10 deg, which could affect the power generation efficiency of a FOWT [33]. The capacity of breaking load for mooring lines is determined by [34],
Q c r = C g 44 0.08 d d 2
where Qcr (kN) signifies the nominal break load, Cg is a coefficient dependent on the steel grade, taken as 0.0223 in this study [35], and d (mm) represents the nominal diameter of the cable.

3.6. Wind Turbine Control Strategy

In this work, the variable speed variable pitch control, which is widely used in the design of wind turbines, is selected. The basic control strategy of variable speed pitch control is shown in Figure 4. Under this strategy, when the wind speed is lower than the rated wind speed, the unit adopts variable speed control, and the operating point of the unit starts from point A, along the maximum conversion efficiency curve to point B; at point B, the unit speed reaches the rated speed ΩN; that is, the wind speed at point B is VN; with the increase in wind speed, the speed of the control unit is basically unchanged, the torque of the generator increases, and the operating point moves along the BC section until the wind speed reaches the rated wind speed and the unit reaches the rated power. When the wind speed is above the rated wind speed, the aerodynamic torque curve is adjusted by changing the blade pitch angle, and the test run point is always maintained at point C. When the speed corresponding to the intersection of the equal power curve corresponding to the rated power and the maximum conversion efficiency curve is less than the speed limit, the actual operating point route should be corrected from ABC to ABC’. This strategy combines the advantages of variable speed variable pitch control and increases the ability of wind energy capture in low wind speeds. When the wind speed is higher than the rated wind speed, effective power regulation can also be achieved. Obviously, its static power curve can also coincide with the ideal power curve. The flexibility of its control also provides conditions for further optimization of system performance.

4. Validation

4.1. EOG Model Validation

To verify the reliability of the EOG simulated in this study, a comparison with the research results of Zhang et al. [22] was conducted in SESAM, in which the characteristics of the EOG condition are determined by three parameters: V(z), Vgust, and T. In this work, the same parameters as Zhang et al. are retained; that is, the more-common gust wind speed parameters are selected, and the dynamic response is preliminarily studied. In the simulation, an EOG condition is established with V(z) = 10 m/s, Vgust = 35 m/s, and T = 20 s, and the comparison results are shown in Figure 5.
As can be seen from the figure, the comparison yields satisfactory results, which effectively validate the accuracy of the EOG model used for analysis in this study. This validation demonstrates the reliability of the EOG simulation within the scope of our study and provides a useful basis for further exploration of the EOG model in the context of floating wind turbines.

4.2. FOWT Model Validation

In order to further verify the feasibility of the FOWT model, we simulated the standard operating sea conditions (see Table 2). The calculation results of the FOWT model used in this work are compared with the calculation results by Li et al. [13].
We selected the three-DOF motions of the floating platform, and mooring tension for comparative analysis. The results of the first 200 s are omitted to ignore the influence of the initial value, the comparison time interval is from 200 s to 700 s, and the dynamic response of the comparison results in a stable state is shown in Figure 6, and the statistical data are shown in Table 3.
The results show that the calculation results of the model used in this work are in good agreement with the time-domain simulation results of Li et al. [13] for OC3 Hywind Spar-type FOWT in terms of the comparison between the base motion and the mooring tension response.

5. Results and Discussion

5.1. The Simulation of EOG Event

For the simulation of EOG in this study, a rated wind speed of V(z) = 11.4 m/s is selected, with a wind speed increment Vgust = 35 m/s, and a duration T = 50 s. Specially, Figure 7a shows the wind speed time series of an EOG event, which is divided into two parts to provide details of wind speed variations at different time scales. Figure 7a displays the wind speed changes over the entire time domain from 200 s to 1000 s. Overall, the wind speed first decreases, then rapidly increases to reach the extreme wind speed, subsequently drops quickly to the minimum wind speed, and finally stabilizes again. The entire wind speed variation occurs within the time range of 500 s to 550 s.
Figure 7b focuses on the primary wind speed variation interval from 480 s to 570 s, providing a more detailed view of the wind speed fluctuations. Within this interval, the wind speed undergoes a complex change process. Based on the generator speed categorization of the NREL 5 MW wind turbine [22], the operational intervals during gust events have been delineated (see Figure 7). This classification allows for a more precise understanding of how the wind turbine’s generator speed responds to sudden changes in wind conditions, which is crucial for assessing the dynamic behavior and control strategies of the floating wind turbine during extreme gusts. Specifically, between 480 s and 500 s, the wind speed remains at the rated wind speed for turbine operation, which is 11.4 m/s.

5.2. Response Analysis

In this Section, the dynamic response characteristics of the FOWT under gust influence are analyzed. The analysis focuses on the three-degree-of-freedom motion of the floating platform and the tension in the mooring lines. The case settings for different working conditions are shown in Table 4. Figure 8 presents the time series of pitch angle and generator speed under different cases. To facilitate the analysis, three distinct operational cases are defined: Case1 refers to the wind turbine operating at its rated condition under rated wind speed, Case2 pertains to the normal operation strategy of the wind turbine under the influence of gusts, and Case3 corresponds to the shutdown strategy implemented when the generator speed reaches its maximum value during a gust event at 520 s. This categorization aids in systematically examining how different operational strategies affect the FOWT’s response to gusts, with particular attention given to the floating platform’s motion and mooring line tensions.

5.2.1. Surge Motion of Floating Platform

The analysis begins with an examination of the surge motion of the floating platform. Figure 9 and Figure 10 illustrate the time domain and frequency of the surge motion for the floating platform under various operational conditions, respectively, and they are divided into two parts to offer detailed insights into response variations across different time scales. As depicted in the legend, the gray curve represents the surge motion time history when the wind turbine operates at its rated condition under rated wind speed (Case1), serving as a reference for analyzing the effects of changes in wind load conditions and shutdown strategies on the surge motion of the floating platform. The red curve indicates the changes in surge motion under normal operation strategy when the wind turbine is subjected to gusts (Case2), while the blue curve delineates the surge motion time history curve when a shutdown strategy is implemented at the peak generator speed during a gust event (520 s) (Case3). This comparative analysis allows for a comprehensive understanding of how different operational scenarios impact the dynamic behavior of the floating platform in response to gusts.
Figure 9a on the left illustrates the dynamic response changes over the entire time domain from 200 s to 1000 s, excluding the impact of the initial values for the first 200 s. It can be observed that prior to the initiation of the Extreme Operating Gust (EOG), the surge motion of the floating wind turbine is a coupling of low-frequency natural period motion and high-frequency wave period motion. Compared to the rated wind operation conditions, the response undergoes a sharp change under the influence of extreme gusts (for specific changes, see Figure 9b). After the activation of the EOG, the wind turbine adopting an operational strategy continues to maintain a high level of surge motion, with an average value of 21.41 m (refer to Table 5), while the wind turbine group employing a shutdown strategy sees a reduction in the average surge motion value to 9.37 m.
Figure 9b focuses on the main response change interval from 480 to 640 s, providing a more detailed look at the response fluctuations. Taking the wind turbine response in the rated operation state of Case1 as the baseline, the effects of gust action and the shutdown strategy are analyzed within this interval. The response undergoes a complex change process during this period. To facilitate analysis, the wind change region is divided into five intervals (R1–R5) based on the wind turbine’s Generator speed.
In R1, as the extreme gust wind speed decreases, the average surge motion of the floating platform begins to slightly decrease. Then, in R2, even though the wind speed starts to climb, the surge motion continues to decrease due to the system’s inertia. Subsequently, in region R3, due to the rapid increase in wind speed, the response begins to increase. In the middle of region R3, two different shutdown strategies are chosen for the wind turbine (Case 2 and Case 3), and the dynamic responses under these two shutdown strategies begin to exhibit different performance characteristics. Specifically, the response increase under normal operation is greater than that under the shutdown strategy. In R3, where wind speed reaches its maximum value, both strategies reach their peak responses, with the shutdown strategy reaching its maximum value more quickly, but its maximum value is significantly lower than that of normal operation. The maximum surge motion under normal operation reaches 28.99 m. Afterward, the wind turbine’s surge motion shows a decreasing trend, and subsequent responses gradually return to their form before the gust action.

5.2.2. Heave Motion of Floating Platform

In this Section, we analyze the performance of the heave motion of the floating platform under different conditions. Figure 11 and Figure 12 illustrate the time domain and frequency of the heave motion for the floating platform under various operational conditions, respectively, and they are divided into two parts to provide detailed information on response changes at different time scales. As shown in the legend, the gray curve represents the time history curve of the heave motion when the wind turbine operates at its rated condition under rated wind speed (Case1), which serves as a baseline for analyzing the impact of changes in wind load conditions and shutdown strategies on the heave motion of the floating platform. The red curve represents the response change in the floating platform’s heave motion under normal operation strategy during the action of gusts (Case2), while the blue curve represents the time history curve of the floating platform’s heave motion when a shutdown strategy is adopted at the maximum generator speed during the action of gusts (Case3).
The statistical data in Table 6 are crucial for quantifying and comparing the performance of the floating platform’s heave motion under different scenarios. By comparing Case1 (the baseline condition), Case2 (normal operation strategy under gust action), and Case3 (shutdown strategy at maximum generator speed during gust action), we can assess the specific impact of different operating conditions on the heave motion of the floating platform. These statistical data may include key indicators such as the maximum value, average value, and standard deviation of the heave motion, which help to understand the dynamic response of the floating platform under different wind load conditions and provide a basis for designing more effective control strategies. Through this analysis, the design and operation of the floating platform can be optimized to improve its performance and safety under extreme weather conditions.
Figure 11a displays the dynamic response changes over the entire time domain from 200 s to 1000 s, disregarding the impact of initial values in the first 200 s. Compared to the rated wind speed operation, the response underwent drastic changes under the influence of extreme gusts. After the extreme gusts, wind turbines operating with the running strategy remained near their equilibrium position with an average value of −0.28 m, while those with the shutdown strategy saw an elevation in their heave motion equilibrium position.
The right figure (Figure 11b) focuses on the main response change interval from 480 to 640 s and provides more detailed response fluctuations. Taking the response of the wind turbine in Case1 at rated operation as the baseline, it analyzes the impact of gust action and the shutdown strategy. Similar to the surge motion analysis, the wind change region is divided into five intervals (R1–R5) based on the wind turbine’s Generator speed.
In R1, Case1 maintains its original characteristic motion, while Case2 and Case3 begin to show response differences as wind speed changes. Subsequently, in R2, as wind speed increases, the equilibrium position of the foundation’s heave motion rises. Then, in region R3, due to the rapid increase in wind speed, the response changes dramatically. In R3, wind turbines choose two different shutdown strategies, with responses first decreasing and then increasing to their maximum values, which occur approximately 15 s after the extreme wind speed, with the shutdown strategy reaching its maximum value more quickly. Specifically, the response increase under normal operation is greater than that under the shutdown strategy. In R3, when wind speed reaches its maximum value, both strategies reach their peak responses, with the shutdown strategy reaching its maximum value more quickly, but its maximum value is significantly lower than that of normal operation. The maximum heave motion under normal operation is 1.58 m, and under the shutdown strategy, it is 1.44 m. Afterward, the heave motion in Case2 and Case3 exhibits low-frequency motion with gradually decreasing fluctuation amplitudes, and gradually returns to a stable state after 800 s.
We can find that the heave motion significantly changes; this is because gusts are characterized by rapid changes and irregularities. When a gust hits, the sharp changes in its intensity and direction cause complex variations in the aerodynamic forces on the wind turbine blades. In addition to generating horizontal thrust, they also induce vertical forces and moments. These vertical forces and moments are transmitted to the floating platform through the tower, which directly triggers the heave motion. When EOG impacts, the FOWT system accumulates energy. After the shutdown, the aerodynamic thrust decreases, the periodic excitation of the aerodynamic load decreases, and the downward heave component force also decreases. Therefore, the heave position of Case3 is higher than the average dynamic position of Case1 and Case2.

5.2.3. Pitch Motion of Floating Platform

This Section analyzes the pitch motion performance of floating platforms under different conditions. Similar to the analysis methods in the previous two Sections, Figure 13 and Figure 14 illustrate the time domain and frequency of the pitch motion for the floating platform under various operational conditions, respectively. As indicated in the legend, the gray curve represents the pitch motion history curve of the wind turbine operating at rated wind speed and rated condition (Case1), which serves as the baseline for analyzing the impact of changes in wind load conditions and shutdown strategies. The red curve represents the response change in the floating platform’s pitch motion under normal operation strategy during gusts (Case2), and the blue curve represents the time history curve of the floating platform’s pitch motion when a shutdown strategy is adopted during gusts with maximum generator speed (Case3). Table 7 provides statistical data under different conditions.
Figure 13a displays the dynamic response changes over the entire time domain from 200 s to 1000 s, disregarding the impact of initial values in the first 200 s. Compared to the rated wind operation, the response changes dramatically, and the fluctuation amplitude significantly increases under the influence of extreme gusts (see Figure 13b for specific changes). After extreme gusts, wind turbines operating with the running strategy remain near their equilibrium position with an average value of 4.21 deg, while those with the shutdown strategy reduce their pitch motion average to 1.75 deg. This reduction is due to the decrease in wind thrust received after the shutdown, which affects the swinging motion of the wind turbine.
Figure 13b on the right focuses on the main response change interval from 480 to 640 s, providing a more detailed view of the response fluctuations. Taking the response of the wind turbine in Case1 under rated operating conditions as the baseline, this Section analyzes the impact of gust effects and the shutdown strategy on the pitch motion of the floating platform. This Section also divides the wind speed change region into five intervals (R1–R5) based on the generator speed of the wind turbine.
In interval R1, there is not much change in response among different cases. Subsequently, in interval R2, as wind speed begins to increase, the pitch motion of the floating platform shows a decreasing trend. Then, in region R3, due to the rapid increase in wind speed, the response changes dramatically. Specifically, in the middle of region R3, the response first increases to a maximum value and then decreases, with the shutdown strategy reaching the maximum value faster. Under normal operation, the increase in response is greater than that under the shutdown strategy. In region R3, where wind speed reaches its maximum value, both strategies reach their maximum response, and the shutdown strategy reaches its maximum value faster, but its maximum value is significantly less than that under normal operation. The maximum pitch response during normal operation reached 10.52 deg, leading to an overall unstable performance according to the criteria in Section 3.4. The shutdown strategy can significantly reduce the swing amplitude to 6.09 deg. Subsequently, in Case2 and Case3, the heave motion presents as low-frequency motion, with fluctuation amplitudes gradually decreasing and then gradually returning to a stable state.

5.2.4. Mooring Line Tension

In this Section, the changes in mooring tension characteristics of floating wind turbines under different conditions are analyzed, focusing on mooring lines #1 and #2. The statistical results are shown in Table 8 and Table 9. Under various conditions, the tension in mooring line #2 is significantly greater than that in mooring line #1. This is because mooring line #2 is on the windward side. As the floating wind turbine drifts horizontally due to the action of wind and wave loads, mooring line #2 becomes taut while mooring line #1 becomes slack.
Figure 15 and Figure 16 display the response change curves in time domain and frequency domain of the mooring line #1, respectively, Figure 17 and Figure 18 display the results of mooring line #2 in time domain and frequency domain. Similarly, the gray curve represents the pitch motion time history curve of the wind turbine operating at rated wind speed and in a rated operating state (Case1). This serves as a baseline to analyze the impact of changes in wind load conditions and shutdown strategies. The red curve represents the response change in the floating platform’s pitch motion under normal operation strategy during gusts (Case2), and the blue curve represents the time history curve of the floating platform’s pitch motion when a shutdown strategy is implemented at maximum generator speed during gusts (Case3). Table 1 provides statistical data under different conditions.
As can be seen on the left side of Figure 15 and Figure 17, the effect of gusts causes a change in the fluctuation degree of mooring tension in Case2. Case3 shows significant changes in the mean values of the floating wind turbine due to the shutdown strategy. After the gusts, the mean value of mooring line 1 increases, while that of mooring line #2 decreases. This is because the shutdown reduces the horizontal movement of the floating wind turbine, leading to a decrease in tension of line #2 and an increase in tension of line 1. For mooring line #2, the maximum values are the same under all three conditions, indicating that gusts and shutdown strategies have little effect on the maximum values. This is because the maximum mooring tension of 1376.60 kN for the floating wind turbine occurs around 220 s when the heave motion is at its maximum, which is outside the gust influence interval. It is noteworthy that under the shutdown strategy, the tension in mooring line 1 reached its maximum value of 671.16 kN. According to the criteria in Section 3.4, the maximum tension that the OC3 Hywind mooring system can withstand is 6647 kN, so there was no failure or breakage of the mooring lines during the gusts.

6. Conclusions

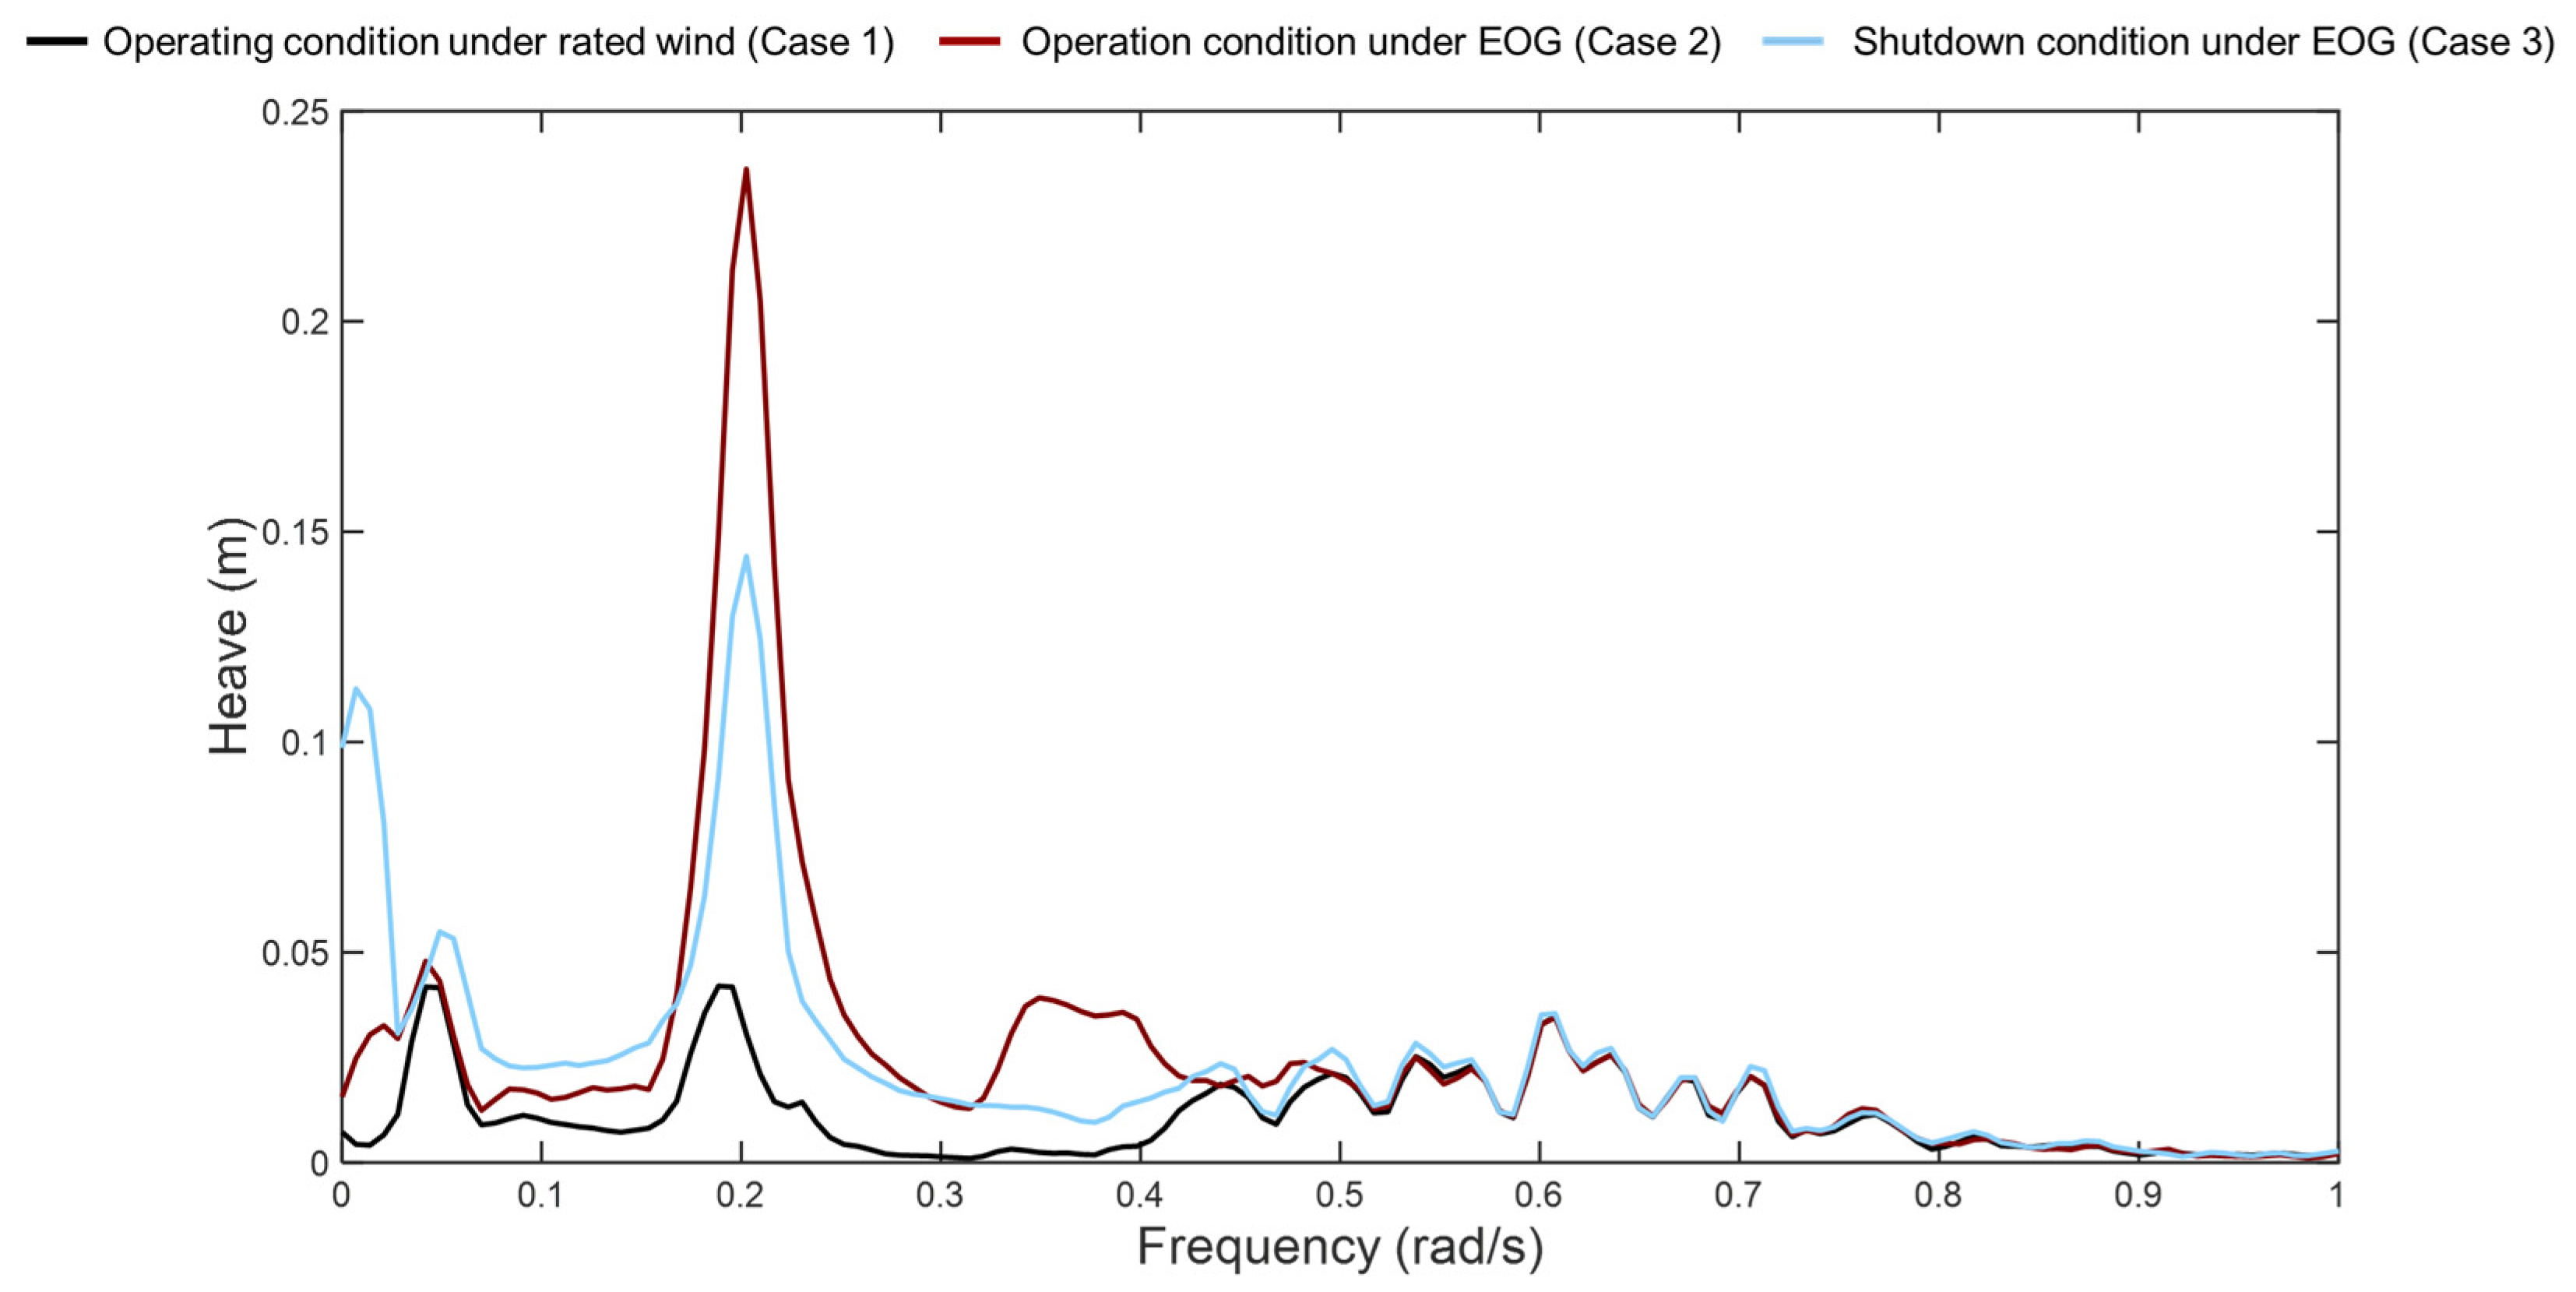
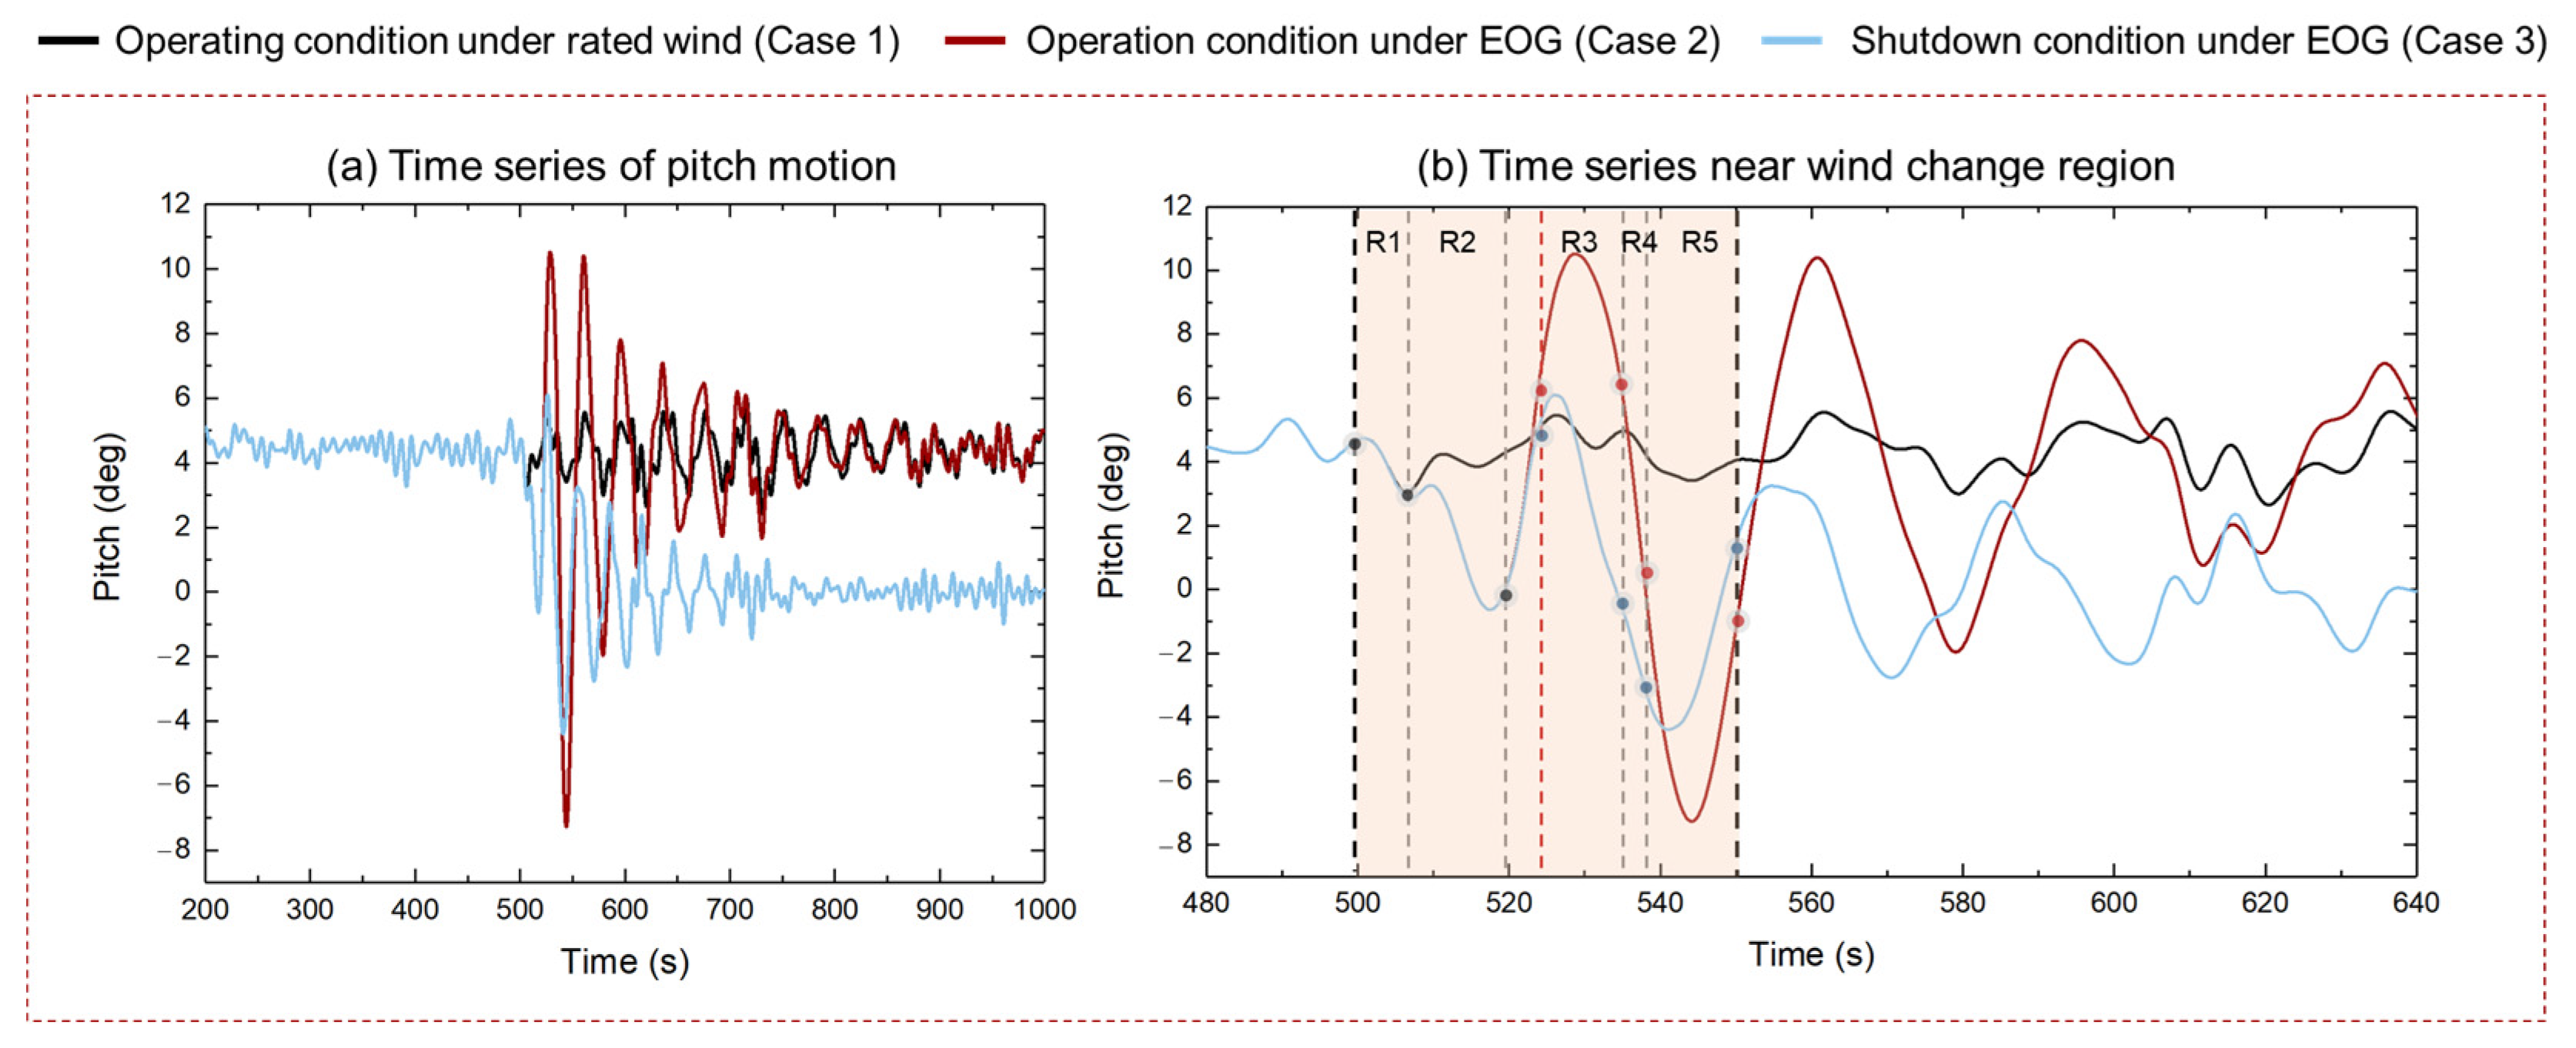
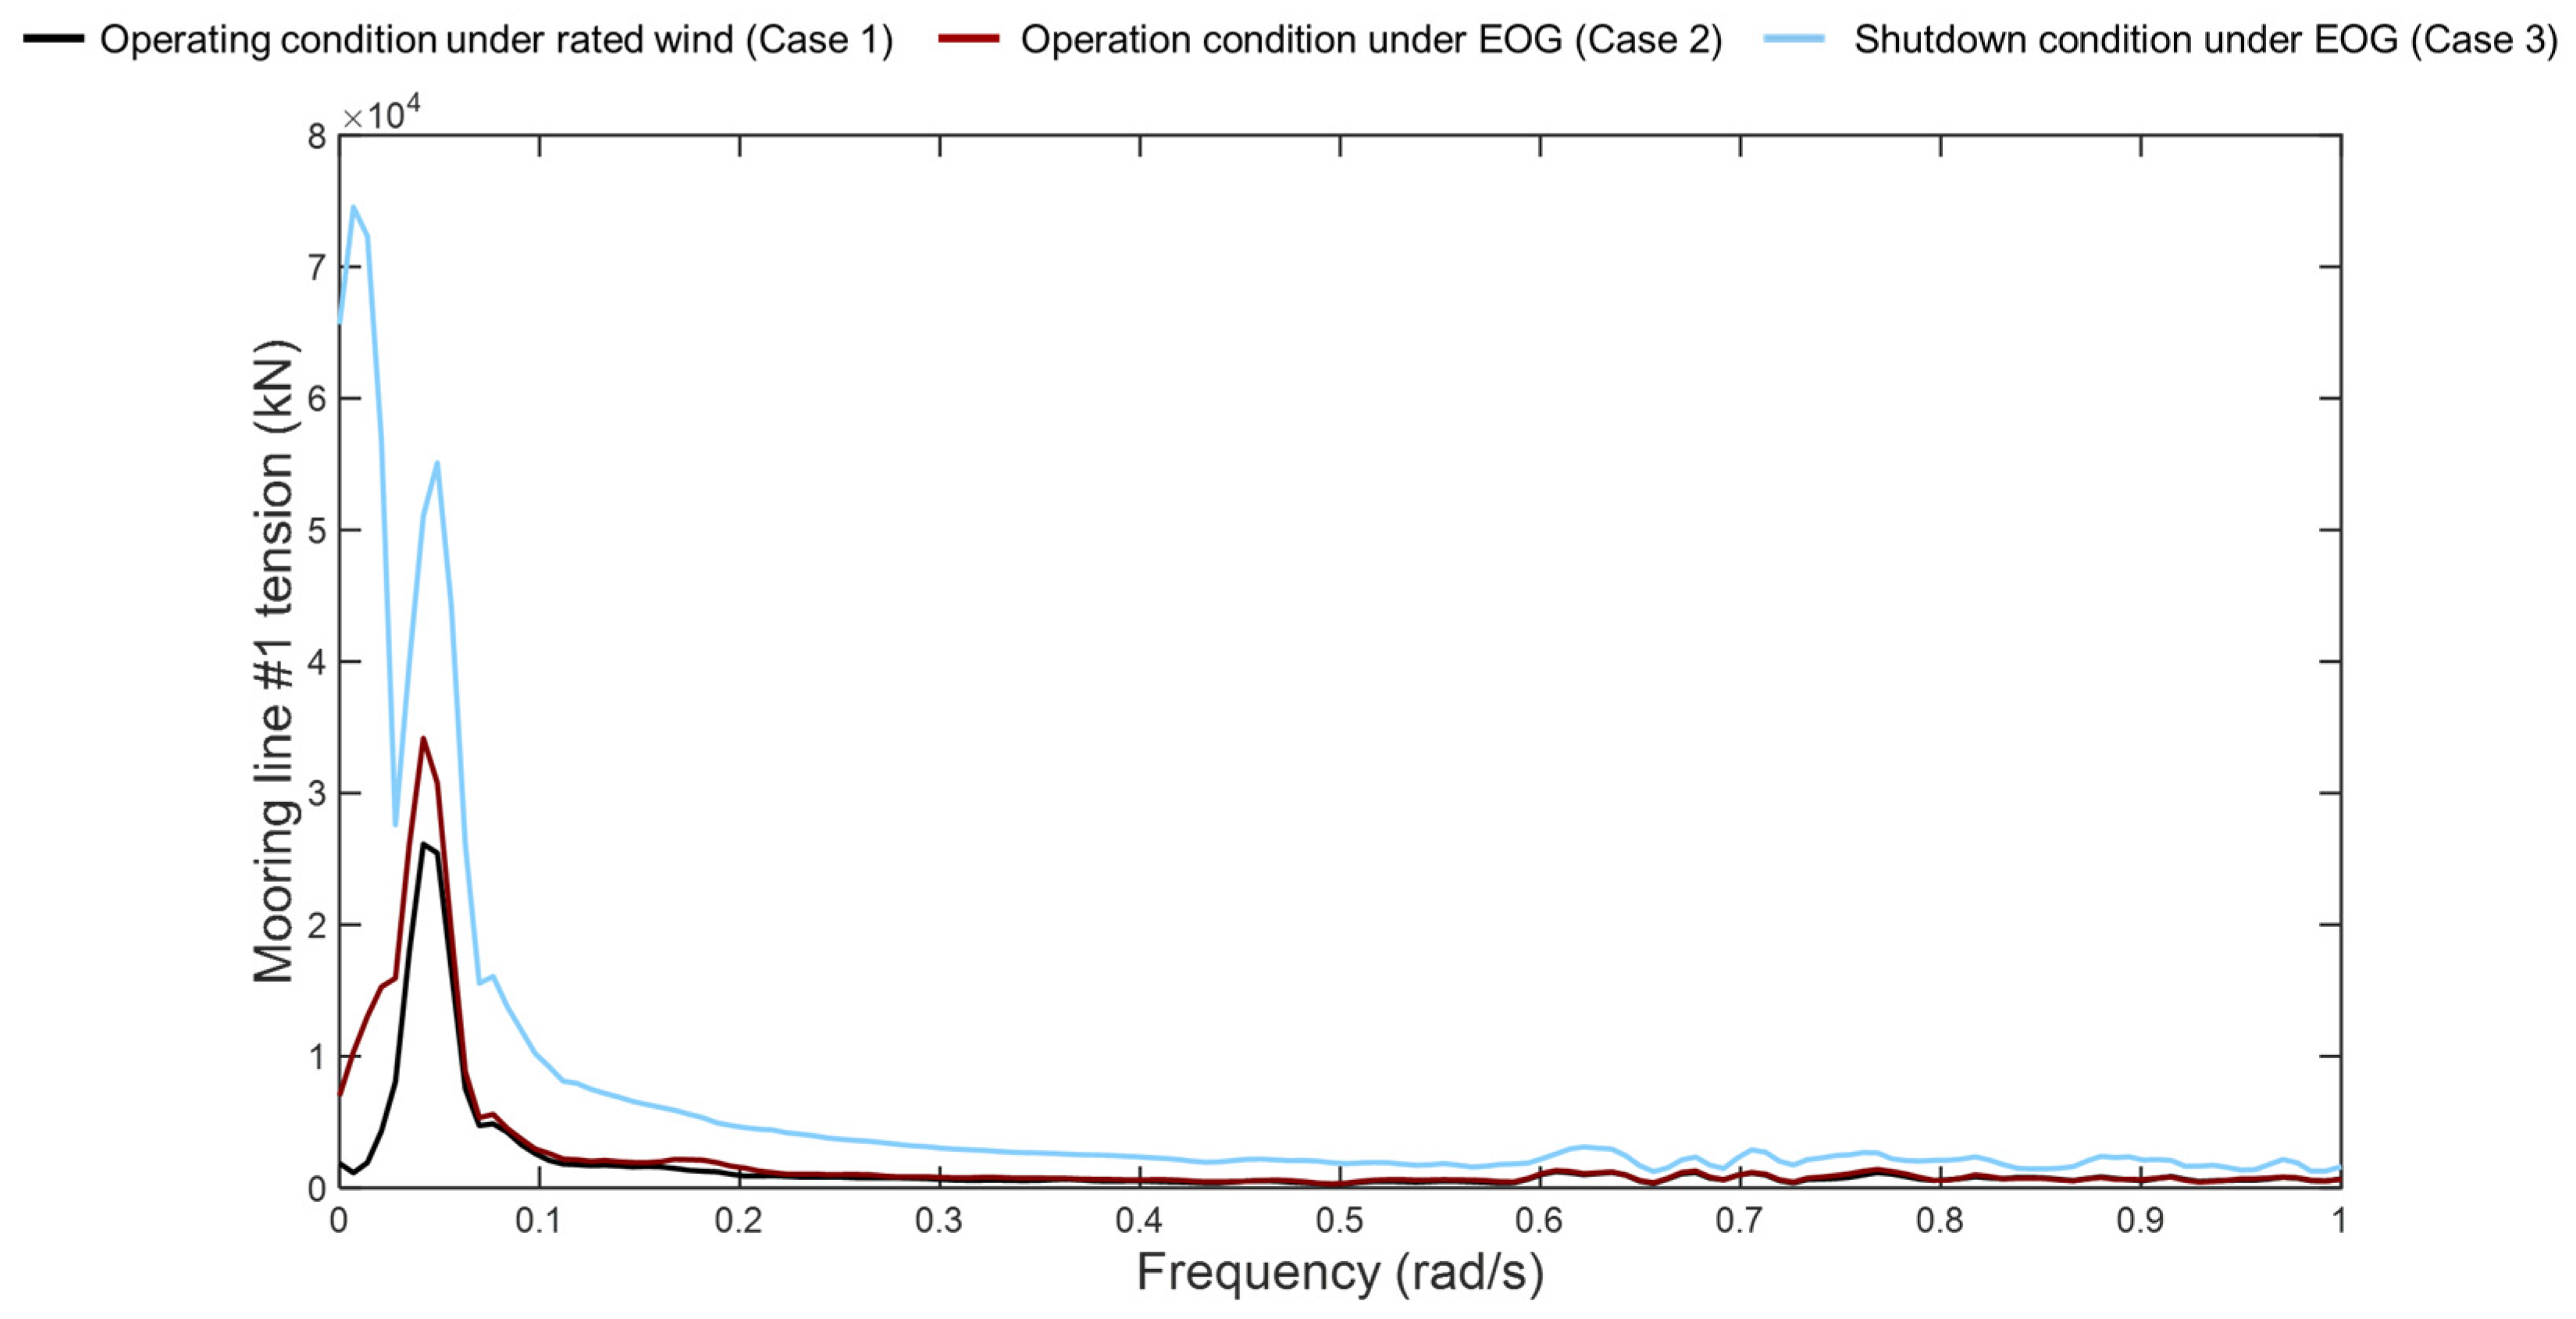
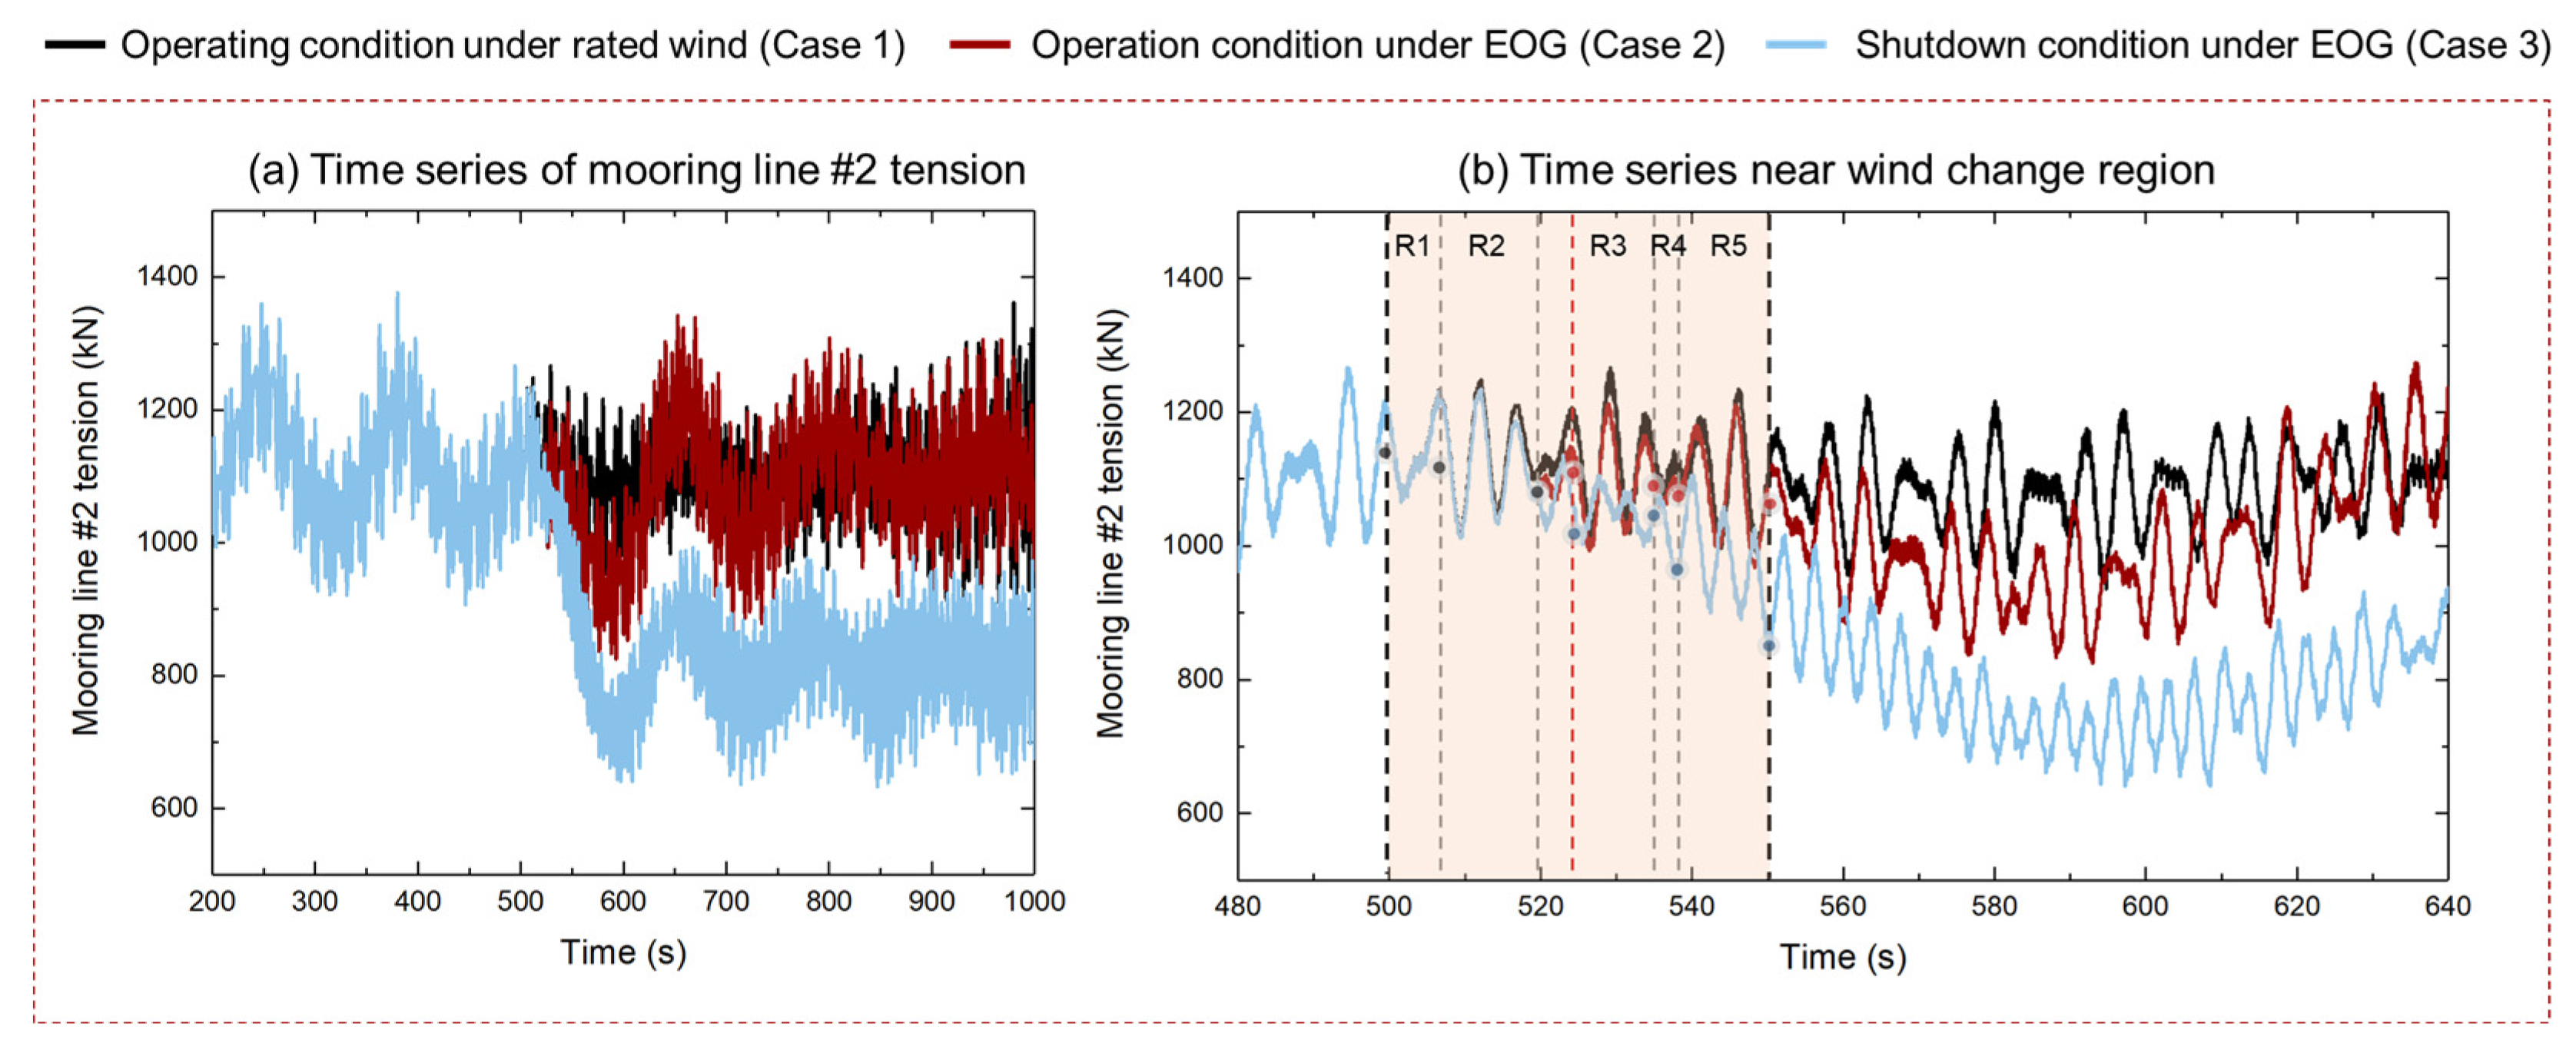
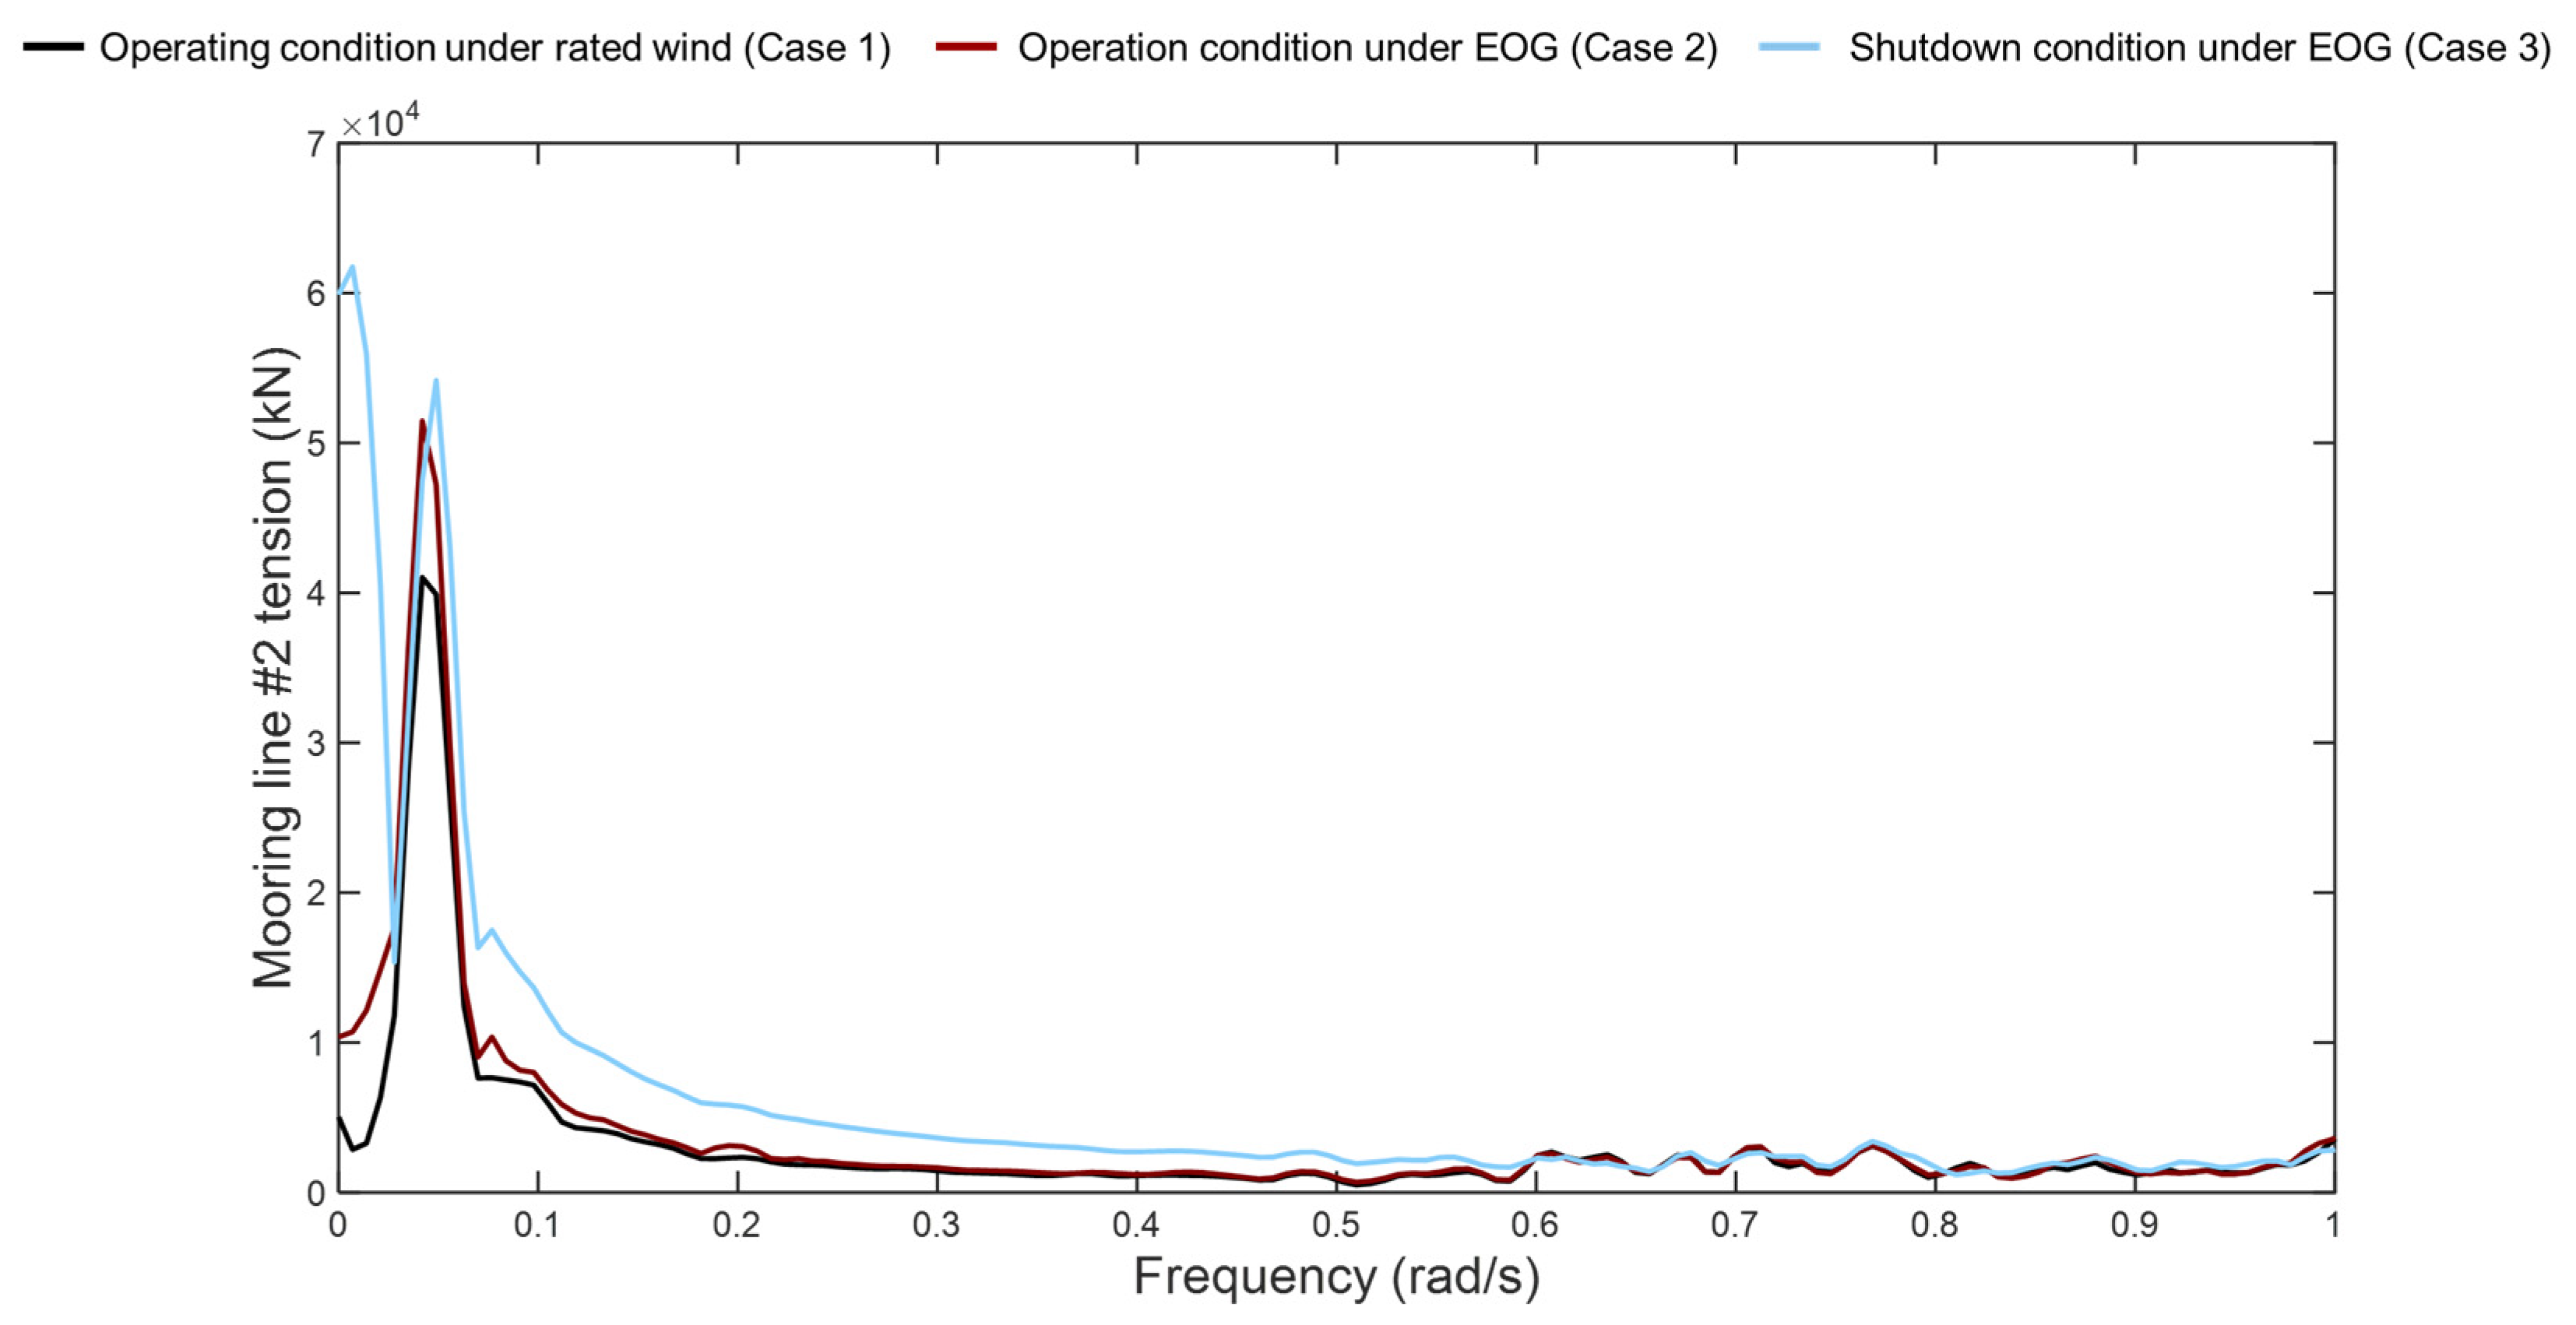
This article deeply analyzes the impact of extreme gust conditions on the dynamic response of floating wind turbines through simulation. The study covers the operating state of the wind turbine under rated wind speed, the operating state under gust influence, and the shutdown state under gust influence. Focusing on the motion of the floating platform and the tension of the mooring lines of the floating wind turbine, this research aims to explore the changes in these key parameters under extreme gust conditions.
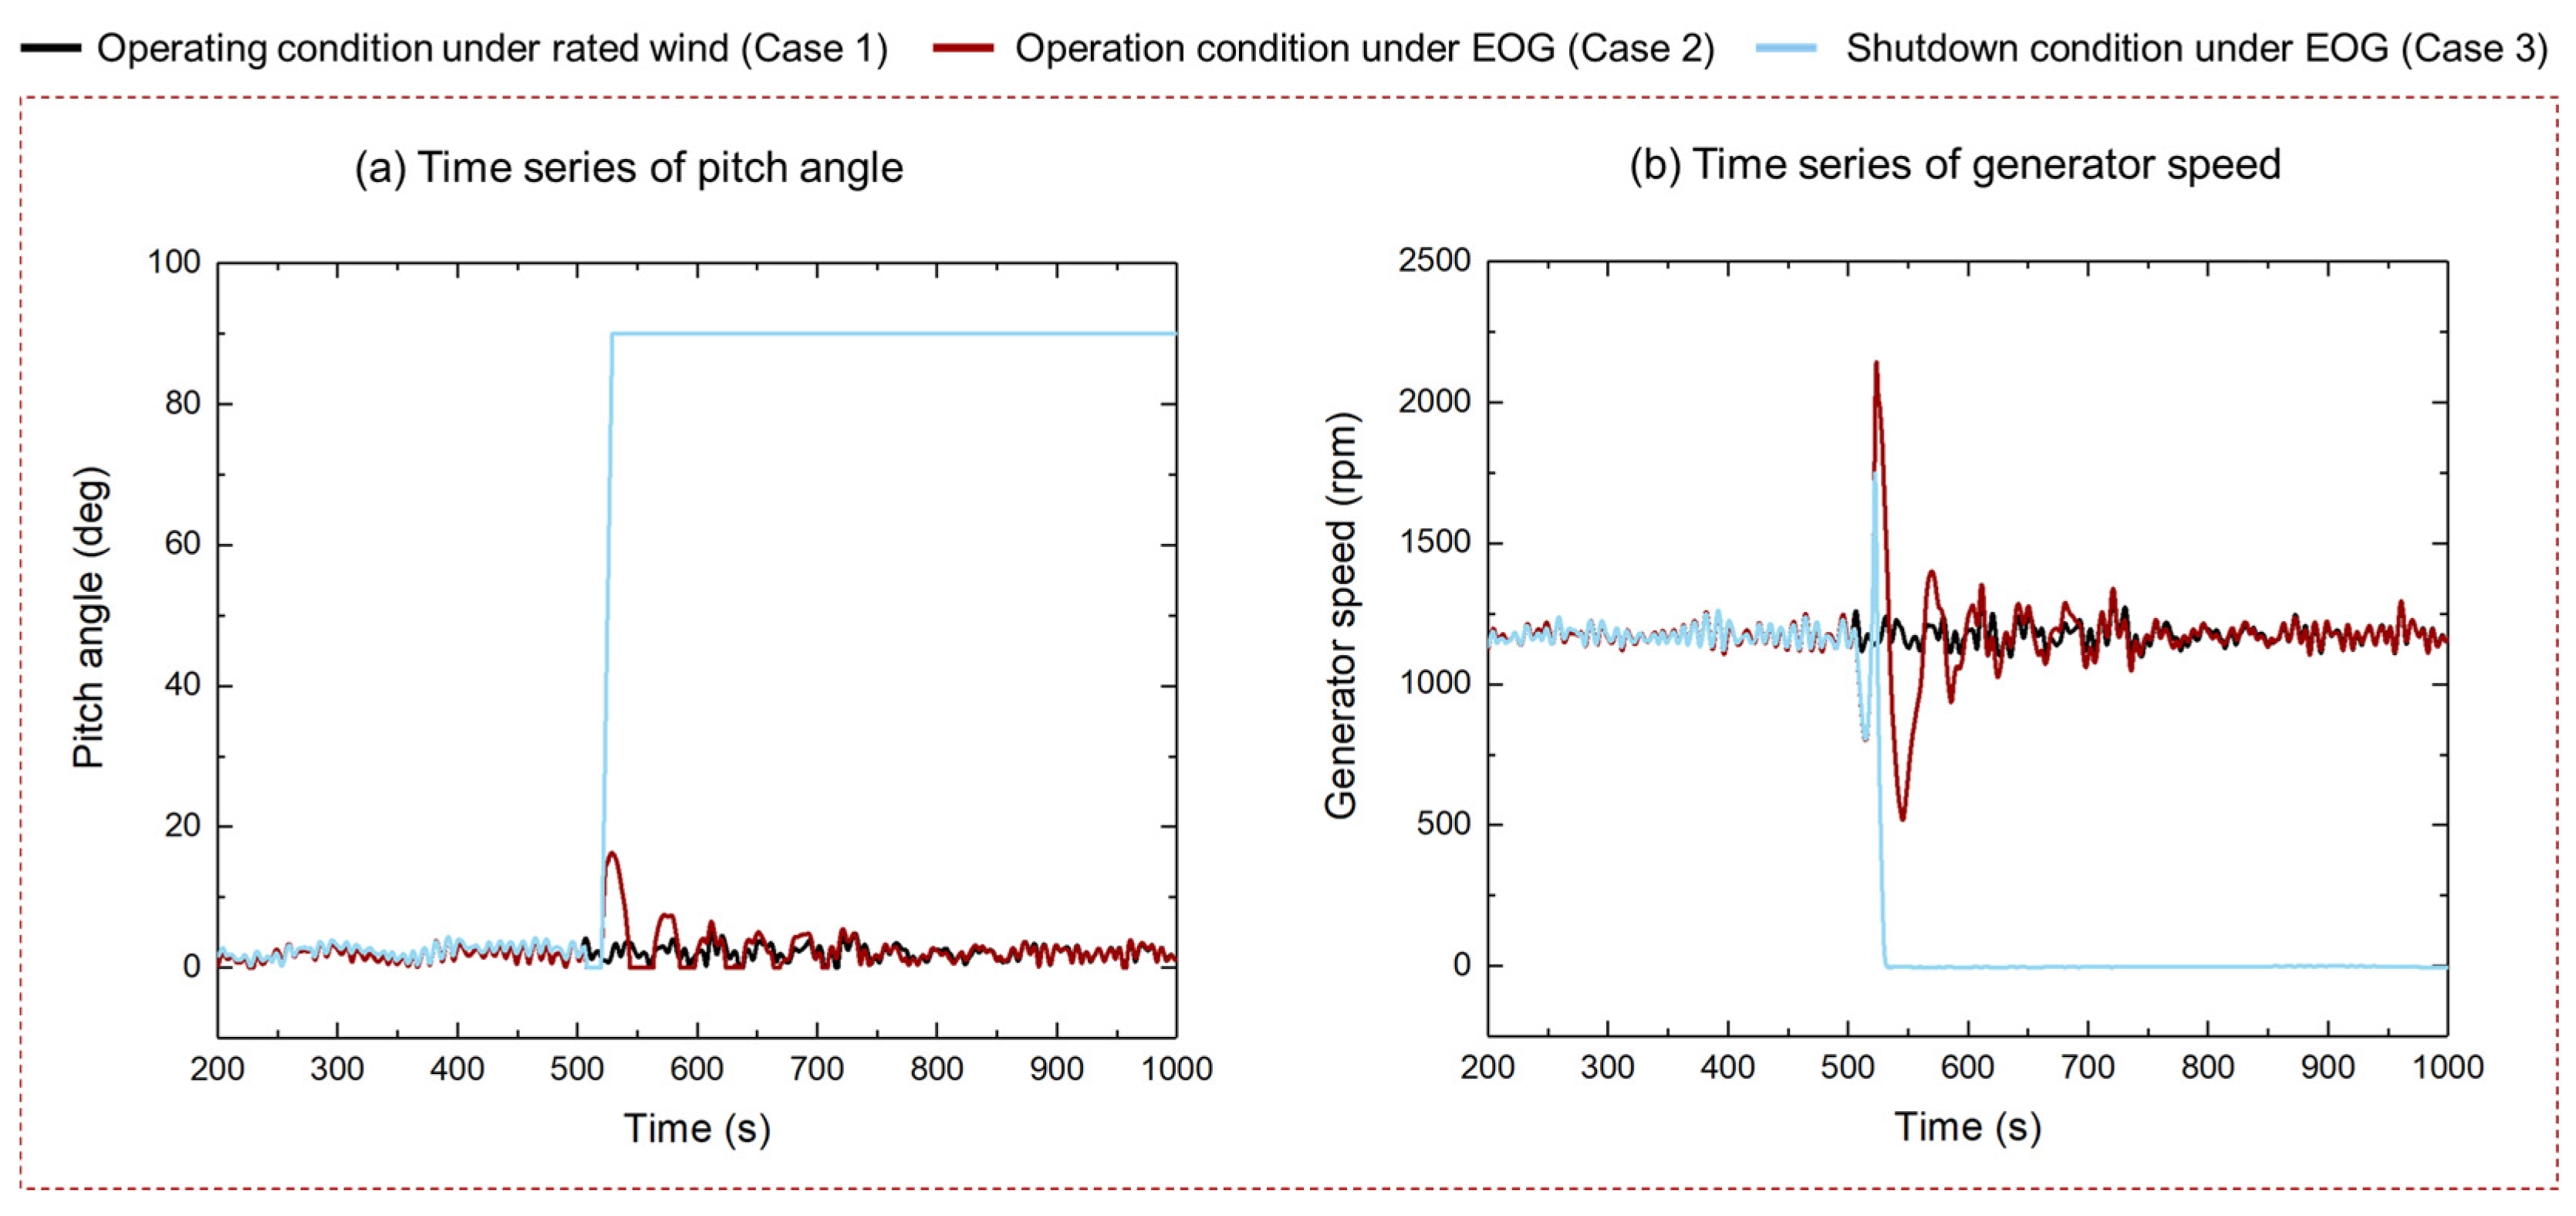
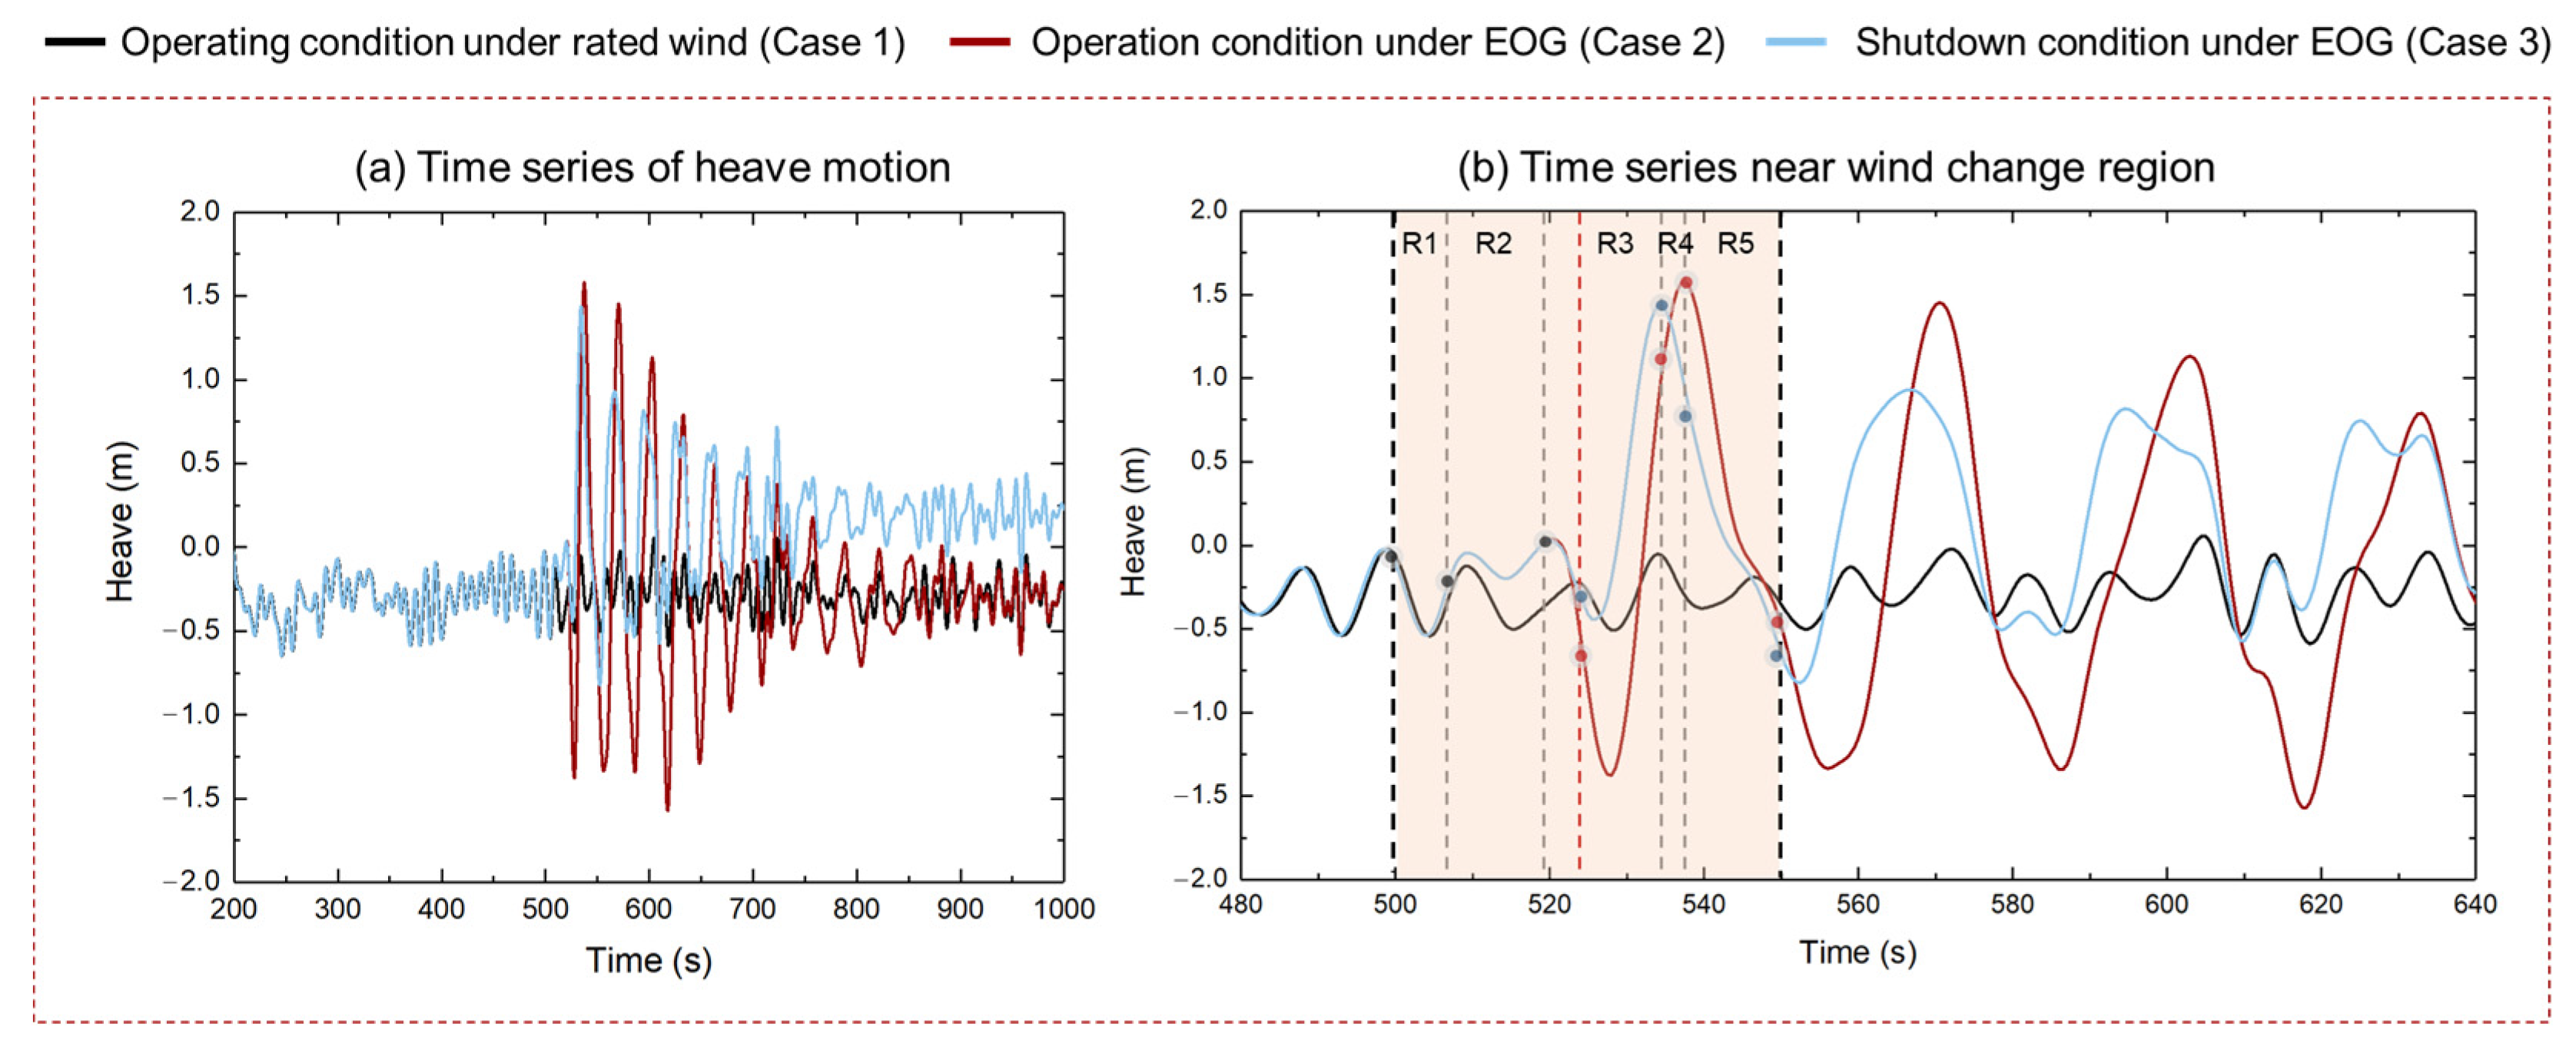
The study found that under the influence of extreme gusts, the dynamic response of the wind turbine showed significant changes, especially in the amplitude of response. After the gusts, when a shutdown strategy was adopted, there were significant differences in the mean response of various parts of the wind turbine. Compared with the normal operating state under gust influence, the wind turbine reached the extreme value of response faster and returned to a stable state more quickly under the shutdown strategy. The extreme value of response in the normal operating state was larger, especially in pitch motion, showing an overall trend of instability. After adopting the shutdown strategy, the amplitude of the swing was significantly reduced. Under the influence of gusts, no failure or breakage occurred in the mooring lines. The shutdown strategy reduced the horizontal movement of the floating wind turbine, resulting in a decrease in tension of line# 2 and an increase in tension of line #1.
This study has some limitations. For example, when designing the shutdown strategy, this paper only considered the shutdown settings during gust influence and did not fully consider the situation where the wind turbine resumes operation after the gusts. At the same time, only the dynamic response of the lower structure was analyzed; future analysis will include the response of the upper blades, tower, and other structures. Additionally, the impact of large-scale wind turbine developments will be studied. Future research will delve deeper into the above content to provide more comprehensive strategies and solutions for the operation of floating wind turbines under extreme weather conditions. In future work, we plan to extend this research to larger-scale FOWTs to evaluate how upscaling impacts EOG-induced dynamics.

Author Contributions

Conceptualization, S.L. and W.Y.; methodology, Y.L.; validation, Y.Z. and S.L.; formal analysis, Y.L. and W.Y.; data curation, Y.Z.; writing—original draft preparation, Y.L.; writing—review and editing, Y.L., Y.M., and W.Y.; supervision, Y.Z. and S.L.; project administration, S.L.; funding acquisition, S.L. All authors have read and agreed to the published version of the manuscript.

Funding

This research was funded by CSDC and The Doctoral Startup Foundation of Liaoning Province; the numbers are respectively DC242201 and 2021-BS-235. And “The APC was funded by CSSC.

Institutional Review Board Statement

Not applicable.

Informed Consent Statement

Not applicable.

Data Availability Statement

All data are presented in the paper. Please refer to this article or citation.

Conflicts of Interest

Authors Wei Yin and Shudong Leng were employed by the company China Ship Design & Research Center Co., Ltd. Author Yanpeng Meng was employed by the company CSSC (TIANJIN) SHIPBUILDING CO.,LTD. The remaining authors declare that the research was conducted in the absence of any commercial or financial relationships that could be construed as a potential conflict of interest.

References

  1. Wang, Q.; Sun, X.; Wang, R.; Zhou, L.; Zhou, H.; Di, Y.; Li, Y.; Zhang, Q. Research on Urban Energy Sustainable Plan under the Background of Low-Carbon Development. Sustainability 2023, 15, 14206. [Google Scholar] [CrossRef]
  2. Raimi, D.; Zhu, Y.; Newell, R.G.; Prest, B.C. Global Energy Outlook 2024: Peaks or Plateaus; Resources for the Future: Washington, DC, USA, 2024. [Google Scholar]
  3. Hou, H.; Lu, W.; Liu, B.; Hassanein, Z.; Mahmood, H.; Khalid, S. Exploring the role of fossil fuels and renewable energy in determining environmental sustainability: Evidence from OECD countries. Sustainability 2023, 15, 2048. [Google Scholar] [CrossRef]
  4. Li, Y.; Li, G.; Cui, Y.; Deng, W.; Wang, B.; Li, H.; Feng, Y.; Meng, H. The influence of multi-body interaction on the hydrodynamic performance of a hexagon-type floating photovoltaic. Ocean. Eng. 2024, 312, 119302. [Google Scholar] [CrossRef]
  5. Zhang, P.; Li, Y.; Tang, Y.; Zhang, R.; Li, H.; Gu, J. Multi-objective optimization and dynamic response predictions of an articulated offshore wind turbine. Ocean. Eng. 2023, 273, 114017. [Google Scholar] [CrossRef]
  6. Li, Y.; Zhu, Q.; Liu, L.; Tang, Y. Transient response of a SPAR-type floating offshore wind turbine with fractured mooring lines. Renew. Energy 2018, 122, 576–588. [Google Scholar] [CrossRef]
  7. Li, H.; Li, Y.; Li, G.; Zhu, Q.; Wang, B.; Tang, Y. Transient tower and blade deformations of a Spar-type floating wind turbine in freak waves. Ocean. Eng. 2024, 294, 116801. [Google Scholar] [CrossRef]
  8. Yolcan, O.O. World energy outlook and state of renewable energy: 10-Year evaluation. Innov. Green Dev. 2023, 2, 100070. [Google Scholar] [CrossRef]
  9. Zeng, X.; Shao, Y.; Feng, X.; Xu, K.; Jin, R.; Li, H. Nonlinear hydrodynamics of floating offshore wind turbines: A review. Renew. Sustain. Energy Rev. 2024, 191, 114092. [Google Scholar] [CrossRef]
  10. Su, O.; Li, Y.; Li, G.; Cui, Y.; Li, H.; Wang, B.; Meng, H.; Li, Y.; Liang, J. Nonlinear harmonic resonant behaviors and bifurcation in a Two Degree-of-Freedom Duffing oscillator coupled system of Tension Leg Platform type Floating Offshore Wind Turbine. Chaos Solitons Fractals 2024, 189, 115656. [Google Scholar] [CrossRef]
  11. Cui, Y.; Li, Y.; Li, G.; Feng, Y.; Li, H.; Wang, B.; Meng, H.; Deng, W. Dynamic response and nonlinear resonance of cylindrical FPSO with a ring groove considering time-varying restoring stiffness. Ocean. Eng. 2025, 325, 120857. [Google Scholar] [CrossRef]
  12. Salehyar, S.; Li, Y.; Zhu, Q. Fully-coupled time-domain simulations of the response of a floating wind turbine to non-periodic disturbances. Renew. Energy 2017, 111, 214–226. [Google Scholar] [CrossRef]
  13. Li, Y.; Li, H.; Wang, Z.; Li, Y.; Wang, B.; Tang, Y. The dynamic response of a Spar-type floating wind turbine under freak waves with different properties. Mar. Struct. 2023, 91, 103471. [Google Scholar] [CrossRef]
  14. Li, Y.; Li, H.; Wang, B.; Meng, H.; Su, O.; Tang, Y. Effects of various freak waves on dynamic responses of a Spar-buoy floating offshore wind turbine. Ocean. Eng. 2024, 311, 118837. [Google Scholar] [CrossRef]
  15. Li, H.; Wang, B.; Li, G.; Cui, Y.; Su, O.; Feng, Y.; Meng, H.; Li, Y. Response analysis of slender structures on a spar-type floating offshore wind turbine under three types of freak waves. Ocean. Eng. 2025, 325, 120867. [Google Scholar] [CrossRef]
  16. Cheng, P.W.; Bierbooms, W.A.A.M. Extreme gust loading for wind turbines during operation. J. Sol. Energy Eng. 2001, 123, 356–363. [Google Scholar] [CrossRef]
  17. Zhou, W.; Zhang, D.; Yang, M. Analysis of extreme operating gust influence on aerodynamic performance of wind turbine. In Proceedings of the 2022 4th International Academic Exchange Conference on Science and Technology Innovation (IAECST), Guangzhou, China, 9–11 December 2022; pp. 9–13. [Google Scholar]
  18. Kanev, S.; van Engelen, T. Wind turbine extreme gust control. Wind. Energy Int. J. Prog. Appl. Wind. Power Convers. Technol. 2010, 13, 18–35. [Google Scholar] [CrossRef]
  19. Lakshmanan, K.; Balatti, D.; Khodaparast, H.H.; Friswell, M.I.; Castrichini, A. Experimental and numerical gust identification using deep learning models. Appl. Math. Model. 2024, 132, 41–56. [Google Scholar] [CrossRef]
  20. Alam, K.; Ullah, H.; Iqbal, M.; Husain, A.; Rasul, A.; Iqbal, M. Structural integrity of offshore wind turbine blade under extreme gust and normal operating conditions. Results Eng. 2025, 25, 104572. [Google Scholar] [CrossRef]
  21. Wang, H.; Wen, J.; Ma, G.; Yuan, L.; Ran, Q.; Zhang, J.; Zhou, S. Coupled dynamics analysis of floating wind turbine mooring system under extreme operating gust. Appl. Ocean. Res. 2025, 154, 104333. [Google Scholar] [CrossRef]
  22. Zhang, X.; He, L.; Ma, G.; Ma, Q. Mechanism of mooring line breakage and shutdown opportunity analysis of a semi-submersible offshore wind turbine in extreme operating gust. Ocean Eng. 2023, 268, 113399. [Google Scholar] [CrossRef]
  23. He, G.; Xue, J.; Zhao, C.; Cui, T.; Liu, C. Deep learning based short-term motion prediction of floating wind turbine under shutdown condition. Appl. Ocean. Res. 2024, 151, 104147. [Google Scholar] [CrossRef]
  24. Jonkman, J. Definition of a 5-MW Reference Wind Turbine for Offshore System Development; National Renewable Energy Laboratory: Golden, CO, USA, 2009. [Google Scholar]
  25. Jonkman, J.M. Definition of the Floating System for Phase IV of OC3; National Renewable Energy Laboratory: Golden, CO, USA, 2010. [Google Scholar]
  26. Chitteth Ramachandran, R.; Desmond, C.; Judge, F.; Serraris, J.J.; Murphy, J. Floating offshore wind turbines: Installation, operation, maintenance and decommissioning challenges and opportunities. Wind. Energy Sci. Discuss. 2021, 2021, 1–32. [Google Scholar]
  27. Madsen, P.H.; Risø, D.J.R.N.L. Introduction to the IEC 61400-1 Standard; Risø National Laboratory, Technical University of Denmark: Copenhagen, Denmark, 2008. [Google Scholar]
  28. Papi, F.; Jonkman, J.; Robertson, A.; Bianchini, A. Going beyond BEM with BEM: An insight into dynamic inflow effects on floating wind turbines. Wind. Energy Sci. Discuss. 2024, 9, 1069–1088. [Google Scholar] [CrossRef]
  29. Li, Y.; Li, G.; Zhu, Q.; Cui, Y.; Feng, Y.; Su, O.; Li, H.; Wang, B.; Meng, H. Effects of mooring line fracture on 15 MW floating offshore wind turbine under different operation strategies. Eng. Fail. Anal. 2025, 179, 109754. [Google Scholar] [CrossRef]
  30. Wang, S.; Xing, Y.; Balakrishna, R.; Shi, W.; Xu, X. Design, local structural stress, and global dynamic response analysis of a steel semi-submersible hull for a 10-MW floating wind turbine. Eng. Struct. 2023, 291, 116474. [Google Scholar] [CrossRef]
  31. Nematbakhsh, A.; Bachynski, E.E.; Gao, Z.; Moan, T. Comparison of wave load effects on a TLP wind turbine by using computational fluid dynamics and potential flow theory approaches. Appl. Ocean. Res. 2015, 53, 142–154. [Google Scholar] [CrossRef]
  32. Song, Y.; Hong, X.; Zhang, Z.; Sun, T.; Cai, Y. Reliability analysis of floating offshore wind turbine considering multiple failure modes under extreme typhoon-wave condition. Ocean. Eng. 2025, 323, 120564. [Google Scholar] [CrossRef]
  33. Wayman, E.N.; Sclavounos, P.D.; Butterfield, S.; Jonkman, J.; Musial, W. Coupled dynamic modeling of floating wind turbine systems. In Proceedings of the Offshore Technology Conference, Houston, TX, USA, 1–4 May 2006; p. OTC-18287. [Google Scholar]
  34. Sheng, C.; Hong, H.P. Reliability and fragility assessment of offshore floating wind turbine subjected to tropical cyclone hazard. Struct. Saf. 2021, 93, 102138. [Google Scholar] [CrossRef]
  35. Hallowell, S.T.; Arwade, S.R.; Fontana, C.M.; DeGroot, D.J.; Aubeny, C.P.; Diaz, B.D.; .Myers, A.T.; Landon, M.E. System reliability of floating offshore wind farms with multiline anchors. Ocean Eng. 2018, 160, 94–104. [Google Scholar] [CrossRef]
Figure 1. FOWT system and its structural parameters.
Sustainability 17 05655 g001
Figure 2. Global coordinate system diagram of a floating wind turbine and local coordinate system definition diagram of the mooring unit.
Sustainability 17 05655 g002
Figure 3. Unit configuration before and after deformation.
Sustainability 17 05655 g003
Figure 4. The basic strategy of variable speed pitch control.
Sustainability 17 05655 g004
Figure 5. EOG model validation with Zhang et al. [22].
Sustainability 17 05655 g005
Figure 6. FOWT model validation with Li et al. [13].
Sustainability 17 05655 g006
Figure 7. Time series of wind speed and generator speed during an EOG event.
Sustainability 17 05655 g007aSustainability 17 05655 g007b
Figure 8. Time series of pitch angle and generator speed.
Sustainability 17 05655 g008
Figure 9. Time series of surge motion under EOG with different cases.
Sustainability 17 05655 g009
Figure 10. Frequency domain of surge motion under EOG with different cases.
Sustainability 17 05655 g010
Figure 11. Time series of heave motion under EOG with different cases.
Sustainability 17 05655 g011
Figure 12. Frequency domain of heave motion under EOG with different cases.
Sustainability 17 05655 g012
Figure 13. Time series of pitch motion under EOG with different cases.
Sustainability 17 05655 g013
Figure 14. Frequency domain of pitch motion under EOG with different cases.
Sustainability 17 05655 g014
Figure 15. Time series of mooring line #1 tension under EOG with different cases.
Sustainability 17 05655 g015
Figure 16. Frequency domain of mooring line #1 tension under EOG with different cases.
Sustainability 17 05655 g016
Figure 17. Time series of mooring line #2 tension under EOG with different cases.
Sustainability 17 05655 g017
Figure 18. Frequency domain of mooring line #2 tension under EOG with different cases.
Sustainability 17 05655 g018
Table 1. Structural parameters of a Spar-type FOWT.
Wind Turbine System
Rated power5 MWRated wind speed11.4 m/s
Shaft transmission efficiency0.944Cut-out wind speed25 m/s
Radius of wind wheel63 mRated speed12.1 rpm
Radius of hub1.5 mHub height90 m
Cut-in wind speed3 m/sMetacenter location64.0 m
Buoy system
Depth to platform base below the Mean Stillwater Line (MSL)120.0 mPlatform diameter below taper9.4 m
Elevation to platform top above the MSL10.0 mPlatform mass, including ballast7,466,330 kg
Depth to top of taper below the MSL4.0 mCM location below the MSL along platform centerline89.9155 m
Depth to bottom of taper below the MSL12 mNumber of mooring lines3
Platform diameter above taper6.5 mAngle between adjacent lines120 deg
Mooring line system
Mooring line diameter0.09 mMooring Line Weight in Water698.094 N/m
Mooring Line Mass Density77.7066 kg/mMooring Line Extensional Stiffness384,243,000 N
Table 2. Parameters of rated sea state for validation.
ParameterValue
Steady Wind speed11.4 m/s
Wave SpectrumJONSWAP
Significant Wave Height6 m
Peaked Period10 s
Peakedness Parameter3.3
Inflow Direction0 deg
Table 3. Comparison of statistical results with Li et al. [13].
ResponseResearcherMeanMaxMin
Surge/mOur work22.2728.6417.11
Li et al.22.5028.3517.51
Heave/mOur work−0.300.02−0.60
Li et al.−0.310.06−0.65
Pitch/degOur work4.376.012.91
Li et al.4.415.612.64
Mooring line #2 tension/kNOur work1110.261358.10880.42
Li et al.1116.361354.20925.21
Table 4. Statistics of surge motion results of the floating platform.
WindWind Turbine State
Case 1Steady windOperation
Case 2EOGOperation
Case 3EOGShutdown
Table 5. Statistics of surge motion results of the floating platform.
Mean/mMax/mMin/mStd/m
Case 122.1828.3617.512.12
Case 221.4128.994.314.00
Case 39.3728.36−8.3811.34
Table 6. Statistics of heave motion results of the floating platform.
Mean/mMax/mMin/mStd/m
Case 1−0.300.06−0.650.12
Case 2−0.281.58−1.570.40
Case 3−0.011.44−0.820.35
Table 7. Statistics of pitch motion results of the floating platform.
Mean/degMax/degMin/degStd/deg
Case 14.375.992.420.57
Case 24.2110.52−7.271.84
Case 31.756.09−4.402.32
Table 8. Statistics of tension results of mooring line #1.
Mean/kNMax/kNMin/degStd/deg
Case 1475.48631.61314.7645.37
Case 2485.67724.03302.8560.13
Case 3671.161135.5349.69188.27
Table 9. Statistics of tension results of mooring line #2.
Mean/kNMax/kNMin/degStd/deg
Case 11107.841376.60877.2577.55
Case 21099.331376.60824.8992.45
Case 3942.321376.60632.56165.58
Disclaimer/Publisher’s Note: The statements, opinions and data contained in all publications are solely those of the individual author(s) and contributor(s) and not of MDPI and/or the editor(s). MDPI and/or the editor(s) disclaim responsibility for any injury to people or property resulting from any ideas, methods, instructions or products referred to in the content.

