Article

Spatiotemporal Dynamics of the Grassland Cover in Xinjiang, China, from 2000 to 2023

1
Department of Ecology and Meteorology, College of Forestry, Inner Mongolia Agricultural University, Hohhot 010020, China
2
Hohhot Meteorological Bureau, Hohhot 010020, China
*
Author to whom correspondence should be addressed.
These authors contributed equally to this work.
Sustainability 2025, 17(12), 5654; https://doi.org/10.3390/su17125654
Submission received: 19 May 2025 / Revised: 10 June 2025 / Accepted: 13 June 2025 / Published: 19 June 2025

Abstract

A systematic understanding of the spatial and temporal changes of grassland fractional vegetation cover (FVC) in Xinjiang and its drivers provide scientific reference for regional ecological restoration. In this study, we used MODIS EVI data from 2000 to 2023 and the Pixel binary model to estimate the grassland FVC value of Xinjiang; analyze its spatiotemporal dynamics with combination of trend and persistence detection methods; and explore its driving factors with ridge regression and residual analysis. The results show the following: (1) From 2000 to 2020, the grassland FVC in Xinjiang experienced an upward trend on the whole, yet a significant decrease after 2020. Spatially, the distribution characteristics are high in the northwest and low in the southeast, decreasing from mountains to basins. (2) Precipitation and soil moisture affected FVC positively, with contributions of 18.6% and 38.3%, respectively, while air temperature and solar radiation affected it negatively, with contributions of 22.9% and 20.2%, respectively. (3) The change in the grassland FVC in Xinjiang resulted from a combination of climatic factors and human activity, whose relative contribution rates were 57.2% and 42.8%, respectively; furthermore, the areas with positive effects on the FVC were smaller than those with negative effects. (4) While the FVCs of most grassland types in Xinjiang were dominantly influenced by both climatic factors and human activity, climatic conditions were the dominant drivers of the FVCs of temperate typical grasslands and temperate desert grasslands, whereas human activities had more influence on the FVC of temperate meadow grasslands. This study provides a scientific basis and guidance for optimizing the ecological barrier function and regulating vegetation coverage in arid areas by analyzing the spatiotemporal dynamics of grassland coverage in Xinjiang and quantifying the impact of different environmental factors on it.

1. Introduction

Grasslands are a widely distributed land cover class, which plays a crucial role among terrestrial ecosystems [1]. Grassland ecosystems are integral to the global carbon cycle and also offer vital services such as net primary productivity, carbon sequestration, and biodiversity conservation [2]. Vegetation constitutes a fundamental component of grassland ecosystems, where changes in its cover serve as sensitive indicators of environmental change rather than primary drivers. Fractional vegetation cover (FVC) refers to the ratio of vegetation’s above-ground vertical projection area to the total surface area within a given unit [3]. It has been widely utilized in ecological environmental assessment and other research. The accurate tracking of the dynamic evolution in grassland FVC in a timely manner offers a significant scientific and theoretical reference for environmental quality assessment and ecological security.
Remote sensing, as the cornerstone of modern Earth observation, has evolved into a vital tool for monitoring grassland dynamics across extensive regions [4]. Remote sensing techniques are utilized for long-term grassland change detection, providing not only rapid access to real-time and large-scale research results but also a decision-making basis for grassland conservation [5]. The Normalized Difference Vegetation Index (NDVI) has become the main method for studying vegetation coverage, which can monitor the growth status, coverage and health status of vegetation [6]. Although NDVI well in capturing vegetation dynamics across many regions, it struggles to eliminate the influence of soil background and atmospheric noise [7]. The enhanced vegetation index (EVI), based on the difference in aerosol sensitivity between blue and red light bands, can further reduce the effects of aerosols and soil background in conjunction with the principles of the ‘atmospherically resistant vegetation index’ and the ‘soil adjusted vegetation index’ [8]. Besides overcoming the limitations of the NDVI, the EVI can also characterize FVC more accurately than the NDVI during the vegetation growth period [9].
Current research on the spatiotemporal dynamics of grassland FVC and its driving factors has made significant progress both domestically and internationally. Remote sensing techniques are widely employed to monitor long-term changes and delve into the impacts of climate and human. For instance, research in Iran [10] and Xilin River Basin [11] based on long-term data series and geospatial analysis has revealed the sensitivity of FVC to climate fluctuations in arid/semi-arid regions and the significant role of human activities. Studies on the Tibetan Plateau [2,12] further elucidated the seasonal response differences in alpine grasslands to climatic factors (especially rising temperatures) and the potential impacts of CO₂ fertilization and warming on future FVC changes across various grassland types. Moreover, Shen et al.’s work in China’s temperate grasslands highlighted the modulating effect of grassland types (e.g., desert steppe vs. meadow) on surface temperature feedback, demonstrating the importance of biome-specific responses [5]. However, existing research predominantly relies on the NDVI, which suffers from saturation in densely vegetated areas and sensitivity to canopy background and atmospheric noise [13], potentially limiting its accuracy in capturing FVC dynamics.
Located in north-west China, Xinjiang is characterized by arid to semi-arid conditions and stands as one of the most climate-sensitive regions globally, with abundant grassland resources [14]. Due to the recent trends of global warming, coupled with the human impacts of overloaded grazing and land reclamation, Xinjiang grasslands have been experiencing substantial ecological challenges, such as desertification, creating serious challenges for both Xinjiang’s ecological stability and its economic growth. Studies on vegetation cover in Xinjiang have gained wide attention in recent years. Among them, Liu et al. [15] investigated the spatiotemporal characteristics and drivers of FVC in 11 sub-ecosystems in Xinjiang from 1982 to 2013 by using NDVI; Using remote vegetation data, Li et al. [16] investigated the spatiotemporal variation and influencing factors of FVC across different eco-regions in Xinjiang. Liang et al. [17] examined the vegetation–climate relationships in Xinjiang with LAI. Existing research on FVC across Xinjiang predominantly relies on the NDVI for large-scale assessments. However, the spatial heterogeneity of vegetation distribution within Xinjiang is significant. Regions such as the Tianshan Mountains and Tacheng Prefecture possess abundant vegetation resources and also present relatively high grassland coverage [18]. Due to the inherent characteristics and limitations of the NDVI, it fails to accurately reflect the spatiotemporal dynamics of FVC in densely vegetated grassland areas. Furthermore, while conventional approaches like multiple regression and partial correlation are often used to explore the driving forces behind FVC, these approaches exhibit limitations when handling multicollinearity and high-dimensional data, particularly given the strong correlations among climate variables. Therefore, in this study, we employ ridge regression to quantify the contribution of individual driving factors to FVC changes [19]. Building upon previous research, we introduce the following key improvements: (1) Adoption of the EVI in lieu of the NDVI. The EVI, with its refined algorithm (incorporating atmospheric resistance correction factors and reducing background noise influence), allows one to effectively overcome the saturation problem inherent to the NDVI in areas with high vegetation cover. It also enhances data quality under varying atmospheric conditions [20], providing a more robust foundation for the accurate retrieval and analysis of FVC spatiotemporal dynamics. (2) Integration of multiple advanced analytical methods. This research study combines temporal analysis, spatial statistics, and climate attribution modeling. This integrated approach aims to systematically disentangle the impact of complex interactions among multiple drivers—including climate change, human activities, and grassland types—on FVC variations. This methodology addresses the shortcomings of studies relying on single methods or focusing on isolated driving factors, thereby offering a more comprehensive and nuanced scientific basis for assessing grassland degradation, identifying restoration potential, and informing adaptive management strategies.
In this study, we integrated trend analysis (Theil–Sen) combined with the mutation point test (M–K test), and persistence detection (Hurst) to analyze the spatiotemporal dynamics based on EVI data; further, ridge regression and residual analysis were employed to quantify the respective impacts of meteorological factors and human activity on FVC. We aimed to analyze the spatiotemporal dynamics of overall grassland FVC in Xinjiang from 2000 to 2023, investigate the driving mechanism of climatic and anthropogenic factors, and analyze the development trend of the forecasting period, providing critical theoretical and practical insights for evaluating the environmental quality of ecosystems and regulating ecological processes.

2. Research Area Overview

Situated in China’s northwest frontier, Xinjiang lies at the crossroads of Central and East Asia (73°40′–96°23′ E, 34°22′–49°10′ N). The region has a complex topography with significant elevation differences, and the natural conditions form two typical mountain–basin systems starting from the Kunlun Mountains in the south and extending to the Tianshan Mountains and Altay Mountains in the north [21] (Figure 1a). The region’s elevation ranges from −183 to 8483 m a.s.l. The unique hydrothermal conditions have created a special climate pattern [22]. Xinjiang has typical temperate continental climate characteristics, i.e., large temperature variability, abundant sunshine, and scarce annual precipitation (about 150 mm). The region is rich in grassland resources and possesses a vast grassland area. Its agriculture and animal husbandry are in a leading position in China [21]. Xinjiang contains two grassland categories encompassing eight distinct vegetation forms, as illustrated in Figure 1b [23].

3. Data Acquisition and Preprocessing

The EVI data were derived from the MOD13Q1 dataset provided by NASA [24]. The spatial resolution and temporal resolution of the EVI dataset provided by this dataset are 250 m and 16 days, respectively. Based on the Google Earth Engine, the raw EVI data were pre-processed by using mask extraction (Xinjiang region), format conversion (TIFF.), and reprojection (WGS84) (Table 1).
Meteorological data including month-by-month precipitation, maximum and minimum temperatures, solar radiation, and soil moisture data from 2000 to 2023 were obtained from the TerraClimate dataset [25]. TerraClimate provides global monthly scale climate data with a spatial resolution of 4 km from 1958. Based on the GEE platform, the meteorological data were processed as follows: (1) the annual cumulative precipitation was calculated by summing up the monthly precipitation; (2) The average annual temperature is calculated by the average of monthly maximum temperature and minimum temperature; (3) The average annual solar radiation and soil moisture are calculated from the monthly data. The processed meteorological data were consistent with the EVI data in terms of temporal resolution (years) and projection system (WGS84) for subsequent driver analyses (Table 1).
The grassland distribution data were obtained from the CNLUCC dataset [26] and the 1:100,000 China Vegetation Atlas [23]. The CNLUCC dataset is generated based on the manual visual interpretation of Landsat images and provides national-scale multi-period land use information. The grassland-type layer was extracted from the Atlas by using ArcGIS and reprojected onto the WGS84 coordinate system to match the EVI data, allowing for the construction of a spatial database of Xinjiang’s grassland types (Table 1).
Elevation information was obtained from the SRTM dataset [27]. The spatial resolution of the dataset is 30 m, and the vertical error is less than 16 m, providing high-precision basic data for terrain analysis (Table 1).

4. Research Methodology

4.1. Maximum Value Synthesis Method

Maximum value compositing (MVC) is a widely used method in remote sensing for processing time-series vegetation indices. By selecting the maximum value of vegetation indices within a given time window, MVC effectively reduces the effects of atmospheric disturbances, cloud cover, and changes in observation angles, thus improving the quality of time-series data and reflecting the dynamics of vegetation growth [28,29], calculated as follows:
M V C ( x , y ) = max E V I 1 ( x , y ) , E V I 2 ( x , y ) , , E V I n ( x , y )
where MVC(x,y) represents the maximum EVI of image element (x,y) during the synthesis period, EVIn(x,y) denotes the EVI value at the n-th time point, n represents the quantity of observations contained within the designated time series.

4.2. Pixel Binary Model

The pixel binary model estimates FVC through spectral mixture analysis, assuming that each pixel is composed of pure vegetation and pure soil [30]. The formula is as follows:
F V C = E V I E V I s o i l E V I v e g E V I s o i l
where EVI represents the EVI value of the current pixel, EVIsoil represents the EVI value of pure-soil pixels (taking the 0.5% quantile of the cumulative distribution), and EVIveg represents the EVI value of pure-vegetation pixels (taking the 99.5% quantile of the cumulative distribution).
The grassland FVC in Xinjiang was classified into five classes: I (very low, 0 ≤ FVC ≤ 0.2), II (low, 0.2 < FVC ≤ 0.4), III (medium, 0.4 < FVC ≤ 0.6), IV (high, 0.6 < FVC ≤ 0.8), and V (very high, 0.8 < FVC ≤ 1) [31].

4.3. Analysis on the Changing Trend of FVC in Grassland

The Theil–Sen median trend analysis is a non-parametric statistical method for estimating the long-term trend of FVC by calculating the median slope (Q) of all two-by-two combinations in a time series. Compared with traditional least squares regression, this method is more robust to outliers and non-normal data distributions [32,33]. Its formula is
Q = m e d i a n x j x i j i (   1   <   i   <   n   )
where Q represents the median slope of the interannual change in FVC, xi and xj are time variables, and yi and yj are the FVC observations at those time points, respectively.
The Mann–Kendall test is a non-parametric statistical method for detecting the significance of trends in time series; it is robust to non-normality, non-linearity, and seasonal variations and is widely used in climatic, environmental, and hydrological studies [34].
Given the time series [x1, x2,…,xn], the calculation of the MK statistic S is as follows:
S = i = 1 n 1 j = i + 1 n sgn ( x j x i )
The sign function sgn(xjxi) in the formula is defined as
sgn ( x j x i ) = + 1 i f   x j x i > 0 , 0 i f   x j x i = 0 , 1 i f   x j x i < 0 .
where xi and xj represent data points in the time series, and n is the length of the time series. The statistic S is used to determine the direction of the trend: S > 0 indicates the presence of an upward trend, and S < 0 indicates the presence of a downward trend.
The statistic Z is calculated by standardizing S and performing a significance test as follows:
Z = S 1 V a r ( S ) i f   S > 0 , 0 i f   S = 0 , S + 1 V a r ( S ) i f   S < 0 .
Here, Z follows a standard normal distribution and is used for significance testing.
In this study, the significance of FVC changes in Xinjiang grassland was classified into nine categories based on the Mann–Kendall test (Table 2).

4.4. Hurst Exponent

The Hurst exponent is widely used to predict future vegetation change trends [35]. Its formula is as follows:
F V C ( p ) = 1 p · i = 1 p F V C ( n )
In the formula, FVC(n) represents the FVC values in the time series (n = 1, 2, …, N), and FVC(p) represents the defined mean sequence, where p is any positive integer (p ≥ 1).
The cumulative deviation series is calculated as follows:
F V C ( n , p ) = t = 1 t F V C ( i ) F V C ( p )
In the formula, FVC(n,p) represents the cumulative deviation series, reflecting the mean deviation accumulated over time.
The calculation of range sequence R(p) and standard deviation sequence S(p) is as follows:
R ( p ) = max 1 n p F V C n , p - min 1 n p F V C ( n , p )
S ( p ) = 1 p t = 1 p F V C ( t ) F V C ( p ) 2
Finally, the Hurst index (H) is obtained with linear regression analysis.
R ( p ) S ( p ) = ( p ) H
In this study, the Hurst index was used to classify the persistence of FVC changes in Xinjiang grasslands into four categories: anti-persistence increase, persistence increase, anti-persistence decrease, and persistence decrease (Table 3).

4.5. Partial Correlation Analysis

Partial correlation analysis is a method used to investigate the linear relationship between two variables while controlling for the effects of other potentially confounding variables. Partial correlation analysis can reveal more accurate and independent relationships between variables by eliminating these confounding effects [36].
Firstly, the Pearson correlation coefficient of each pair of variables was calculated by using the following formula:
r x i x j = ( x i x ¯ i ) ( x j x ¯ j ) ( x i x ¯ i ) 2 ( x j x ¯ j ) 2
In the formula, x1, x2, …, xn represent n variables. For all i, j ∈ [1, 2, …, n], rxiyj represents the Pearson correlation coefficient between variables xi and xj.
Then, all Pearson correlation coefficients are input into an n × n correlation matrix R with the following structure:
R = 1 r x 1 x 2 r x 1 x 2 r x 1 x n r x 1 x 2 1 r x 2 x 3 r x 2 x n r x 1 x 3 r x 2 x 3 1 r x 3 x n r x 1 x n r x 2 x n r x 3 x n 1
Then, the inverse matrix (R1) of correlation matrix R is calculated and denoted by Q. The elements of matrix Q are represented as qij. The partial correlation coefficient between xi and xj after controlling for the effects of the other n2 variables is calculated as follows:
r x i x j · x k k i , j = q i j q i i q j j
where qij is the element in the i-th row and j-th column of inverse matrix Q, and qii and qjj are the diagonal elements of Q corresponding to the i-th and j-th rows, respectively.

4.6. Ridge Regression Analysis

Considering that strong correlations among climatic variables may hinder the accurate quantification of their individual effects on grassland fractional vegetation cover (FVC) [37]. We employed ridge regression to address the issue of multicollinearity. Compared with ordinary least squares (OLS) regression, The advantage of ridge regression is that it can effectively deal with multicollinearity problems and obtain more robust coefficient estimates. Using this model, we can also measure the relative contribution of each variable to the dependent variable [38], calculated as follows:
β = ( X T x + λ I ) 1 X T y
where β is the vector of the ridge regression coefficients, representing the influence of each predictor on the response variable. X is the n × p matrix of independent variables, with n indicating the number of samples and p the number of predictors. The dependent variable is represented by the n × 1 vector y. λ is the regularization (ridge) parameter that regulates model complexity, while I refers to the p × p identity matrix.
Each independent variable was standardized by using the following formula to quantify the relationship between grassland FVC and various meteorological factors based on ridge regression:
X n = x x min x max x min
where Xn represents the standardized independent variable, and Xmax and Xmin represent the maximum and minimum values of each independent variable, respectively.
Then, the dependent variable grassland FVC is included in the ridge regression model with the following formula:
Y n = i = 1 n a i x i n + b
where Yn represents the standardized grassland FVC, xin represents the standardized influencing factors, and ai represents the regression coefficient of the influencing factors.
The relative contribution represents the proportion of the total contribution of each independent variable. The formula is as follows:
η r c i = X i _ t r e n d a i Y θ _ t r e n d
where Xi_trend represents the trend of each influencing factor, ai represents the regression coefficients of the influencing factors, Yn_trend represents the trend of the predicted value of FVC, Yθ_trend represents the trend of the actual value of FVC, and ηrci indicates how much the i-th independent variable contributes to the dependent variable.
Furthermore, residual analysis helps quantify the influence of impact of human on FVC dynamics [39], and in this study, residual analysis was introduced into the ridge regression model with the following formula:
H A = Y θ Y n
In the formula, HA represents the residual value, which indicates the impact of human on FVC.
Then, we calculated the relative and absolute contributions of climate and human activities by using the following formulas:
η r C C = i = 1 n X i _ t r e n d a i i = 1 n X i _ t r e n d a i + r e s _ t r e n d
η r H A = r e s _ t r e n d i = 1 n X i _ t r e n d a i + r e s _ t r e n d
In the formula, res_trend represents the trend of the residual values, while ηrCC and ηrHA represent the contributions of climate and human, respectively.
η a C C = Y n _ t r e n d Y θ _ t r e n d
η a H A = r e s _ t r e n d Y θ _ t r e n d
where ηaCC and ηaHA represent the absolute contributions of climate and human activities, respectively.

5. Results

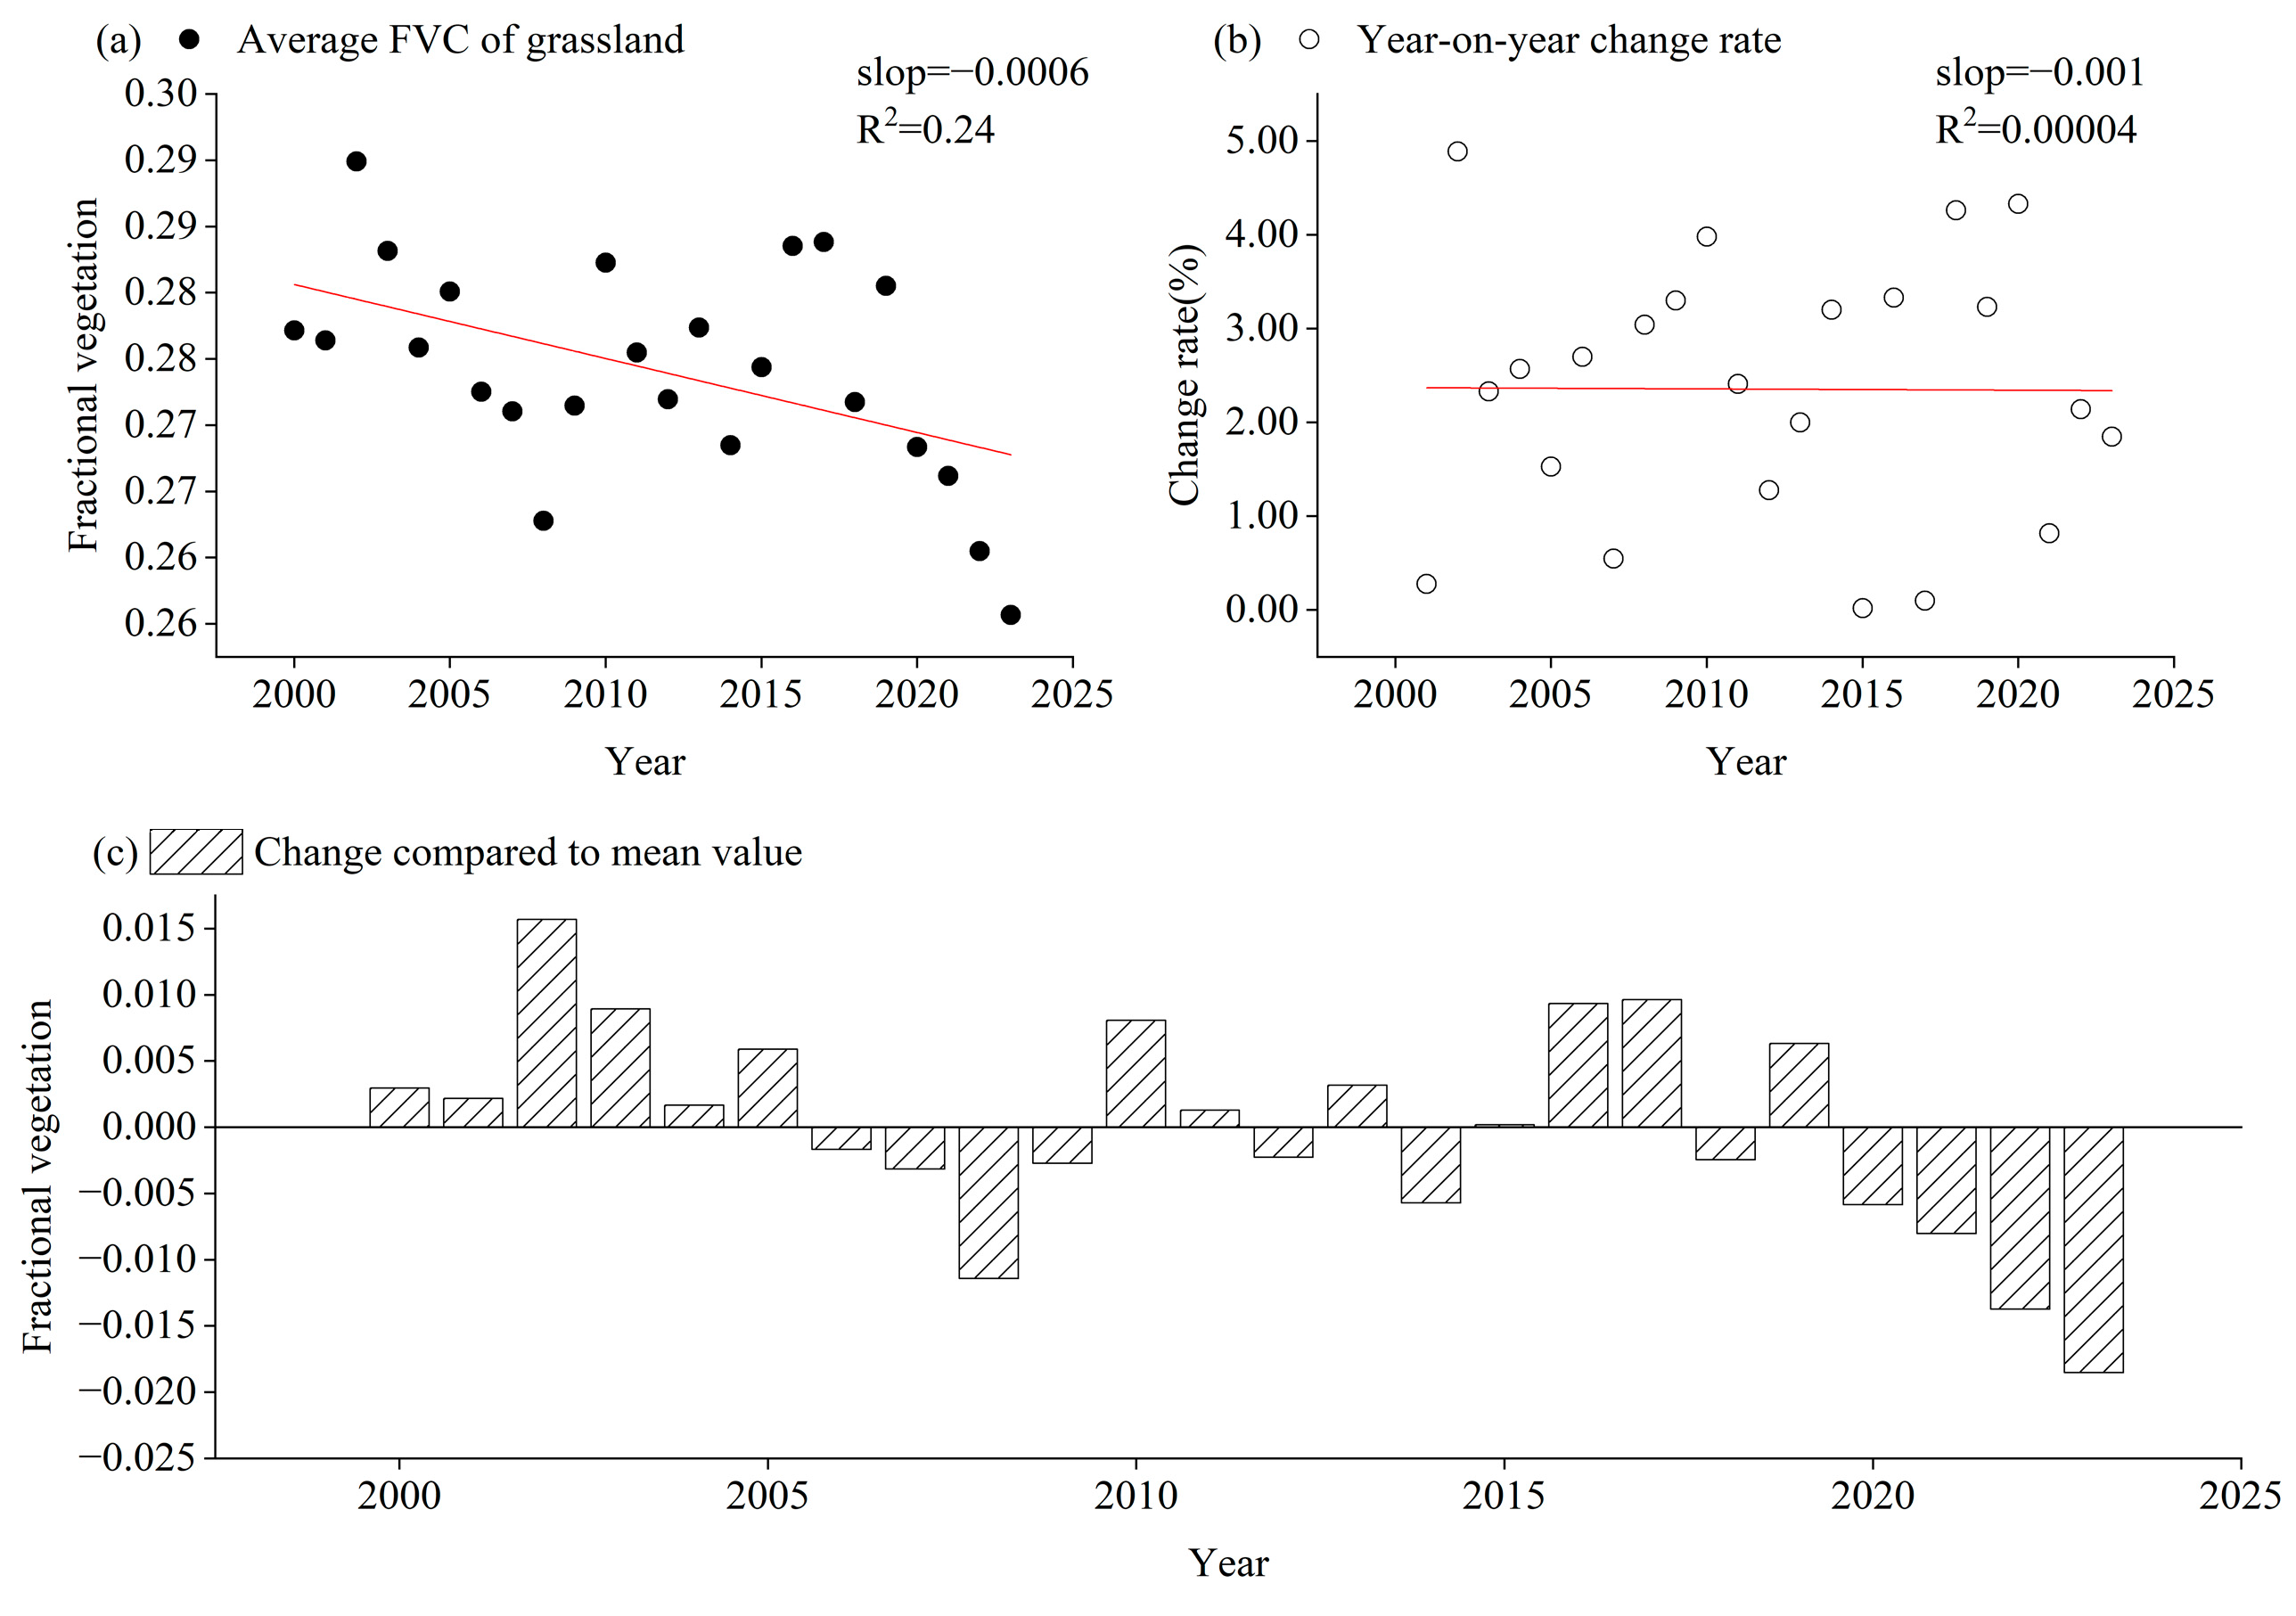
5.1. Temporal Dynamics of Grassland FVC

The temporal changes in annual mean grassland FVC in Xinjiang are shown in Figure 2a. Between 2000 and 2023, grassland FVC in Xinjiang averaged 0.274. It exhibited a fluctuating decline, with an average decrease rate of 0.0006/a. Grassland FVC values were the highest in 2002 at 0.29 and the lowest in 2023 at 0.256. The periods 2002–2009 and 2019–2023 showed a decline in the area of grassland FVC. The interannual fluctuation in grassland FVC in Xinjiang generally showed an increasing trend, but the change trend was not noticeable (Figure 2b). The largest fluctuation was in 2001–2002, with a fluctuation rate of 4.89%, while the smallest fluctuation was in 2014–2015, with a fluctuation rate of 0.02%. From 2000 to 2023, there were 15 years in which the grassland FVC was less than the average FVC and 7 years in which it was greater than the average FVC (Figure 2c). The difference between grassland FVC and mean FVC continued to increase during 2020–2023, reaching a maximum negative difference of −0.02 in 2023.
Figure 3 shows that the differences in FVC among the eight grassland types in Xinjiang are more noticeable, from highest to lowest, the average FVC over multiple years for each grassland type is as follows: TGSSM, 0.67; TGFM, 0.66; TGFS, 0.57; TBTS, 0.35; AKFM, 0.49; TDDS, 0.23; TGFHM, 0.23; and AGSS, 0.22. During the period 2000–2023, the AGSS and TGFHM FVCs showed an increasing trend, while all other grassland types showed a decreasing trend in FVC. Among them, the FVC trends of TGFHM, TGFM, and TGSSM were more pronounced, with TGFHM increasing at an average rate of 0.00185 per year and TGFM and TGSSM decreasing at average rates of 0.00168 and 0.00527 per year.

5.2. Spatial Patterns of Grassland FVC in Xinjiang

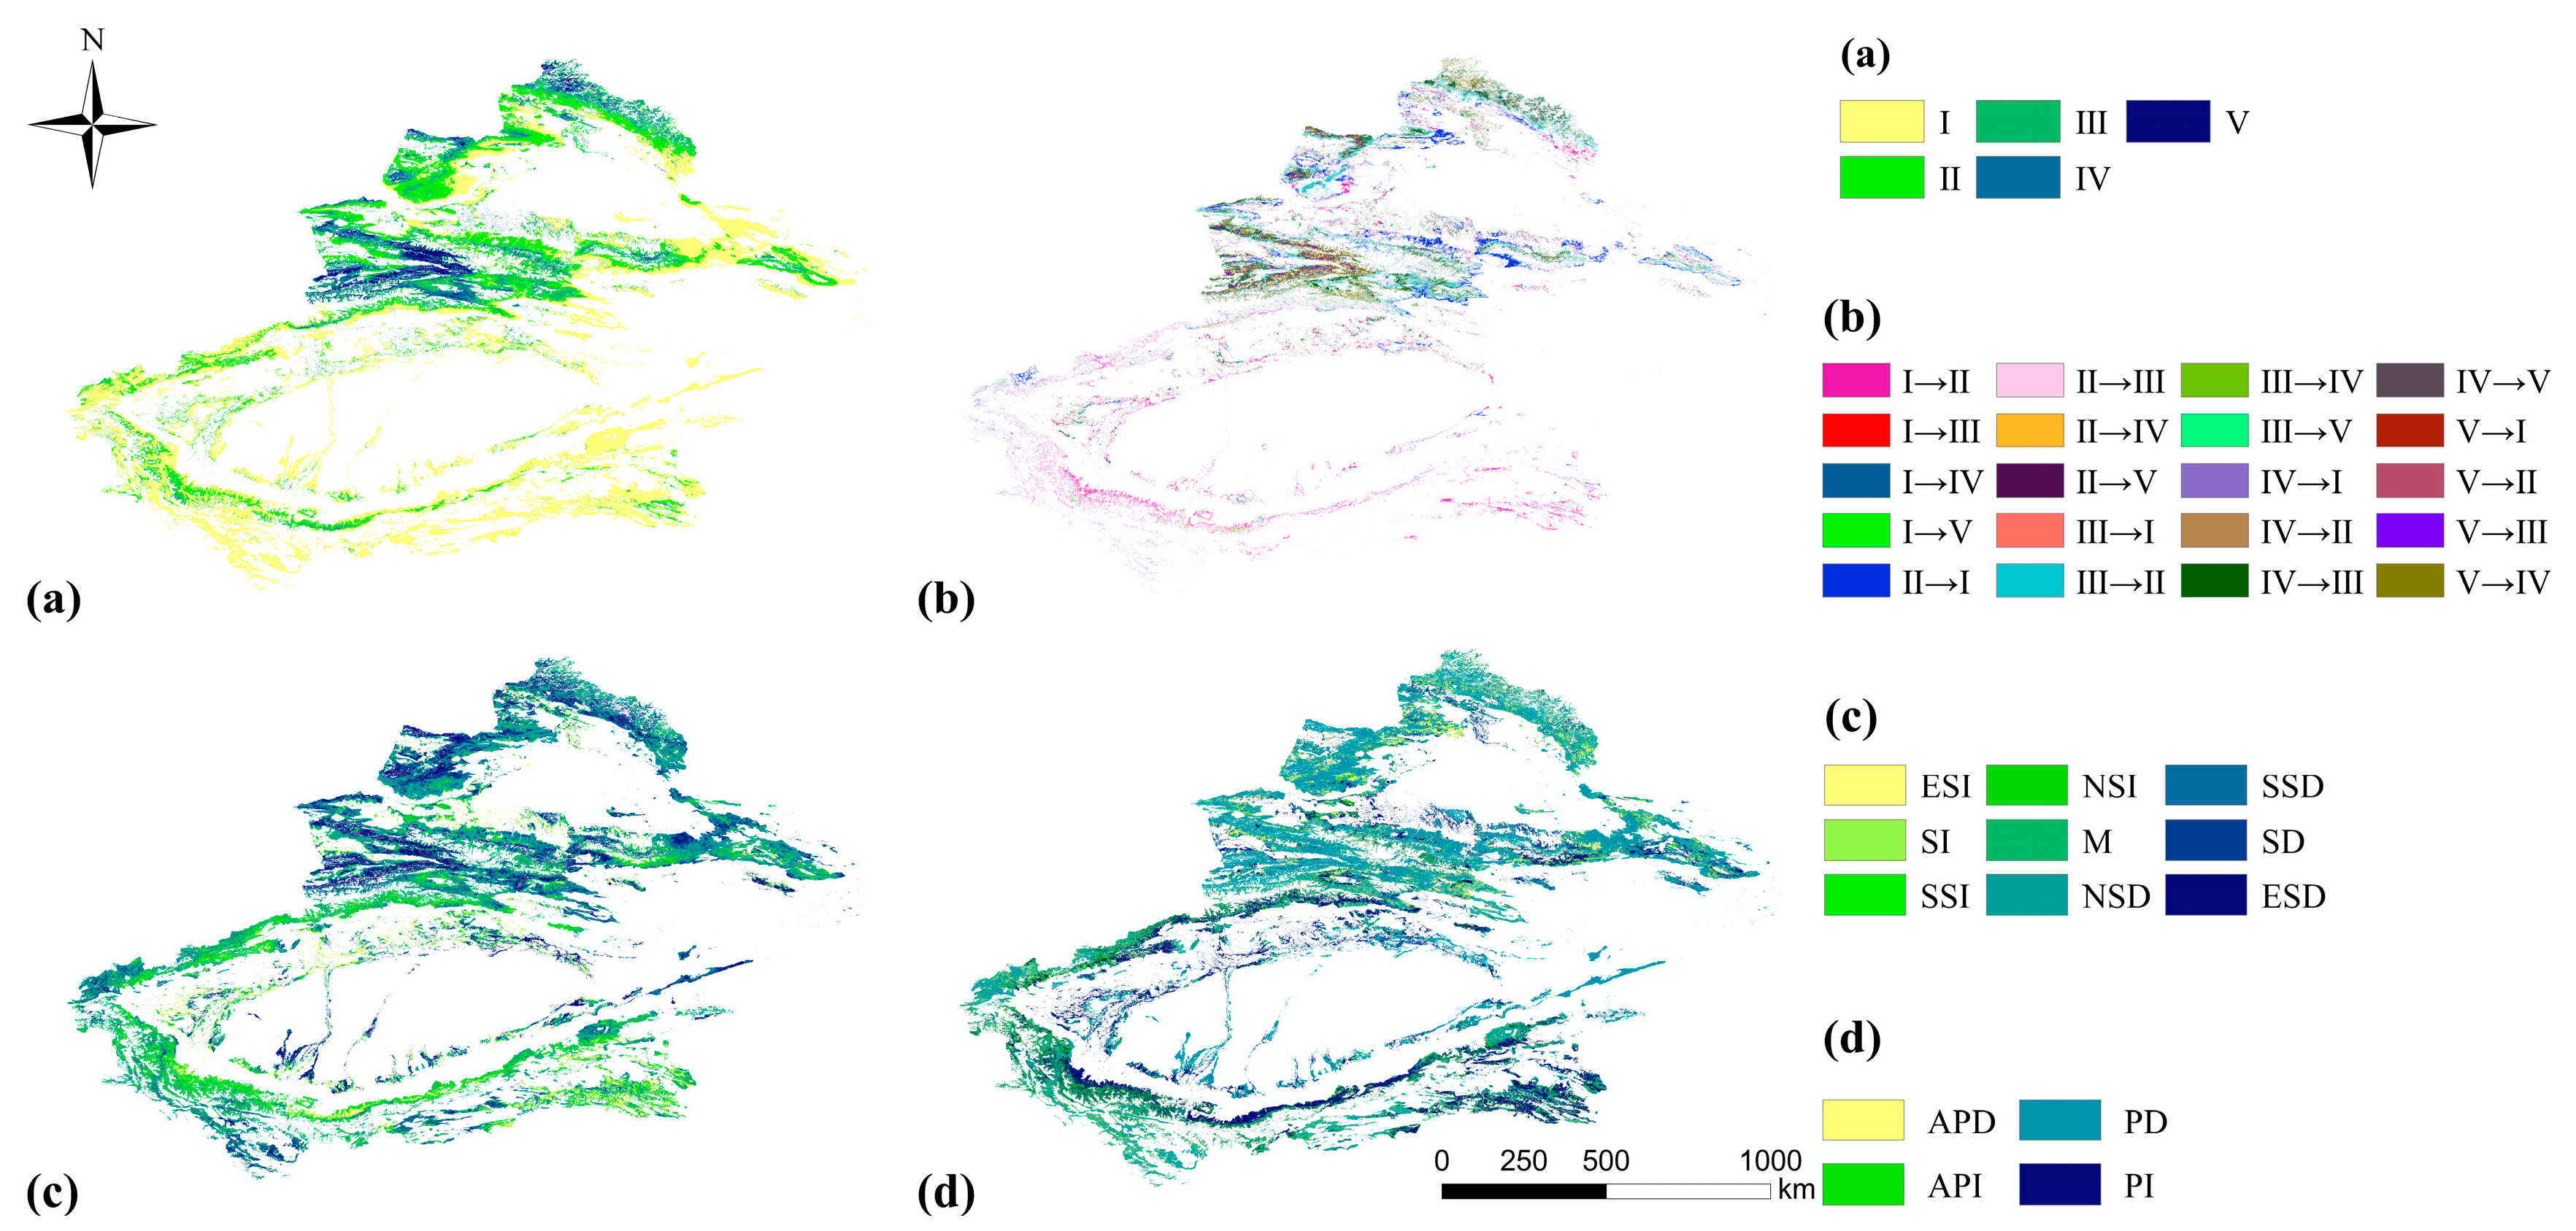
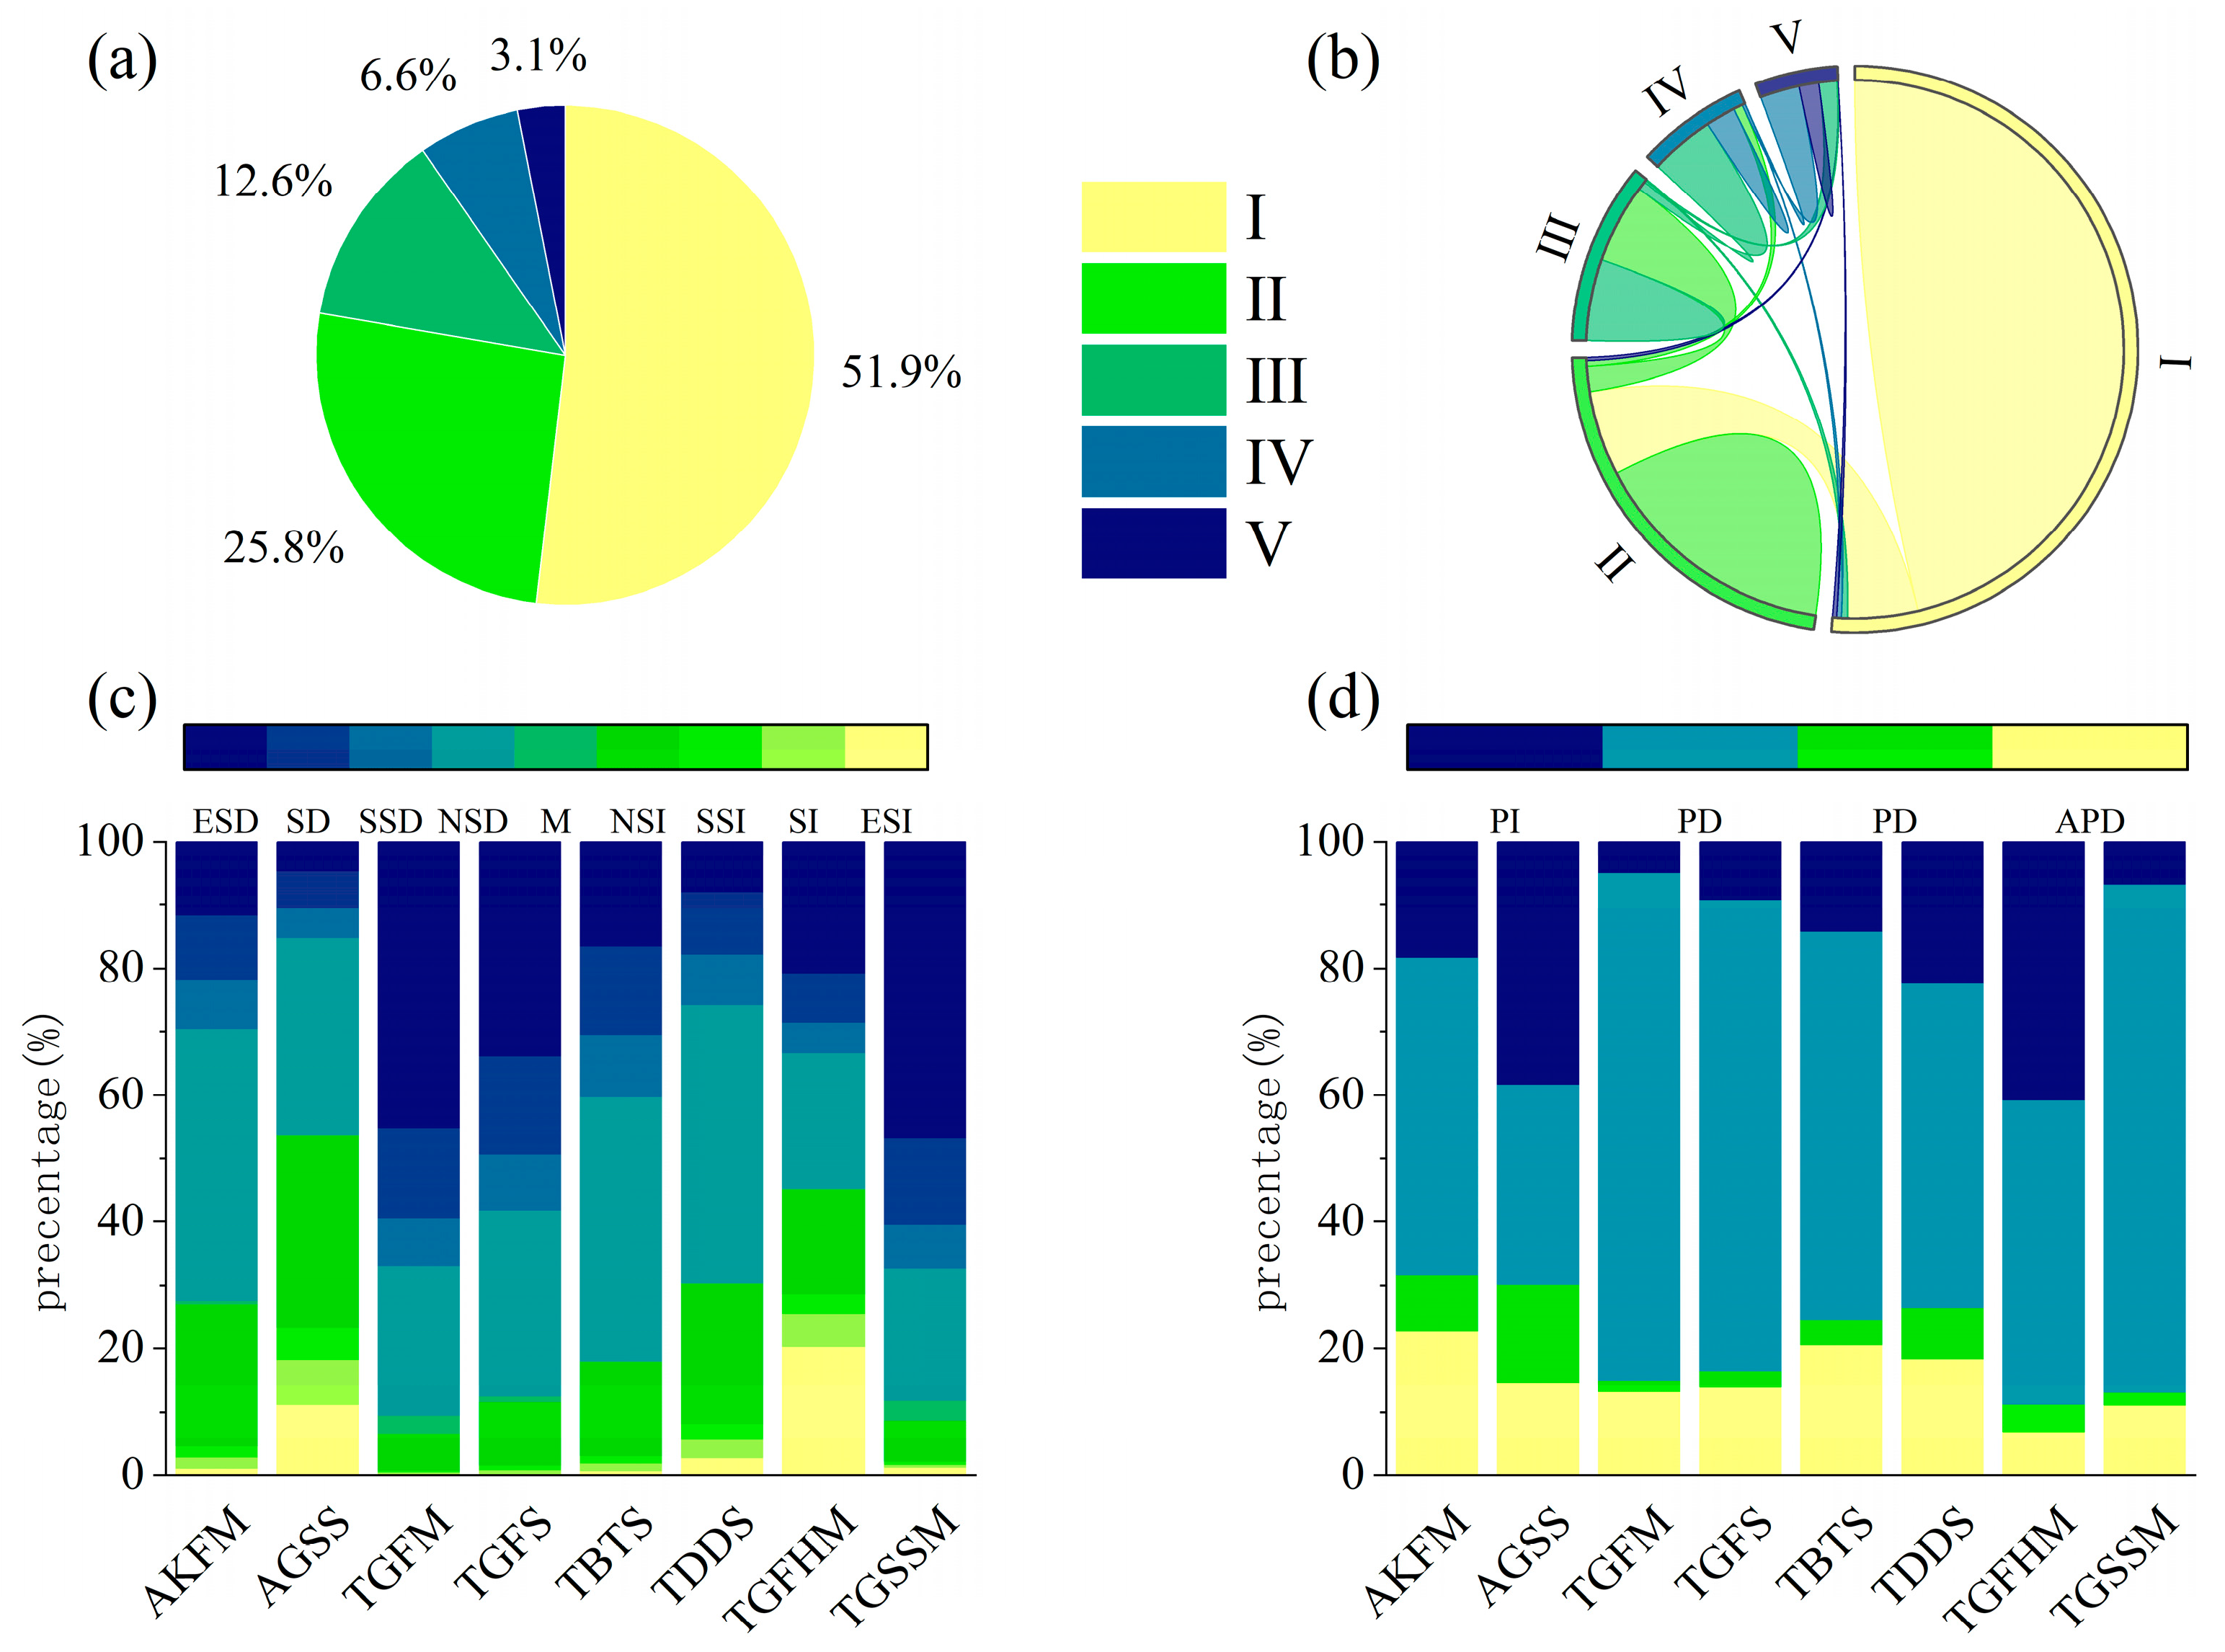
5.2.1. Spatial Distribution of Grassland FVC in Xinjiang

From 2000 to 2023, grassland FVC in Xinjiang exhibited marked spatial heterogeneity (Figure 4a). The decline trend was consistent, moving from the Ili River Basin in the north, southward across the Tianshan, Altai, and Kunlun ranges, to the Junggar and Tarim Basins. The areas with extremely low grassland FVC accounted for 51.9% of the total area and are mainly distributed on the northern slope of the eastern Tianshan Mountains and the edges of the two major basins; Areas with low and moderate grassland fractional vegetation cover (FVC) made up 25.8% and 12.6% of the region respectively, primarily distributed across the Tarim River Basin and transitional zones. In contrast, zones exhibiting high and exceptionally high FVC represented the smallest shares at just 6.6% and 3.1%, with their predominant occurrence in the Ili River Valley, Altai ranges, and Tianshan mountain system. (Figure 5a).

5.2.2. Spatial Changes in Grassland FVC in Xinjiang

Grasslands with moderate and relatively high FVC generally show a trend of degradation, while grasslands with extremely low and low FVC are expanding (Figure 4b). The highest transition rates are observed from extremely high- to high-FVC grasslands (50.4%) and from high- to moderate-FVC grasslands (60%). Only 25.3% and 28.0% of the original states, respectively, are retained. The most significant degradation occurs in the Ili river basin and the Tianshan Mountains. The conversion rate from moderate-FVC grasslands to low-FVC grasslands is the highest, 45.9%. In contrast, the outward conversion rates of low- and extremely low-FVC grasslands are relatively low, 10% and 32.2%, respectively (Figure 5b).
The trend of FVC changes in Xinjiang grassland during the study period showed significant spatial heterogeneity, with the decreasing-trend area (66.7%) being significantly larger than the increasing-trend area (33.9%) (Figure 4c). The upward trend mainly appeared in low-FVC areas such as the edge of the Tarim Basin and the Kunlun Mountains at the southern border, and the downward trend was concentrated in high-FVC areas such as the Ili Valley, the Tianshan Mountains, the Tacheng area, and the Altay Mountains at the northern border. Areas with no significant change accounted for the largest proportion, with areas showing no significant decline nor rise accounting for 34.6% and 20.9% of the grassland area in the whole of Xinjiang, respectively; areas with extremely significant changes were the next most common areas, with extremely significant increases accounting for 14.2% and extremely significant decreases for 6.7%. Areas with significant changes and slight changes were relatively smaller, representing 13.5% and 9.7%, respectively (Figure 5c).

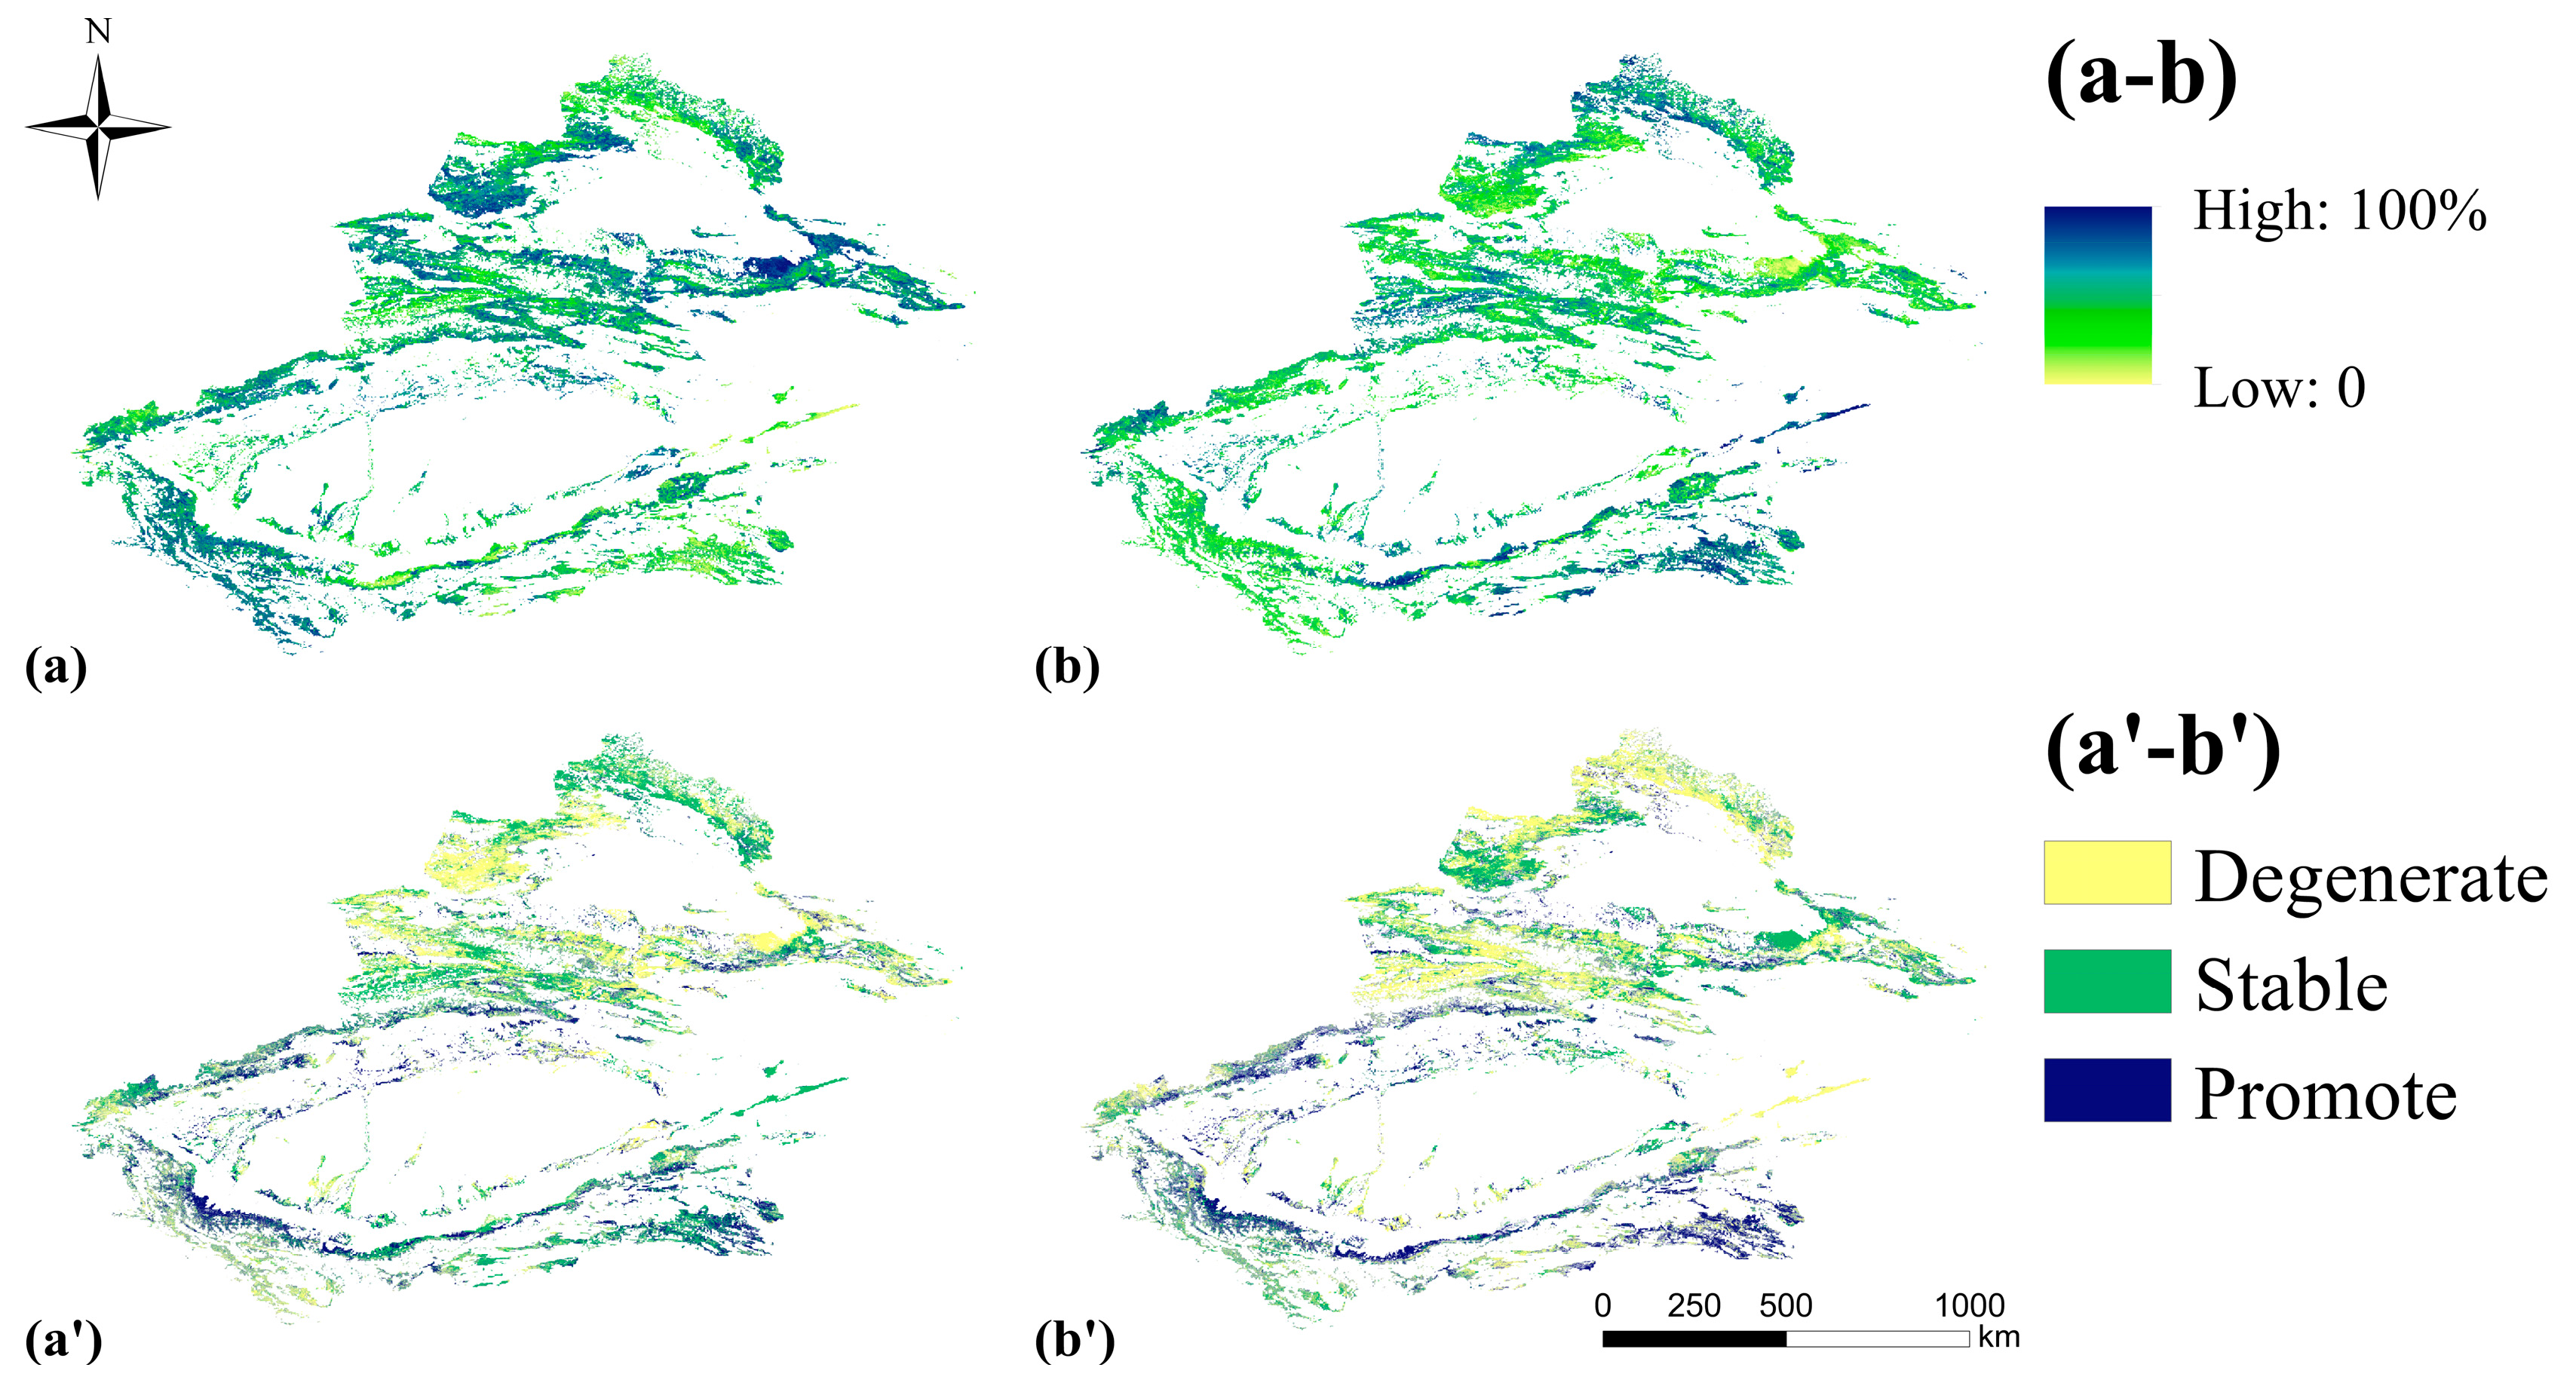
5.2.3. Future Changes in Grassland FVC in Xinjiang

In the future, 16.6% of the grassland FVC with a declining trend is projected to show an inverse sustained decline and 49.5% a sustained decline; regarding the increasing trend, 8.2% of the grassland FVC is projected to show an inverse sustained increase and 25.7% a sustained increase (Figure 4d). In the future, the grassland FVC in Xinjiang will show significant spatial heterogeneity with both increases and decreases; it is especially noteworthy that the high-FVC area at the northern border will continue to degrade, while the low-FVC area at the southern border will show an upward trend (Figure 5d).

5.3. Analysis of Drivers of Grassland FVC Change in Xinjiang

Precipitation, soil moisture, and solar radiation all showed a decreasing trend in Xinjiang from 2000 to 2023, with average decreasing rates of 0.42 mm/a, 0.11 mm/a, and 0.03 W/m2a−1, respectively (Figure 6). On the contrary, temperature showed a fluctuating upward trend, influenced by the warming of the Earth to some extent, with an average annual increase rate of 0.03 /a. The intensity of human activities maintained a relatively stable trend during the observation period as a whole but showed an noticeable upward trend in 2023.

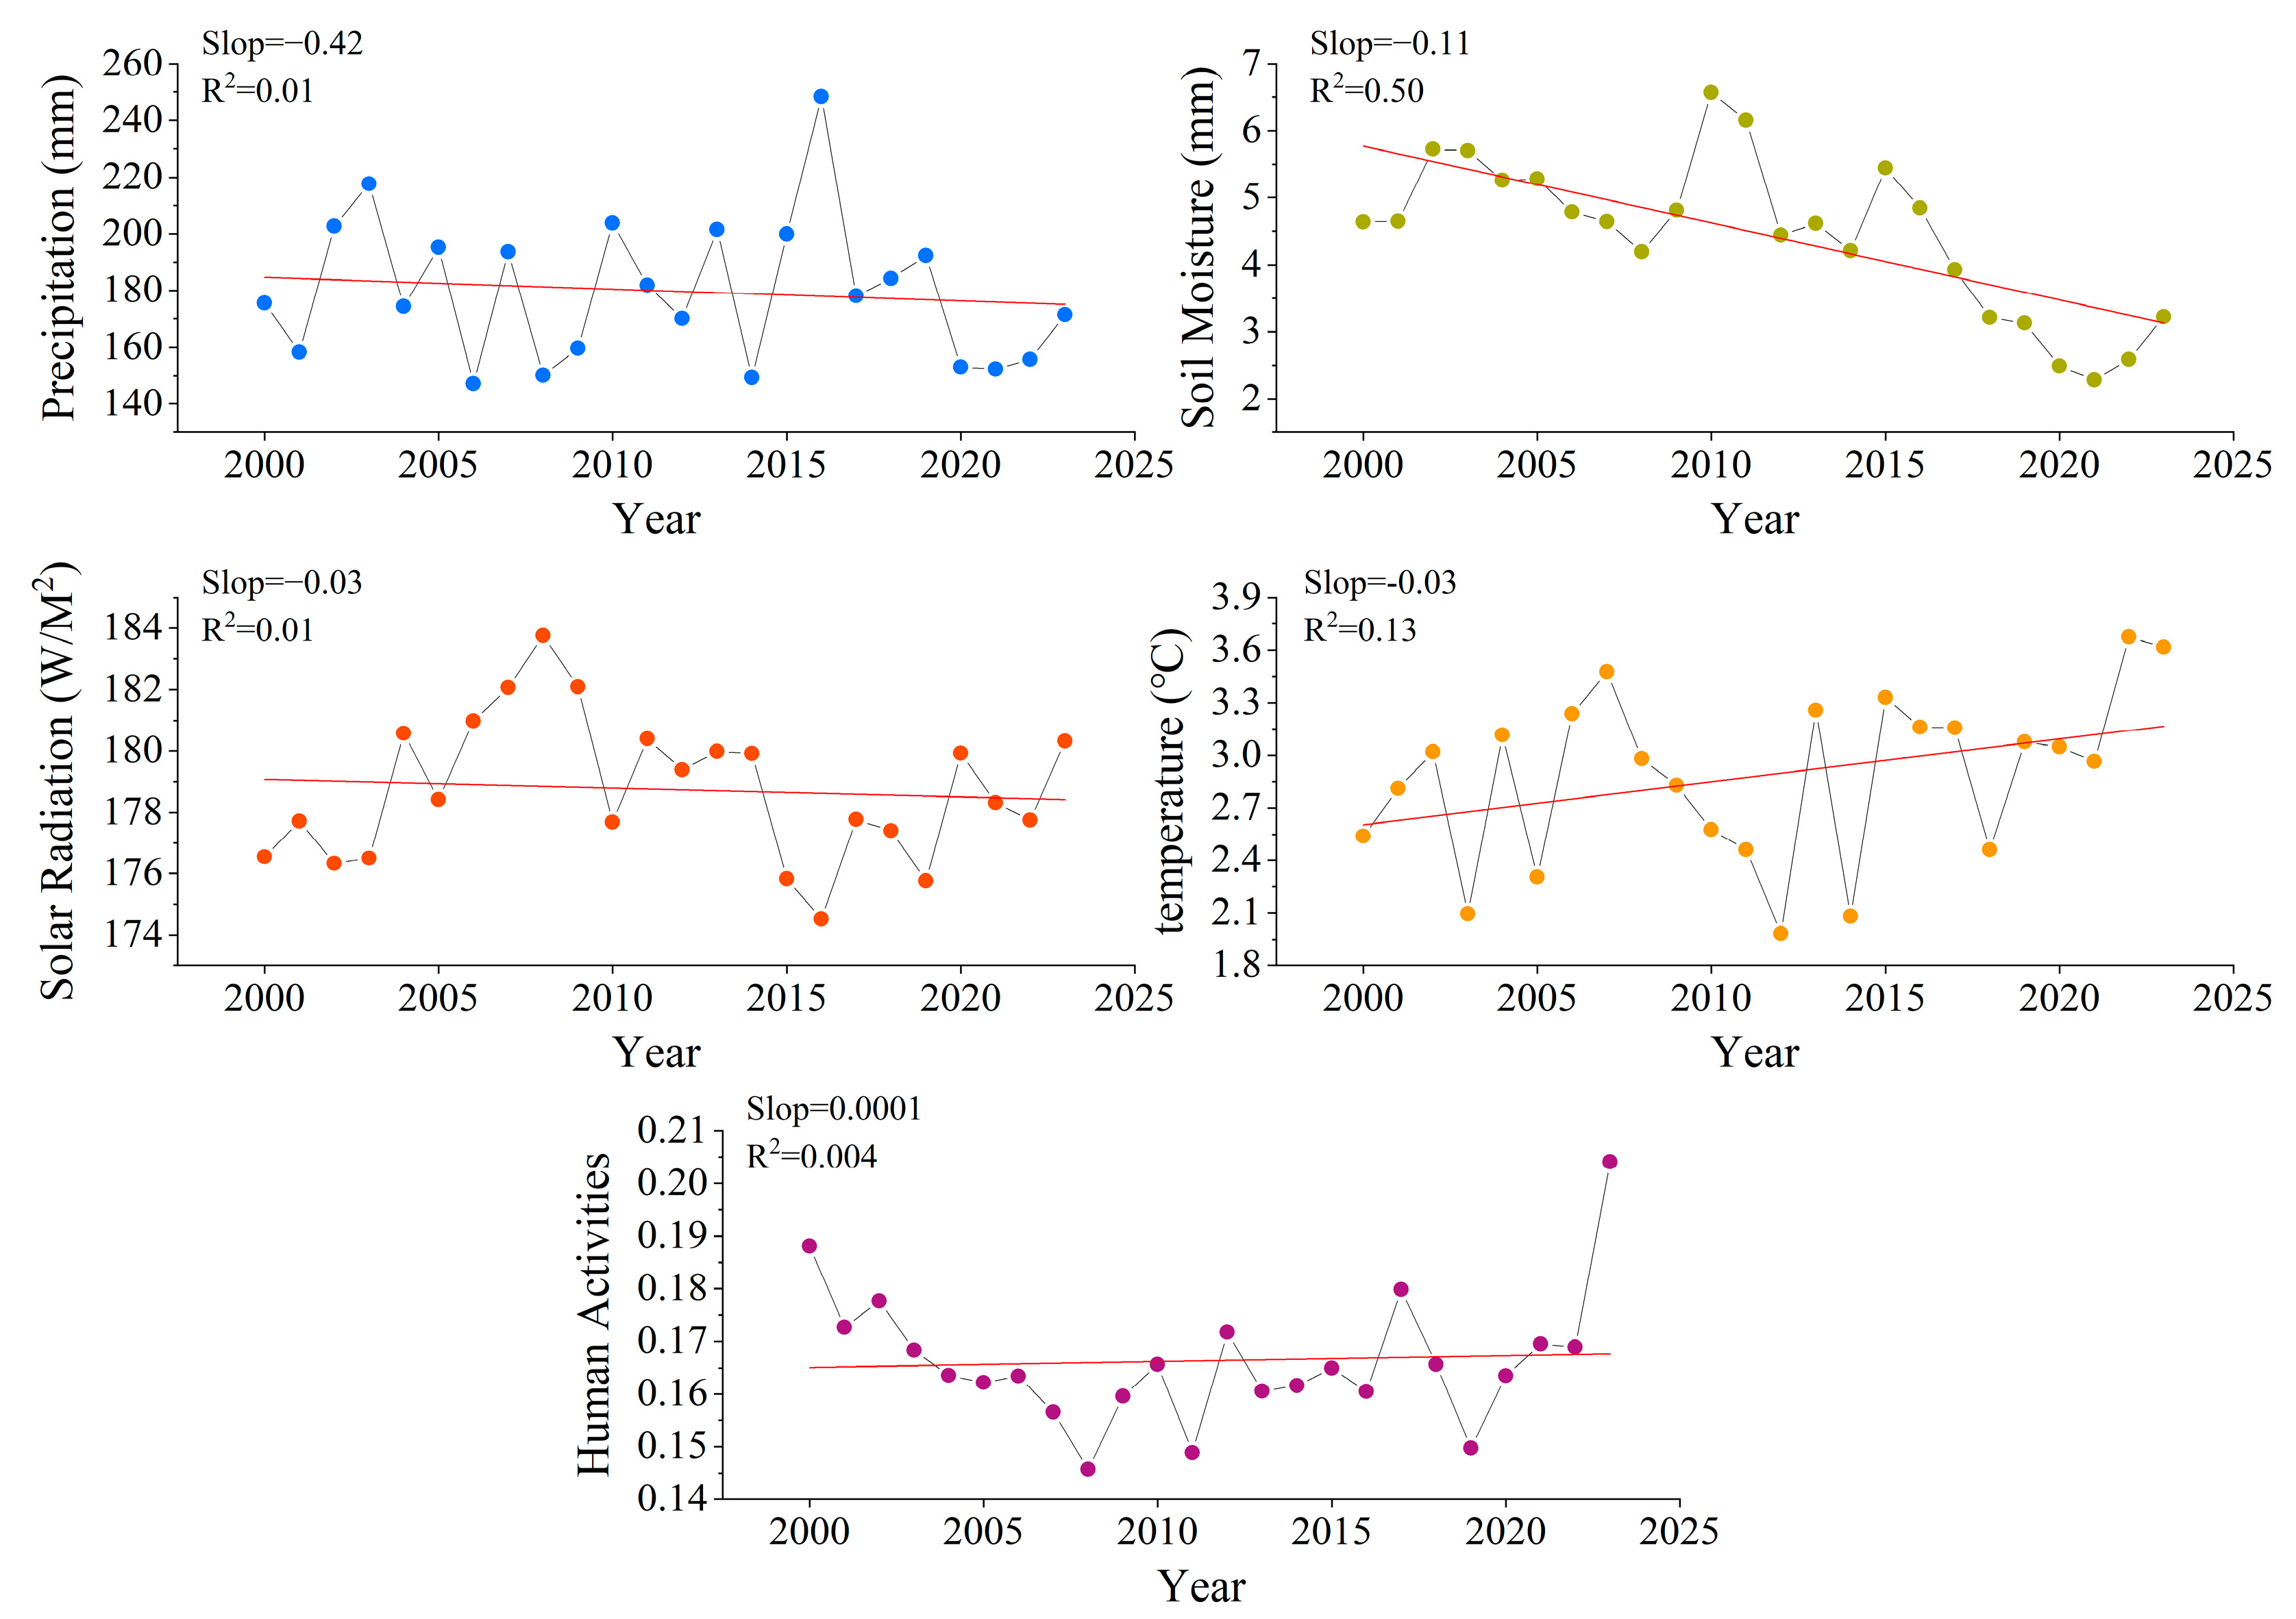
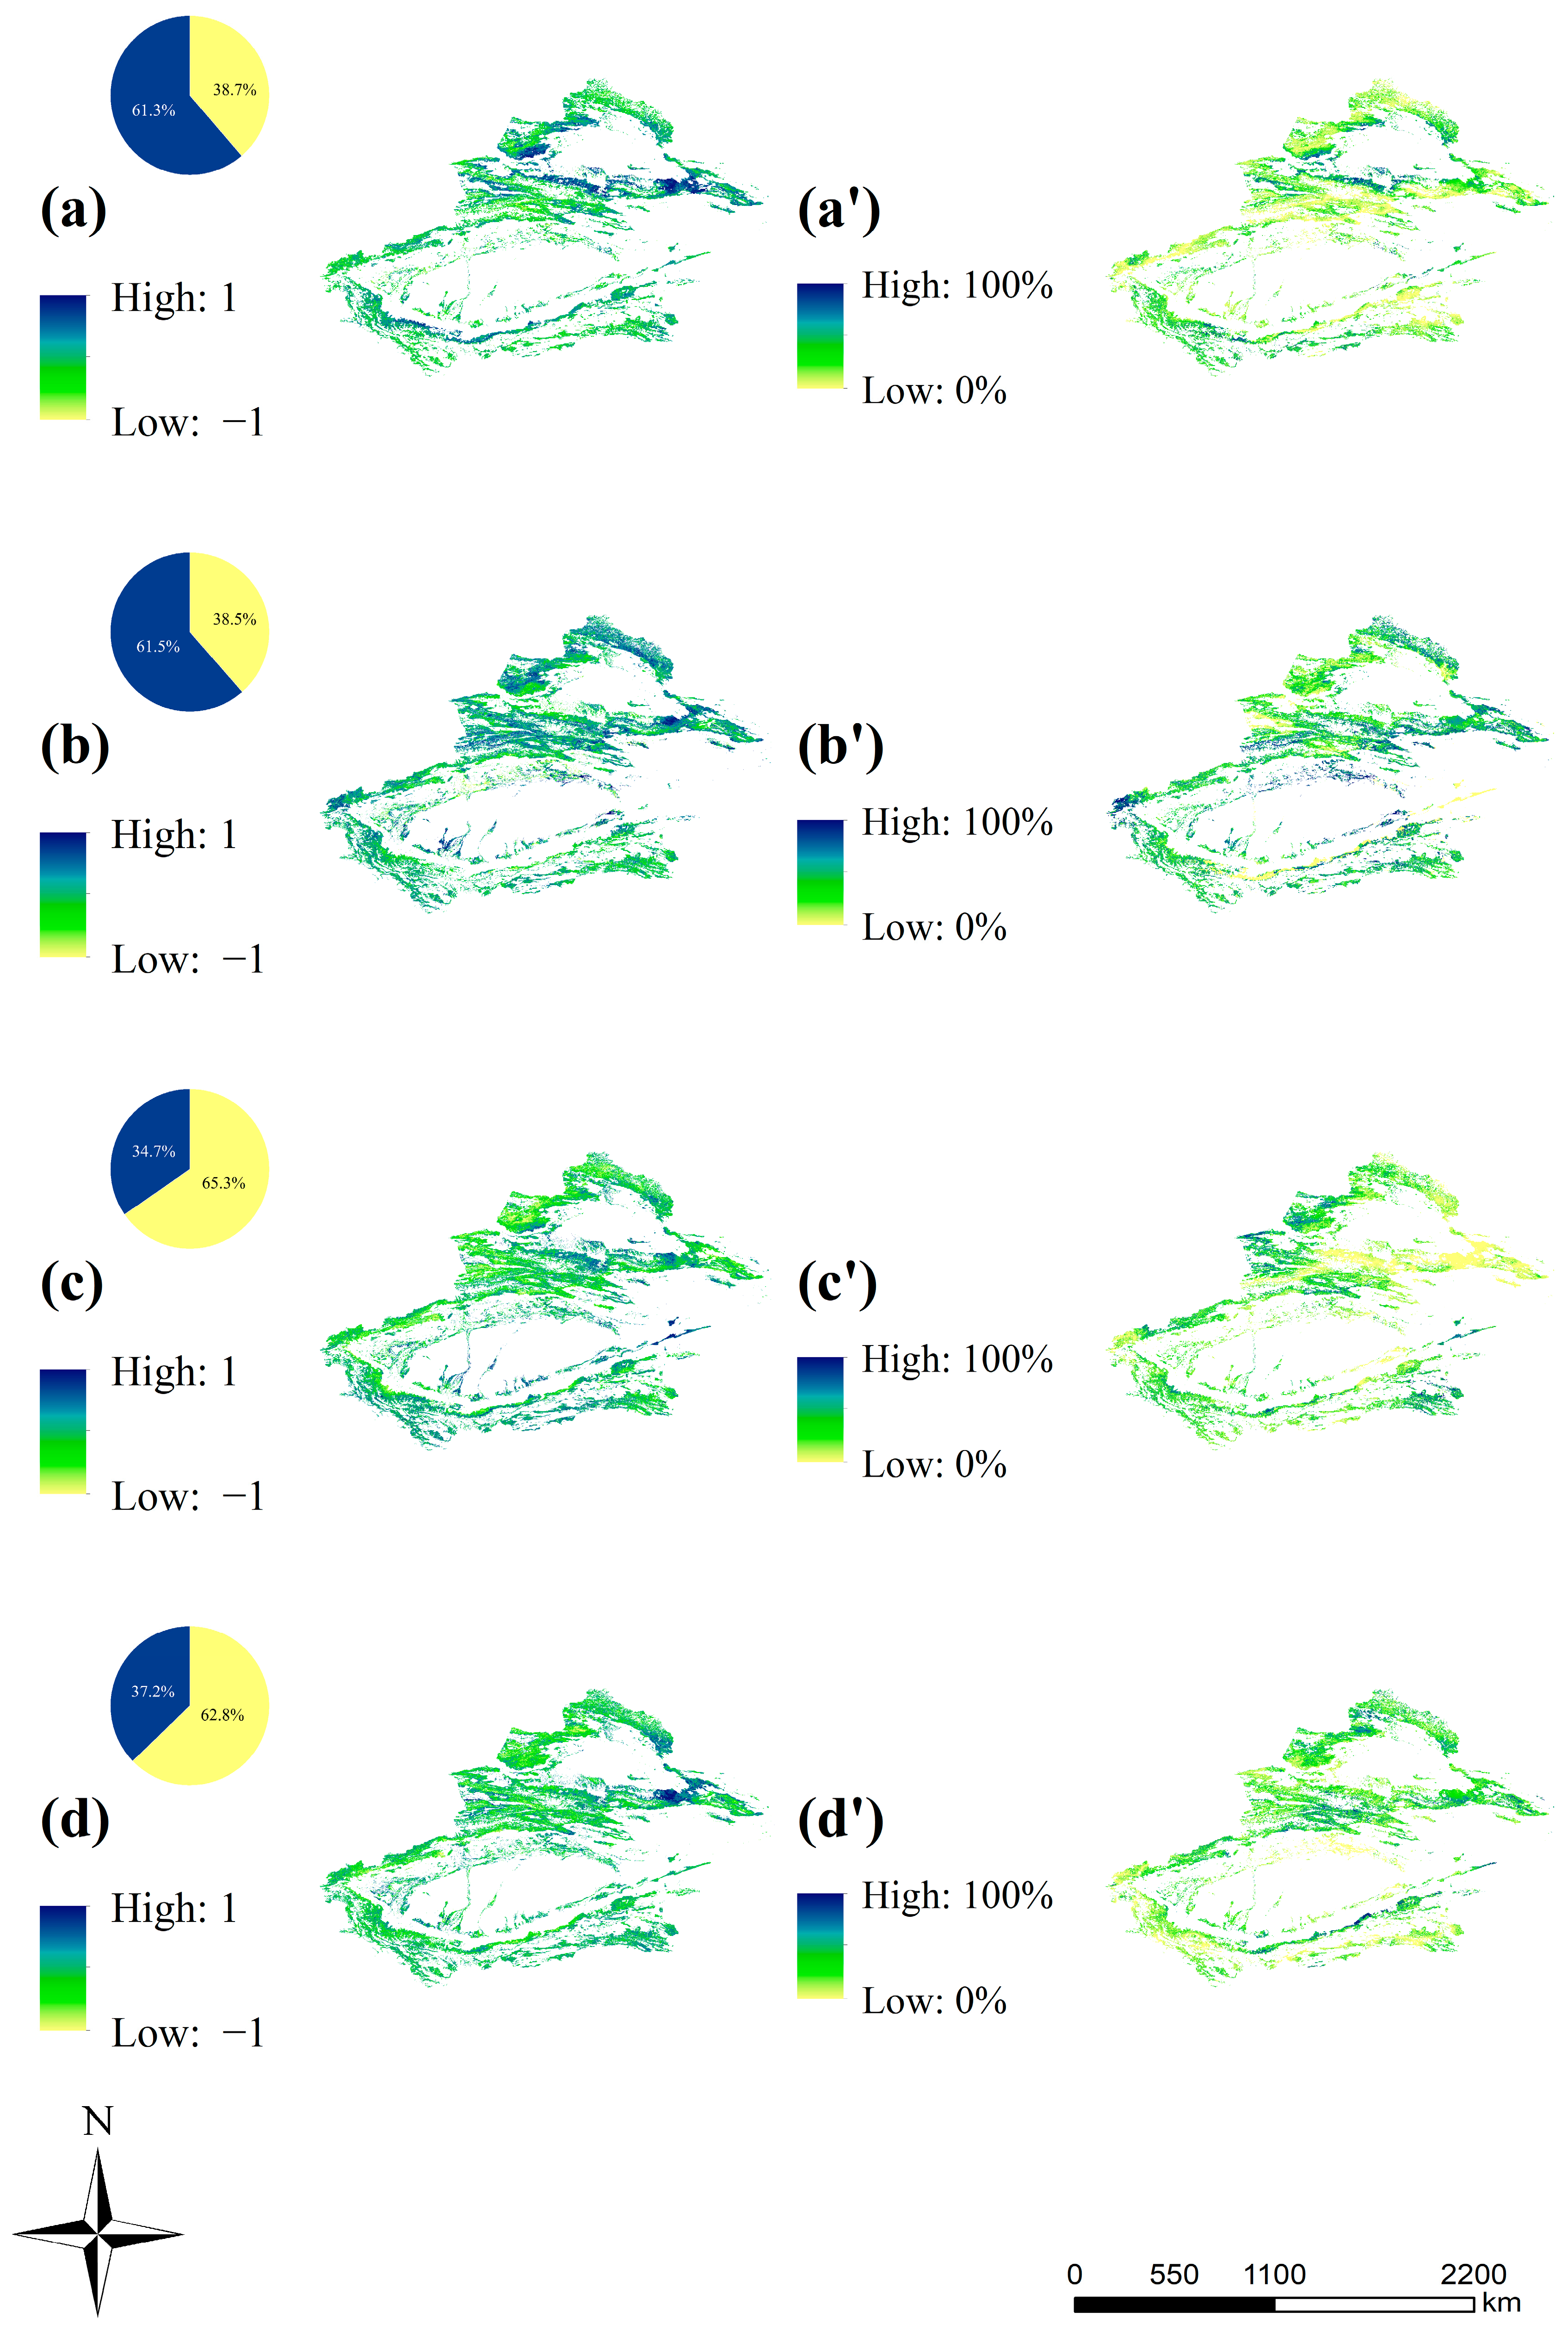
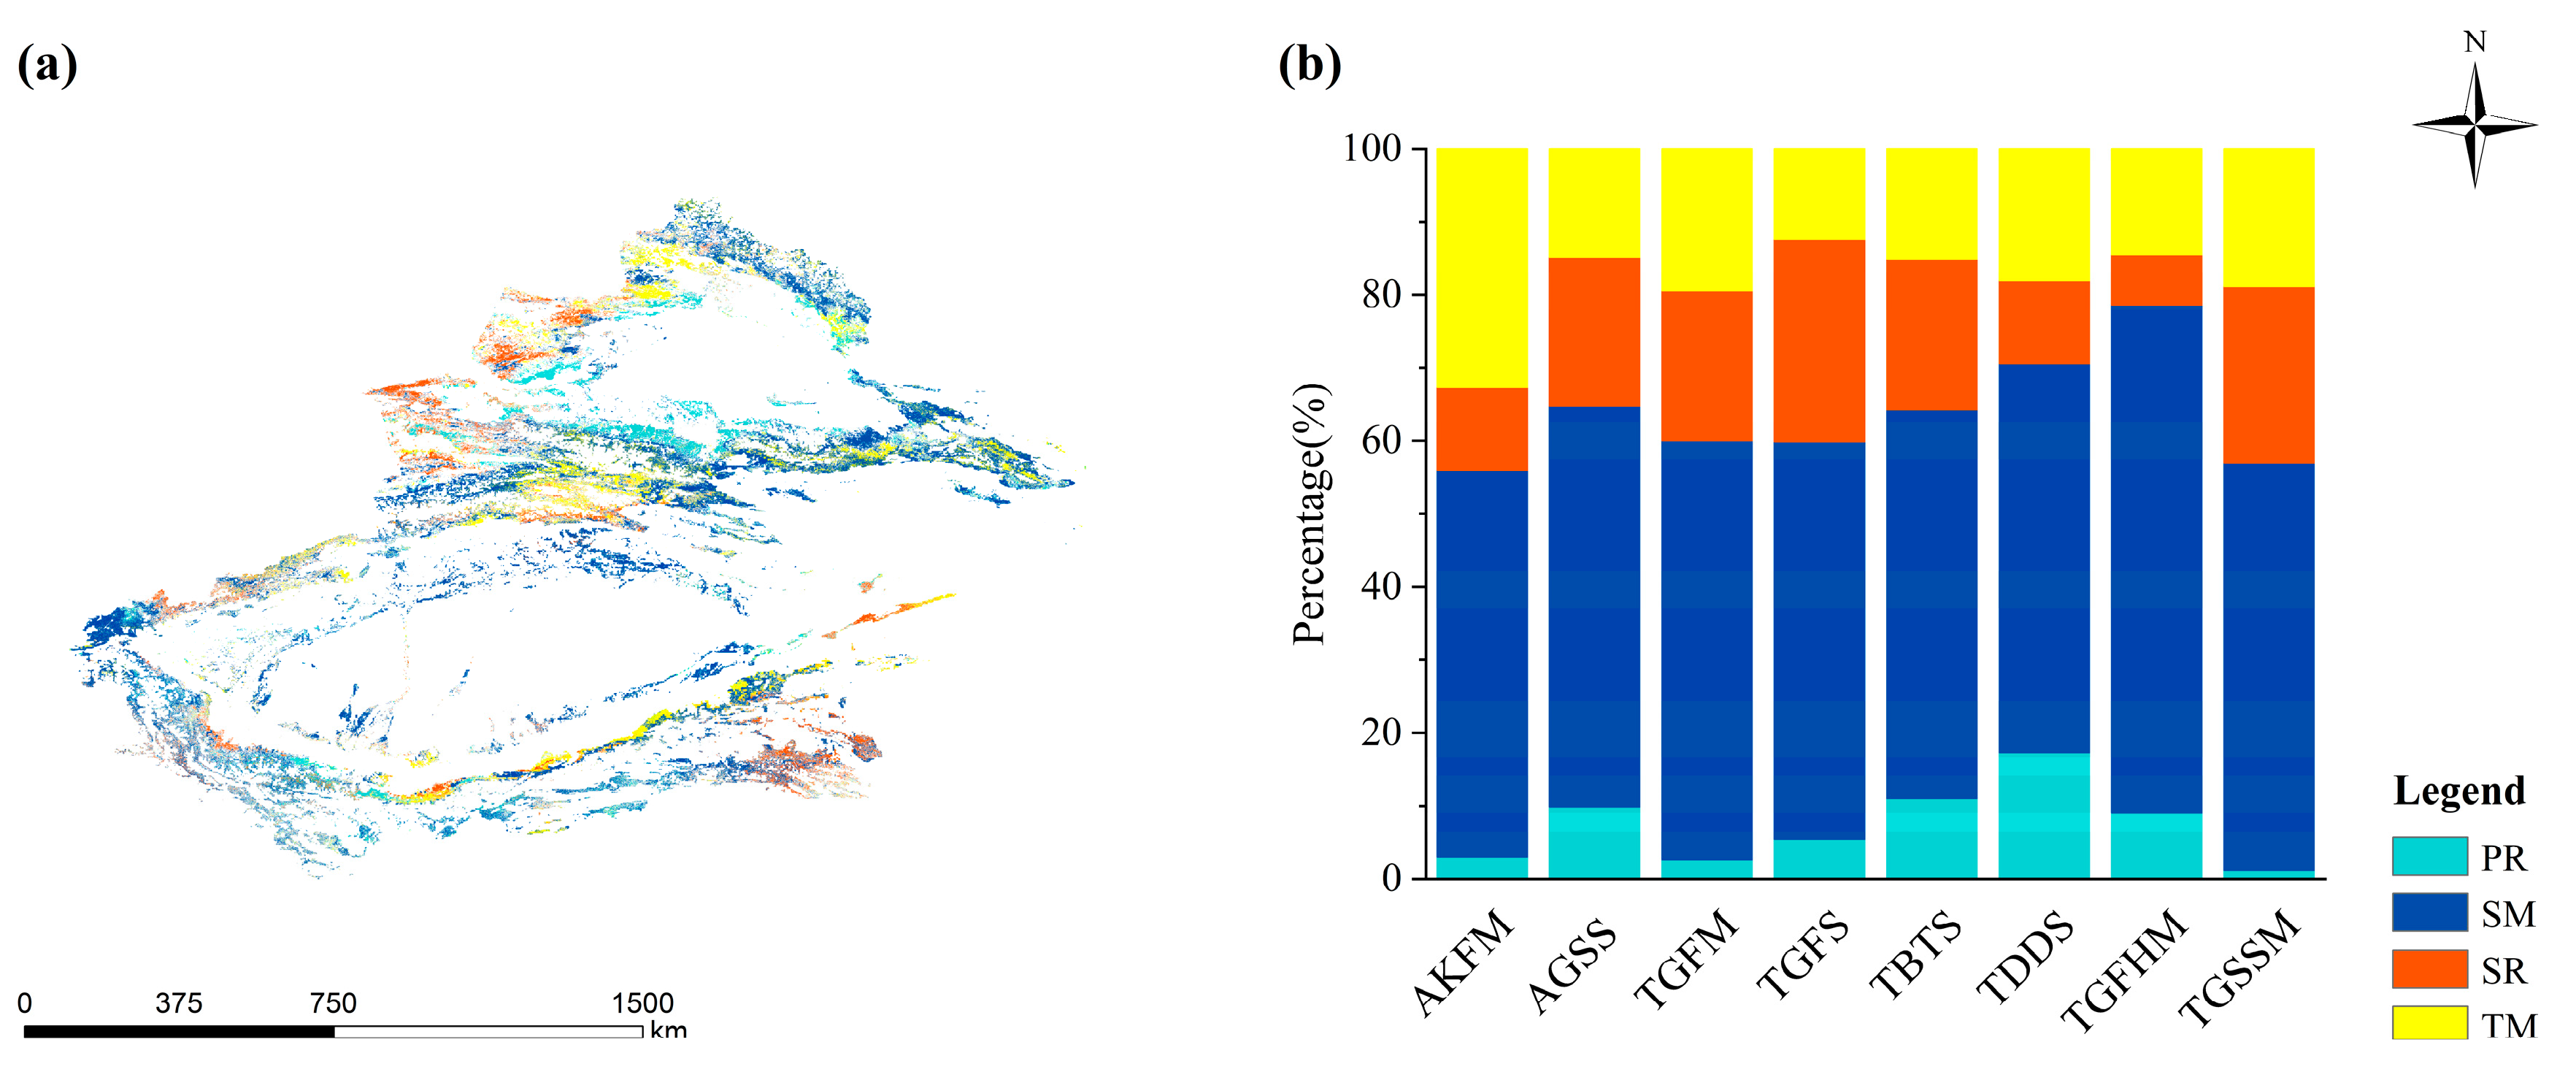
5.3.1. Climatic Influences on Grassland FVC Dynamics in Xinjiang

The partial correlations between grassland FVC and different climatic factors showed significant spatial heterogeneity (Figure 7a–d). The area of grassland FVC that positively correlated with precipitation (61.3%) was larger than the negatively correlated area (38.7%), and Regions showing a positive correlation between precipitation and grassland FVC were predominantly distributed near the Junggar Basin, the central Ili Valley, and the Kunlun Mountain Range (Figure 7a). The area with a positively biased correlation between soil moisture and grassland FVC was larger (61.3%) than that with a negative correlation (38.5%), and the majority of grassland FVC in Xinjiang had a positive response to soil moisture (Figure 7b). The area of grassland FVC positively correlated with solar radiation (34.7%) was smaller than the negatively correlated area (65.3%), and the areas where solar radiation positively contributed to grassland FVC were concentrated around the Junggar Basin, around the Tarim Basin, and on the south side of the Kunlun Mountains (Figure 7c). Finally, the area of grassland FVC positively correlated with temperature (37.2%) was smaller than the negatively correlated area (62.8%), and temperature acted negatively on most of the grassland FVC in Xinjiang; the area where it had a positive effect was mainly concentrated in the eastern Tianshan Mountains (Figure 7d).
Among the meteorological factors, soil moisture had the highest mean relative contribution to grassland FVC (38.3%), with the area of interest being concentrated in the Tarim River Basin. The average contributions of precipitation, temperature, and solar radiation were low, 18.6%, 22.9%, and 20.2%, respectively (Figure 8a). The area of grassland FVC driven by soil moisture was the largest in Xinjiang from 2000 to 2023, with a share of 54.8%. In contrast, the areas of grassland FVC driven by precipitation, solar radiation, and air temperature were smaller, 13.1%, 14.6%, and 17.5%, respectively (Figure 8a). The soil moisture-driven grassland FVC was widely distributed in all regions of Xinjiang, precipitation-driven grassland FVC was mainly concentrated around the Junggar Basin, the solar radiation-driven grassland FVC was concentrated in the western part of the Ili Valley and Kashgar, and the areas where the temperature factor drove grassland FVC were mainly concentrated in the Bayinbruk Plain and the southern Altay Mountains (Figure 8b).

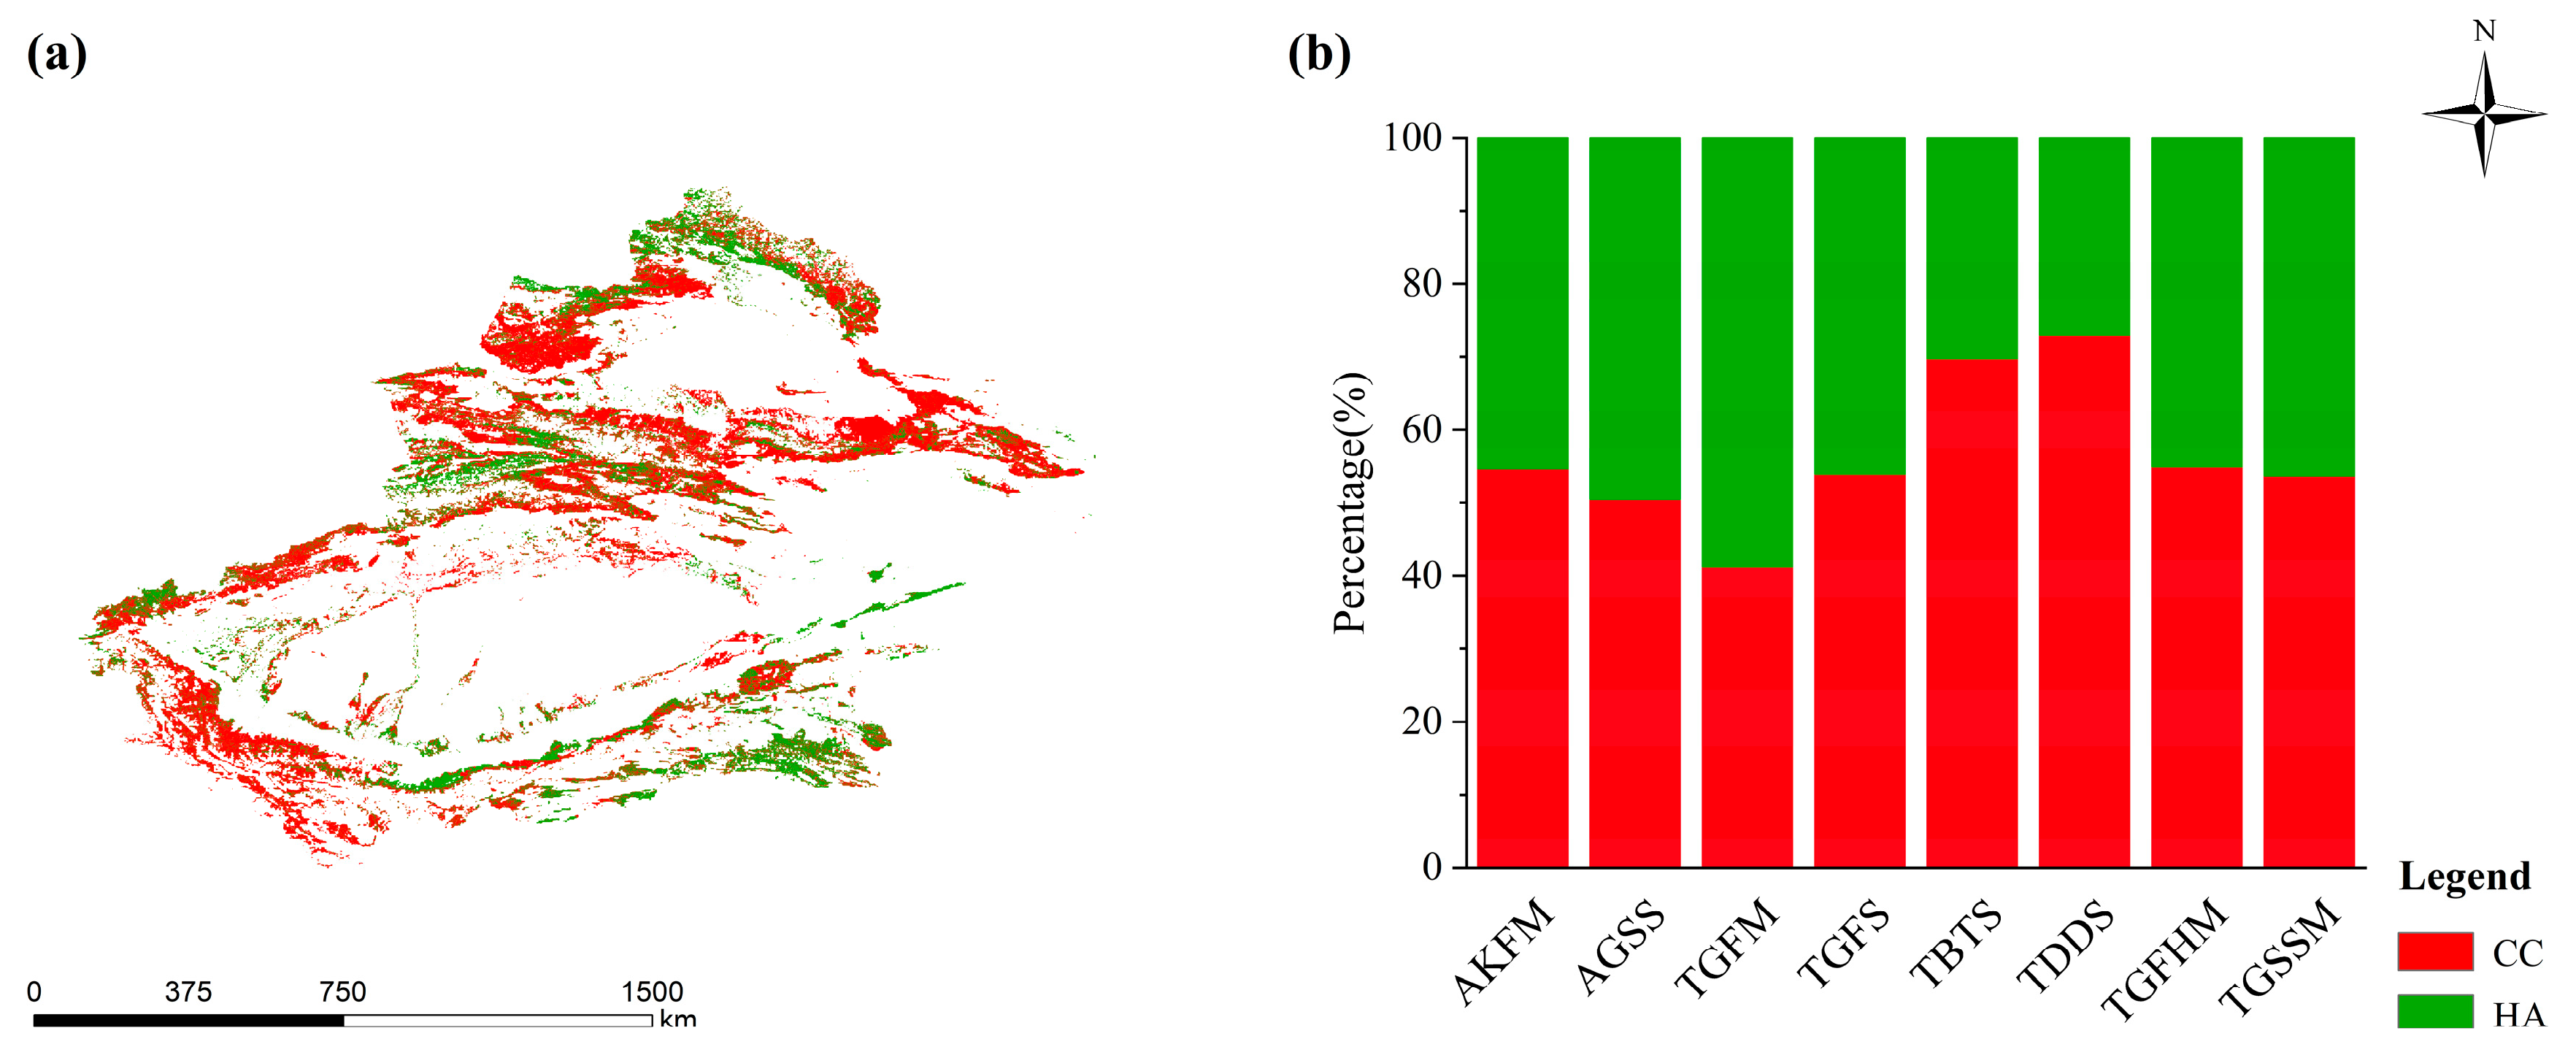
5.3.2. Impact of Climate and Human on Grassland FVC

From 2000 to 2023, the grassland FVC in Xinjiang was influenced by the combined effects of climate and human. The contribution of climate change to grassland FVC was 57.2%, while that of human activities was 42.8%. Climate change significantly affected the grassland FVC in the Kashgar region, the Tianshan Mountains, the Ili river basin, and the western part of the Kunlun Mountains. In contrast, human activities had a more pronounced impact on the grassland FVC in other regions (23.6%), whose area was smaller than the area with a negative impact (38.4%). Similarly, regarding absolute contributions, the area where human activities had a positive impact on grassland FVC (28.0%) was smaller than the area with a negative impact (42.7%) (Figure 9a’,b’). In Xinjiang, 60.8% of the grassland area was primarily influenced by climate change, while 39.2% was driven by human activities (Figure 10a). Although the majority of grassland types exhibited FVC dynamics jointly influenced by climatic and anthropogenic factors, certain grassland subtypes showed distinct dominant drivers. Specifically, Temperate Typical Steppe and Temperate Desert Steppe were predominantly climate-driven, with climate-influenced areas accounting for 70.4% and 73.2%, respectively. In contrast, the FVC dynamics of Temperate Meadow Steppe were mainly attributed to human activities, with an anthropogenically driven area proportion of 59.3% (Figure 10b).

6. Discussion

6.1. Spatiotemporal Dynamics Characteristics of Xinjiang Grassland FVC

We here presented an analysis of the spatiotemporal dynamics of the grassland FVC in Xinjiang from 2000 to 2023. The findings indicate a distinct northwest-to-southeast gradient in Xinjiang’s grassland vegetation coverage, with significantly higher FVC levels observed in northwestern regions compared to southeastern areas, decreasing from mountains to basins, which is consistent with the results obtained by Ma et al. [40]. From 2000 to 2020, the Xinjiang grassland FVC showed an upward in terms of temporal changes, which is consistent with the results of previous studies [16,40]. From 2000 to 2020, the Xinjiang grassland FVC increase probably resulted from the combination of regional climate warming and humidification, together with the reduction in anthropogenic disturbance intensity. Specifically, the increased precipitation and elevated temperature during the study period optimized the hydrothermal conditions essential to vegetation growth. Concurrently, the implementation of ecological conservation projects effectively reduced the disturbance intensity of human activities in grassland ecosystems. The synergistic effect of these factors contributed to the recovery and growth of grassland vegetation. Notably, however, the grassland FVC decreased significantly from 2020 to 2023, with existing studies suggesting that the drought conditions in the Tianshan region of Xinjiang increased significantly after 2020 [41], which may explain the significant decrease in grassland FVC from 2020 to 2023.
In northern Xinjiang, the spatial evolution of FVC showed a decreasing trend in high-FVC areas, such as the Ili Valley and the Altay Mountains, while an increasing trend was observed in low-FVC areas, such as the surrounding areas of the Tarim Basin, the Kunlun Mountains, and the surrounding areas of the Junggar Basin. Chen et al.’s [31] study on the spatial variation in Xinjiang grassland FVC showed a slight upward trend of the NDVI in the grasslands of northern and southern Xinjiang, which differs from the results of this study. The discrepancy may arise from the fact that this study, which was focused on the spatial changes in the grassland FVC in Xinjiang, considered the time period before 2020, when the grassland FVC showed an increasing trend. Yet, the significant decreasing trend grassland FVC from 2020 to 2023 affected the spatial change in grassland FVC from 2000 to 2023. In addition, NDVI-based vegetation cover analysis may cause the oversaturation of grassland cover in northern Xinjiang, possibly contributing to the inconsistency of the study results. From the perspective of topography and geomorphology, northern Xinjiang—including the Ili river basin, the Tianshan Mountains, the Tacheng region, and the Altay Mountains—features complex terrain that typically receives substantial moisture from the westerlies, resulting in relatively humid conditions. These areas constitute the primary distribution zones of high-fractional vegetation cover (FVC) grasslands [39]. However, they are also undergoing the most pronounced degradation. This may be attributed to the ecological vulnerability of high-altitude, high-FVC regions, which renders them more sensitive to disturbances and thus more prone to vegetation degradation. The southern margin of the Tarim Basin and the Kunlun Mountains represent typical arid zones characterized by piedmont alluvial fans, alluvial plains, and deserts. The grassland FVC in these areas remains relatively low [15], and due to harsh moisture limitations, both the extent and magnitude of vegetation improvement are considerably constrained [42]. Influenced by the unique geomorphology and uneven hydrothermal condition in Xinjiang, FVC variation patterns varied among different grassland types: while most grassland types showed a decreasing trend in FVC due to climatic drought, the rising trend in AGSS and TGFHM FVC is noteworthy and may be attributed to the melting of snow and ice on high-elevation mountains due to the temperature rise in Xinjiang, thereby facilitating an increase in FVC of these two grassland types [43].

6.2. Impact of Climate Change on Grassland FVC

In this study, we analyzed the FVC–climate relationships in Xinjiang from 2000 to 2023 and revealed the effects of the climatic factors of annual precipitation, mean annual air temperature, mean annual solar radiation, and relative humidity on grassland FVC. The positive feedback mechanism of vegetation enabled soil moisture to directly and stably supply water to vegetation, reduce water evaporation, improve soil structure, and maintain the long-term stability of soil moisture [44]. Findings indicated that the effect of soil moisture on grassland FVC was more significant than that of other meteorological factors. The study by Zhang et al. [45] also revealed that soil moisture was strongly positively correlated with grassland FVC with a significant contribution. Areas with negative effects of temperature on grassland FVC significantly exceeds those with a positive effect. In particular, temperature positively affects grassland FVC mainly in mountainous areas such as the Tianshan Mountains, which is attributed to the increased moisture factor resulting from the temperature-enhanced melting of alpine glaciers and snow, which promotes the growth of grasses. In contrast, temperature negatively affects grassland FVC mainly in areas around the Junggar Basin and the Tarim Basin, which may be explained by the water evaporation being exacerbated by high temperatures leading to rapid water loss, which affects the growth and survival of plants [46]. To a certain extent, elevated solar radiation can increase the photosynthetic efficiency of vegetation to promote plant growth and reproduction, but excessive light energy may exceed the photosynthetic capacity of plants, resulting in a decrease in photosynthetic efficiency and possibly even damaging the chlorophyll and photosystem of plants [47]. The impact of solar radiation on vegetation is relatively low due to its inability to act directly on vegetation growth and development, but it indirectly influences other meteorological factors [48]. Precipitation also serves as a critical environmental factor for vegetation growth and development. The results of this study demonstrate that precipitation contributed the least to grassland FVC. The reason may lie in the strong drought tolerance of vegetation in Xingjiang, which enables plants to survive and grow under limited-moisture conditions, variations in precipitation exert a relatively minor influence on grassland FVC [49]. It is noteworthy that precipitation in Xinjiang followed an increasing trend until 2020 [50], yet turned to a decreasing trend after 2020, which may adversely affect grassland FVC.

6.3. Impact of Climate Change and Human Activities on Grassland FVC

The findings demonstrate that climate change played a more dominant role than human activities in driving grassland FVC changes in Xinjiang, although both factors made contributions. Li et al. [16] suggested that both climate and anthropogenic activities contribute to FVC change in Xinjiang, with the former exerting a larger influence than the latter, which is corroborate our study’s conclusions. Since 2000, Xinjiang’s climate has exhibited an ‘asymmetric warm-wetting pattern,’ characterized by an overall regional trend of warming and wetting, juxtaposed with localized areas experiencing warm-drying conditions [51]. This climatic dichotomy has resulted in pronounced spatial heterogeneity in grassland FVC changes across Xinjiang. As demonstrated by Yao et al. [52], areas undergoing climatic warm-drying exhibit declining soil moisture, leading to a consequent decrease in FVC. Conversely, Chen et al. [39] found that during 1990–2018, regions benefiting from increased westerly precipitation under warm-wetting conditions showed a sustained upward trend in FVC, exemplifying a synergistic enhancement in vegetation recovery due to climatic warming and wetting. Xinjiang has experienced a significant increase in the frequency of extreme climatic phenomena over the past two decades, which have further amplified the adverse impacts associated with the warm-wetting trend [53]. As a typical arid and semi-arid region, the vegetation in Xinjiang responds sensitively to climate change with a relatively fragile ecological environment [54]. In this context, extreme changes in climate can negatively affect the growth of grassland, resulting in a decreasing trend in grassland FVC. However, it is noteworthy that extreme droughts may exacerbate glacier melting and affect the hydrological cycle of the watershed [55], which may partially explain the upward trend in the grassland FVC in the Tarim River Basin.
From 2000 to 2023, areas with negative impacts of human activities on grassland FVC significantly exceeded those with positive effects. The negatively affected areas were mainly concentrated in the northern border regions, such as the Tianshan Mountains and the Altay Mountains, which may be associated with the high intensity of human activities such as overgrazing, tourism development, and insufficient anthropogenic management [56]. In regions such as the south side of the Tianshan Mountains and the north side of the Kunlun Mountains, the Chinese government has launched a series of ecological engineering projects aimed to restore and improve grassland FVC [57]. Therefore, human activities conducted there positively contribute to grassland FVC. Based on these findings, it is imperative to strengthen the implementation of ecological projects such as the conversion of grazing land into grassland and grazing exclusion. Concurrently, rational planning should also be undertaken for land use planning, grazing, and tourism development.

6.4. Limitations

In this study, we assessed the spatiotemporal dynamics of grassland FVC and its driving factors in Xinjiang by using the MODIS EVI and the TerraClimate dataset. Although both datasets have been previously validated, certain uncertainties and limitations remain in terms of data quality and methodological assumptions. In arid regions, FVC estimates derived from the EVI may be affected by residual cloud contamination, atmospheric correction errors, or sensor degradation. To mitigate these potential biases, we employed maximum value compositing and a pixel dichotomy model. Additionally, the climatic variables in TerraClimate, while consistent and widely used at regional scales, are based on interpolation and model-derived estimates that may not fully capture local heterogeneity. Nevertheless, given the study’s reliance on long-term time series and large-scale spatial analyses, the results are considered robust and credible.
The methodological framework adopted in this study demonstrates a certain degree of effectiveness in identifying the driving mechanisms of grassland FVC change; however, several potential limitations remain. In analyzing the spatiotemporal dynamics of FVC, the Hurst exponent provides insights into the persistence of vegetation trends, but it is inherently incapable of predicting abrupt or unexpected shifts in FVC patterns. Regarding the attribution of driving factors, the separation of climatic and anthropogenic contributions is based on residual analysis, which assumes that all climatic effects are accurately captured by the regression model. The presence of unmodeled climatic variables can reduce the explanatory power (R2) of the model at specific pixels, potentially leading to attribution bias. Furthermore, ridge regression relies on the assumption of linear relationships between climatic variables and FVC, which may not fully reflect the complex, non-linear responses inherent in ecological systems. In addition, the residual-based method does not allow for the detailed disaggregation of human activities and non-climatic biotic processes in shaping FVC dynamics.

7. Conclusions

Grassland FVC in Xinjiang exhibits a spatial pattern with higher values in the northwest and lower values in the southeast, declining from mountainous regions to basins. From 2000 to 2023, the grassland FVC in Xinjiang showed a fluctuating downward trend, and the FVC of most grasslands will continue to decline in the future. The change in grassland FVC in Xinjiang is affected by climate change and human activities, but the impact of climate change on grassland FVC is more significant. The contributions of climate factors to the grassland FVC in Xinjiang are ranked as follows: soil moisture > temperature > solar radiation > precipitation. The FVC of each grassland type in Xinjiang showed different change patterns. With the exceptions that the FVCs of Temperate Typical Steppe and Temperate Desert Steppe were dominantly influenced by climate and the FVC of Temperate Meadow Steppe was dominantly influenced by human activities, the FVCs of other grassland types were influenced by both human activities and climate change. Drawing from our analysis, key conservation measures should include: (1) enhancing existing grassland restoration initiatives through stricter enforcement of grazing bans and expanded vegetation rehabilitation programs, optimize land use patterns, and promote the coordinated development of pastoralism and tourism; (2) in regions where grassland vegetation cover (FVC) has declined due to extreme climatic events, implement timely and effective anthropogenic interventions; and (3) develop region-specific and targeted grassland conservation strategies tailored to the ecological characteristics of different zones in Xinjiang. In future research, the time-lag and cumulative effects of climate change on grassland FVC will be further considered and the attribution of the various human activities influencing FVC dynamics refined.

Author Contributions

Conceptualization, C.Z. and X.M.; methodology, C.Z.; software, C.Z.; validation, C.Z., Z.H. and Y.H.; formal analysis, C.Z. and Y.Z.; investigation, C.Z.; resources, C.Z.; data curation, C.Z.; writing—original draft preparation, C.Z.; writing—review and editing, H.Y., C.Z. and Y.Z.; visualization, Y.Z.; supervision, X.M.; project administration, X.M.; funding acquisition, X.M. All authors have read and agreed to the published version of the manuscript.

Funding

This study was supported by the Third Xinjiang Scientific Expedition Program (2022xjkk0403).

Institutional Review Board Statement

Not applicable.

Informed Consent Statement

Not applicable.

Data Availability Statement

Date are contained within the article.

Conflicts of Interest

The authors declare no conflicts of interest.

References

  1. Liu, L.; Zheng, J.; Guan, J.; Han, W.; Liu, Y. Grassland cover dynamics and their relationship with climatic factors in China from 1982 to 2021. Sci. Total Environ. 2023, 905, 167067. [Google Scholar] [CrossRef]
  2. Liu, W.; Mo, X.; Liu, S.; Lu, C. Impacts of climate change on grassland fractional vegetation cover variation on the Tibetan Plateau. Sci. Total Environ. 2024, 939, 173320. [Google Scholar] [CrossRef]
  3. Gitelson, A.A.; Kaufman, Y.J.; Stark, R.; Rundquist, D. Novel algorithms for remote estimation of vegetation fraction. Remote Sens. Environ. 2002, 80, 76–87. [Google Scholar] [CrossRef]
  4. Pettorelli, N.; Vik, J.O.; Mysterud, A.; Gaillard, J.M.; Tucker, C.J.; Stenseth, N.C. Using the satellite-derived NDVI to assess ecological responses to environmental change. Trends Ecol. Evol. 2005, 20, 503–510. [Google Scholar] [CrossRef]
  5. Shen, X.; Liu, B.; Li, G.; Yu, P.; Zhou, D. Impacts of grassland types and vegetation cover changes on surface air temperature in the regions of temperate grassland of China. Theor. Appl. Climatol. 2016, 126, 141–150. [Google Scholar] [CrossRef]
  6. Fu, B.; Yang, W.; Yao, H.; He, H.; Lan, G.; Gao, E.; Qin, J.; Fan, D.; Chen, Z. Evaluation of spatio-temporal variations of FVC and its relationship with climate change using GEE and Landsat images in Ganjiang River Basin. Geocarto Int. 2022, 37, 13658–13688. [Google Scholar] [CrossRef]
  7. Otto, M.; Höpfner, C.; Curio, J.; Maussion, F.; Scherer, D. Assessing vegetation response to precipitation in northwest Morocco during the last decade: An application of MODIS NDVI and high resolution reanalysis data. Theor. Appl. Climatol. 2016, 123, 23–41. [Google Scholar] [CrossRef]
  8. Matsushita, B.; Yang, W.; Chen, J.; Onda, Y.; Qiu, G. Sensitivity of the enhanced vegetation index (EVI) and normalized difference vegetation index (NDVI) to topographic effects: A case study in high-density cypress forest. Sensors 2007, 7, 2636–2651. [Google Scholar] [CrossRef] [PubMed]
  9. Son, N.T.; Chen, C.F.; Chen, C.R.; Minh, V.Q.; Trung, N.H. A comparative analysis of multitemporal MODIS EVI and NDVI data for large-scale rice yield estimation. Agric. For. Meteorol. 2014, 197, 52–64. [Google Scholar] [CrossRef]
  10. Zarei, A.; Asadi, E.; Ebrahimi, A.; Jafari, M.; Malekian, A.; Nasrabadi, H.M.; Chemura, A.; Maskell, G. Prediction of future grassland vegetation cover fluctuation under climate change scenarios. Ecol. Indic. 2020, 119, 106858. [Google Scholar] [CrossRef]
  11. Zhou, Y.; Batelaan, O.; Guan, H.; Liu, T.; Duan, L.; Wang, Y.; Li, X. Assessing long-term trends in vegetation cover change in the Xilin River Basin: Potential for monitoring grassland degradation and restoration. J. Environ. Manag. 2024, 349, 119579. [Google Scholar] [CrossRef]
  12. Yang, Y.H.; Piao, S.L. Variations in grassland vegetation cover in relation to climatic factors on the Tibetan Plateau. Chin. J. Plant Ecol. 2006, 30, 1–8. [Google Scholar]
  13. Wang, Z.; Liu, C.; Alfredo, H. From AVHRR-NDVI to MODIS-EVI: Advances in vegetation index research. Acta Ecol. Sin. 2003, 23, 979–987. [Google Scholar]
  14. Wang, G.; Mao, J.; Fan, L.; Ma, X.; Li, Y. Effects of climate and grazing on the soil organic carbon dynamics of the grasslands in Northern Xinjiang during the past twenty years. Glob. Ecol. Conserv. 2022, 34, 2039. [Google Scholar] [CrossRef]
  15. Liu, Y.; Li, L.; Chen, X.; Zhang, R.; Yang, J. Temporal-spatial variations and influencing factors of vegetation cover in Xinjiang from 1982 to 2013 based on GIMMS-NDVI3g. Glob. Planet. Change 2018, 169, 145–155. [Google Scholar] [CrossRef]
  16. Li, G.; Liang, J.; Wang, S.; Zhou, M.; Sun, Y.; Wang, J.; Fan, J. Characteristics and Drivers of Vegetation Change in Xinjiang, 2000–2020. Forests 2024, 15, 231. [Google Scholar] [CrossRef]
  17. Liang, S.; Yi, Q.; Liu, J. Vegetation dynamics and responses to recent climate change in Xinjiang using leaf area index as an indicator. Ecol. Indic. 2015, 58, 64–76. [Google Scholar]
  18. Lou, A.R.; Zhou, G.F. Relationships Between Environment and Spatial Pattern of Vegetation Types in the Mid Tianshan Mountains. Chin. J. Plant Ecol. 2001, 25, 385–391. [Google Scholar]
  19. Zhao, Y.; Chen, Y.; Wu, C.; Li, G.; Ma, M.; Fan, L.; Zheng, H.; Song, L.; Tang, X. Exploring the contribution of environmental factors to evapotranspiration dynamics in the Three-River-Source region, China. J. Hydrol. 2023, 626, 130222. [Google Scholar] [CrossRef]
  20. Sims, D.A.; Rahman, A.F.; Cordova, V.D.; El-Masri, B.Z.; Baldocchi, D.D.; Flanagan, L.B.; Goldstein, A.H.; Hollinger, D.Y.; Misson, L.; Monson, R.K.; et al. On the use of MODIS EVI to assess gross primary productivity of North American ecosystems. J. Geophys. Res. Biogeosci. 2006, 111, G04015. [Google Scholar] [CrossRef]
  21. Yang, H.; Mu, S.; Li, J. Effects of ecological restoration projects on land use and land cover change and its influences on territorial NPP in Xinjiang, China. Catena 2014, 115, 85–95. [Google Scholar] [CrossRef]
  22. Li, Q.; Chen, Y.; Shen, Y.; Li, X.; Xu, J. Spatial and temporal trends of climate change in Xinjiang, China. J. Geogr. Sci. 2011, 21, 1007–1018. [Google Scholar] [CrossRef]
  23. Zhang, X.S. Vegetation Map of the People’s Republic of China (1:1 000 000); Geology Press: Beijing, China, 2007. [Google Scholar]
  24. Didan, K. MODIS/Terra Vegetation Indices 16-Day L3 Global 250m SIN Grid V061; NASA EOSDIS Land Processes Distributed Active Archive Center: Sioux Falls, SD, USA, 2021. [Google Scholar] [CrossRef]
  25. Abatzoglou, J.T.; Dobrowski, S.Z.; Parks, S.A.; Hegewisch, K.C. Terraclimate, a high-resolution global dataset of monthly climate and climatic water balance from 1958–2015. Sci. Data 2018, 5, 170191. [Google Scholar] [CrossRef]
  26. Xu, X.; Liu, J.; Zhang, S.; Li, R.; Yan, C.; Wu, S. China Multi-Period Land Use Remote Sensing Monitoring Dataset (CNLUCC); Resource and Environmental Science Data Registration and Publishing System: Beijing, China, 2018. [Google Scholar] [CrossRef]
  27. Reuter, H.I.; Nelson, A.; Jarvis, A. An evaluation of void-filling interpolation methods for SRTM data. Int. J. Geogr. Inf. Sci. 2007, 21, 983–1008. [Google Scholar] [CrossRef]
  28. Holben, B.N. Characteristics of maximum-value composite images from temporal AVHRR data. Int. J. Remote Sens. 1986, 7, 1417–1434. [Google Scholar] [CrossRef]
  29. Karabulut, M. An examination of relationships between vegetation and rainfall using maximum value composite AVHRR-NDVI data. Turk. J. Bot. 2003, 27, 93–101. [Google Scholar]
  30. Li, F.; Chen, W.; Zeng, Y.; Zhao, Q.; Wu, B. Improving estimates of grassland fractional vegetation cover based on a pixel dichotomy model: A case study in Inner Mongolia, China. Remote Sens. 2014, 6, 4705–4722. [Google Scholar] [CrossRef]
  31. Chen, C.B.; Li, G.Y.; Peng, J. Spatio-temporal variation characteristics of grassland NDVI and its response to climate change in Xinjiang from 1981 to 2018. Acta Ecol. Sin. 2023, 43, 1537–1552. [Google Scholar]
  32. Sen, P.K. Estimates of the regression coefficient based on Kendall’s tau. J. Am. Stat. Assoc. 1968, 63, 1379–1389. [Google Scholar] [CrossRef]
  33. Sur, K.; Chauhan, P. Dynamic trend of land degradation/restoration along Indira Gandhi Canal command area in Jaisalmer District, Rajasthan, India: A case study. Environ. Earth Sci. 2019, 78, 472. [Google Scholar] [CrossRef]
  34. Mann, H.B. Nonparametric tests against trend. Econom. J. Econom. Soc. 1945, 13, 245–259. [Google Scholar] [CrossRef]
  35. Hurst, H.E. Long-term storage capacity of reservoirs. Trans. Am. Soc. Civ. Eng. 1951, 116, 770–799. [Google Scholar] [CrossRef]
  36. Evans, J.; Geerken, R. Discrimination between climate and human-induced dryland degradation. J. Arid. Environ. 2004, 57, 535–554. [Google Scholar] [CrossRef]
  37. Hoerl, A.E.; Kennard, R.W. Ridge regression: Biased estimation for nonorthogonal problems. Technometrics 1970, 12, 55–67. [Google Scholar] [CrossRef]
  38. McDonald, G.C. Ridge regression. Wiley Interdiscip. Rev. Comput. Stat. 2009, 1, 93–100. [Google Scholar] [CrossRef]
  39. Chen, M.; Xue, Y.; Xue, Y.; Peng, J.; Guo, J.; Liang, H. Assessing the effects of climate and human activity on vegetation change in Northern China. Environ. Res. 2024, 247, 118233. [Google Scholar] [CrossRef]
  40. Ma, L.; Zhang, J.; Peng, J.; Li, G.; Han, W.; Liu, L. Remote sensing monitoring and influencing factors analysis of grassland degradation in Xinjiang from 2001 to 2020. Bull. Surv. Mapp. 2024, 1–7. [Google Scholar] [CrossRef]
  41. Wu, X.; Cheng, H.; Tong, X.; Zhang, X. Response of Vegetation Changes to Meteorological Drought in Xinjiang Tianshan Mountain Area. Arid Land Geography. Available online: http://kns.cnki.net/kcms/detail/65.1103.X.20250326.1557.005.html (accessed on 17 June 2025).
  42. Wang, S.; Liu, Q.; Huang, C. Vegetation change and its response to climate extremes in the arid region of Northwest China. Remote Sens. 2021, 13, 1230. [Google Scholar] [CrossRef]
  43. Wang, H.; Li, Z.; Niu, Y.; Li, X.; Cao, L.; Feng, R.; He, Q.; Pan, Y. Evolution and climate drivers of NDVI of natural vegetation during the growing season in the arid region of northwest China. Forests 2022, 13, 1082. [Google Scholar] [CrossRef]
  44. James, S.E.; Pärtel, M.; Wilson, S.D.; Peltzer, D.A. Temporal heterogeneity of soil moisture in grassland and forest. J. Ecol. 2003, 91, 234–239. [Google Scholar] [CrossRef]
  45. Zhang, X.; Zhao, W.; Liu, Y.; Fang, X.; Feng, Q. The relationships between grasslands and soil moisture on the Loess Plateau of China: A review. Catena 2016, 145, 56–67. [Google Scholar] [CrossRef]
  46. Luo, N.; Mao, D.; Wen, B.; Liu, X. Climate change affected vegetation dynamics in the northern Xinjiang of China: Evaluation by SPEI and NDVI. Land 2020, 9, 90. [Google Scholar] [CrossRef]
  47. Qin, G.; Meng, Z.; Fu, Y. Drought and water-use efficiency are dominant environmental factors affecting greenness in the Yellow River Basin, China. Sci. Total Environ. 2022, 834, 155479. [Google Scholar] [CrossRef]
  48. Fitter, A.H.; Graves, J.D.; Self, G.K.; Brown, T.K.; Bogie, D.S.; Taylor, K. Root production, turnover and respiration under two grassland types along an altitudinal gradient: Influence of temperature and solar radiation. Oecologia 1998, 114, 20–30. [Google Scholar] [CrossRef]
  49. Hardy, C.C.; Burgan, R.E. Evaluation of NDVI for monitoring live moisture in three vegetation types of the western US. Photogramm. Eng. Remote Sens. 1999, 65, 603–610. [Google Scholar]
  50. Ma, Y.J.; Shi, F.Z.; Hu, X.; Li, X.Y. Climatic constraints to monthly vegetation dynamics in desert areas over the silk road economic belt. Remote Sens. 2021, 13, 995. [Google Scholar] [CrossRef]
  51. Li, C.; Wang, R.; Ning, H.; Luo, Q. Characteristics of meteorological drought pattern and risk analysis for maize production in Xinjiang, Northwest China. Theor. Appl. Climatol. 2018, 133, 1269–1278. [Google Scholar] [CrossRef]
  52. Yao, J.; Zhao, Y.; Chen, Y.; Yu, X.; Zhang, R. Multi-scale assessments of droughts: A case study in Xinjiang, China. Sci. Total Environ. 2018, 630, 444–452. [Google Scholar] [CrossRef]
  53. Yan, Y.; Su, Y.; Zhou, H.; Wang, S.; Yao, L.; Batmunkh, D. Anthropogenic and Climate-Induced Water Storage Dynamics over the Past Two Decades in the China–Mongolia Arid Region Adjacent to Altai Mountain. Remote. Sens. 2025, 17, 1949. [Google Scholar] [CrossRef]
  54. Wu, X.; Luo, M.; Meng, F. Newcharacteristics of spatio-temporal evolution of extreme climate events in Xinjiang under the background of warm and humid climate. Arid. Zone Res. 2022, 39, 1695–1705. [Google Scholar]
  55. Wu, X.; Zhang, J.; Yu, X.; Mayila, M. Comprehensive risk assessment and zoning of drought disasters in Tianshan Mountains, Xinjiang Uygur Autonomous Region. J. Meteorol. Environ. 2022, 38, 161–167. [Google Scholar]
  56. Zhou, Y.; Li, Y.; Li, W.; Li, F.; Xin, Q. Ecological responses to climate change and human activities in the arid and semi-arid regions of Xinjiang in China. Remote Sens. 2022, 14, 3911. [Google Scholar] [CrossRef]
  57. Yang, H.; Yao, L.; Wang, Y.; Li, J. Relative contribution of climate change and human activities to vegetation degradation and restoration in North Xinjiang, China. Rangel. J. 2017, 39, 289–302. [Google Scholar] [CrossRef]
Figure 1. The spatial patterns in Xinjiang, China, including (a) Xinjiang elevation and (b) Xinjiang grassland species distribution. Note: TGFS stands for Temperate Grass and Forb Meadow Steppe; TGFM stands for Temperate Grass and Forb Meadow; TBTS stands for Temperate Bunchgrass Typical Steppe; TGSSM stands for Temperate Grass, Sedge, and Forb Swampy Meadow; TDDS stands for Temperate Dwarf Bunchgrass and Dwarf Semi-Shrub Desert Steppe; TGFHM stands for Temperate Grass and Forb Halophytic Meadow; AGSS stands for Alpine Grass and Sedge Steppe; AKFM stands for Alpine Kobresia and Forb Meadow.
Sustainability 17 05654 g001
Figure 2. (a) The interannual variation in grassland FVC in Xinjiang, 2000—2023. (b) The interannual fluctuation in grassland FVC in Xinjiang, 2000—2023. (c) The change in grassland FVC in Xinjiang compared with the mean value.
Sustainability 17 05654 g002
Figure 3. The interannual variation in FVC for different grassland types, 2000–2023.
Sustainability 17 05654 g003
Figure 4. (a) The spatial distribution of grassland FVC in Xinjiang, 2000–2023. (b) Changes in grassland FVC types. (c) The spatial variation trend of grassland FVC in Xinjiang, 2000–2023. (d) The spatial variation future trend of grassland FVC in Xinjiang, 2000–2023.
Sustainability 17 05654 g004
Figure 5. (a) The proportions of FVC area with different grades of grassland. (b) The proportions of FVC transfer to different grades of grassland. (c) Percentages of change trend types of different grassland types. (d) Percentages of future change trend of different grassland types.
Sustainability 17 05654 g005
Figure 6. The interannual variation trend of each driving factor.
Sustainability 17 05654 g006
Figure 7. (ad) Partial correlation coefficients of precipitation, soil moisture, solar radiation, and air temperature with grassland FVC. (a’d’) Relative contributions of precipitation, soil moisture, solar radiation, and air temperature to grassland FVC.
Sustainability 17 05654 g007
Figure 8. (a) Distribution map of climate driving factors in Xinjiang. (b) Percentages of climate driving factors of different grassland types. Note: PR stands for precipitation; SM stands for soil moisture; SR stands for solar radiation; TM stands for temperature.
Sustainability 17 05654 g008
Figure 9. (a) The relative contribution of climate to grassland FVC. (b) The relative contribution of human activities to grassland FVC. (a’) The absolute contribution of climate to grassland FVC. (b’) The absolute contribution of human activities to grassland FVC.
Sustainability 17 05654 g009
Figure 10. (a) Climate- and human activity-driven grassland FVC distributions in Xinjiang. (b) Percentage of different grassland FVC vegetation types driven by climate and human activities.
Sustainability 17 05654 g010
Table 1. The data set used in this study.
DataProductSpatial ResolutionTemporal
Resolution
PeriodSource
EVIMODIS EVI250 m16 days2000–2023https://doi.org/10.5067/MODIS/MOD13Q1.061 (accessed on 17 June 2025)
Climatic factorsPrecipitation
Temperature
Solar radiation
Soil moisture
4 kmMonthly2000–2023https://www.climatologylab.org/terraclimate.html (accessed on 17 June 2025)
Grassland distributionCNLUCC1 km/2020http://www.resdc.cn/DOI (accessed on 17 June 2025)
Grassland speciesVegetation Atlas of China10 km//https://www.plantplus.cn/cn (accessed on 17 June 2025)
DemSRTM 30 m/2024https://srtm.csi.cgiar.org/ (accessed on 17 June 2025)
Table 2. Classification of grassland FVC change trends.
βZTrend Features
Β > 0Z < 2.58
1.96 < Z ≤ 2.58
1.65 < Z ≤ 1.96
Z ≤ 1.65
Extremely significant increase (ESI)
Significant increase (SI)
Slightly significant increase (SSI)
Non-significant increase (NSI)
β = 0ZMonotony (M)
Β < 0Z ≤ 1.65
1.65 < Z ≤ 1.96
1.96 < Z ≤ 2.58
Z < 2.58
Non-significant decrease (NSD)
Slightly significant decrease (SSD)
Significant decrease (SD)
Extremely significant decrease (ESD)
Table 3. Classification of Hurst Exponent.
βHurstTrend Features
Β > 00 < Hurst ≤ 0.5
0.5 < Hurst ≤ 1
Anti-persistence increase (APD)
Persistence increase (PI)
Β < 00 < Hurst ≤ 0.5
0.5 < Hurst ≤ 1
Anti-persistence decrease (APD)
Persistence decrease (PD)
Disclaimer/Publisher’s Note: The statements, opinions and data contained in all publications are solely those of the individual author(s) and contributor(s) and not of MDPI and/or the editor(s). MDPI and/or the editor(s) disclaim responsibility for any injury to people or property resulting from any ideas, methods, instructions or products referred to in the content.

