
Analyzing Energy Poverty and Its Determinants in Greece: Implications for Policy


 , ,
, ,  , , and
Abstract
1. Introduction
2. Literature Background
3. Materials and Methods
- A comprehensive analysis of energy poverty in Greece through existing and new indicators.
- An understanding of the various dimensions of energy poverty in Greece through an analysis of the energy poverty indicators examined and the segment of population that is affected in each case.
- The identification of the main determinants of energy poverty in Greece through the development of several logistic regression models, based on selected energy poverty indicators examined.
- The utilization of these models for evaluating the effectiveness of a number of policies and measures used or planned to tackle energy poverty in Greece and the exploitation of these results in order to maximize synergies with decarbonization strategy.
3.1. Measures of Energy Poverty
- The 2M indicator identifies households as energy-poor if their energy expenditure, as a share of income, exceeds twice the national median. For this calculation, both energy expenditure and income were equivalized to consider the differences in households’ size and composition (more details are presented in Section 5.1). Although this indicator is based on two key determinants of energy poverty, namely income and energy costs, it overlooks factors such as energy efficiency and housing characteristics. Also, a major drawback of this indicator is that it excludes households that under-consume energy, which has been a common occurrence in Greece over the last decade due to declining incomes and rising energy prices.
- The M/2 indicator classifies households as energy-poor if their equivalized absolute energy expenditure is less than half the national median, or, in other words, abnormally low. Despite its simplicity, this indicator presents significant weaknesses, as it may classify households with low energy costs due to high energy efficiency as energy-poor while overlooking households with high energy expenditures necessary to maintain adequate thermal conditions.
- The Low Income High Cost (LIHC) indicator [51] classifies a household as energy-poor if the following conditions apply simultaneously: (i) its required equivalized energy expenditure exceeds the national median; (ii) if the household were to spend that amount, its residual income would fall below the official poverty line. In the calculation process, the equivalent income is used (based on the equalized factors of the OECD), while the housing costs (i.e., rent and mortgage payments) is subtracted.
- The Low Income Low Energy Efficiency (LILEE) indicator, which was recently adopted in England [52], considers a household energy-poor if (i) it resides in a building with an energy efficiency rating of band D or lower and (ii) its disposable income (after housing and energy costs) is below the poverty line, mirroring the second criterion of the LIHC indicator. With respect to condition (i), in England this is determined by the most up-to-date Fuel Poverty Energy Efficiency Rating (FPEER) Methodology [52], while in this study, the fulfillment of this criterion is based on the energy performance certificates (EPCs) that consider all households living in a dwelling with EPCs D, E, F, and G as potentially energy-poor.
3.2. Detecting the Characteristics of Energy-Poor Households in Greece
- Household size (HB05): A categorical ordinal variable based on the number of household members.
- Presence of young children (KidsL4): A dummy variable taking the value 1 if the household has at least one member under four years old and 0 otherwise.
- Presence of elderly members (Elderly): A dummy variable taking the value 1 if the household has at least one member aged over 64 and 0 otherwise.
- Age of the dwelling (DS018): A categorical ordinal variable with categories as follows: 1: dwellings built before 1946, 2: dwellings built between 1946 and 1960, 3: dwellings built between 1961 and 1980, 4: dwellings built between 1981 and 1995, 5: dwellings built between 1996 and 2005, 6: dwellings built between 2006 and 2011, 7: dwellings built between 2012 and 2016, and 8: dwellings built after 2016.
- Dwelling area (DS017): A continuous variable representing the floor area of the residence in square meters.
- Housing tenure status (DS012): Three dummy variables to capture owner-occupied housing (reference category), housing with a mortgage (DS012-IM), accommodation provided for free by the employer or the family (DS012-F), and rented housing (DS012-R). Depending on the tenure status of the residence, the corresponding dummy variable takes the value 1 and 0 otherwise.
- Building type (DS011): Three dummy variables representing semi-detached houses (DS011-SD), apartment buildings with fewer than 10 units (DS011-FSB), and apartment buildings with 10 or more units (DS011-FBB), with detached houses as the reference category. Depending on the building type of the residence, the corresponding dummy variable takes the value 1 and 0 otherwise.
- Heating system (DA028): Seven dummy variables that simulate eight different residential heating systems, i.e., central heating systems with diesel oil (reference category), heating systems with natural gas (DA028-NG), oil or LPG stoves (DA028-S), heat storage appliances (DA028-HS), firewood stoves (DA028-W), electric heater appliances (DA028-EH), air conditioning or heat pumps (DA028-HP), other systems (DA028-OTHER). Depending on the heating system of the residence the corresponding dummy variable takes the value 1 and 0 otherwise.
- Geographical location of the dwelling (ELXX): Twelve dummy variables that simulate the 13 regions of the country based on the NUTS2 coding as defined by EUROSTAT, with Attica as the reference region. Specifically, we have included the following dummy variables: EL41 for North Aegean, EL42 for South Aegean, EL43 for Crete, EL51 for Eastern Macedonia and Thrace, EL52 for Central Macedonia, EL54 for Epirus, EL61 for Thessaly, EL62 for the Ionian Islands, EL63 for Western Greece, EL64 for Central Greece, and EL65 for Peloponnese. Again, depending on the region of the residence, the corresponding dummy variable takes the value 1 and 0 otherwise.
- Household income (HH095th): A continuous variable representing the total household income in thousands of euros.
- Unemployment status (UNEM-C): A dummy variable taking the value 1 if there is at least one unemployed household member and 0 otherwise.
- True Positive (TP): The number of households correctly classified as energy-poor by the model.
- True Negative (TN): The number of households correctly classified as not energy-poor by the model.
- False Positive (FP): The number of households incorrectly classified as energy-poor by the model.
- False Negative (FN): The number of households incorrectly classified as not energy-poor by the model.
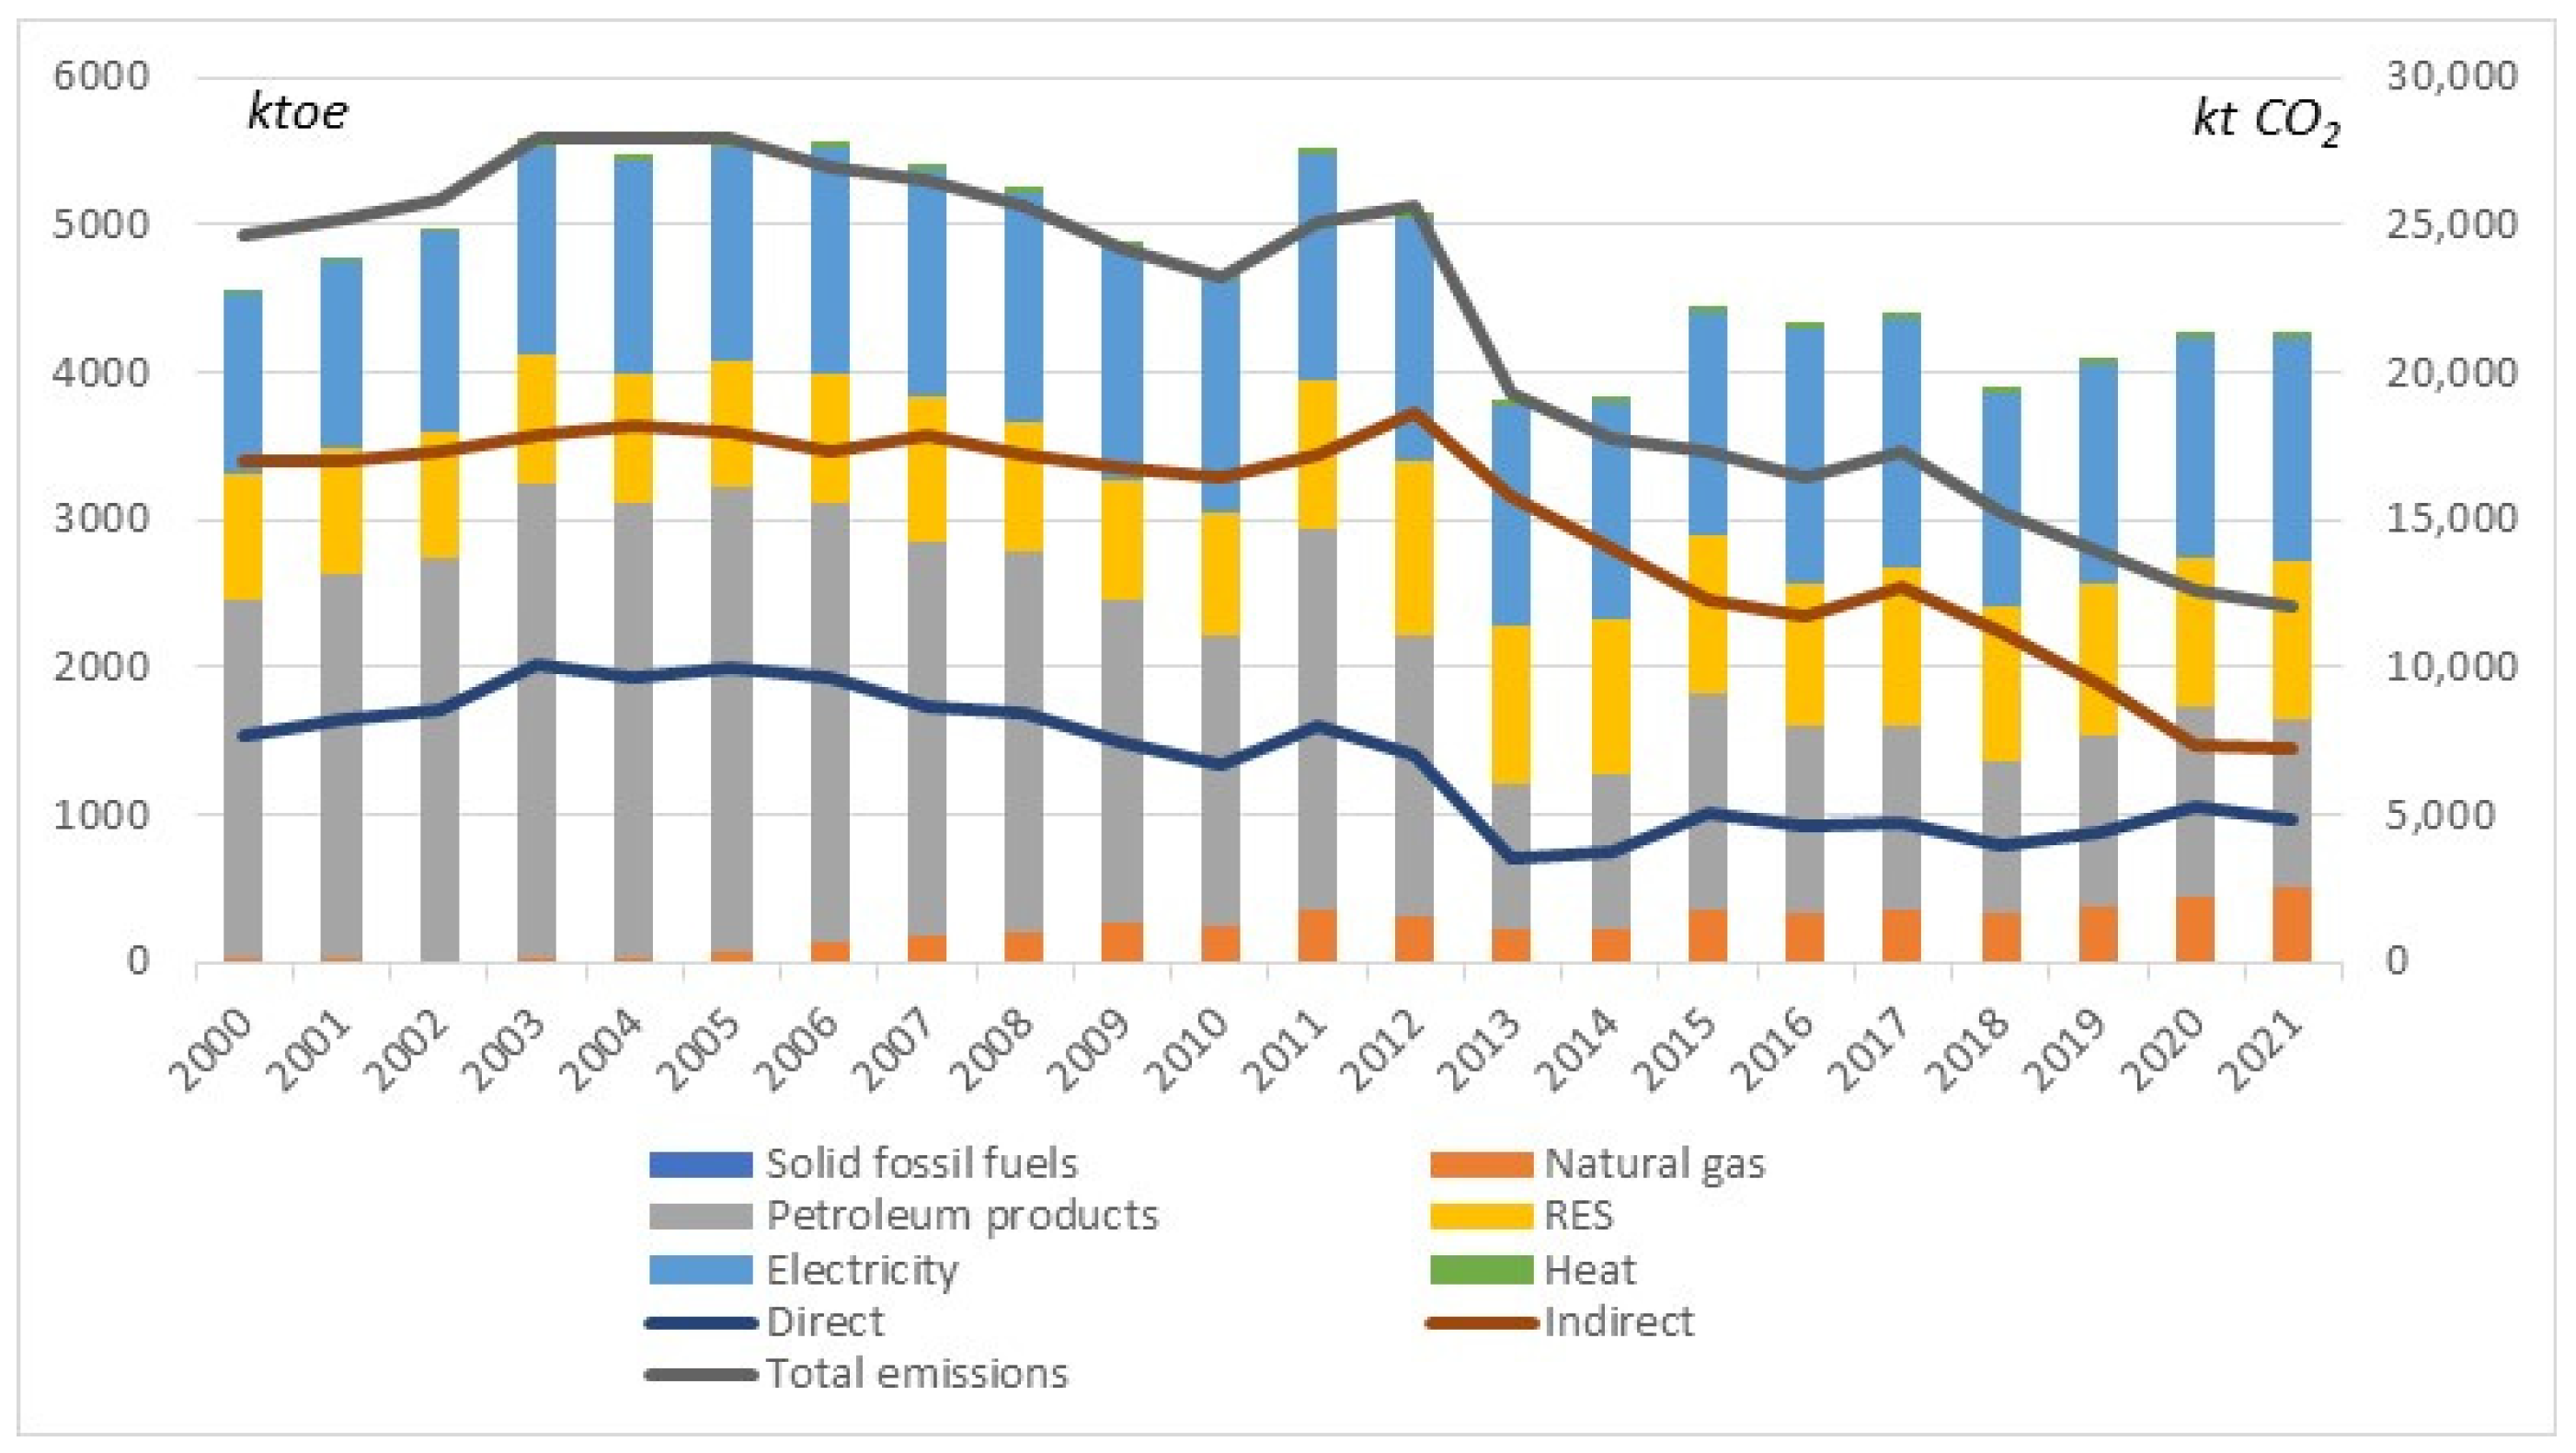
4. The Residential Sector in Greece
5. Results and Discussion
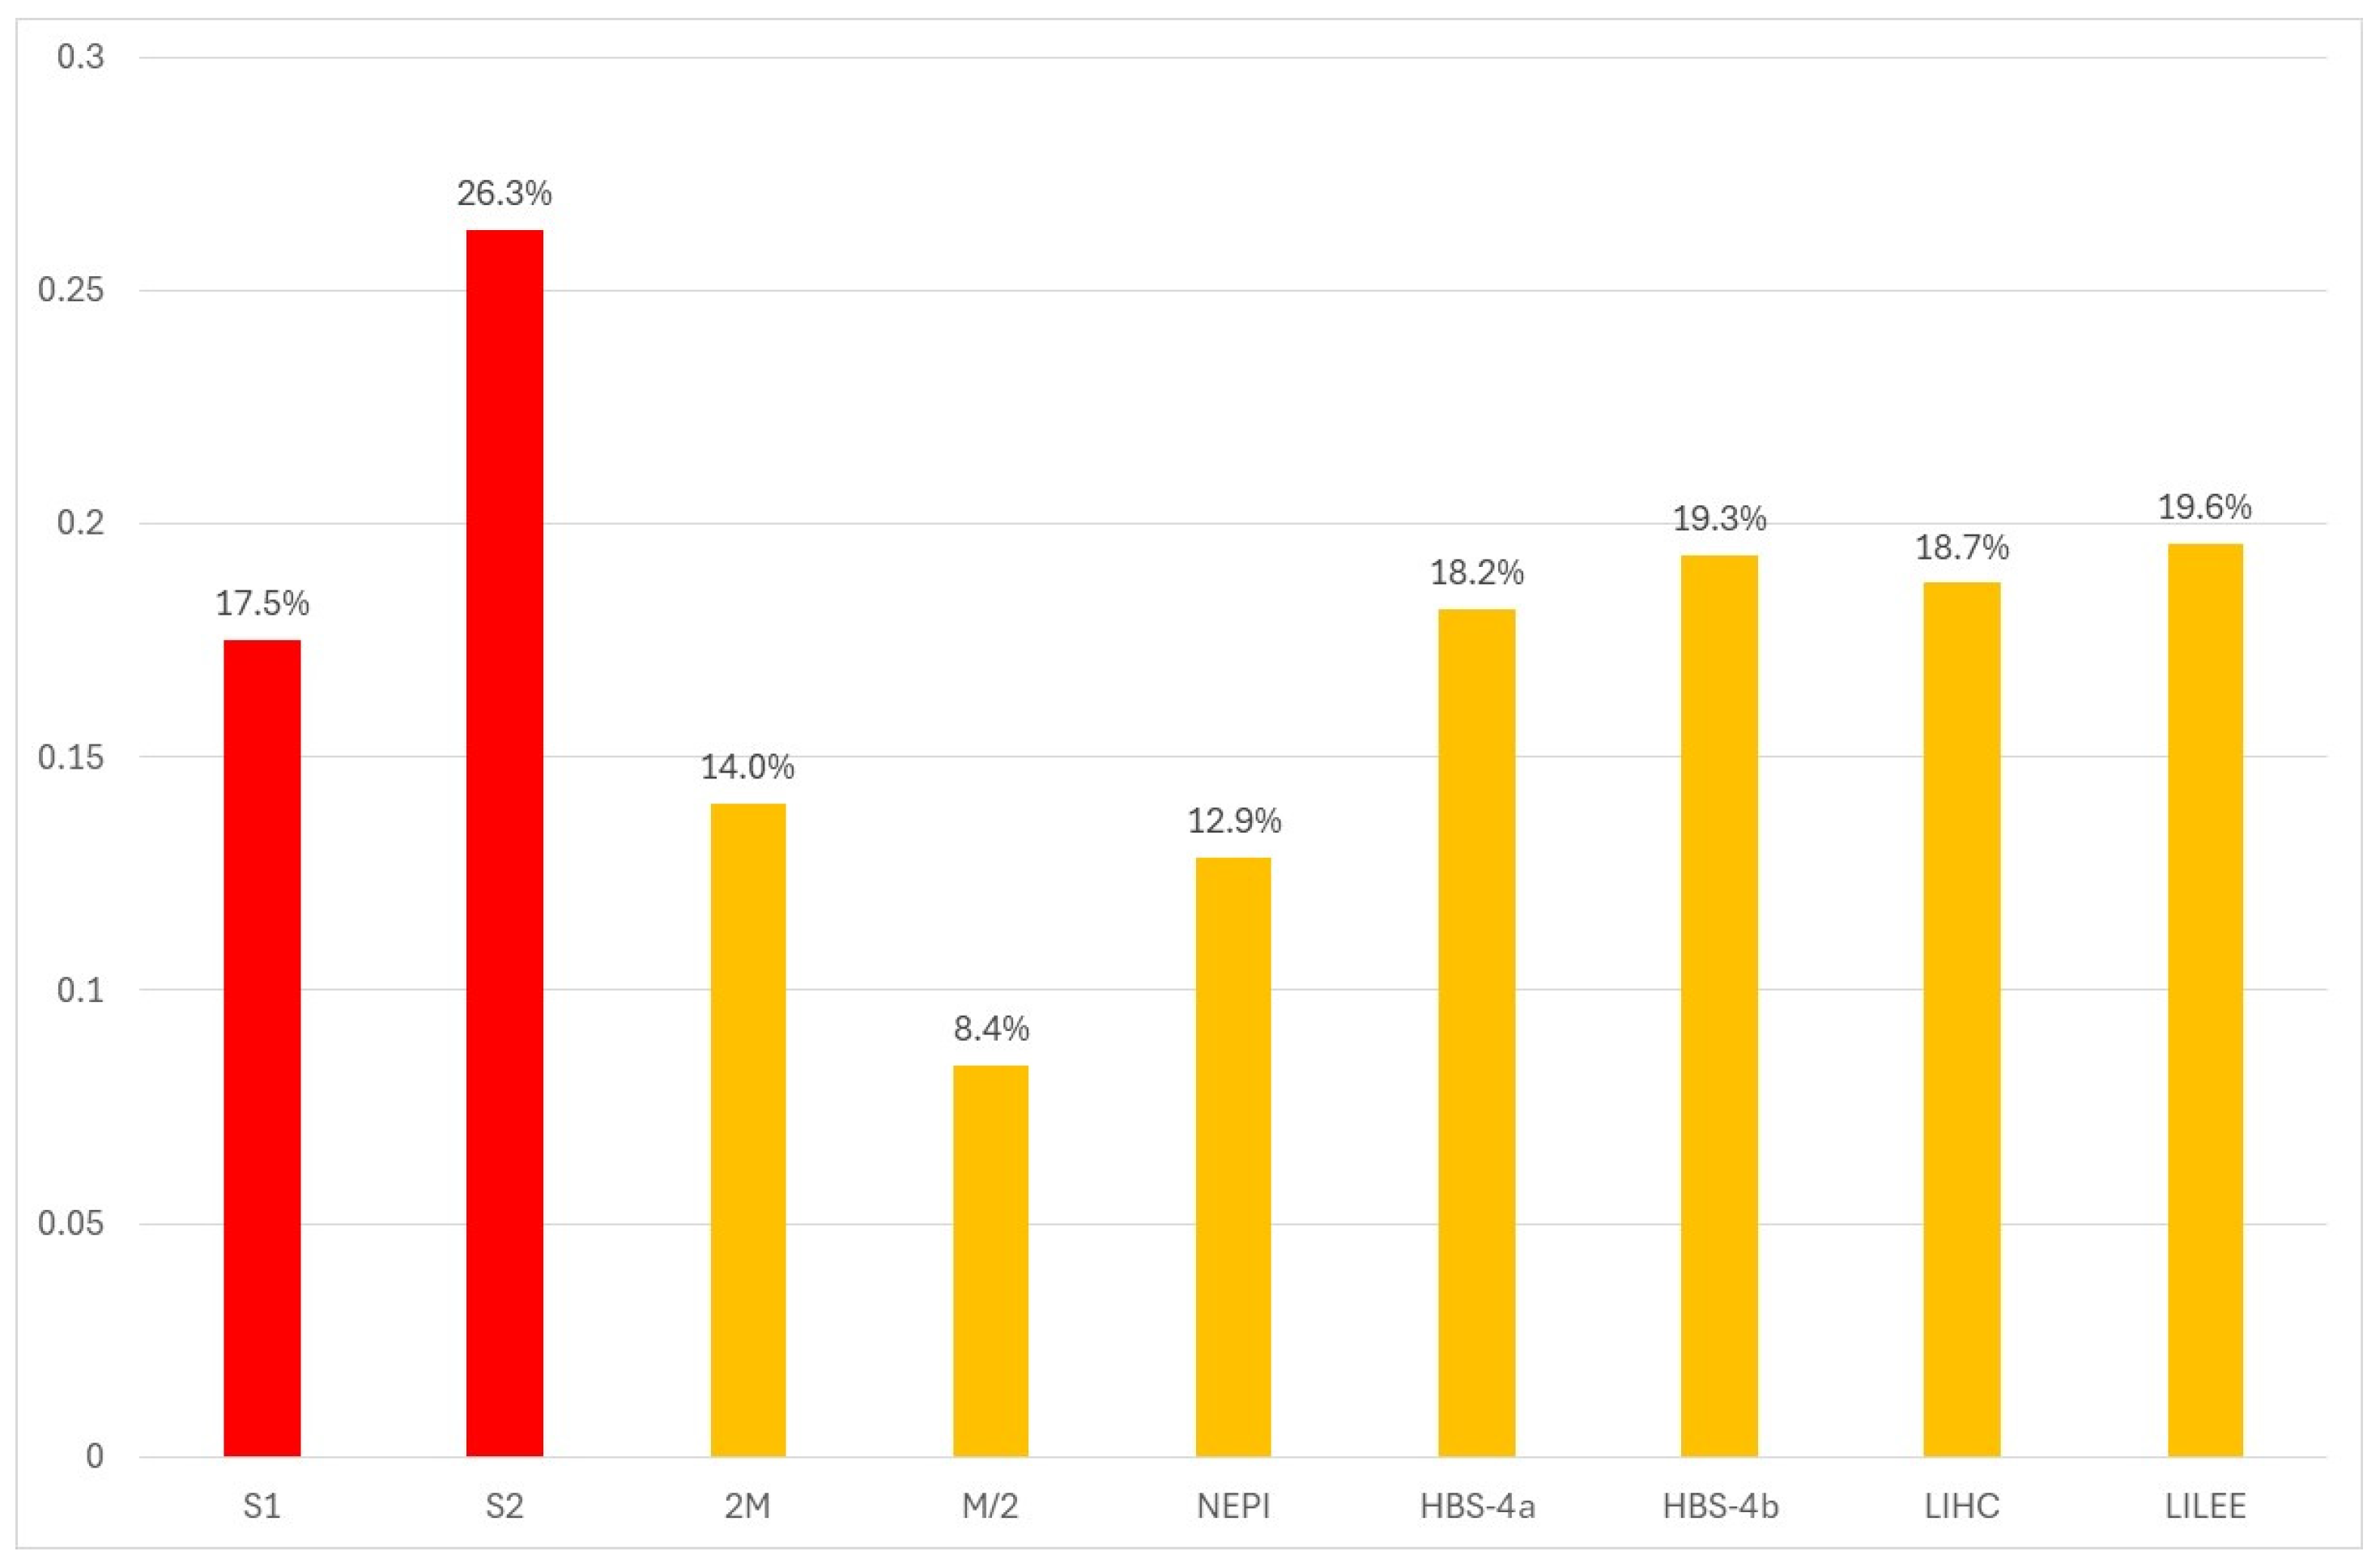
5.1. Rate of Energy Poverty in Greece Using Different Measures
- For the 2M and M/2 indicators, equivalent energy costs were calculated based on the scale shown in Table 2, while for the 2M indicator, the total household income from all sources was used and equivalized on the basis of the modified OECD scale.
- For the NEPI indicator, net household income was equivalized based on the original OECD scale, while energy costs were used in their primary form.
- As regards the HBS-4 indicator, two variants were calculated: The HBS-4a uses the old OECD scale to equivalize net incomes, while the HBS-4b uses the modified OECD scale. In both cases the energy costs were used in their primary form.
- The LIHC indicator considers the total income after housing costs. This is calculated by deducting from the total income of households the annual rent or mortgage payments for the permanent residence, which are both provided by the HBS. The resulting after housing cost income along with households’ energy expenditures are then equivalized using the corresponding scales provided in Table 2.
- As regards the LILEE indicator, since the HBS does not provide the energy class of the dwellings, it was assumed that in order to meet condition (i), a household should reside in a dwelling built before 1980. Regarding condition (ii), the same assumptions with those adopted for calculating the LIHC indicator have been used.

| Income | Energy Costs | ||||
|---|---|---|---|---|---|
| Composition of the Households | Old OECD Scale | Modified OECD Scale | Scale for After Housing Costs Income Used in the UK | Number of People in the Household | Scale |
| First adult | 1 | 1 | 0.58 | One | 0.82 |
| Subsequent adults (includes partners and children aged 14 or over) | 0.7 | 0.5 | 0.42 | Two | 1.00 |
| Children under 14 | 0.5 | 0.3 | 0.20 | Three | 1.07 |
| Four | 1.21 | ||||
| Five or more | 1.32 | ||||
5.2. Models for Detecting the Characteristics of Energy-Poor Households
- Household income (HH095th): In all three models, an increase in net household income decreases the probability of being characterized as energy-poor.
- Building age (DS018): The age of the dwelling was found to be a statistically significant factor in all models, affecting the probability of a household being characterized as energy-poor. Older homes generally have higher energy losses, requiring more energy to achieve adequate thermal comfort conditions, which increases the likelihood of energy poverty.
- Household size (HB05): Larger households are associated with a higher likelihood of energy poverty in all three models. This is likely due to increased energy needs and costs that these households have, as well as the necessity of maintaining adequate thermal comfort conditions for longer periods due to more household members being present.
- Household composition: The presence of elderly individuals in the household correlates positively with energy poverty across all models. In the model using the LIHC indicator, the presence of unemployed members is also associated with increased energy poverty, while the presence of young children (aged up to 4 years) is associated with a lower likelihood of energy poverty.
- Floor area (DS017): Larger floor areas are positively correlated with energy poverty only in the LIHC model. Larger dwellings usually require higher energy expenditure to achieve adequate thermal comfort conditions, and therefore the households living there have increased odds of energy poverty.
- Geographical location (ELXX): To some extent, regional differences in energy poverty are evident in all models, with Attica serving as the reference region. If a region is not included as an independent variable in the model, it indicates no significant difference compared to the reference region (i.e., Attica). More specifically, the NEPI and HBS-4b models present small geographical variations, with only 2–3 regions per model showing increased or reduced probabilities of energy poverty from the reference region. As these indicators focus on the under-consumption of energy, people have the flexibility to adjust their behavior and the use of heating systems, considering the climatic conditions, the energy prices, their income, etc. On the other hand, the LIHC model presents significant geographical differences, with six regions in Northern and Central Greece presenting increased rates of energy poverty, and two island regions reduced the chances of energy poverty. As the energy poverty indicator used in this model take into account the required energy expenditures for ensuring adequate indoor conditions, the climatic conditions, which differ significantly across the country, emerge as a key determinant of energy poverty.
- Heating systems: In all three models, heating with oil or LPG stoves (DA028-S) and electric appliances (DA028-EH) is linked to a higher likelihood of energy poverty. In the LIHC model, natural gas (DA028-NG), heat storage (DA028-HS), and biomass (DA028-W) systems are linked to lower energy poverty odds. Air conditioning and heat pumps (DA028-HP) are associated with increased energy poverty in the two models (NEPI and HBS-4b) but decreased odds in the other (LIHC). This could be attributed to the fact that these three indicators cover different populations affected by energy poverty. The NEPI and HBS-4b focus on households that under-consume energy, which, in many cases, use air conditioners to heat only some rooms of their dwelling. On the contrary, the LIHC incorporates the required energy needs of the dwellings, and as the air conditioners/heat pumps are characterized by relatively high efficiency, the model identified this technology as an option for reducing energy expenditures. Heating technologies not included as independent variables do not show a statistically significant impact compared to the reference technology (diesel oil).
- Housing type: In two models, households living in apartment buildings have a lower probability of being energy-poor compared to those in detached houses. Generally, the energy demand in these buildings can be satisfied more easily due to the proportionally smaller openings in their shell, thus resulting in less energy losses. Moreover, due to economies of scale, the fixed heating costs, such as maintenance of the boiler, cleaning costs, etc., for these dwellings are relatively lower.
- Tenure status: In the LIHC model, households paying a mortgage (DS012-IM) or rent (DS012-R) have a higher likelihood of energy poverty.
5.3. Evaluation of Main Policies Planned in Greece for Tackling Energy Poverty
- Μ1—Deep energy renovations: Interventions aimed at significantly upgrading the energy efficiency of the building envelope on a scale where the energy performance of the buildings constructed before 2010 will be comparable to the houses built in the country after 2010 based on the specifications of KENAK. The evaluation of the measure is performed through the variable DS018, considering that all renovated dwellings have a performance like those constructed in the period 2012–2016 (category 7).
- Μ2—Shallow energy renovations: Interventions aimed at achieving moderate upgrades in the energy efficiency of the building envelope at a scale where the buildings constructed before 1980 acquire an energy performance similar to that of buildings constructed in the period 1981–1995 and residential buildings constructed in the periods 1981–1995 and 1996–2005 obtain the energy performance of the buildings of the immediately following time periods, namely 1996–2005 and 2006–2011, respectively. The evaluation of the measure is performed again through the variable DS018, considering that the category of the renovated dwellings is improved according to the above-mentioned assumptions.
- Μ3—Modernization of heating systems: From the econometric analysis carried out in Section 5.2, it was found that houses that use oil and LPG stoves, electric appliances, and in some cases air conditioners (which usually do not cover the total area of the house) as their main heating system are positively correlated with increased odds of energy poverty. In the context of this analysis, the heating systems in question are upgraded or replaced so that the households living in these buildings can obtain energy services similar to those received by households living in residences having a central heating system. More specifically, the evaluation of the measure is performed through the parameter DA08, considering that the households with heating systems associated with high energy poverty levels start to use a central heating system with diesel oil.
- Μ4—Combined application of the measures M1 and M3. The evaluation of the measure is performed through the parameters DS018 and DA08.
- Μ5—Combined application of the measures M2 and M3. Again, the evaluation of the measure is performed through the parameters DS018 and DA08.
- Μ6—Provision of a subsidy of 750 EUR/year to households with an annual income below EUR 20,000. The financial assistance provided corresponds to the maximum amount of the space heating subsidy provided by the Greek State in 2021 for low- and middle-income households. It has been incorporated as additional income in the models used. So, the evaluation of the measure has been performed through the parameter HH095th.
- Μ7—Provision of a subsidy of 750 EUR/year to energy-poor households. The measure considers the targeted provision of the subsidy considered in M6 exclusively to energy-poor households based on the energy poverty indicators considered. It has been incorporated as additional income through the parameter HH095th in the models used.
- Μ8—Provision of a subsidy of 400 EUR/year to energy-poor households. The subsidy of M7 is adjusted to the mean value of the space heating subsidy provided by the Greek State in 2021. Again, it has been incorporated as additional income through the parameter HH095th in the models used.
6. Conclusions
Author Contributions
Funding
Institutional Review Board Statement
Informed Consent Statement
Data Availability Statement
Acknowledgments
Conflicts of Interest
Abbreviations
| 2M | High share of income on energy expenditure (energy poverty indicator) |
| APCEP | Action plan to combat energy poverty |
| DCEN | Degree of coverage of energy needs (energy poverty indicator) |
| ELSTAT | Hellenic Statistical Authority |
| EP | Energy poverty |
| EPC | Energy performance certificate |
| ETS2 | Emission trading system for buildings, road transport, and additional sectors |
| EUROSTAT | Statistical office of the European Union |
| EU-SILC | EU statistics on income and living conditions |
| FPEER | Fuel Poverty Energy Efficiency Rating |
| GHG | Greenhouse gas |
| HBS | Household budget survey |
| HBS-4a/HBS-4b | Energy poverty indicators developed in the context of this study. |
| KENAK | National regulation on energy performance of buildings |
| LIHC | Low income high cost (energy poverty indicator) |
| LILEE | Low income low energy efficiency (energy poverty indicator) |
| M/2 | Low absolute energy expenditure (energy poverty indicator) |
| MEPI | Multidimensional energy poverty index (energy poverty indicator) |
| NECP | National Climate and Energy Plan |
| NEPI | National energy poverty index (energy poverty indicator) |
| NUTS2 | EU nomenclature of territorial units for statistics, where 2 refers to basic regions |
| OECD | Organisation for Economic Co-operation and Development |
| REPowerEU | EU plan aimed at reducing Europe’s dependence on fossil fuels and accelerating the transition to green energy |
References
- Cabeza, L.F.; Vorsatz, U. The role of buildings in the energy transition in the context of the climate change challenge. Glob. Transit. 2020, 2, 257–260. [Google Scholar] [CrossRef]
- Ciancio, V.; Salata, F.; Falasca, A.; Gurci, G.; Golasi, I.; de Wilde, P. Energy demands of buildings in the framework of climate change: An investigation across Europe. Sustain. Cities Soc. 2020, 60, 102213. [Google Scholar] [CrossRef]
- IEA. Multiple Benefits of Energy Efficiency. Technical Report, International Energy Agency. 2025. CC BY 4.0. Available online: https://www.iea.org/reports/multiple-benefits-of-energy-efficiency (accessed on 29 April 2025).
- Thema, J.; Suerkemper, F.; Couder, J.; Mzavanadze, N.; Chatterjee, S.; Teubler, J.; Thomas, S.; Ürge-Vorsatz, D.; Bo Hansen, M.; Bouzarovski, S.; et al. The Multiple Benefits of the 2030 EU Energy Effciency Potential. Energies 2019, 12, 2798. [Google Scholar] [CrossRef]
- Smith, A.C.; Holland, M.; Korkeala, O.; Warmington, J.; Forster, D.; ApSimon, H.; Oxley, T.; Dickens, R.; Smith, S.M. Health and environmental co-benefits and conflicts of actions to meet UK carbon targets. Clim. Policy 2016, 16, 253–283. [Google Scholar] [CrossRef]
- Braungardt, S.; Bei der Wieden, M.; Kranzl, L. EU emissions trading in the buildings sector—An ex-ante assessment. Clim. Policy 2024, 25, 208–222. [Google Scholar] [CrossRef]
- Duma, D.; Postoiu, C.; Catuti, M. The Impact of the Proposed EU ETS 2 and the Social Climate Fund on Emissions and Welfare: Evidence from Literature and a New Simulation Model. Energy Policy Group (EPG) Report. 2022. Available online: https://www.euki.de/wp-content/uploads/2023/02/ETS2_Policy_Brief_EPG-1-1.pdf (accessed on 29 October 2024).
- Bouzarovski, S.; Petrova, S. A global perspective on domestic energy deprivation: Overcoming the energy poverty-fuel poverty binary. Energy Res. Soc. Sci. 2015, 10, 31–40. [Google Scholar] [CrossRef]
- MEE. National Energy and Climate Plan. Hellenic Republic Ministry of Environment and Energy. Revised Version August 2024. 2024. Available online: https://ia37rg02wpsa01.blob.core.windows.net/fek/02/2024/20240206983.pdf (accessed on 22 February 2025).
- Pallis, P.; Gkonis, N.; Varvagiannis, E.; Braimakis, K.; Karellas, S.; Katsaros, M.; Vourliotis, P. Cost effectiveness assessment and beyond: A study on energy efficiency interventions in Greek residential building stock. Energy Build. 2019, 182, 1–18. [Google Scholar] [CrossRef]
- Dascalaki, E.; Balaras, C.; Kontoyiannidis, S.; Droutsa, K. Modeling energy refurbishment scenarios for the Hellenic residential building stock towards the 2020 & 2030 targets. Energy Build. 2016, 132, 74–90. [Google Scholar] [CrossRef]
- Kouis, P.; Psistaki, K.; Giallouros, G.; Michanikou, A.; Kakkoura, M.; Stylianou, K.; Papatheodorou, S.; Paschalidou, A. Heat-related mortality under climate change and the impact of adaptation through air conditioning: A case study from Thessaloniki, Greece. Environ. Res. 2021, 199, 111285. [Google Scholar] [CrossRef]
- Jakubcionis, M.; Carlsson, J. Estimation of European Union residential sector space cooling potential. Energy Policy 2021, 101, 225–235. [Google Scholar] [CrossRef]
- Castaño-Rosa, R.; Barrella, R.; Sánchez-Guevara, C.; Barbosa, R.; Kyprianou, I.; Paschalidou, E.; Thomaidis, N.S.; Dokupilova, D.; Gouveia, J.P.; Kádár, J.; et al. Cooling Degree Models and Future Energy Demand in the Residential Sector. A Seven-Country Case Study. Sustainability 2021, 13, 2987. [Google Scholar] [CrossRef]
- Kalfountzou, E.; Tourkolias, C.; Mirasgedis, S.; Damigos, D. Identifying Energy-Poor Households with Publicly Available Information: Promising Practices and Lessons Learned from the Athens Urban Area, Greece. Energies 2024, 17, 919. [Google Scholar] [CrossRef]
- Lyra, K.; Mirasgedis, S.; Tourkolias, C. From measuring fuel poverty to identification of fuel poor households: A case study in Greece. Energy Effic. 2022, 15, 1–20. [Google Scholar] [CrossRef]
- Fizaine, F.; Kahouli, S. On the power of indicators: How the choice of fuel poverty indicator affects the identification of the target population. Appl. Econ. 2019, 51, 1081–1110. [Google Scholar] [CrossRef]
- Thomson, H.; Bouzarovski, S.; Snell, C. Rethinking the measurement of energy poverty in Europe: A critical analysis of indicators and data. Indoor Built Environ. 2017, 26, 879–901. [Google Scholar] [CrossRef]
- Thema, J.; Vondung, F. EPOV Indicator Dashboard: Methodology Guidebook; Wuppertal Institut für Klima, Umwelt, Energie GmbH: Wuppertal, Germany, 2020. [Google Scholar]
- Al Kez, D.; Foley, A.; Lowans, C.; Del Rio, D.F. Energy poverty assessment: Indicators and implications for developing and developed countries. Energy Convers. Manag. 2024, 307, 118324. [Google Scholar] [CrossRef]
- Halkos, G.; Kostakis, I. Exploring the persistence and transience of energy poverty: Evidence from a Greek household survey. Energy Effic. 2023, 16, 50. [Google Scholar] [CrossRef]
- Thema, J.; Vondung, F. Expenditure-Based Indicators of Energy Poverty—An Analysis of Income and Expenditure Elasticities. Energies 2020, 14, 8. [Google Scholar] [CrossRef]
- Halkos, G.E.; Gkampoura, E.-C. Coping with Energy Poverty: Measurements, Drivers, Impacts, and Solutions. Energies 2021, 14, 2807. [Google Scholar] [CrossRef]
- Herrero, S.T. Energy poverty indicators: A critical review of methods. Indoor Built Environ. 2017, 26, 1018–1031. [Google Scholar] [CrossRef]
- Boardman, B. Fuel poverty synthesis: Lessons learnt, actions needed. Energy Policy 2012, 49, 143–148. [Google Scholar] [CrossRef]
- Hills, J. Getting the Measure of Fuel Poverty: Final Report of the Fuel Poverty Review; Centre for Analysis of Social Exclusion: London, UK, 2012; Available online: https://sticerd.lse.ac.uk/dps/case/cr/casereport72.pdf (accessed on 29 October 2024).
- Price, C.W.; Brazier, K.; Wang, W. Objective and subjective measures of fuel poverty. Energy Policy 2012, 49, 33–39. [Google Scholar] [CrossRef]
- Department for Energy Security and Net Zero. Fuel Poverty Methodology Handbook (Low Income Low Energy Efficiency), Statistical Methodology; Department for Energy Security & Net Zero (DESNZ): London, UK, 2024.
- Nussbaumer, P.; Bazilian, M.; Modi, V. Measuring energy poverty: Focusing on what matters. Renew. Sustain. Energy Rev. 2012, 16, 231–243. [Google Scholar] [CrossRef]
- Pérez-Fargallo, A.; Marín-Restrepo, L.; Contreras-Espinoza, S.; Bienvenido-Huertas, D. Do we need complex and multidimensional indicators to assess energy poverty? The case of the Chilean indicator. Energy Build. 2023, 295, 113314. [Google Scholar] [CrossRef]
- Antepara, I.; Papada, L.; Gouveia, J.P.; Katsoulakos, N.; Kaliampakos, D. Improving Energy Poverty Measurement in Southern European Regions through Equivalization of Modeled Energy Costs. Sustainability 2020, 12, 5721. [Google Scholar] [CrossRef]
- Barrella, R.; Romero, J.C.; Linares, J.I.; Arenas, E.; Asín, M.; Centeno, E. The dark side of energy poverty: Who is underconsuming in Spain and why? Energy Res. Soc. Sci. 2022, 86, 102428. [Google Scholar] [CrossRef]
- Betto, F.; Garengo, P.; Lorenzoni, A. A new measure of Italian hidden energy poverty. Energy Policy 2020, 138, 111237. [Google Scholar] [CrossRef]
- Faiella, I.; Lavecchia, L. Energy poverty. How can you fight it, if you can’t measure it? Energy Build. 2021, 233, 110692. [Google Scholar] [CrossRef]
- Karpinska, L.; Śmiech, S. Invisible energy poverty? Analysing housing costs in Central and Eastern Europe. Energy Res. Soc. Sci. 2020, 70, 101670. [Google Scholar] [CrossRef]
- Meyer, S.; Laurence, H.; Bart, D.; Middlemiss, L.; Maréchal, K. Capturing the multifaceted nature of energy poverty: Lessons from Belgium. Energy Res. Soc. Sci. 2018, 40, 273–283. [Google Scholar] [CrossRef]
- Atsalis, A.; Mirasgedis, S.; Tourkolias, C.; Diakoulaki, D. Fuel poverty in Greece: Quantitative analysis and implications for policy. Energy Build. 2016, 131, 87–98. [Google Scholar] [CrossRef]
- Papada, L.; Kaliampakos, D. Energy poverty in Greek mountainous areas: A comparative study. J. Mt. Sci. 2017, 14, 1229–1240. [Google Scholar] [CrossRef]
- Papada, L.; Kaliampakos, D. A Stochastic Model for energy poverty analysis. Energy Policy 2018, 116, 153–164. [Google Scholar] [CrossRef]
- Santamouris, M.; Kapsis, K.; Korres, D.; Livada, I.; Pavlou, C.; Assimakopoulos, M. On the relation between the energy and social characteristics of the residential sector. Energy Build. 2007, 39, 893–905. [Google Scholar] [CrossRef]
- Santamouris, M.; Paravantis, J.A.; Founda, D.; Kolokotsa, D.; Michalakakou, P.; Papadopoulos, A.M.; Kontoulis, N.; Tzavali, A.; Stigka, E.K.; Ioannidis, Z.; et al. Financial crisis and energy consumption: A household survey in Greece. Energy Build. 2013, 65, 477–487. [Google Scholar] [CrossRef]
- Spiliotis, E.; Arsenopoulos, A.; Kanellou, E.; Psarras, J.; Kontogiorgos, P. A multi-sourced data based framework for assisting utilities identify energy poor households: A case-study in Greece. Energy Sources Part B Econ. Planning Policy 2020, 15, 49–71. [Google Scholar] [CrossRef]
- Boemi, S.-N.; Avdimiotis, S.; Papadopoulos, A.M. Domestic energy deprivation in Greece: A field study. Energy Build. 2017, 144, 167–174. [Google Scholar] [CrossRef]
- Papada, L.; Kaliampakos, D. Measuring energy poverty in Greece. Energy Policy 2016, 94, 157–165. [Google Scholar] [CrossRef]
- Balaskas, A.; Papada, L.; Katsoulakos, N.; Damigos, D.; Kaliampakos, D. Energy poverty in the mountainous town of Metsovo, Greece. J. Mt. Sci. 2021, 18, 2240–2254. [Google Scholar] [CrossRef]
- Kalfountzou, E.; Papada, L.; Damigos, D.; Degiannakis, S. Predicting energy poverty in Greece through statistical data analysis. Int. J. Sustain. Energy 2022, 41, 1605–1622. [Google Scholar] [CrossRef]
- Ntaintasis, E.; Mirasgedis, S.; Tourkolias, C. Comparing different methodological approaches for measuring energy poverty: Evidence from a survey in the region of Attika, Greece. Energy Policy 2019, 125, 160–169. [Google Scholar] [CrossRef]
- Papada, L.; Kaliampakos, D. Being forced to skimp on energy needs: A new look at energy poverty in Greece. Energy Res. Soc. Sci. 2020, 64, 101450. [Google Scholar] [CrossRef]
- ELSTAT. Household Budget Survey 2021. Press Release of the Hellenic Statistical Authority. 2022. Available online: https://www.statistics.gr/en/statistics/-/publication/SFA05/2021 (accessed on 29 October 2024).
- MEE. Action Plan to Combat Energy Poverty. Hellenic Republic Ministry of Environment and Energy. Ministerial Decision Adopted in September 2021. 2021. Available online: https://www.fao.org/faolex/results/details/en/c/LEX-FAOC211210/ (accessed on 29 October 2024).
- Centre for Analysis of Social Exclusion. Getting the Measure of Fuel Poverty. Executive Summary; CASEbrief31; Centre for Analysis of Social Exclusion: London, UK, 2012; ISSN 1460-9770. [Google Scholar]
- BRE. Fuel Poverty Methodology Handbook (Low Income Low Energy Efficiency)—Statistical Methodology. Department for Energy Security and Net Zero; 2023. Available online: https://www.gov.uk/government/collections/fuel-poverty-sub-regional-statistics (accessed on 29 October 2024).
- Dubois, U. From targeting to implementation: The role of identification of fuel poor households. Energy Policy 2012, 49, 107–115. [Google Scholar] [CrossRef]
- Kashour, M.; Jaber, M.M. Revisiting energy poverty measurement for the European Union. Energy Res. Soc. Sci. 2024, 109, 103420. [Google Scholar] [CrossRef]
- Palma, P.; Gouveia, J.P.; Mahoney, K.; Bessa, S. It Starts at Home: Space Heating and Cooling Efficiency for Energy Poverty and Carbon Emissions Reduction in Portugal. People Place Policy Online 2022, 16, 13–32. [Google Scholar] [CrossRef]
- Romero, J.C.; Linares, P.; Rodriguez-Matas, A.F.; Perez-Bravo, M. Illustrating the conflicts between energy poverty and decarbonization in the energy transition. A case example in Spain. Energy 2025, 314, 134204. [Google Scholar] [CrossRef]
- Kalinowski, S.; Łuczak, A.; Szczygieł, O.; Wojciechowska, A.; Zwęglińska-Gałecka, D.; Paczek, B. To heat or not to heat? On (In)perceptible energy poverty among the poor. Ann. Pol. Assoc. Agric. Agribus. Econ. 2024, XXVI, 124–138. [Google Scholar] [CrossRef]

| Authors | Type of Data | Year of Data | Geographical Extent | EP Indicators | EP Results |
|---|---|---|---|---|---|
| [40] | Primary data (1110 households) | 2004 | Local (Athens) | “10% rule” | 1.63% |
| [41] | Primary data (598 households) | 2012 | Nation-wide | “10% rule” | Winter 2009-10: 11.1% Winter 2010-11: 11.7% |
| [37] | Secondary data (EU-SILC and HBS) | 2004 and 2008–2013 (HBS) 2003–2014 (EU-SILC) | Nation-wide | (i) “10% rule” using the full income (ii) “10% rule” using the equivalent income (iii) subjective indicators from EU-SILC | Objective indicators: from 2.5–4.8% (2004) to 20–25% (2013) Subjective indicators: from 17.4% to 30.5% (2003) to 13.7–37.3% (2014) |
| [44] | Primary data (400 households) | March to May 2015 | Nation-wide | (i) subjective: EU-SILC’s indicators, health problems related to poor indoor conditions, and restriction of other essential needs to have adequate heating (ii) “10% rule” | Health issues: 22% Arrears: 18.8% Damp/mold problems: 37.5% Inadequately heated home: 42.2% Cutbacks in essentials to cover energy needs: 75% “10% rule”: 58% |
| [43] | Primary data (762 households) | November 2015 to July 2016 | North Greece | (i) inability to maintain the temperature inside the house (ii) arrears in energy bills | (i) Inability to maintain the temperature inside the house: 22.6% (“rarely so”) (ii) Arrears in energy bills: 10% |
| [38] | Primary data (400 households living in mountainous areas) | March to May 2015 | Nation-wide (mountainous areas) | (i) subjective: EU-SILC’s indicators, health problems related to poor indoor conditions, and restriction of other essential needs to have adequate heating (ii) “10% rule” | Health issues: 25% Arrears: 20% Damp/mold problems: 46% Inadequately heated home: 38.5% Cutbacks in essentials to cover energy needs: 73.5% “10% rule”: 73.5% |
| [39] | Combination of primary and secondary data | 2015 | Nation-wide | (i) “10% rule” with modeled energy consumption | “10% rule”: 18% |
| [47] | Primary data (451 households) | September and November 2017 | Regional (Attica) | (i) objective: “10% rule” with real (O1) and estimated energy costs (O2) (ii) subjective: EU-SILC’s indicators (S1–S3), inability to keep home adequately cool during summer (S4), health problems related to poor indoor conditions (S5), and restriction of other essential needs to have adequate heating (S6) (iii) composite indices combining objective and subjective indicators (C1 and C2) | (i) Objective: O1: 24.6% and O2: 42.9% (ii) Subjective: S1: 35.7%; S2: 46.8%; S3: 33.5%; S4: 25.1%; S5: 16.6%; and S6: 58.3% (iii) Composite: C1: 37% and C2: 43.5% |
| [48] | Primary data (800 households—400 living in mountainous areas) combined with a stochastic model | March to May 2015 | Nation-wide | Degree of coverage of energy needs | Country average: 0.98 Mountainous areas: 0.89 |
| [42] | Primary end-user energy data provided by a natural gas company (4027 households) | 2018 | Regional (Attica) | “10% rule” adjusted by a set of weather-driven, income-oriented, and energy-oriented variables | A total of 15–27% spend more than 10% of their income for heating purposes, and more than 12% consume less energy than the desired amount |
| [45] | Primary data (300 households) | December 2018–January 2019 | Local (Metsovo town) | (i) subjective indicators from EU-SILC (ii) subjective indicators by the authors (e.g., health problems due to inadequate heating) (iii) “10% rule | Health issues: 2% Arrears: 8% Damp/mold problems: 34% Inadequately heated home: 38% Cutbacks in essentials to cover energy needs: 65% “10% rule”: over 90% |
| [46] | Secondary data (EU-SILC and HBS) | HBS: 2008–2019 EU-SILC: 2003–2020 | Nation-wide | (i) objective indicators: 10%, 2M, 2M EXP, M/2, and M/2 EXP (ii) subjective indicators from EU-SILC | 10%: 10.6–25.1% 2M: 13.5–17.9% M/2: 12.5–18% Inadequately heated home: 12–32.9% Arrears: 15.7–42.2% Damp/mold problems: 12.5–20.9% |
| [16] | Secondary data (EU-SILC) | 2010–2019 | Nation-wide | (i) subjective indicators from EU-SILC (ii) a composite indicator | Inadequately heated home: 15.4–32.9% Arrears: 18.8–42.2% Damp/mold problems: 12.5–17.1% Composite indicator (2017 only): 41% |
| [21] | Secondary data (EU-SILC—4466 identical households over time) | 2017–2020 | Nation-wide | Subjective indicators from EU-SILC | Inadequately heated home: 22.5% Arrears: 28.2% Damp/mold problems: 14.9% |
| [15] | Secondary data (EU-SILC and HBS) | 2017–2021 | Local (Athens urban area) | (i) subjective indicators: EP 1-leaking roof, damp, and rot; EP 2-inability to keep home adequately warm; EP 3-arrears on utility bills; EP 4-weighted composite index; EP 5-any form of EP (ii) objective indicators: 2M, M2, official national energy poverty index (NEPI), modified NEPI, modified LIHC, and modified LILEE | Average values EP 1: 11.2% EP 2: 20.5% EP 3: 27% EP 4: 43% EP 5: 43% 2M: 4.1% M/2: 13% NEPI: 9.9% Modified NEPI: 10.2% Modified LIHC: 21.8% Modified LILEE: 6.4% |
| NEPI | HBS-4b | LIHC | ||||||||||
|---|---|---|---|---|---|---|---|---|---|---|---|---|
| B | S.E. | Sig. | Exp(B) | B | S.E. | Sig. | Exp(B) | B | S.E. | Sig. | Exp(B) | |
| HB05 | 1.909 | 0.089 | 0.000 | 6.743 | 1.475 | 0.072 | 0.000 | 4.373 | 1.137 | 0.071 | 0.000 | 3.116 |
| DS018 | −0.454 | 0.056 | 0.000 | 0.635 | −0.703 | 0.053 | 0.000 | 0.495 | −1.494 | 0.067 | 0.000 | 0.224 |
| DS017 | 0.017 | 0.002 | 0.000 | 1.017 | ||||||||
| EL42 | −0.754 | 0.313 | 0.016 | 0.471 | ||||||||
| EL51 | 2.046 | 0.206 | 0.000 | 7.734 | ||||||||
| EL52 | 2.150 | 0.154 | 0.000 | 8.584 | ||||||||
| EL53 | 0.930 | 0.283 | 0.001 | 2.534 | 2.540 | 0.252 | 0.000 | 12.674 | ||||
| EL54 | 2.113 | 0.226 | 0.000 | 8.270 | ||||||||
| EL61 | 0.474 | 0.194 | 0.015 | 1.606 | 1.992 | 0.209 | 0.000 | 7.327 | ||||
| EL62 | −0.978 | 0.351 | 0.005 | 0.376 | ||||||||
| EL63 | 0.712 | 0.208 | 0.001 | 2.039 | 0.625 | 0.196 | 0.001 | 1.869 | 0.470 | 0.204 | 0.021 | 1.600 |
| EL64 | −0.608 | 0.273 | 0.026 | 0.545 | ||||||||
| KidsL4 | −1.539 | 0.348 | 0.000 | 0.215 | ||||||||
| Elderly | 0.573 | 0.140 | 0.000 | 1.773 | 0.631 | 0.120 | 0.000 | 1.879 | 1.045 | 0.139 | 0.000 | 2.844 |
| UNEM-C | 0.399 | 0.143 | 0.005 | 1.490 | ||||||||
| HH095th | −0.667 | 0.025 | 0.000 | 0.513 | −0.615 | 0.021 | 0.000 | 0.540 | −0.320 | 0.013 | 0.000 | 0.726 |
| DS012-IM | 0.866 | 0.274 | 0.002 | 2.376 | ||||||||
| DS012-R | 2.121 | 0.173 | 0.000 | 8.337 | ||||||||
| DS011-FSB | −0.282 | 0.113 | 0.013 | 0.754 | −1.891 | 0.144 | 0.000 | 0.151 | ||||
| DS011-FBB | −2.119 | 0.180 | 0.000 | 0.120 | ||||||||
| DA028-NG | −1.797 | 0.247 | 0.000 | 0.166 | ||||||||
| DA028-S | 0.926 | 0.253 | 0.000 | 2.524 | 0.964 | 0.238 | 0.000 | 2.622 | 1.826 | 0.237 | 0.000 | 6.207 |
| DA028-HS | −4.218 | 1.075 | 0.000 | 0.015 | ||||||||
| DA028-W | −0.966 | 0.167 | 0.000 | 0.381 | ||||||||
| DA028-EH | 1.041 | 0.162 | 0.000 | 2.833 | 1.261 | 0.151 | 0.000 | 3.529 | 1.405 | 0.173 | 0.000 | 4.074 |
| DA028-HP | 0.975 | 0.179 | 0.000 | 2.651 | 0.920 | 0.164 | 0.000 | 2.510 | −1.366 | 0.244 | 0.000 | 0.255 |
| DA028-OTHER | 0.445 | 0.162 | 0.006 | 1.560 | 0.987 | 0.157 | 0.000 | 2.684 | ||||
| Constant | 1.310 | 0.262 | 0.000 | 3.705 | 3.571 | 0.254 | 0.000 | 35.538 | 2.090 | 0.290 | 0.000 | 8.082 |
| −2 Log likelihood | 2025.488 | 2586.692 | 2568.087 | |||||||||
| Cox & Snell R-Squared | 35.1% | 42.6% | 41.8% | |||||||||
| Nagelkerke R-Squared | 65.6% | 68.1% | 67.5% | |||||||||
| NEPI | HBS-4b | LIHC | |
|---|---|---|---|
| TP | 478 | 845 | 775 |
| TN | 5126 | 4645 | 4678 |
| FP | 149 | 238 | 241 |
| FN | 300 | 325 | 359 |
| Accuracy | 92.6% | 90.7% | 90.1% |
| Precision | 76.2% | 78.0% | 76.3% |
| Sensitivity | 61.4% | 72.2% | 68.3% |
| Specificity | 97.2% | 95.1% | 95.1% |
| Policy Measures | NEPI | HBS-4b | LIHC |
|---|---|---|---|
| Μ1—Deep energy renovations | 59% | 77% | 99% |
| Μ2—Shallow energy renovations | 22% | 37% | 72% |
| Μ3—Use of modern heating systems | 17% | 15% | 13% |
| Μ4—Combined application of measures M1 and M3 | 69% | 84% | 99% |
| Μ5—Combined application of measures M2 and M3 | 36% | 49% | 79% |
| Μ6—Provision of a subsidy of 750 EUR/year to households with an annual income of less than EUR 20,000 | 22% | 22% | 9% |
| Μ7—Provision of a subsidy of 750 EUR/year to energy-poor households | 15% | 15% | 6% |
| Μ8—Provision of a subsidy of 400 EUR/year to energy-poor households | 9% | 7% | 3% |
Disclaimer/Publisher’s Note: The statements, opinions and data contained in all publications are solely those of the individual author(s) and contributor(s) and not of MDPI and/or the editor(s). MDPI and/or the editor(s) disclaim responsibility for any injury to people or property resulting from any ideas, methods, instructions or products referred to in the content. |
© 2025 by the authors. Licensee MDPI, Basel, Switzerland. This article is an open access article distributed under the terms and conditions of the Creative Commons Attribution (CC BY) license (https://creativecommons.org/licenses/by/4.0/).
Share and Cite
Sarafidis, Y.; Mirasgedis, S.; Gakis, N.; Kalfountzou, E.; Kapetanakis, D.; Georgopoulou, E.; Tourkolias, C.; Damigos, D. Analyzing Energy Poverty and Its Determinants in Greece: Implications for Policy. Sustainability 2025, 17, 5645. https://doi.org/10.3390/su17125645
Sarafidis Y, Mirasgedis S, Gakis N, Kalfountzou E, Kapetanakis D, Georgopoulou E, Tourkolias C, Damigos D. Analyzing Energy Poverty and Its Determinants in Greece: Implications for Policy. Sustainability. 2025; 17(12):5645. https://doi.org/10.3390/su17125645
Chicago/Turabian StyleSarafidis, Yannis, Sevastianos Mirasgedis, Nikos Gakis, Elpida Kalfountzou, Dimitris Kapetanakis, Elena Georgopoulou, Christos Tourkolias, and Dimitris Damigos. 2025. "Analyzing Energy Poverty and Its Determinants in Greece: Implications for Policy" Sustainability 17, no. 12: 5645. https://doi.org/10.3390/su17125645
APA StyleSarafidis, Y., Mirasgedis, S., Gakis, N., Kalfountzou, E., Kapetanakis, D., Georgopoulou, E., Tourkolias, C., & Damigos, D. (2025). Analyzing Energy Poverty and Its Determinants in Greece: Implications for Policy. Sustainability, 17(12), 5645. https://doi.org/10.3390/su17125645