Article

Unequal Paths to Decarbonization in an Aging Society: A Multi-Scale Assessment of Japan’s Household Carbon Footprints

1
School of Business, Heze University, 2269 Daxue Road, Mudan District, Heze 274021, China
2
College of Politics and Law, Heze University, 2269 Daxue Road, Mudan District, Heze 274021, China
*
Author to whom correspondence should be addressed.
Sustainability 2025, 17(12), 5627; https://doi.org/10.3390/su17125627
Submission received: 28 April 2025 / Revised: 28 May 2025 / Accepted: 17 June 2025 / Published: 18 June 2025
(This article belongs to the Section Environmental Sustainability and Applications)

Abstract

:
Japan’s shift to a super-aged society is reshaping household carbon footprint (HCF) in ways that vary by age, income, and region. Drawing on a two-tier national–prefectural framework, we quantify the influence of demographic shifts on HCF and evaluate inequalities, and project prefectural HCF to 2050 under fixed 2005 technology and consumption baselines. Nationally, emissions follow an inverted-U age curve, peaking at the 50–54 s (2.16 tCO2) and dropping at both the younger and older ends. Carbon inequality—the gap between high- and low-income households—displays the opposite U shape, being the widest below 30 and above 85. Regional HCF patterns add a further layer: while the inverted U persists, its peak shifts to the 60–64 s in high-income prefectures such as Tokyo—where senior emissions rise by 44% by 2050—and to the 45–49 s in low-income prefectures such as Akita, where younger age groups cut emissions by 58%. Although spatial carbon inequality narrows through midlife, it widens again in old age as eldercare and home energy needs grow. These findings suggest that a uniform mitigation trajectory overlooks key cohorts and regions. To meet the 2050 net-zero target, Japan should integrate age-, income-, and region-specific interventions—for example, targeted carbon pricing, green finance for middle-aged consumers, and less-urban low-carbon eldercare—into its decarbonization roadmap.

1. Introduction

1.1. Background

Global climate governance has increasingly prioritized carbon mitigation, with nations under the Paris Agreement committing to net-zero targets to limit global temperature rise to 1.5 °C [1]. In alignment with these commitments, Japan has committed to a 46% reduction in greenhouse gas emissions by 2030 relative to 2013 levels and to achieving net-zero emissions by 2050 [2]. Although supply-side decarbonization—including industrial efficiency gains and structural shifts toward low-carbon energy—has yielded substantial emissions savings, the proportional contribution of household consumption to national emissions has risen to approximately 80% [3,4]. In this context, technological interventions alone are subject to diminishing returns, rendering lifestyle and behavioral changes indispensable for closing residual emissions gaps. To operationalize this demand-side focus, Japan has introduced a suite of household-targeted policies. For example, the global warming countermeasure tax imposes a modest levy on fossil fuel consumption [5]; emissions trading systems in Tokyo and Saitama target large emitters and, through market mechanisms, exert downstream effects on residential energy prices [6,7]; and subsidies for zero-energy houses incentivize the adoption of highly efficient homes [8]. However, rapid demographic aging in Japan is not merely shifting the age composition but is also fundamentally transforming demand-side consumption profiles and, consequently, the determinants of household carbon footprint (HCF). To sustain both the efficacy and the distributive fairness of existing policy instruments such as carbon levies and retrofit subsidies, it is therefore imperative that demographic transitions be systematically integrated into policy design.
Disparities in CO2 emissions among social groups have led to the concept of carbon inequality, which not only raises concerns of social justice but also serves as a critical precondition for achieving the Sustainable Development Goals. Incorporating carbon equity considerations into mitigation strategies can significantly improve both public acceptance and policy effectiveness [9]. Traditionally, income inequality has been identified as the primary driver of carbon inequality, with higher-income households contributing disproportionately to emissions due to their greater consumption, thereby skewing the distribution of mitigation burdens and social benefits [10]. However, an increasing body of research highlights the demographic age structure as another equally significant factor influencing emissions disparities [11,12]. As societies age, distinct cohorts display differing consumption patterns and energy-use behaviors, further exacerbating imbalances in CO2 emissions.
Japan, one of the world’s most rapidly aging societies, is undergoing significant shifts in its population age structure, which are reshaping household consumption patterns and altering carbon inequality [13]. As the proportion of elderly households increases, the evolving HCF profiles present new challenges to long-term mitigation efforts [14]. The limited adoption of eco-friendly practices among the elderly exacerbates energy use for heating and cooking, leading to end-use emissions that eventually equal or surpass those of younger households, whose higher CO2 emissions stem from transportation and discretionary consumption [15]. Moreover, income inequality exacerbates these disparities, creating a pronounced dual axis of carbon inequality in Japanese society, characterized by significant heterogeneity in HCF across both demographic and economic dimensions.
The impact of demographic aging on HCF varies considerably across national and regional scales [15,16]. National averages often obscure substantial spatial heterogeneity, as Japan’s prefectures differ in both aging intensity and economic structure, leading to significant disparities in HCF [17]. For instance, while Tokyo, with its relatively young population, contributes the highest total HCF, its per-household emissions are lower than those of Okayama, an economically disadvantaged prefecture with a higher aging profile [18]. These regional disparities highlight that macro-level aging effects do not necessarily translate uniformly at the local level. Although national mitigation targets provide a cohesive framework, local capacities and challenges differ, underscoring the need for region-specific climate strategies. Therefore, to meet its national emission reduction goals effectively, Japan must address the carbon inequality arising from the heterogeneous regional characteristics.

1.2. Literature Review

1.2.1. Methodological Approaches for HCF Estimation

HCF can be estimated by three main approaches: environmentally extended input–output (EEIO) analysis, life cycle assessment (LCA), and the consumer lifestyle approach (CLA). EEIO uses a top-down, economy-wide framework that integrates sectoral emission-intensity factors into standard IO tables, capturing both direct and upstream indirect emissions embodied in final demand. For example, Zhang et al. [11] employ an IO model to capture age cohort-specific heterogeneity in consumption structures and HCF. Its adaptability to multi-regional IO (MRIO) or subnational IO tables enables spatial disaggregation from national to prefectural levels; for instance, Huang et al. [19] built a monthly Japanese HCF dataset spanning national, regional, and city scales. In contrast, LCA is a bottom-up methodology for quantifying the environmental impacts of products or processes throughout their entire life cycle. It can be highly data-intensive, since energy and material flows must be quantified at each stage. For example, Campos et al. [20] employ an LCA approach—centered on the CF impact category—to quantify tourism-related emissions using comprehensive life cycle inventory data. The CLA—introduced by Bin and Dowlatabadi [21]—merges household expenditure data with carbon intensities and incorporates demographics, attitudes, and household characteristics. For example, Du et al. [22] used CLA on China’s CFPS data to estimate consumption-based emissions. However, CLA lacks a universally standardized protocol, which may hinder cross-study comparability. For our aim—analyzing HCF variations by age cohort and region—the EEIO approach is particularly appropriate, as it readily accommodates demographic and geographic disaggregation when matched with suitable consumption and population data.

1.2.2. Aging Impacts Across National Contexts

In Japan’s super-aged society, urban elderly households, whose greater wealth ac-cumulation drives significantly higher spending on energy-intensive categories like housing and heating, now exhibit the highest age-based HCF [23]. In contrast, studies from emerging economies, particularly in China, suggest that aging can reduce household emissions, as older cohorts tend to favor frugal consumption and engage less in energy-intensive activities, resulting in a net mitigation effect [24]. Additionally, demographic shifts toward smaller households can diminish economies of scale in shared public re-sources, thereby increasing per capita carbon burdens [25]. These contrasting findings highlight the considerable variation in how demographic changes influence HCF across different national contexts. Furthermore, recent studies have incorporated demographic projections into dynamic HCF assessment models, offering new insights into future emission trajectories. For instance, Wang et al. [14] examine the impact of demographic shifts on age-specific HCF in the U.S. and Japan, revealing that ignoring population dynamics can lead to overestimations of carbon policy effectiveness in rapidly aging societies.

1.2.3. Demographic Aging and HCF Pathways

As population aging accelerates, increasing attention is being given to how shifts in age structure impact HCF [11,12,26]. Systematic variations in consumption preferences and lifestyles across different life stages lead to distinct life cycle HCF profiles [27,28]. Notably, population aging can both mitigate and exacerbate household emissions through complex, multidimensional mechanisms. On one hand, seniors frequently adopt more frugal consumption habits, thereby reducing emissions in certain sectors [29]; on the other hand, the rising prevalence of smaller elderly households increases per capita energy consumption and infrastructure-related carbon intensity, while behavioral inertia further hinders the adoption of low-carbon technologies among older populations [30]. For instance, Wang & Liu [4] demonstrate that elderly households typically reduce spending on clothing, entertainment, and transportation, while spending more time indoors, which, in turn, leads to an increase in household energy consumption.

1.2.4. Multidimensional Inequalities in HCF

The growing focus on HCF has driven scholars to explore carbon inequalities across social groups [31,32]. HCF magnitude and composition vary significantly, influenced by economic stages [33], demographic structures [34], and regionality [35]. From an income perspective, global estimates indicate that in 2019, the wealthiest 10% were responsible for nearly half of all CO2 emissions, while the poorest 50% contributed only 12% [36]. Regarding age, older cohorts now account for an increasing share of consumption-based emissions in developed countries, raising concerns about intergenerational equity [37]. Spatially, disparities in HCF emerge due to differences in development levels and consumption patterns [38]. Metropolitan areas, with higher incomes and younger populations, typically exhibit higher per capita HCF, while areas facing youth out-migration and accelerated aging tend to have lower emissions [39,40]. However, most studies focus on a single dimension of inequality [15,41,42] and fail to capture the complexity of carbon inequality arising from their interactions. This study addresses this gap by developing a unified framework that comprehensively examines HCF distributions across income, age, and regional dimensions, offering a more robust assessment of multidimensional carbon inequalities.

1.3. Research Purpose

Japan is undergoing an unprecedented acceleration in population aging, accompanied by pronounced disparities across prefectures. In this context, this study aims to clarify how deep-seated shifts in age structure and regional heterogeneity—both of which re-shape consumption patterns and amplify inequalities in HCF—drive the mechanisms underlying HCF formation and its spatiotemporal variability, thereby illuminating the principal determinants and evolutionary pathways of carbon inequality. To achieve this, we innovatively implement a dual-scale analytical framework that integrates age-structured demographics at both national and prefectural levels within an EEIO architecture (Figure 1). At the national tier, we disaggregate HCF by thirteen age cohorts and ten income deciles—thereby embedding age structure directly into the EEIO model—and apply the carbon footprint Gini (CF-Gini) approach to quantify within-cohort, income-based inequalities. At the prefectural tier, we integrate the same age cohort disaggregation into an MRIO-augmented EEIO framework to evaluate HCF from 2005 and project prefectural HCF trajectories from 2020 to 2050 based on demographic forecasts, then deploy the Dagum–Gini approach to isolate spatial sources of age-driven carbon disparities. By targeting cohort-specific disparities and capturing regional variation across multiple scales within Japan’s rapidly aging population, this innovative dual-scale framework systematically reveals how demographic aging reshapes HCF both within and between age cohorts and prefectures. It uncovers the cumulative effects of long-term mitigation policies alongside hidden equity trade-offs, and disentangles the combined roles of age, income, and spatial heterogeneity to yield actionable, equity-focused insights. These findings support the development of differentiated, precision emission reduction strategies and provide empirical guidance for designing nuanced carbon-neutrality instruments.
The remainder of the paper is organized as follows. Section 2 describes the methodology and data used in this work, and Section 3 presents the results and discussion. Section 4 concludes the paper with policy implications.

2. Materials and Methods

Using household consumption data, we first assess HCF at both the national and the prefectural level. We subsequently analyze carbon inequalities from both income and spatial perspectives. Finally, leveraging prefectural demographic data, we project the long-term trends of HCF across prefectures.

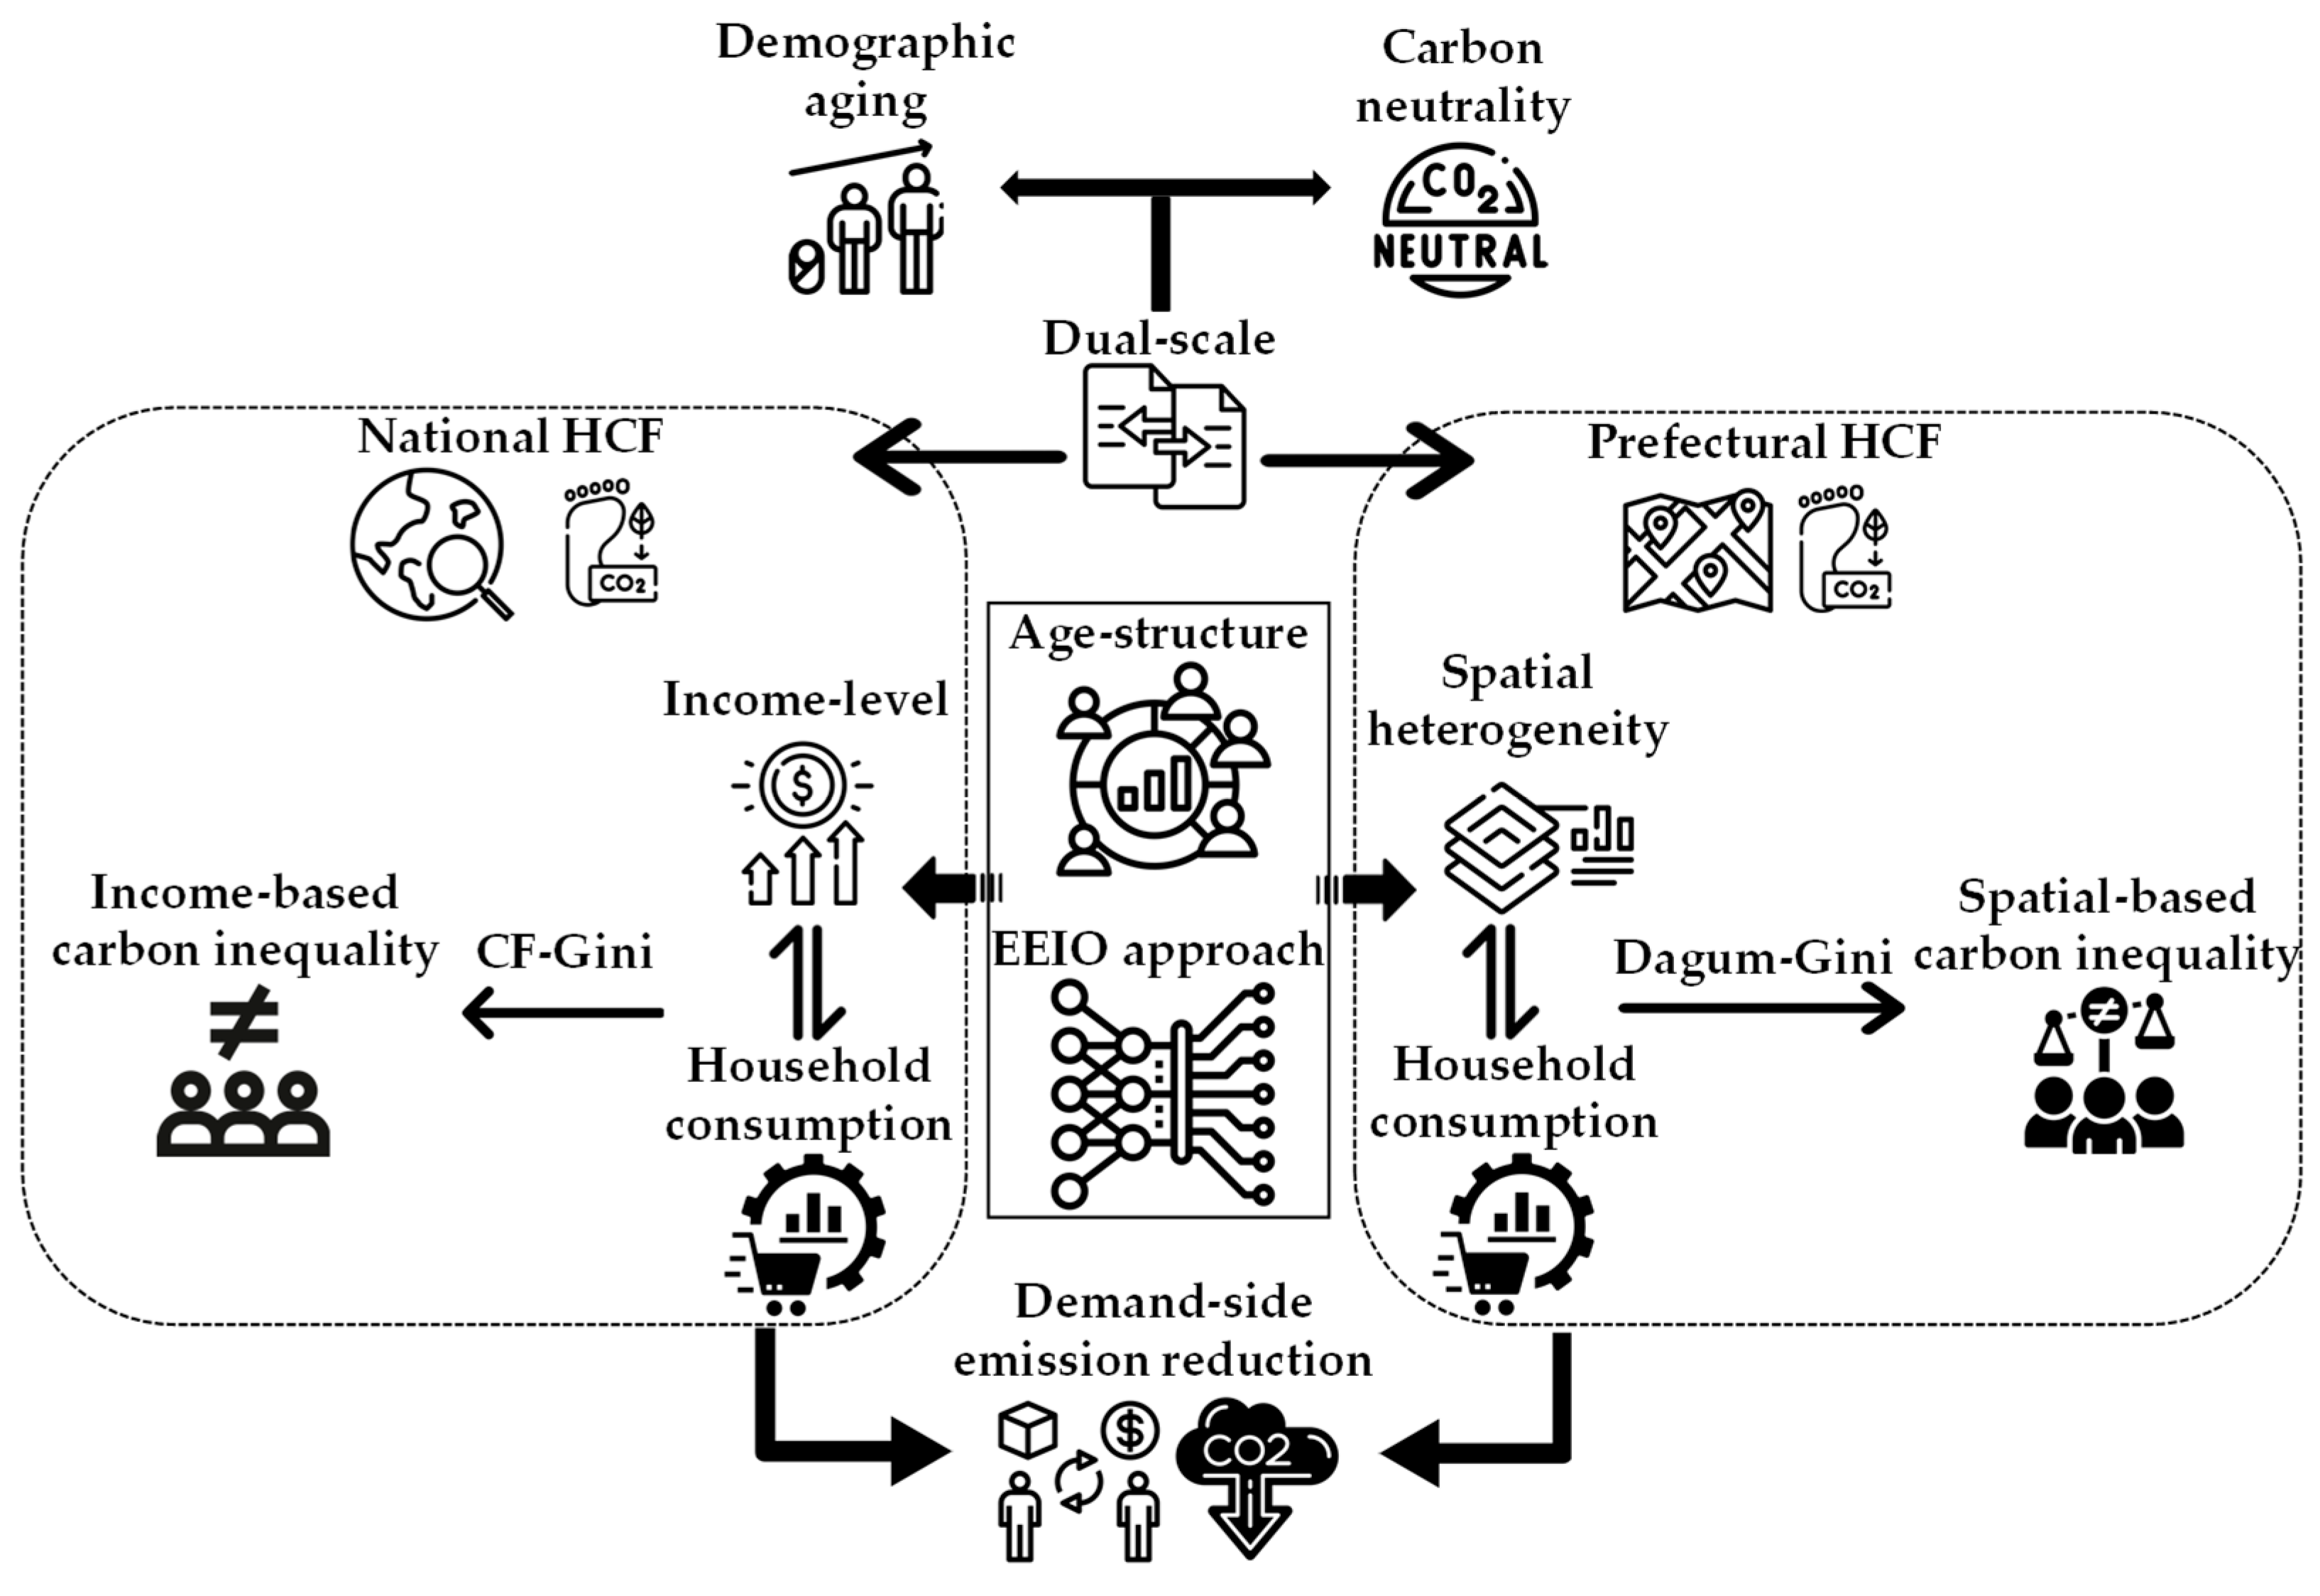
2.1. HCF Assessment Framework

2.1.1. National-Scale HCF

Initially proposed by Leontief [43], the IO model quantifies sectoral outputs by tracing intersectoral dependencies. Moreover, two methodological branches predominate: the single-region IO (SRIO) model and the MRIO model. Extending this top-down macroeconomic framework, contemporary applications integrate environmental data—specifically energy consumption and emission intensity coefficients—yielding the EEIO model [44]. Consistent with Japan’s national IO table, this study employs the SRIO model to estimate national HCF.
The SRIO model is formally defined by the following equations:
X N = ( I A ) 1 F N
where X N is the total national output, I denotes the identity matrix, A refers to the technical coefficient matrix, and F N is the national final demand.
National HCF is calculated using CO2 emission intensity (i.e., CO2 emissions per unit of economic output) as follows:
C N = K N ( I A ) 1 H N
where C N is the national HCF driven by household consumption; K N is the national carbon intensity vector, referring to sectoral CO2 emissions per monetary unit; and H N is the national household consumption.
Households underwent a two-stage classification: by age into thirteen cohorts (0–29 s, 30–34 s, 35–39 s, 40–44 s, 45–49 s, 50–54 s, 55–59 s, 60–64 s, 65–69 s, 70–74 s, 75–79 s, 80–84 s, 85 s–) and, within each cohort, by income into ten brackets (0–200, 200–300, 300–400, 400–500, 500–600, 600–700, 700–800, 800–1000, 1000–1500, 1500–; unit: JPY 10,000). Age intervals were defined by stratifying household heads’ ages in the National Survey of Family Income and Expenditure (NSFIE) into thirteen quantile-based groups. Likewise, income intervals were derived from the NSFIE’s monthly income categories for household heads (converted to annual values for this study) and organized into ten quantile-based groups. We assumed that household consumption gradually increases with improvements in income, resulting in greater HCF. Additionally, we estimated the national-level average household size for each age cohort (see Table A1), which exhibited a narrow range and strong convergence across cohorts. Accordingly, adopting a per-household HCF metric neutralized these marginal compositional differences, ensuring unbiased comparisons both within and between age groups. Moreover, given the relative stability of household composition in Japan over the study period, we aligned each prefectural age cohort’s average household size with the national mean. This simplifying assumption reinforced the robustness and comparability of the HCF assessments across regions and cohorts.
Accordingly, H N can be reformulated as:
H N = k = 1 13 l = 1 10 H N k , l
where H N k , l denotes the household expenditure of the k th age cohort and l th income bracket.
Accordingly, Equation (2) can be rewritten as follows:
C N k , l = K N ( I A ) 1 k = 1 13 l = 1 10 H N k , l
where C N k , l refers to the national HCF of the k th age cohort and l th income bracket.

2.1.2. Prefectural-Scale HCF

We employed an EEIO model, derived from Japan’s subnational MRIO table, to ex-amine how interactions between age structure and regional economic characteristics shape HCF across prefectures. The core framework of the MRIO model can be formulated as follows [45]:
X P = ( I A ) 1 F P
X P = x 1 x 2 x n , A = A 11 A 12 A 1 n A 21 A 22 A 2 n A n 1 A n 2 A n n , F P = F 11 F 12 F 1 n F 21 F 22 F 2 n F n 1 F n 2 F n n
where X P denotes the vector of total output by prefecture. The technical coefficient submatrix, A = a i j g s , is defined by a i j g s = z i j g s x j s , where z i j g s represents the financial transfer from sector i in prefecture g to sector j in prefecture s , and x j s denotes the total output of sector j within prefecture s . The entry f i g s of the final demand matrix F P captures the demand of prefecture s for goods of sector i imported from prefecture g . The subscripts i and j run from 1 to 80, representing the full set of economic sectors, while g and s run from 1 to 47, with each corresponding to one prefecture.
Accordingly, the prefectural HCF is calculated thus:
C P k = K P ( I A ) 1 H P k
where C P k denotes prefectural HCF derived from household consumption of the k th age cohort, K P is the vector of carbon intensities for each prefecture, and H P represents prefectural household consumption. Meanwhile, at the prefectural level, to preserve comparability with the national age distribution, we stratified household heads’ ages into the same thirteen quantile-based intervals.

2.2. Approach to Carbon Inequality Assessment

2.2.1. Income-Based HCF Inequality

Originating in Corrado Gini’s work [46], the Gini coefficient is a standard measure of regional income inequality, assigning values from 0 to 1, where higher numbers reflect more pronounced inequality. Applying the standard Gini coefficient formula to the national HCF estimates by age cohort and income bracket (Section 2.1.1), we derived the CF-Gini coefficient as follows:
G N = l = 1 10 w l s l + 2 l = 1 10 w l ( 1 T l ) 1
where G N denotes the CF-Gini coefficient, indicating the dispersion of HCF across income levels. For each income bracket l , w l captures the fraction of all households falling into that bracket, s l indicates the share of total HCF contributed by those same households, and T b then accumulates these emission shares up through bracket l .

2.2.2. Spatial-Based HCF Inequality

Standard indices such as the Gini coefficient assume normality and homoscedasticity, thereby excluding overlapping group observations and impeding meaningful economic decomposition of total inequality. To overcome these limitations, Dagum [47] introduced a decomposition framework that partitions overall disparity into intragroup disparity, intergroup disparity, and overlap disparity—a methodology now widely adopted in empirical inequality research [48,49]. Figure 2 illustrates the analytical framework applied in this study to examine spatial heterogeneity in HCF inequality.
The Gini coefficient quantifying inequality across age cohorts is defined as follows:
G a b a g e = m = 1 n a n = 1 n b C a m H C F C b n H C F n a n b C a H C F ¯ + C b H C F ¯
where a and b represent the group identifiers, which denote any two of the income categories—high, middle, or low income. The variables n a and n b indicate the total number of prefectures in each group. The values C a m H C F and C b n H C F refer to the HCF of prefecture m in group a and prefecture n in group b , respectively. Additionally, C a H C F ¯ and C b H C F ¯ represent the average HCF values for all prefectures within each respective group.
When all prefectures are treated as a single group, the intragroup Gini coefficient coincides with the overall Dagum–Gini index for HCF (denoted G a g e ). Accordingly, Equation (9) can be reformulated as follows:
G a g e = a = 1 k G a a a g e r a t a + a = 1 k b a G a b a g e r a t b D a b + a = 1 k b a G a b a g e r a t b ( 1 D a b )
G a g e = G i n t r a + G i n t e r + G u l t r a
where G a g e signifies the overall Dagum–Gini coefficient. The term G i n t r a refers to the disparities within groups, while G i n t e r captures the differences between groups, and G u l t r a reflects overlap disparity. The variable r a represents the ratio of prefectures in group a relative to the total sample size n , and t a n a C a H C F ¯ n C H C F ¯ and t b n b C b H C F ¯ n C H C F ¯ express the average HCF values for groups a and b , respectively, compared to the overall average HCF across all prefectures. The condition a b r a t b = 1 holds, meaning the overall age-based Gini coefficient G a g e is the weighted average of the Gini coefficients G a b a g e for all combinations of groups, with the weights determined by r a t b . The variable D a b denotes the relative influence between groups a and b .

2.3. Evaluation of the Influence of Population Dynamics on HCF

This study incorporates prefectural demographic data to elucidate how interregional demographic shifts amid Japan’s rapid population aging drive spatial heterogeneity in HCF. To this end, we applied the following equation to quantify the effect of projected demographic shifts on prefectural HCF across age cohorts [13,14]:
Q t g = i b C P g , k H t g , k
where C P g , k denotes the HCF for age group k in prefecture g . H t g , k is the number of households in that age group and prefecture in year t , where t = 1 , 7 correspond to 2020, 2025, 2030, 2035, 2040, 2045, and 2050, respectively. Q t g is derived from changes in H t g , k , with carbon intensity, production technology, supply chains, commodity prices, and age-specific consumption patterns held constant at their 2005 base-year levels. Consequently, this study isolated the effect of Japan’s demographic dynamics, particularly population aging, on HCF.

2.4. Data

The energy statistics used to calculate the national-level carbon intensity for 2020 ( K N ) and the prefectural-level carbon intensity for 2005 ( K P ) were obtained from Japan’s Agency for Natural Resources and Energy—strictly employing the 2020 national energy consumption statistics for K N and the 2005 prefectural energy consumption statistics for K P . As the agency periodically revises its historical series and the original, unamended data are no longer accessible, we therefore utilized the latest release—comprising the 2020 national energy consumption statistics (updated 25 April 2025) and the 2005 prefectural energy consumption statistics (updated 27 December 2024)—to ensure data integrity and reproducibility [50,51]. Prefecture-level demographic data were sourced from the National Institute of Population and Social Security Research [52]. Household consumption data were obtained from Japan’s national IO table and the NSFIE compiled by the Ministry of Internal Affairs and Communications [53,54], as well as the subnational MRIO table [55]. Because the NSFIE records expenditures at purchaser prices, while the IO and MRIO tables use producer prices, we applied an optimization method to reconcile both price bases and sectoral classifications [13,56]. Specifically, we first obtained sector-specific retail and transportation margins from the IO structural survey—margin survey [57], then applied these margins to each sector’s household expenditure to calculate their contribution to total consumption. For each sector, margin values were divided by consumer price expenditure to derive margin ratios, which were then applied to estimate allocated retail and transport margins. Subtracting these margins from sectoral consumer expenditures yielded annual household consumption at producer prices—directly comparable to emission intensities for consumption-based accounting. Because margin data are available only at the national level, we assumed that, under a broadly stable economic structure, each prefecture’s sector-specific margin ratios coincided with the corresponding national averages.
The NSFIE survey is conducted every five years, with the most recent data from 2019 used in this study. At the national scale, we employed the quinquennially updated 2020 national IO tables together with NSFIE consumption patterns to estimate the HCF. At the subnational level, although we intended to use MRIO data from a year close to that of the national IO table for consistency, the latest publicly available prefectural MRIO data were from 2005. Accordingly, considering data limitations, we were compelled to combine the NSFIE survey with the prefectural MRIO table to estimate HCF by prefecture in 2005. Additionally, the constraint arising from the discrepancy in data timing between the national- and subnational-level analyses is explicitly addressed in the research limitations (Section 3.3).

3. Results and Discussion

3.1. National-Level HCF

Prior to analyzing national HCF patterns, we summarize national-level household characteristics in Table A1—detailing household counts across ten income deciles and thirteen age cohorts—which reveals two fundamental dimensions of heterogeneity at the national scale that underpin our subsequent HCF analysis. The age cohort distribution exhibits clear trends: younger groups (0–29 s and 30–34 s) concentrate almost entirely in the lower income deciles (0–400); middle-aged cohorts (35–59 s) spread broadly across mid-to-high-income brackets (200–1000), with a peak in the 45–49 s; and household counts fall sharply in the oldest cohorts (85 s–), especially at higher incomes. Moreover, cohort-level affluence varies markedly: mean annual household income rises from JPY 386.7 × 10⁴ in the 0–29 s to JPY 749 × 10⁴ in the 50–54 s before tapering among retirees. Focusing on income variation within each age cohort is essential to disentangling how economic capacity modulates consumption patterns at different life stages and, in turn, shapes HCF, thereby enabling more precise, cohort- and income-targeted mitigation policies.

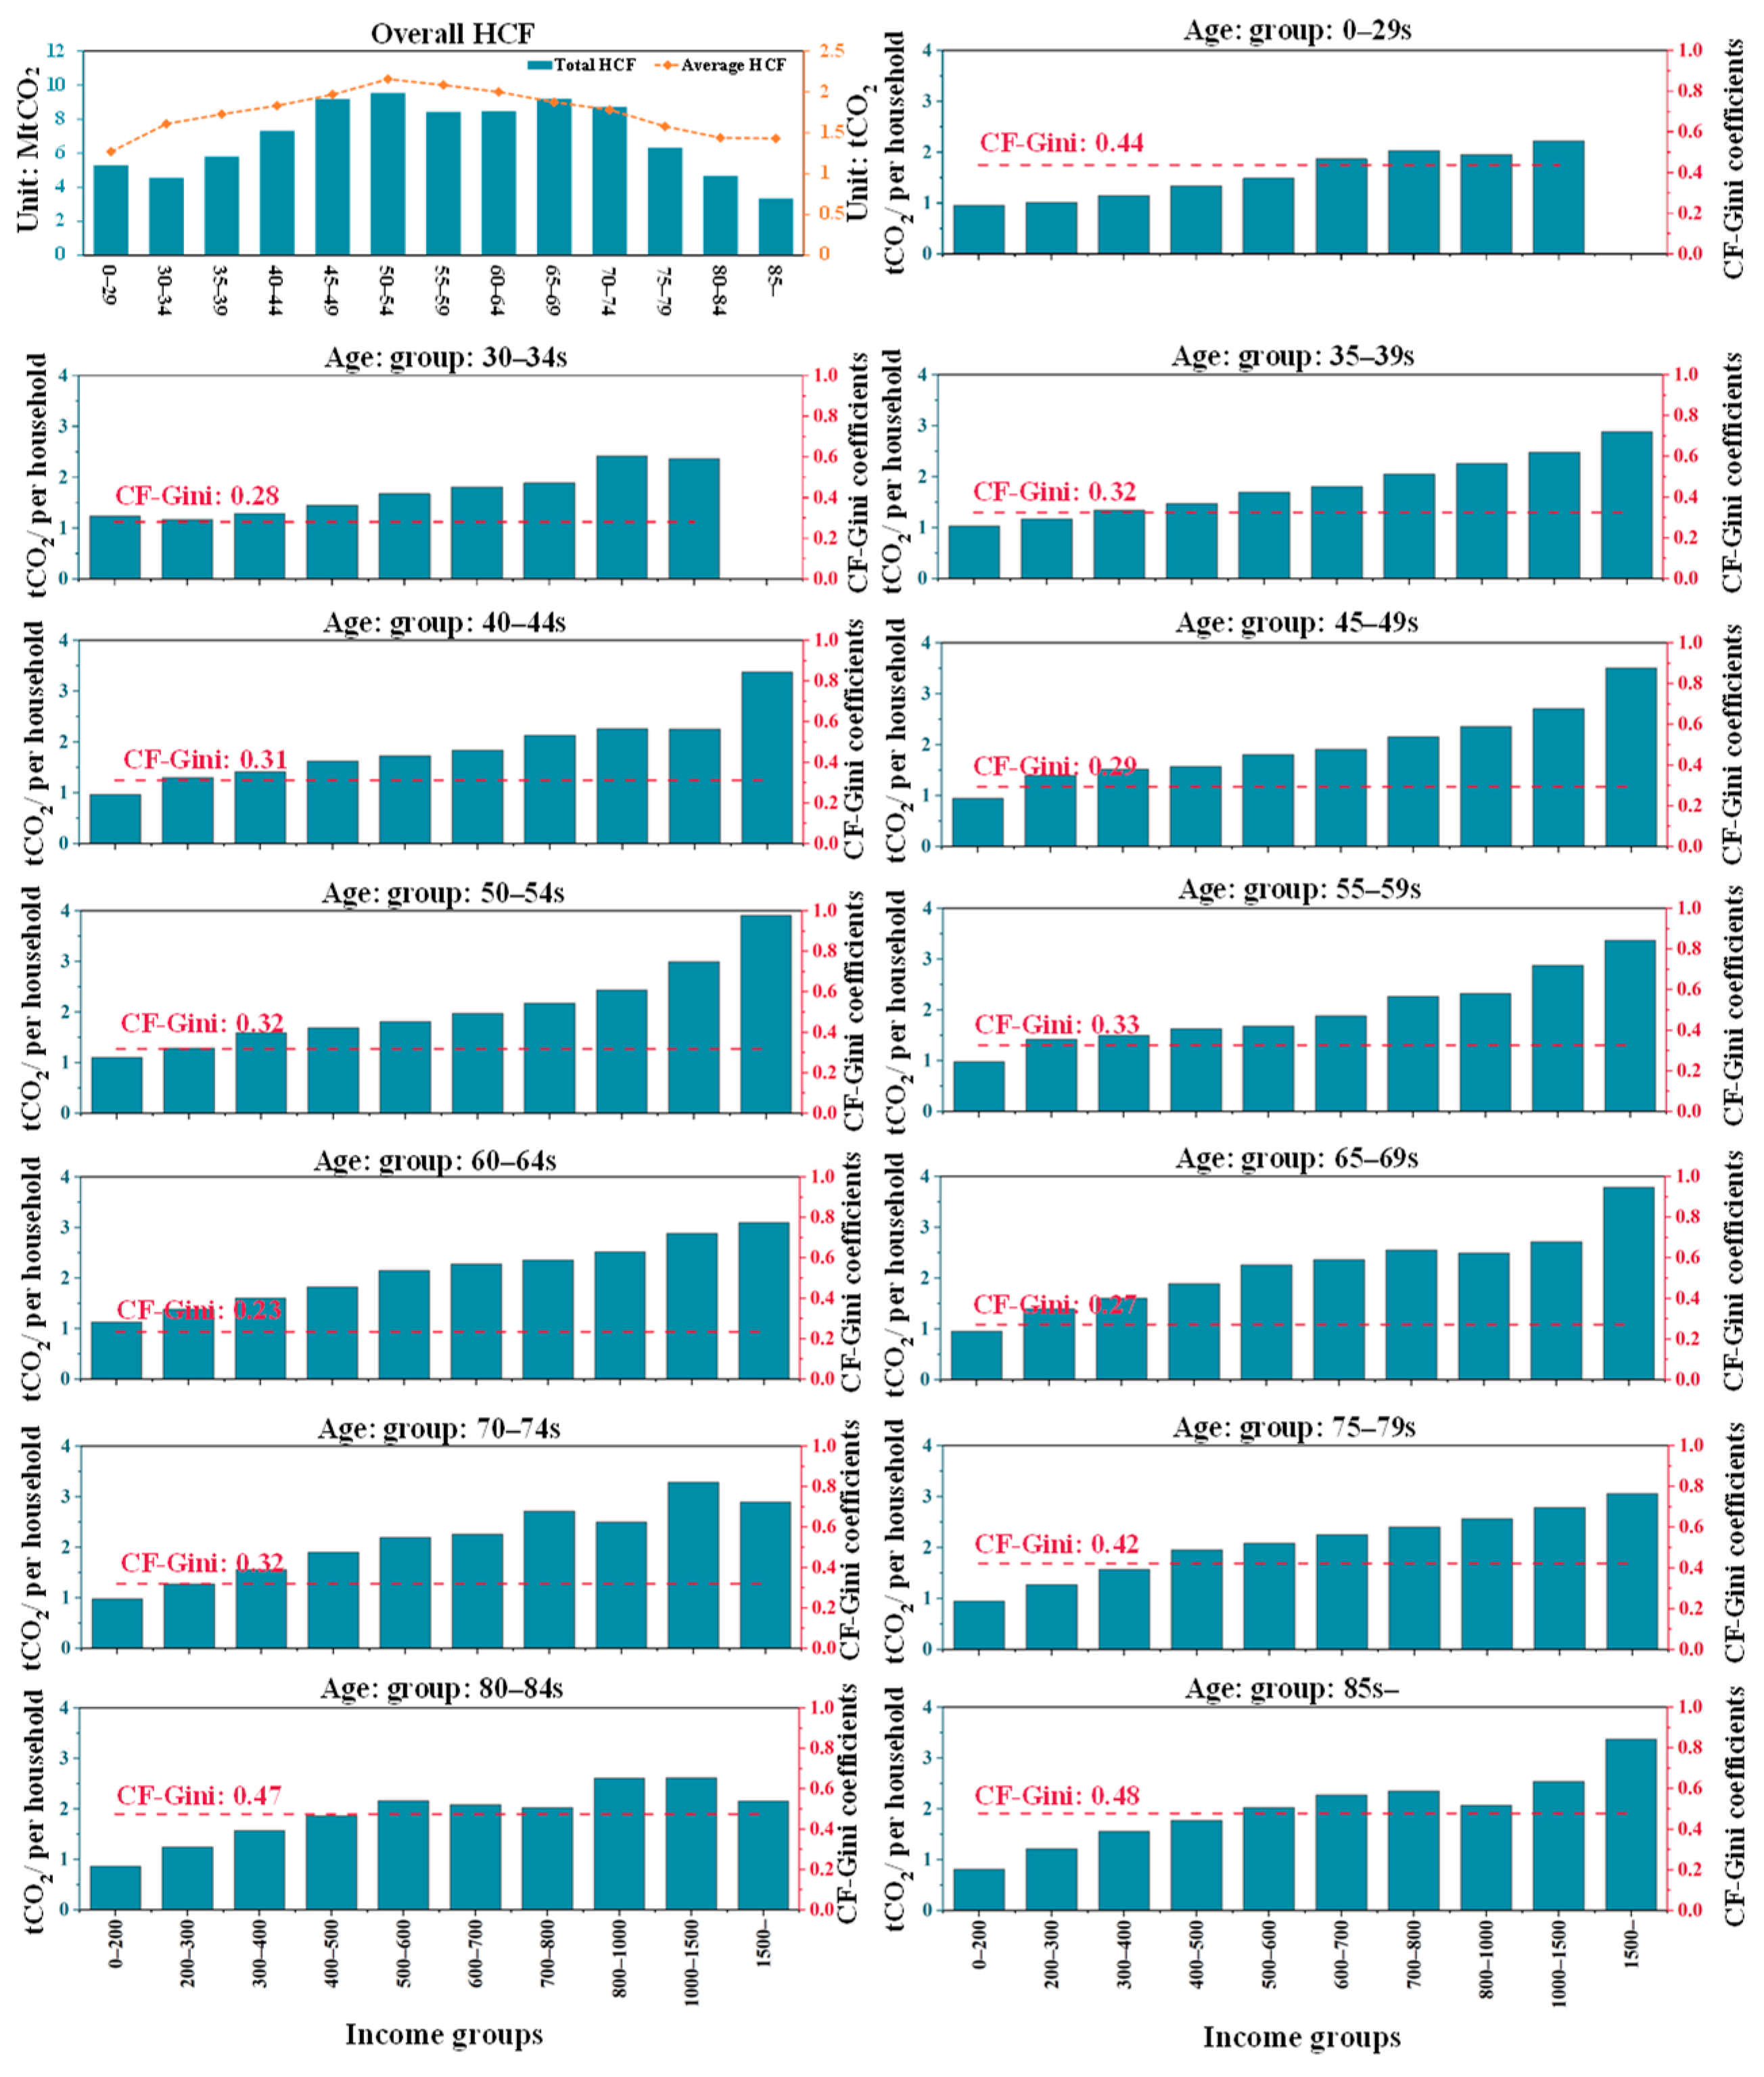
3.1.1. HCF Patterns by Age and Income Strata

Overall, in 2020, Japan’s per-household HCF exhibits an inverted U-shaped trajectory: it increases from the youngest group (0–29 s) to the middle-aged group (30–64 s) before declining among older households (65 s–) (Figure 3), in agreement with prior research [9]. Two interrelated mechanisms drive this pattern: life cycle-related shifts in consumption structure and changes in mobility behavior [13,58,59]. First, household consumption patterns evolve markedly with age. Middle-aged householders typically enjoy peak earnings while shouldering greater family responsibilities—especially child-rearing—which together boost both the demand for and the ability to purchase carbon-intensive goods and services [16,60]. Upon retirement, however, a reduction in disposable income and a contraction in overall expenditure translate into lower energy use and product consumption, thereby reducing HCF [4,61]. Second, mobility behavior exhibits a parallel life cycle shift. Middle-aged adults often undertake regular, sometimes long-distance commutes by private car or public transit, which elevates transport-related emissions [15]. In contrast, older adults generally limit their activities to local neighborhoods—favoring nearby shopping, healthcare visits, and social engagements—and participate less frequently in long-distance travel or high-intensity leisure, further curtailing transport and service-sector emissions in later life [14,62]. Notably, when we disaggregate HCF by both age and income, a deviation from the usual positive income–emissions relationship emerges among those aged 70 years and above: beyond this age threshold, higher income no longer corresponds to proportionally higher HCF, suggesting distinct behavioral or structural constraints in the oldest cohort.
In the 0–29 s and 30–34 s, average HCF stands at 1.27 and 1.61 tCO2, respectively, with no representation from high-income households (incomes ≥ 800). This pattern reflects the early career stage of these cohorts, whose constrained resources concentrate expenditures on housing rentals, daily commuting, and essential services, resulting in lower emissions. In contrast, HCF in the 35–59 s rises steadily with income, peaking at 2.16 tCO2 in the 50–54 s; at this stage, mid-to-late career incomes and larger household sizes drive increased consumption of energy-intensive goods and services, such as housing and private vehicles. Notably, high-income households in the 50–54 s exhibit still higher HCF, with the 1500– income group reaching 3.91 tCO2, underscoring the amplification of consumption with income accumulation. For the 60–64 s and 65–69 s, despite retirement or semi-retirement, households maintain elevated living standards and consumption patterns, yielding HCF averages of 2.00 and 1.87 tCO2, respectively. Among the 70–84 s, however, per-household HCF declines markedly in both low-income and high-income groups, whereas the middle-income bracket sustains or slightly increases its HCF levels. For example, in the 80–84 s, per-household HCF declines to 0.86 tCO2 for the 0–200 income group and to 2.15 tCO2 for the 1500– income group, corresponding to 78% and 55% of the levels observed in the 50–54 s at the same income categories. Conversely, within the 80–84 s, households in the 300–400 and 500–600 income groups register a per-household HCF of 1.57 tCO2 and 2.16 tCO2—values that match or exceed the 1.59 tCO2 and 1.81 tCO2 recorded for the 50–54 s. Low-income elderly, constrained by minimal pensions, limited savings, and scarce secondary employment opportunities, sustain lower consumption levels and consequently record reduced HCF. Meanwhile, high-income late-stage elderly allocate a larger proportion of their expenditures to service-based consumption—primarily healthcare—which attenuates their HCF. However, in middle-income elderly, augmented financial resources foster a more balanced consumption structure, whereas the rising prevalence of the nuclear family among the elderly intensifies per-household energy use, jointly elevating their HCF.

3.1.2. Income-Related Carbon Inequality Across Age Cohorts

Analysis of CF-Gini coefficient trends reveals a U-shaped pattern across age cohorts: carbon inequality declines from the youngest group (e.g., 0–29 s; Gini = 0.44) through middle-aged populations (e.g., 45–49 s; Gini = 0.29) before rising again among the elderly (e.g., 85 s–; Gini = 0.48). Both the youngest and oldest cohorts exhibit elevated inequality, driven chiefly by pronounced HCF polarization within low-income households. For example, low-income households constitute 29.2% of the 0–29 s yet contribute 23% of its total HCF; this polarization further intensifies among older cohorts: in the 80–84 s, which comprise 52.8% of the population, low-income households contribute 38% of HCF; in the 85 s–, which represent 51.3% of the population, they contribute 37.1% of HCF. By contrast, middle-aged cohorts display only modest fluctuations in carbon inequality, owing to the predominance of the middle-income subgroup, whose stable earnings and balanced demographic representation buffer HCF distribution. Specifically, the middle-income group comprises 54.5% of the 45–49 s and contributes 49.9% of its HCF. Amid Japan’s aging population, carbon mitigation strategies must address the needs of the elderly within the broader demographic framework. Younger and older cohorts experience significant disparities in social resource allocation during carbon-reduction initiatives, largely due to income instability and social security uncertainties. In contrast, the middle-aged group exhibits relatively lower carbon inequality, suggesting that their stable economic conditions and established household structures provide a promising foundation for reducing consumption-based emissions and alleviating income-related social conflicts.

3.2. Prefecture-Level HCF

To contextualize prefectural HCF patterns, we have compiled intra-prefectural household characteristics in Table A3—detailing age cohort household counts and corresponding average annual incomes—to provide household-level background for our ensuing discussion of HCF’s regional heterogeneity. The spatial distribution of age cohorts exhibits marked variability: for example, Tokyo contains 793,446 households in the 0–29 s and still over 549,980 in the 50–54 s, whereas Tottori records just 12,112 and 17,082 households in those same cohorts, respectively. These disparities reflect divergent local population structures and highlight potential scale effects on regional HCF. Moreover, cohort-level affluence also differs substantially across prefectures: Tokyo’s average household incomes span JPY 385.1–774.0 × 10⁴ across the thirteen cohorts, compared with Kagoshima, which spans only JPY 226.8–617.8 × 10⁴, and Okinawa, JPY 241.1–532.3 × 10⁴. Such income heterogeneity implies varying consumption capacities and energy-use profiles, which can materially influence HCF. Together, these demographic and economic differentials demonstrate the necessity of subnational HCF research: effective carbon mitigation strategies must be tailored to local cohort structures and income dynamics rather than predicated solely on national aggregates.

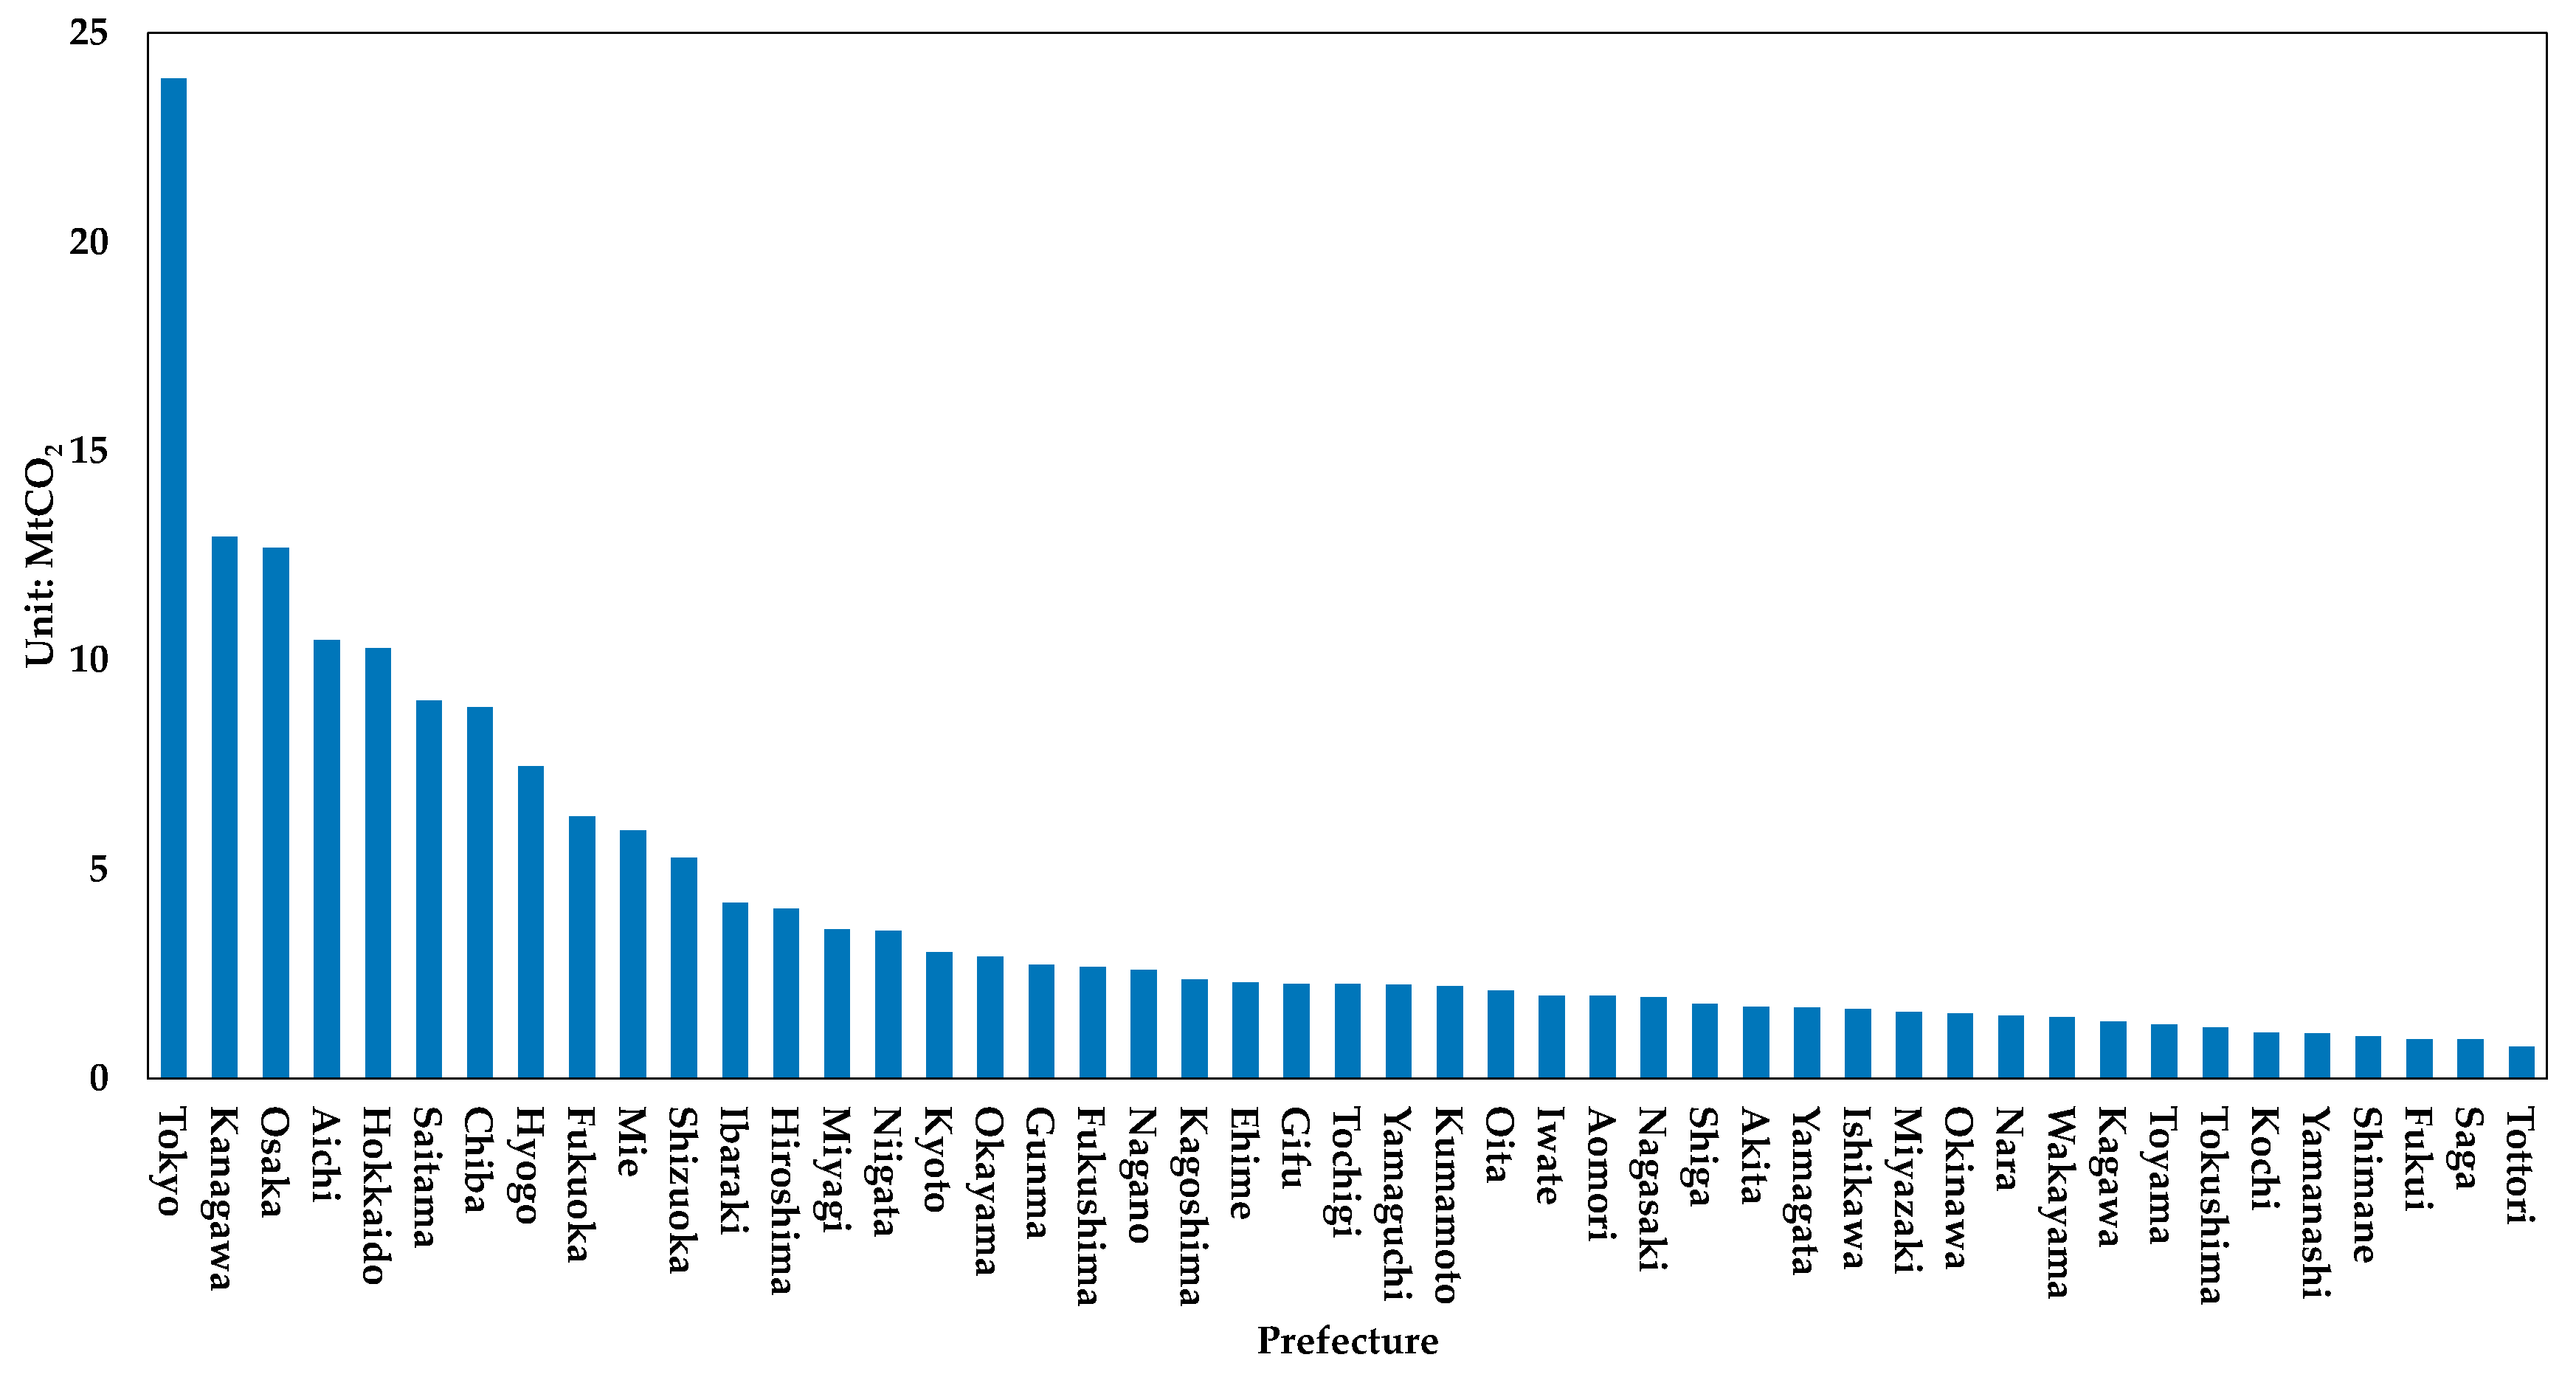
3.2.1. Overall HCF by Prefecture

Japan’s total HCF exhibits pronounced spatial heterogeneity (Figure 4). A small number of metropolitan prefectures account for disproportionately high emissions, while most less advanced areas remain low-emission and dispersed. Specifically, the Tokyo Metropolitan (e.g., Tokyo and Kanagawa) and the Kansai regions (e.g., Osaka and Hyogo) form the two primary high-HCF hubs, reflecting the synergistic coupling of high population density and affluent consumption. Likewise, the Chubu region (e.g., Aichi and Mie) constitute an industrialized zone whose HCF markedly exceeds that of similarly populated regions, underscoring the joint impact of durable goods demand and embedded supply chain transportation. Notably, Hokkaido—despite its sparse population—ranks among the highest-emission prefectures, driven predominantly by elevated heating energy requirements in cold climates.
Japan’s prefectural HCF comprises two core components: essential and discretionary expenditures (Figure 5). Essential expenditures—food, utilities (electricity and gas), healthcare and social security, and education—define the HCF’s lower bound. Food-related emissions, the most frequent and wealth-sensitive category, exhibit clear regional clustering: Tokyo’s food emissions are about 1.25 times those of Okinawa. Utility emissions—dominated by electricity consumption and influenced by both climatic extremes and housing insulation quality—vary markedly across prefectures, with Hokkaido at 1.12 tCO2 per household and Okinawa at 1.23 tCO2. Although healthcare and education together contribute only 0.06–0.27 tCO2, their inelastic demand implies that mitigation must target the supply side—expanding telemedicine, online education, and digital public-service delivery can uphold service quality while curbing emissions. In the discretionary spending category, private transport offers the greatest mitigation potential: Tokyo’s extensive public transit network limits household transport emissions to 0.56 tCO2, whereas car-dependent prefectures in Tohoku (e.g., Akita) and Kyushu (e.g., Oita) approach 1 tCO2. Durable goods and household chemicals drive elevated emissions across the Chubu manufacturing corridor (e.g., Aichi, Shizuoka), reflecting supply-chain spillover effects on consumption upgrading. Moreover, personal services emissions demonstrate an inverse income–emission relationship: Tokyo records 0.32 tCO2, whereas low-income Aomori records 0.42 tCO2, underscoring the carbon-saving impact of digitalized services and dematerialized consumption in metropolitan areas.

3.2.2. Age-Specific HCF Across Prefectures

Although the inverted U-shaped per-household HCF profile persists at the prefectural level, significant regional divergences emerge (Figure 6). First, the age at which prefectural HCF peaks varies with local affluence: in high-gross-regional-product (GRP) prefectures (i.e., prefectures with a high GRP per household (GRP per household is reported in Table A1)) (e.g., Tokyo and Aichi), the maximum shifts to the 60–64 s, whereas in low-GRP regions (e.g., Aomori, Tottori) it occurs much earlier, in the 45–49 s. Long-term economic prosperity in high-GRP prefectures enables households to maintain elevated consumption of energy-intensive goods and services (e.g., tourism, healthcare, entertainment) into later life, thereby delaying the HCF peak. In contrast, in low-GRP prefectures, rising incomes among middle-aged cohorts, alongside the increased demand for improved living standards due to expanding household sizes, drive rapid consumption growth, precipitating an earlier apex. Second, certain prefectures exhibit a late-life rebound in HCF, which falls into two distinct typologies. In high-aging, low-GRP locales (e.g., Akita, Yamagata), sluggish economic growth, low energy efficiency, and a high proportion of single-elderly households drive up spending on essential services—such as healthcare and transportation—boosting per-household emissions. Conversely, in low-aging, high-GRP regions (e.g., Chiba, Saitama), robust economies underpin energy-intensive eldercare infrastructures and high-end residential services, along with increased tourism and cultural consumption, similarly precipitating a resurgence in HCF.
Spatial hot spots of HCF by age structure exhibit pronounced heterogeneity. In low-GRP prefectures, younger cohorts record elevated HCF; for example, among the 0–29 s, per-household HCF in Aomori and Wakayama reaches 3.66 tCO2 and 3.85 tCO2, respectively, compared with 1.63 tCO2 in Tokyo and 2.01 tCO2 in Aichi. This disparity likely reflects constrained transport infrastructure, limited consumer choice, and underdeveloped logistics in low-GRP regions, which together drive more carbon-intensive consumption. Although elevated HCF persists into middle age, the gap with high-GRP prefectures narrows over the life course: in the 40–44 s, Akita’s per-household HCF averages 5.60 tCO2—1.50 times that of Chiba (3.73 tCO2)—but by the 55–59 s, this ratio declines to 1.19. As households age, spending shifts from discretionary consumption to home comfort and energy efficiency investments, thereby reducing interregional HCF disparities. However, among the oldest old cohort, HCF in high-GRP prefectures rises markedly and the gap with low-GRP regions widens again: Shiga’s per-household HCF reaches 4.45 tCO2—1.77 times Saga’s 2.52 tCO2—whereas in the 45–49 s, the ratio is only 0.88. This resurgence reflects the super-aged population’s greater demand for energy-intensive eldercare services—such as personalized health management and specialized leisure—in affluent prefectures, thereby driving higher HCF.

3.2.3. Projected Trends in Prefecture-Level HCF

We used prefecture-level demographic projections in Japan to estimate HCF for all 47 prefectures over 2020–2050. Prefectures were ranked by their 2020 population aging rates and divided into tertiles. From each tertile, we selected one representative prefecture—Akita (higher aging rate), Okayama (mid-tertile), and Tokyo (lower aging rate)—for detailed case studies (Figure 7). We then analyzed HCF trajectories across four age cohorts (0–29 s, 30–59 s, 60–84 s, and 85 s–). Trends for all prefectures are depicted in Figure A2.
While population aging is generally exerting a mitigating effect on HCF, the magnitude of this effect varies substantially across prefectures. Between 2020 and 2050, total HCF is projected to decline by 45% in Akita (from 1.89 to 1.04 MtCO2) and by 18% in Okayama (from 3.12 to 2.55 MtCO2), yet to rise by 5% in Tokyo (from 26.06 to 27.53 MtCO2). Notably, the carbon reduction effect of aging is concentrated among the young and middle-aged cohorts—and becomes more pronounced as aging advances. For instance, by 2050, the 0–29 s HCF is projected to decline by 9% in Tokyo, 33% in Okayama, and 58% in Akita, relative to 2020 levels. These divergent trajectories reflect the interaction between demographic shifts and regional economic structure. In low-GRP prefectures such as Akita and Okayama, accelerated aging amplifies labor shortages and erodes economic dynamism, leading to lower incomes and suppressed consumption demand among younger households. Conversely, Tokyo’s high-GRP economy—characterized by a diversified labor market, advanced educational infrastructure, and abundant urban amenities—continues to attract and retain younger cohorts, thereby attenuating the aging-induced decline in HCF among its young and middle-aged households.
Even within the elderly population, the HCF trajectories of the 60–69 s and 85 s– cohorts diverge substantially. In Akita, HCF for the 60–69 s declines steadily from 0.26 MtCO2 in 2020 to 0.14 MtCO2 by 2050. In contrast, Tokyo’s 60–69 s cohort exhibits an initial increase from 3.86 MtCO2 in 2020 to 5.59 MtCO2 in 2035, before decreasing to 4.71 MtCO2 in 2050. For the 85 s–, Akita follows a similar rise–fall pattern—0.09 MtCO2 in 2020, 0.12 MtCO2 in 2035, and 0.11 MtCO2 in 2050—whereas Tokyo’s HCF for the same cohort grows continuously from 1.14 MtCO2 to 1.87 MtCO2 over the same period. These contrasting trajectories reflect differences in demographic composition and consumption structures. Tokyo’s robust economy and comprehensive social welfare systems attract both long-term retirees and in-migrants, thereby expanding its elderly consumer base. Moreover, for the super-aged 85 s– cohort, high-GRP prefectures such as Tokyo provide extensive medical infrastructure and advanced eldercare services, which not only enhance health management but also drive expenditures across multiple sectors. For example, utility-related emissions increase from 0.49 MtCO2 to 0.80 MtCO2 between 2020 and 2050, sustaining the upward trend in HCF among the oldest age group.

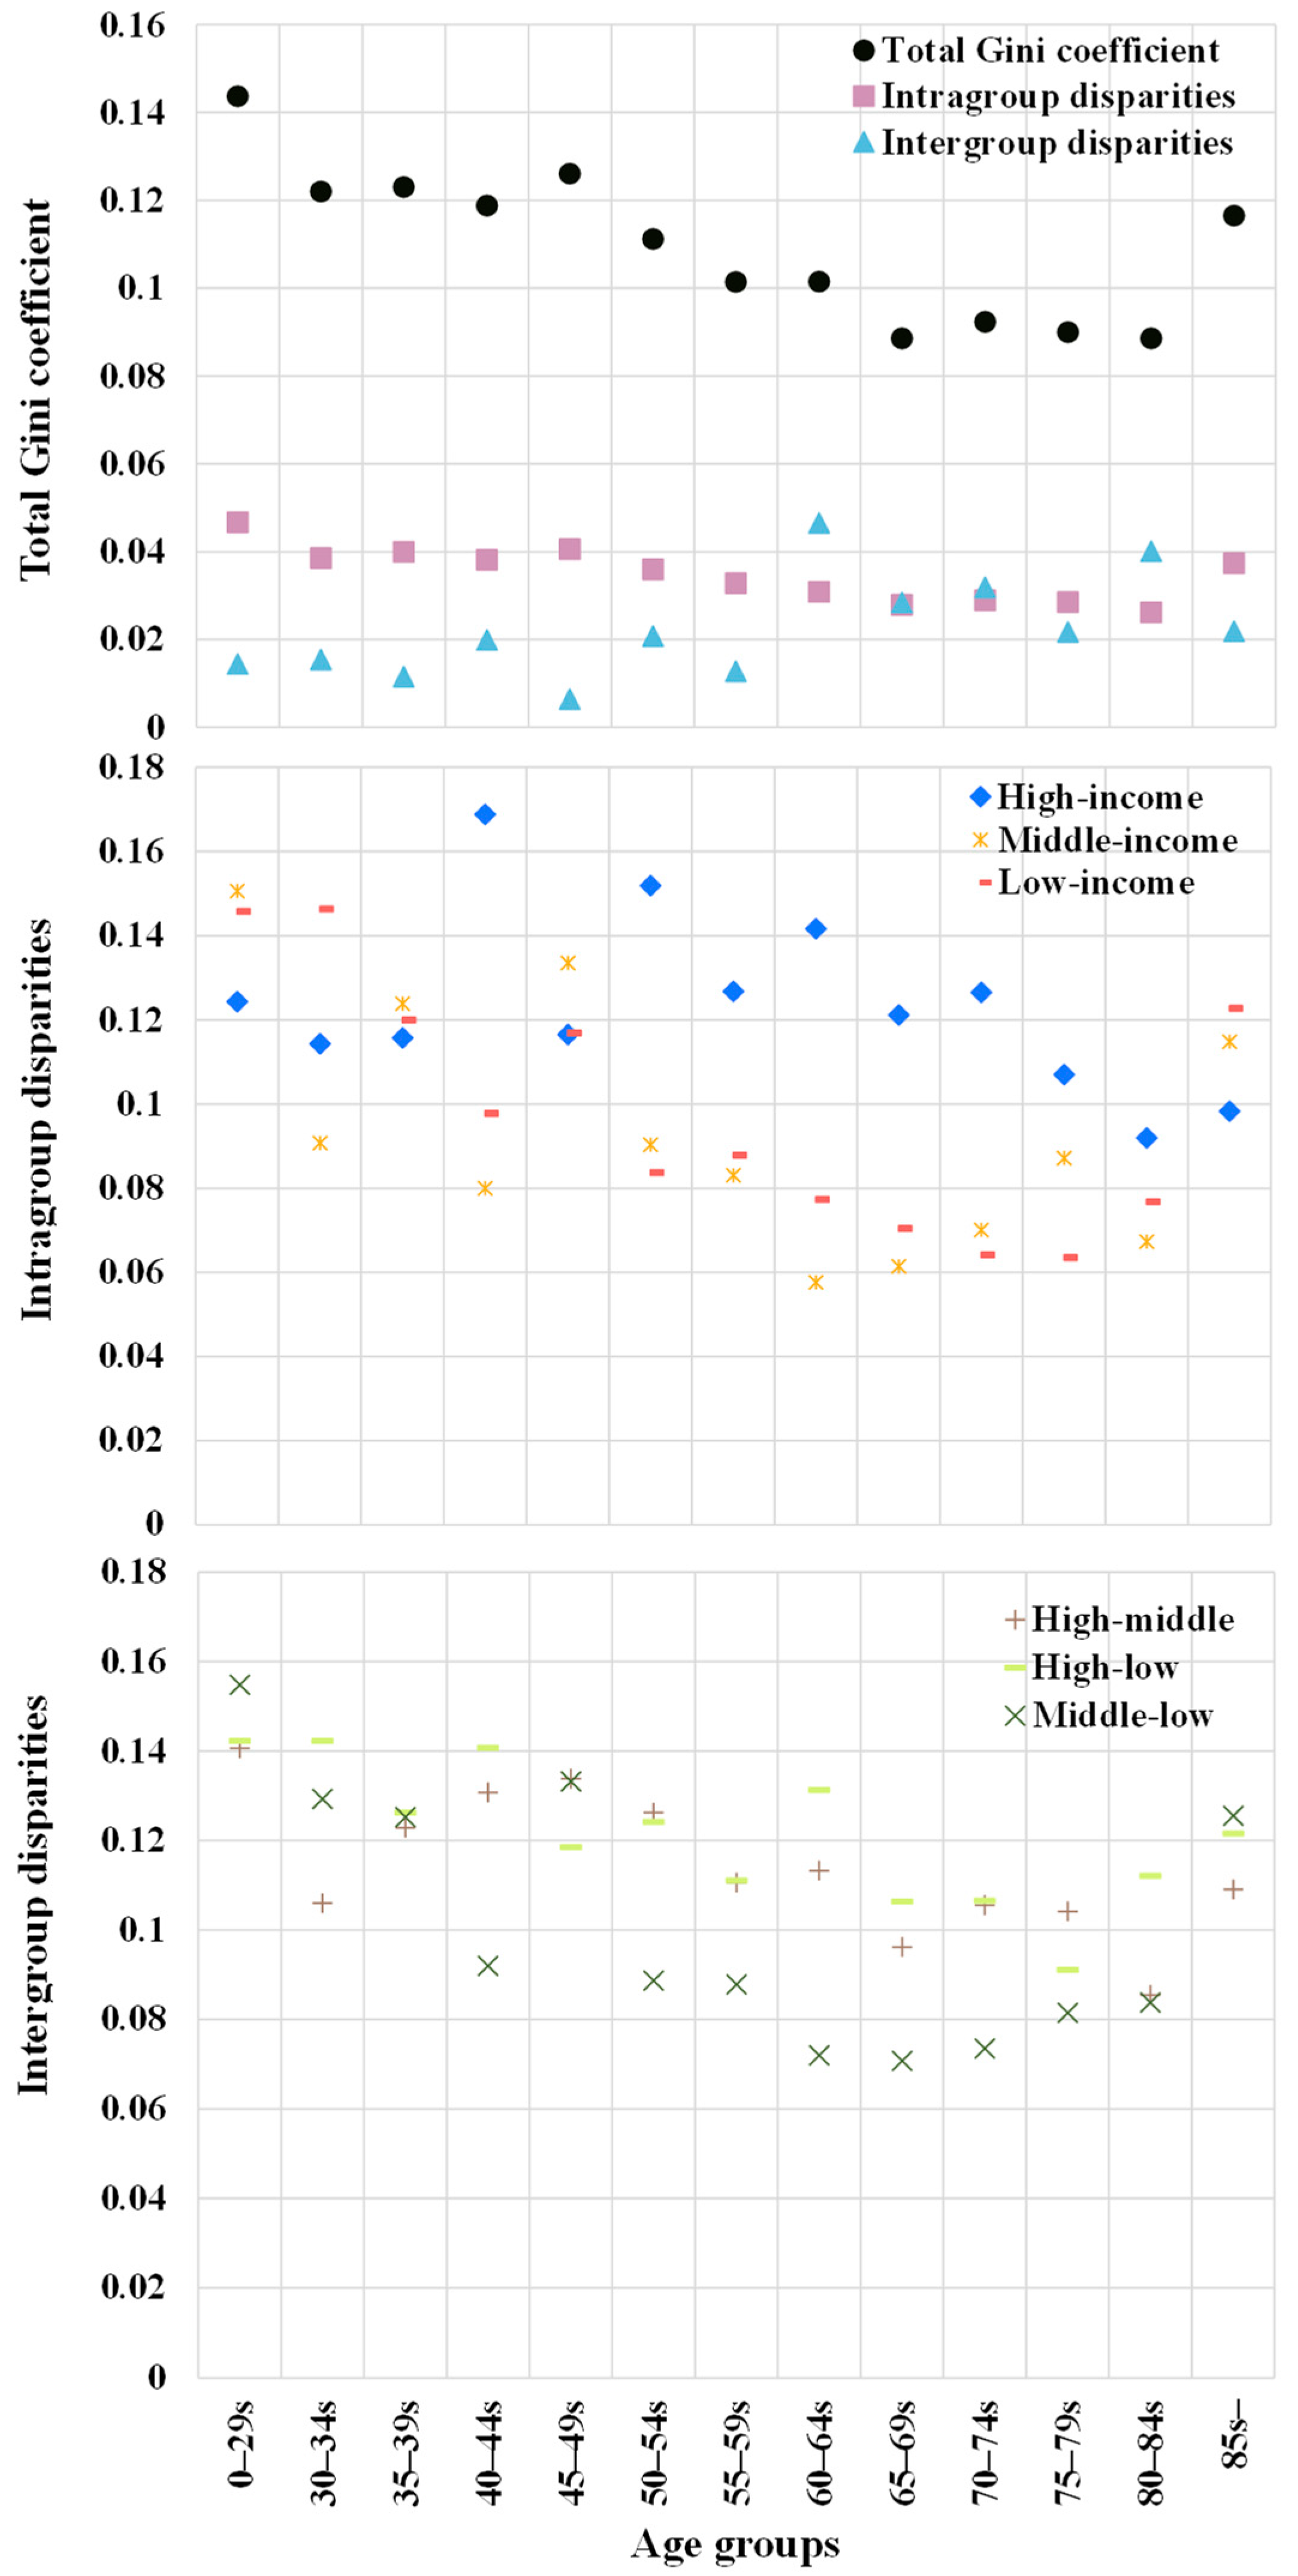
3.2.4. Decomposition of Spatial HCF Inequalities

Applying the Dagum–Gini approach, we quantified spatial disparities in HCF across Japan’s prefectures by age cohort (Figure 8). Aggregate spatial inequality exhibits a pronounced U-shaped trajectory over the life course: the overall Gini coefficient peaks at 0.144 in the 0–29 s, declines steadily to a nadir of 0.088 in the 65–69 s, and then rises again to 0.117 in the 85 s–. Significantly, the balance between intragroup and intergroup inequality shifts with age: intragroup disparity contracts from 0.047 in the 0–29 s to 0.026 in the 80–84 s, whereas intergroup disparity expands from 0.014 to 0.040 over the same age span.
Intragroup disparities in HCF exhibit a distinct age-dependent trajectory. Among high-income households, inequality peaks at midlife—reaching 0.169 for the 40–44 s—while both the youngest (0–29 s) and the oldest (85 s–) cohorts display substantially lower heterogeneity. This pattern likely reflects divergent midlife expenditure demands driven by life-stage factors such as children’s education and multigenerational caregiving. By contrast, middle-income households display a steady decline in disparity—from 0.091 in the 30–34 s to 0.058 in the 60–64 s—indicative of converging consumption patterns and lifestyle preferences over the life course; however, this convergence reverses in the 85 s–, where disparity rises again to 0.115. Low-income households show the greatest disparities at both age extremes: a coefficient of 0.145 in the 0–29 s—comparable to middle-income group and likely driven by heterogeneous living arrangements and early career income instability—and an increase to 0.123 in the 85 s–, reflecting amplified consumption heterogeneity among the elderly poor due to variations in regional healthcare policies and local socio-economic support structures.
Intergroup disparities elucidate the nuanced trajectory of HCF across income pairings. The high–middle disparity is most pronounced in early life—registering 0.141 in the 0–29 s—and persists into mid-adulthood before converging thereafter. Between the 50–54 s and 75–79 s, this coefficient declines to approximately 0.10, underscoring a pronounced convergence in consumption behaviors between these income strata during later life stag-es. The high–low gap remains pronounced—around 0.142 in both the 0–29 s and 30–34 s—before narrowing modestly during middle age, albeit with intermittent fluctuations. The middle–low disparity reaches its apex at 0.155 in the 0–29 s, even exceeding the high–low gap. This likely reflects high-income households’ focus on savings and investment rather than on immediate consumption in early life stages, in line with Franco Modigliani’s life cycle hypothesis [63], which suggests individuals save during high-income periods to smooth consumption during lower-income phases. In contrast, middle-income households, once they achieve early income stability, tend to increase discretionary spending on durable goods (e.g., vehicles, housing upgrades), thus widening the consumption gap with low-income households due to differences in financial flexibility and access to credit. In advanced age, the middle–low gap diminishes but resurges to 0.126 in the 85 s–, suggesting that heterogeneous eldercare arrangements and unequal access to medical resources among middle- and low-income elderly households drive renewed differentiation in HCF.

3.3. Research Limitations

National-level HCF is derived using the 2020 IO table, whereas prefectural estimates are based on the 2005 MRIO table, the most recent publicly available dataset. This discrepancy in data timing introduces a temporal inconsistency that may introduce bias in cross-scale comparisons, particularly in light of substantial changes in economic structure and consumption patterns. To mitigate this concern, we emphasize relative magnitudes and temporal patterns across age cohorts rather than absolute emission levels. When updated prefectural MRIO data become available, we will recalibrate our model to enhance comparability between national and subnational estimates. Moreover, we acknowledge that assuming household consumption patterns, production technologies, and carbon intensities remain fixed at their 2005 levels represents a simplifying assumption that limits the validity of our long-term emissions forecasts. In reality, these parameters evolve over time in response to technological innovation, policy interventions, and shifts in consumer behavior—through energy source shifts, efficiency gains, supply chain restructuring, and changing consumption preferences—all of which could materially alter future emission pathways. By holding them constant, this study intentionally isolates the demographic drivers of HCF, treating our projections as counterfactual scenarios under unchanging technological and behavioral conditions rather than precise forecasts. Nonetheless, it is important to acknowledge that this modeling framework may exert a latent influence on our principal findings, including HCF estimations and regional heterogeneity assessments. In line with standard economic development trajectories, the carbon intensity of Japan’s final demand will gradually decline, driven by enhanced energy efficiency and a growing share of renewable energy. However, using 2005 carbon intensities to estimate prefectural-level HCF is liable to overstate absolute emission levels, since all prefectures likely followed a similar downward trajectory. Moreover, technological progress and industrial upgrading exhibit marked spatial asynchrony: highly service-oriented or early decarbonizing regions (e.g., Tokyo) tend to achieve larger reductions in carbon intensity than manufacturing-dominated areas, and thus, under a common application of the 2005 carbon intensities, interregional emission differences are objectively compressed, rendering our measure of regional heterogeneity conservative. We have therefore clarified that, by fixing carbon intensities, our model excludes broader decarbonization trends and serves as a theoretical exercise to highlight the independent effect of population dynamics. In subsequent studies, we will further commit to employing dynamic scenario analyses to more accurately capture evolving decarbonization pathways and concurrent shifts in household lifestyles.

4. Conclusions and Policy Implication

This study employs a two-tier framework—integrating the EEIO model with national IO and prefectural MRIO tables—to quantify HCF across age cohorts and income deciles in Japan. Meanwhile, CF-Gini and Dagum–Gini reveal substantial carbon inequality within life stages, driven by evolving demographic shifts and regional economic contexts. The main findings of this study are as follows:
  • Japan’s per-household HCF exhibits an inverted U-shaped age profile, peaking at 50–54 s (2.16 tCO2). Disaggregating HCF by age and income reveals that, although HCF generally increases with income, it falls at both lower and upper ends of the income spectrum within the 70–84 s. Carbon inequality reveals a U-shaped pattern, with higher CF-Gini coefficients in the younger and elderly groups.
  • While the inverted U-shape in per-household HCF holds across prefectures, its peak shifts: 60–64 s in high-GRP prefectures (e.g., Tokyo) versus 45–49 s in low-GRP prefectures (e.g., Aomori). Moreover, late-life HCF rebounds in two prefecture types: high-aging, low-GRP prefectures (e.g., Akita) via essential expenditures, and low-aging, high-GRP prefectures (e.g., Chiba) via energy-intensive eldercare services.
  • Population aging’s long-term impact on HCF exhibits marked regional heterogeneity. In low-GRP prefectures, HCF among young and middle-aged cohorts declines obviously from 2020 to 2050 (e.g., a 58% reduction in Akita’s 0–29 s). In high-GRP prefectures, these declines are marginal, while HCF among the elderly rises markedly (e.g., 44% growth in Tokyo’s 60–69 s).
  • Aggregate spatial inequality in HCF exhibits a U-shaped pattern. Intragroup disparities decline with age. In contrast, intergroup disparities increase over the life course: the high–low and middle–low disparities, initially 0.142 and 0.155, narrow to approximately 0.10 in midlife, then the middle–low disparities rebound to 0.126 in the 85 s–, reflecting unequal access to medical and eldercare services.
Our quantitative analysis indicates that a uniform mitigation strategy cannot simultaneously achieve Japan’s 2050 net-zero goal and alleviate the carbon inequality pressures intensified by population aging. Instead, Japan must urgently implement differentiated decarbonization policies—calibrated by age cohort, income bracket, and regional context—across both national and subnational levels. Specifically, the main results suggest the following policy implications:
First, integrating age and income dimensions into climate mitigation strategies is essential. The Japanese government should incorporate a life cycle perspective and stratified income policies into its Nationally Determined Contributions (NDCs (national efforts to curb emissions and mitigate climate change are vital for achieving the Paris Agreement’s long-term GHG emission reduction objectives)), thereby establishing a multidimensional governance framework that horizontally addresses all age cohorts and vertically spans income tiers. At the statistical and monitoring level, a comprehensive HCF database should be developed by integrating census data and NSFIE household expenditure surveys, with emission baselines updated across five-year age bands and detailed income brackets. Additionally, structural decarbonization initiatives should prioritize the mid-life high-emission cohort (30–64 s, incomes 600–) by deploying green finance incentives and differentiated carbon pricing to shift consumption toward low-carbon alternatives. One option is a targeted carbon tax rebate scheme, in which a portion of paid carbon taxes is refunded to those who meet predefined low-carbon investment or consumption criteria; rebates are strictly earmarked for acquiring or retrofitting high-impact substitutes (e.g., electric vehicles, energy-efficient appliances). This preserves fiscal revenue while directly incentivizing emission reduction at the individual level. Simultaneously, a green consumption tax deduction would permit middle- and high-income consumers to offset personal income or value-added taxes on qualifying energy-saving products, thereby lowering the net cost of low-carbon purchases. Together, these instruments curb carbon-intensive spending among high-income, middle-aged cohorts; reduce HCF; and uphold equity through a balanced combination of rebates and tax deductions. For younger and low-income elderly groups, the government should adopt a welfare synergy approach that links access to green public services—such as low-carbon rental housing and community energy networks—with social security subsidies, thereby mitigating the regressive impacts of carbon reduction policies on vulnerable populations.
Second, the Japanese government must implement a geographically differentiated decarbonization framework to address regional and life cycle disparities. In high-GRP prefectures like Tokyo, household consumption is concentrated in energy-intensive high-end services. As population aging progresses, emissions may not decline as quickly as in low-GRP prefectures but may instead rise due to increased demand from the elderly for personalized services. In high-GRP prefectures, efforts should concentrate on key sectors—eldercare and cultural services—by pursuing an age-friendly low-carbon transition that accelerates the development of zero-emission medical facilities and smart elderly communities, thereby driving the low-carbon upgrading of the service industry. By contrast, in low-GRP prefectures such as Akita, constrained infrastructure and sparse service availability exacerbate HCF. Hence, decarbonization efforts must prioritize both the expansion of essential services and the realignment of consumption patterns to support low-carbon living. First, sustainable transport should be strengthened through dedicated investments in public transit and targeted subsidies for electric shared mobility schemes, thereby reducing reliance on private vehicles. Second, energy efficiency retrofits—especially in long-occupied, elderly-dominated households—must be accelerated to achieve direct HCF reductions. Complementing these supply-side measures, welfare-oriented subsidies for low-income elderly cohorts can lower barriers to decarbonized consumption: under such schemes, eligible seniors would receive carbon vouchers redeemable for public transit fares, energy efficient appliances, or eco-friendly foods, and benefit from a senior mobility subsidy offering discounted access to public transit, shared mobility, and low-carbon healthcare services. Together, these interventions decrease living costs, foster sustainable behaviors, and enhance health and well-being—thereby protecting vulnerable populations while advancing overarching carbon reduction targets.
Lastly, a comprehensive, multi-scalar governance framework is imperative to redress spatial inequalities in Japan’s HCF. At the intragroup level, policy interventions must be both age- and income-sensitive: high-income households in the 40–44 s should face targeted measures to curb emissions associated with children’s education, intensive eldercare, and high-return investments; middle-income households in the 85 s– require enhanced long-term care insurance and subsidized community services to offset late-life healthcare shocks; and low-income households demand expanded youth rental housing, public transport subsidies, in-home energy assistance for seniors, and equitable primary healthcare to mitigate extremes of demographic polarization. Intergroup reforms should prioritize cohorts with the greatest disparities—particularly the 0–29 s—by deploying income-indexed green consumption vouchers and educational subsidies to instill low-carbon behaviors early. Meanwhile, to address the emissions rebound associated with end-of-life care among the 85 s–, we propose that Japan’s central government pool long-term care insurance funds nationally and impose binding carbon baselines on elderly healthcare. This approach mirrors China’s interprovincial pairing and ecological compensation mechanism, whereby wealthier, technologically advanced provinces transfer expertise and fiscal resources to less developed regions through a unified emissions-trading and compensation framework, thereby equalizing abatement capacities and coordinating pollution control [64]. Similarly, integrated electricity–hydrogen markets have shown that harmonized cross-regional standards, uniform subsidy schemes, and shared infrastructure can remove policy and technical barriers, align regulatory frameworks, and improve overall market efficiency [65]. Under central oversight, aggregated long-term care funds across prefectures and uniform carbon baselines would harmonize fiscal support and advance decarbonization in end-of-life care. Subnational authorities could then implement these guidelines by defining differentiated emission targets tailored to local demographics, industrial structures, and energy endowments, and enforcing mandatory mitigation measures with accompanying fiscal incentives. In summary, by establishing a cross-regional platform for sharing eldercare infrastructure, Japan can streamline facility use, eliminate redundant construction and its associated energy demand, ensure equitable, high-quality eldercare, and thereby strengthen the coherence and efficiency of its decarbonization strategy.

Author Contributions

Y.H.: writing—original draft, investigation, conceptualization, software, methodology, visualization, funding acquisition; X.L.: writing—original draft, investigation, conceptualization, software, methodology, visualization; X.G.: review and editing, supervision, data curation, conceptualization. All authors have read and agreed to the published version of the manuscript.

Funding

This study was supported by the Doctoral Fund of Heze University (grant number: XY23BS47 and XY24BS19).

Institutional Review Board Statement

Not applicable.

Informed Consent Statement

Not applicable.

Data Availability Statement

Data will be made available on request.

Conflicts of Interest

The authors declare no conflicts of interest.

Appendix

Table A1. Household characteristics at the national level in Japan (2020).
AgeThe Number of Households by Income Group Average Household Size (Person)Average Annual Housheold
Income
0–
200
200–
300
300–
400
400–
500
500–
600
600–
700
700–
800
800–
1000
1000–
1500
1500–
0–29 s416,388 803,869 1,143,757 911,629 463,847 154,418 91,262 165,307 21,602 0 1.69386.7
30–34 s178,895 255,612 473,428 534,216 483,269 374,470 206,290 193,847 134,098 15,974 2.34544.4
35–39 s115,678 318,692 427,661 529,869 503,397 478,034 320,104 369,383 277,905 37,207 2.79601
40–44 s229,379 274,005 393,289 459,337 554,260 567,284 443,517 508,149 492,093 76,593 2.88652
44–49 s347,913 328,701 432,610 531,148 496,155 559,105 523,026 692,103 579,109 173,072 2.67681.1
50–54 s385,887 373,559 354,285 376,207 386,643 458,727 382,128 672,941 725,131 304,298 2.55749
55–59 s341,745 295,340 297,250 340,756 386,260 408,003 339,205 659,127 695,942 285,197 2.31746.4
60–64 s512,847 516,144 525,754 572,912 435,892 339,108 309,861 399,300 425,545 202,006 2.49629.6
65–69 s717,189 732,400 848,910 729,036 516,584 381,416 279,763 309,731 268,508 125,881 2.48523
70–74 s770,436 898,066 957,374 677,523 503,564 291,955 193,383 262,332 260,338 89,540 2.54473.8
75–79 s867,380 985,646 850,586 471,640 257,861 161,626 97,474 150,354 109,785 57,307 2.63418.8
80–84 s934,955 776,894 657,186 326,314 184,050 89,748 61,662 87,570 111,743 30,440 2.42374.5
85 s–536,197 662,786 497,521 248,855 132,784 68,124 71,828 44,448 60,224 27,352 2.57361.4
Note: Household income is divided into ten deciles (units of JPY 10,000), and age structure is divided into thirteen cohorts. Here, N u m H H denotes the number of households. The units for both the income quantile groups and the annual average income are in JPY 10,000.
Table A2. GRP per household across prefectures in Japan in 2005.
No.PrefectureGRP Per Household
(Unit: Million JPY)
1Hokkaido8.2
2Aomori8.6
3Iwate9.3
4Miyagi9.7
5Akita9.4
6Yamagata10.1
7Fukushima11.0
8Ibaraki10.9
9Tochigi11.6
10Gunma10.5
11Saitama7.8
12Chiba8.4
13Tokyo16.9
14Kanagawa8.7
15Niigata11.3
16Toyama13.0
17Ishikawa11.1
18Fukui12.6
19Yamanashi10.0
20Nagano10.8
21Gifu10.6
22Shizuoka12.5
23Aichi12.9
24Mie11.3
25Shiga12.6
26Kyoto9.3
27Osaka10.8
28Hyogo9.1
29Nara7.7
30Wakayama9.5
31Tottori9.7
32Shimane9.3
33Okayama10.5
34Hiroshima9.9
35Yamaguchi10.0
36Tokushima9.7
37Kagawa9.8
38Ehime8.5
39Kochi7.4
40Fukuoka9.0
41Saga10.0
42Nagasaki7.8
43Kumamoto8.5
44Oita9.2
45Miyazaki7.8
46Kagoshima7.7
47Okinawa7.5
Note: GRP per household was calculated by integrating GRP figures from the Cabinet Office [66] with demographic data published by the Statistics Bureau of the Ministry of Internal Affairs and Communications [67].
Table A3. Household characteristics at the prefectural level in Japan (2005).
Age0–29 s30–34 s35–39 s40–44 s44–49 s50–54 s55–59 s60–64 s65–69 s70–74 s75–79 s80–84 s85 s–
Prefecture
1 N u m H H 180,754135,358147,690186,799217,802196,744198,742195,224238,834229,271181,182161,815116,240
A v e H I 334.8456.2554.3536.6579.1603.9630502.5436361275.9283.5266.9
2 N u m H H 21,30117,28123,46633,18137,96941,23342,36754,82962,30455,68743,09939,73323,515
A v e H I 420.5459.6529.2599.2607.5665.9585.2584.1473.9411.6360.9312.6314.8
3 N u m H H 24,96418,71523,06531,07135,26740,42439,02751,61757,16351,32640,08134,36922,187
A v e H I 389.5475.9573.4617.5579.5708.6612.3580.5576.3477.5392.8373.5414.6
4 N u m H H 71,88544,58254,21768,68974,07074,27872,98691,88999,39186,13561,22854,70937,570
A v e H I 367.8569.7521.5609.3642.8737.1794607563.8589.8370.9386437.4
5 N u m H H 13,23811,73616,73720,66224,75628,58731,94343,56649,59643,47135,46034,77624,552
A v e H I 320.6550480.9821.1626.1645.7606.1633.7521.4480.5395.4333.5436.9
6 N u m H H 17,43314,82718,75022,01024,13930,04631,72543,97848,10243,04032,37630,59922,661
A v e H I 426.5499.4636.5573668.1752.5774.2639.7552.9559.7460.9462.9461.3
7 N u m H H 37,13527,89836,42849,84055,28861,73763,66580,81285,38274,82052,02649,45635,086
A v e H I 375.5465.6546.1571.9679.3770635.8628.5503.6470390.3403.3345.5
8 N u m H H 72,30757,57267,45283,36694,85895,837101,336104,036110,222109,40389,60064,91844,989
A v e H I 433.4554.6635.2681.8683.9816.3788.3658.6547.5491.5440.3432.9370.1
9 N u m H H 51,47142,50246,77757,89362,83164,79668,99671,43173,18368,83456,11435,64923,702
A v e H I 388.7512.1556.6594.7757.6772.5799.2626.1588.3529.1460.6303.1340.3
10 N u m H H 50,60835,23946,77757,20765,83662,08564,87966,38874,12571,02160,62748,84635,584
A v e H I 441.1544.7597.2586.9641.4743.6792.5625.8559441.5436.3330.6348.5
11 N u m H H 222,764171,757193,817246,660284,367271,388236,226236,751269,650290,436232,826162,74493,397
A v e H I 403.8546.7644.3651.8677.9752881.3668.3508.8510.2396.9394392.6
12 N u m H H 199,138140,275159,189193,801231,391214,221192,601188,225222,733230,617190,588133,82577,745
A v e H I 410.3557.1564.7698.9770.6793.6858.8674539.5502.6400.5342.6417.2
13 N u m H H 793,446514,154499,859522,312600,076549,980435,356368,671431,567440,678395,874336,692260,731
A v e H I 415.8665.3705.3774690.8845.8752.2768580.6515578.7434.6385.1
14 N u m H H 367,982256,176283,589337,285407,634370,894303,392272,077318,997332,535285,921222,622155,673
A v e H I 415.5577.1634.3698.7752.2867.2832.1708512.6494437.3477.3389.4
15 N u m H H 56,24839,04336,96057,23660,52668,30168,54486,88788,91186,11268,32061,26446,626
A v e H I 408557552.7597583.4677.3727.3643.1502.8539.5504.9394.7396.5
16 N u m H H 23,84017,71518,03128,91830,17231,04628,24835,88644,12544,47630,26027,79620,574
A v e H I 443.1540.9603.8663.4636.9808.5817.5749.9580.6574.6440.9513.5493
17 N u m H H 35,74622,38422,67237,75836,30737,66832,67639,48746,86346,35531,06626,12218,943
A v e H I 385.2562574.8682.6659.3741.6733.2655.1565477.3367.9395.1486.6
18 N u m H H 17,66812,93412,64316,41520,55123,36522,31226,65829,67729,54921,35517,21314,030
A v e H I 427.6568.2708.9668635.1794.3821.4693.1577.9551.4520.9475.7388
19 N u m H H 17,95413,72017,02020,34425,63629,39329,07827,06729,11730,85527,16023,57019,539
A v e H I 350.9526561.3583.3642.9700.9779.8573.1487.3510.8390.9427.7316.3
20 N u m H H 44,72535,14444,01854,27462,97664,71766,82365,83075,30378,23867,72661,10951,488
A v e H I 374.1576.9590599.8717.3701.3732.8589.2589543.1439.5386348.5
21 N u m H H 39,50533,11144,03556,06562,62464,23757,14866,35678,18679,88265,13846,59433,577
A v e H I 402.9530.4650.8617721.8732.7917.6688.7564.3499.7471.1405.7532.1
22 N u m H H 80,60668,47784,850104,021124,797124,589112,326124,186139,277145,323117,48090,90163,489
A v e H I 409544.3641.3643.2684.7747.7744.4650.3597.6552.9421.1395.1453
23 N u m H H 258,997192,876222,900273,259302,865282,484220,450225,755262,795281,035222,482165,199104,415
A v e H I 378.8545.4653718.7787.8791.2733.1773.8608.8495.9431.1416.3406.3
24 N u m H H 41,55834,27244,27257,01061,89862,58855,85356,86068,78071,71160,45148,62635,120
A v e H I 426.2624.9622.6621.4715.7921.4801.3567.8557.1470.6454.5402.1337.4
25 N u m H H 47,79925,69640,48241,34652,76845,68045,57542,70348,53743,67635,15728,66620,506
A v e H I 411596.5590.1617.6729.8816.6850.3632.5573.1525.5424.3464452.9
26 N u m H H 101,18244,32071,06377,000101,37289,49884,80680,626105,964106,23789,72969,49752,041
A v e H I 319.8516.8507698.4759.9715.5662.6623.1494.2453.5429.1365.4308.1
27 N u m H H 346,565195,250273,528294,481394,810333,847291,525277,607347,900380,638333,373238,931159,529
A v e H I 377457.8544.5589.7611.2699.8655.5586.3465.3421381.7298.1345.4
28 N u m H H 168,42598,157147,950158,528221,792192,149187,743177,963214,242220,677189,107147,309107,172
A v e H I 396477.9569.5653.9735.3733.9823599.6525.2438402361.3377.7
29 N u m H H 28,80219,09130,48734,88850,01244,21045,20844,48153,91457,79949,66035,17224,270
A v e H I 308.4485.4539.9569.2655.9798.1759.1571.9538.7440.9383.5428.2352.7
30 N u m H H 14,60412,97820,36022,07528,79729,80732,50331,81737,63140,33236,72030,83324,532
A v e H I 338.2507.1488.1593.8606.6598.5724.9484.9426.6497.8377.1272300.6
31 N u m H H 12,11210,07210,81214,75614,92817,08216,48322,88622,52422,08617,23715,41112,466
A v e H I 334.3526.4490.3569.8710.9726.1754.4603518.4524.9442.2366.4363.6
32 N u m H H 15,32911,91612,26916,86116,57519,19119,03227,37828,91128,23021,45020,3707860
A v e H I 357.9572.3510.5679.8715.2773.4655.6628.2611.7516.5510.7372.2377.3
33 N u m H H 61,55940,82341,34158,91451,21257,75649,87266,16275,28582,28959,10352,29140,629
A v e H I 398.7547.1544.4576.8659.8844932576.6681.4499.9401.6390.8330.1
34 N u m H H 102,14568,36068,85696,65996,64990,90978,46397,390114,618122,72087,47973,94363,710
A v e H I 389.1485.7612.3575.8706.3646.8756.1592.9574.6429404.2329.9349.3
35 N u m H H 41,06124,78027,85939,72339,36441,75339,17254,60962,72866,50852,00148,67038,339
A v e H I 364.1518.5572.2594656.5706.3779531.5474.8412.7416338.6287.7
36 N u m H H 17,45711,86613,17719,70222,14923,35323,97330,62530,94733,26523,70923,39516,764
A v e H I 298.9510.5587.9665.7687.9677685.6511.8468.5398.8385.6370.9319.5
37 N u m H H 22,21814,54519,36930,54230,40229,93029,59636,91140,30243,61730,13728,59022,653
A v e H I 357.9534.5584.2652.1686.7736.9826.8579505.4456.9324.5411.1318
38 N u m H H 33,53929,08026,22940,80141,43444,81144,32856,45856,27764,50846,20045,00539,358
A v e H I 295.3469.1662.3572.9611.8585.8561.1588.2521.5473.7381.3314.1271.9
39 N u m H H 16,29713,48214,05820,94920,70322,92023,63529,58231,95836,28126,11827,07123,155
A v e H I 288.3454.2551608.3655.7531.9596.8596.3401.8372.4308.5278.7277.9
40 N u m H H 182,030110,465158,484169,226188,309167,528156,192185,707226,705200,533153,251127,94693,966
A v e H I 315.8445.5524622.1589.4629.7650.1581.3443.6413356.3354.8330.2
41 N u m H H 17,99811,01118,21618,58322,56822,55424,64530,25034,67830,15324,81119,87215,350
A v e H I 366.2484.5533.3588.7715.4780726.1627.3511.2486419.7437374.6
42 N u m H H 31,69519,86731,46335,36142,78243,11545,61754,67462,43553,70346,16142,69434,481
A v e H I 318.1441577.9632.7552.2710.4658.9470.8424.5411.2383.3310346.7
43 N u m H H 45,90630,91043,53243,50050,71150,85055,45264,96873,26962,93356,06348,93341,322
A v e H I 315.1484.6546.9584.1620.2584.8706.9581.6465.5516.5462.8299330.8
44 N u m H H 33,44719,40429,35430,03234,44032,30136,84542,94654,10548,18839,08533,59625,862
A v e H I 345.2468.6558611.5604.7632.9640515.6443.7398.8332.7319.1302.8
45 N u m H H 26,74418,58029,33229,89231,95031,70136,83843,00250,38342,88436,34033,49626,979
A v e H I 312.2450.6505.2570.7596.1665.3648512.3467.2370.2317329.5235
46 N u m H H 48,24830,22242,40543,98152,03353,57757,74068,08072,96564,27957,99459,66954,432
A v e H I 386.5402.9507517.2610586.8617.8461.1380366.5371.4246.8226
47 N u m H H 42,38031,47242,09444,02852,54444,64246,88248,07758,85832,16830,33530,05423,314
A v e H I 373.3393.8497.7480.8494.6532.3497.1350.2454.5399.4273.8337.9241.1
Note: Age structure is divided into thirteen cohorts. Prefectural codes 1–47 correspond to Japan’s 47 prefectures (see Table A2 for details). Here, N u m H H denotes the number of households, and A v e H I indicates the average annual household income (units of JPY 10,000).
Figure A1. The geographical locations of 47 prefectures. The geographical data used to construct this map were obtained from the Geospatial Information Authority of Japan [68].
Sustainability 17 05627 g0a1
Figure A2. Projected trends in prefecture-level HCF. Note: For detailed geographic locations of the prefectures shown in this figure, please refer to the prefecture map in Figure A1 of the Appendix A.
Sustainability 17 05627 g0a2

References

  1. Peters, G.P.; Andrew, R.M.; Canadell, J.G.; Fuss, S.; Jackson, R.B.; Korsbakken, J.I.; Le Quéré, C.; Nakicenovic, N. Key Indicators to Track Current Progress and Future Ambition of the Paris Agreement. Nat. Clim. Change 2017, 7, 118–122. [Google Scholar] [CrossRef]
  2. Shigetomi, Y.; Matsumoto, K.; Ogawa, Y.; Shiraki, H.; Yamamoto, Y.; Ochi, Y.; Ehara, T. Driving Forces Underlying Sub-National Carbon Dioxide Emissions within the Household Sector and Implications for the Paris Agreement Targets in Japan. Appl. Energy 2018, 228, 2321–2332. [Google Scholar] [CrossRef]
  3. Peters, G.P. From Production-Based to Consumption-Based National Emission Inventories. Ecol. Econ. 2008, 65, 13–23. [Google Scholar] [CrossRef]
  4. Wang, Y.; Liu, Q. Examining Factors Driving Household Carbon Emissions from Elderly Families—Evidence from Japan. Financ. Res. Lett. 2024, 65, 105511. [Google Scholar] [CrossRef]
  5. Ministry of the Environment Introduction of the Tax for Global Warming Countermeasures. Available online: https://www.env.go.jp/policy/tax/about.html (accessed on 14 May 2025).
  6. Tokyo Metropolitan Government Emissions Trading Scheme. Available online: https://www.kankyo.metro.tokyo.lg.jp/climate/large_scale/trade (accessed on 14 May 2025).
  7. Ministry of Environment Target-Based Emissions Trading Scheme. Available online: https://www.pref.saitama.lg.jp/a0502/torihikiseido.html (accessed on 14 May 2025).
  8. Agency for Natural Resources and Energy Net-Zero Energy House (ZEH). Available online: https://www.enecho.meti.go.jp/category/saving_and_new/saving/general/housing/index03.html (accessed on 13 May 2025).
  9. Chancel, L. Global Carbon Inequality over 1990–2019. Nat. Sustain. 2022, 5, 931–938. [Google Scholar] [CrossRef]
  10. Hailemariam, A.; Dzhumashev, R.; Shahbaz, M. Carbon Emissions, Income Inequality and Economic Development. Empir. Econ. 2020, 59, 1139–1159. [Google Scholar] [CrossRef]
  11. Zhang, Z.X.; Cui, Y.; Zhang, Z. Unequal Age-Based Household Carbon Footprint in China. Clim. Policy 2023, 23, 577–592. [Google Scholar] [CrossRef]
  12. Li, K.; Li, H.; Wang, Y.; Yang, Z.; Liang, S. Household Carbon Footprints of Age Groups in China and Socioeconomic Influencing Factors. Sci. Total Environ. 2024, 923, 171402. [Google Scholar] [CrossRef]
  13. Shigetomi, Y.; Nansai, K.; Kagawa, S.; Tohno, S. Changes in the Carbon Footprint of Japanese Households in an Aging Society. Environ. Sci. Technol. 2014, 48, 6069–6080. [Google Scholar] [CrossRef]
  14. Wang, J.; Huang, Y.; Long, Y.; Chapman, A.; Shigetomi, Y. How Population Aging Affects Carbon Footprints in US Households: A Comparative Study with Japan. Environ. Res. Commun. 2024, 6, 105021. [Google Scholar] [CrossRef]
  15. Huang, Y.; Shigetomi, Y.; Chapman, A.; Matsumoto, K. Uncovering Household Carbon Footprint Drivers in an Aging, Shrinking Society. Energies 2019, 12, 3745. [Google Scholar] [CrossRef]
  16. Long, Y.; Yoshida, Y.; Meng, J.; Guan, D.; Yao, L.; Zhang, H. Unequal Age-Based Household Emission and Its Monthly Variation Embodied in Energy Consumption—A Cases Study of Tokyo, Japan. Appl. Energy 2019, 247, 350–362. [Google Scholar] [CrossRef]
  17. Kanemoto, K.; Shigetomi, Y.; Hoang, N.T.; Okuoka, K.; Moran, D. Spatial Variation in Household Consumption-Based Carbon Emission Inventories for 1200 Japanese Cities. Environ. Res. Lett. 2020, 15, 114053. [Google Scholar] [CrossRef]
  18. Huang, Y.; Shigetomi, Y.; Matsumoto, K. Evaluating Carbon Inequality by Household Type and Income Level across Prefectures in Japan. Sustain. Cities Soc. 2022, 87, 104236. [Google Scholar] [CrossRef]
  19. Huang, L.; Montagna, S.; Wu, Y.; Chen, Z.; Tanaka, K.; Yoshida, Y.; Long, Y. Extension and Update of Multiscale Monthly Household Carbon Footprint in Japan from 2011 to 2022. Sci. Data 2023, 10, 439. [Google Scholar] [CrossRef]
  20. Campos, C.; Laso, J.; Cristóbal, J.; Albertí, J.; Bala, A.; Fullana, M.; Fullana-i-Palmer, P.; Margallo, M.; Aldaco, R. Towards More Sustainable Tourism under a Carbon Footprint Approach: The Camino Lebaniego Case Study. J. Clean. Prod. 2022, 369, 133222. [Google Scholar] [CrossRef]
  21. Bin, S.; Dowlatabadi, H. Consumer Lifestyle Approach to US Energy Use and the Related CO2 Emissions. Energy Policy 2005, 33, 197–208. [Google Scholar] [CrossRef]
  22. Du, Z.; Xu, J.; Lin, B. What Does the Digital Economy Bring to Household Carbon Emissions?—From the Perspective of Energy Intensity. Appl. Energy 2024, 370, 123613. [Google Scholar] [CrossRef]
  23. Long, Y.; Jiang, Y.; Chen, P.; Yoshida, Y.; Sharifi, A.; Gasparatos, A.; Wu, Y.; Kanemoto, K.; Shigetomi, Y.; Guan, D. Monthly Direct and Indirect Greenhouse Gases Emissions from Household Consumption in the Major Japanese Cities. Sci. Data 2021, 8, 301. [Google Scholar] [CrossRef] [PubMed]
  24. Ge, X.; Liu, X.; Zhong, M. From Aging to Greener Homes: Understanding the Link between Population Aging and Household Carbon Emissions in China. Environ. Impact Assess. Rev. 2024, 106, 107459. [Google Scholar] [CrossRef]
  25. Yu, B.; Wei, Y.M.; Kei, G.; Matsuoka, Y. Future Scenarios for Energy Consumption and Carbon Emissions Due to Demographic Transitions in Chinese Households. Nat. Energy 2018, 3, 109–118. [Google Scholar] [CrossRef]
  26. Long, Y.; Feng, J.; Sun, A.; Wang, R.; Wang, Y. Structural Characteristics of the Household Carbon Footprint in an Aging Society. Sustainability 2023, 15, 12825. [Google Scholar] [CrossRef]
  27. Menz, T.; Welsch, H. Population Aging and Carbon Emissions in OECD Countries: Accounting for Life-Cycle and Cohort Effects. Energy Econ. 2012, 34, 842–849. [Google Scholar] [CrossRef]
  28. Koide, R.; Lettenmeier, M.; Kojima, S.; Toivio, V.; Amellina, A.; Akenji, L. Carbon Footprints and Consumer Lifestyles: An Analysis of Lifestyle Factors and Gap Analysis by Consumer Segment in Japan. Sustainability 2019, 11, 5983. [Google Scholar] [CrossRef]
  29. Hu, H.; Xu, J.; Zhang, X. The Role of Housing Wealth, Financial Wealth, and Social Welfare in Elderly Households’ Consumption Behaviors in China. Cities 2020, 96, 102437. [Google Scholar] [CrossRef]
  30. Huang, L.; Long, Y.; Chen, Z.; Li, Y.; Ou, J.; Shigetomi, Y.; Yoshida, Y. Increasing Single Households Challenges Household Decarbonization in Japan. Glob. Environ. Change 2024, 86, 102848. [Google Scholar] [CrossRef]
  31. Feng, K.; Hubacek, K.; Song, K. Household Carbon Inequality in the U.S. J. Clean. Prod. 2021, 278, 123994. [Google Scholar] [CrossRef]
  32. Wiedenhofer, D.; Guan, D.; Liu, Z.; Meng, J.; Zhang, N.; Wei, Y.M. Unequal Household Carbon Footprints in China. Nat. Clim. Change 2017, 7, 75–80. [Google Scholar] [CrossRef]
  33. Zhang, X.; Wang, J.; Pan, H.; Yuan, Z.; Feng, K. Changes in the Socio-Economic Characteristics of Households Can Decouple Carbon Emissions and Consumption Growth in China. Sustain. Prod. Consum. 2023, 43, 168–180. [Google Scholar] [CrossRef]
  34. Wei, L.; Liu, Z. Spatial Heterogeneity of Demographic Structure Effects on Urban Carbon Emissions. Environ. Impact Assess. Rev. 2022, 95, 106790. [Google Scholar] [CrossRef]
  35. Huang, L.; Long, Y.; Chen, J.; Yoshida, Y. Sustainable Lifestyle: Urban Household Carbon Footprint Accounting and Policy Implications for Lifestyle-Based Decarbonization. Energy Policy 2023, 181, 113696. [Google Scholar] [CrossRef]
  36. Hubacek, K.; Baiocchi, G.; Feng, K.; Muñoz Castillo, R.; Sun, L.; Xue, J. Global Carbon Inequality. Energy Ecol. Environ. 2017, 2, 361–369. [Google Scholar] [CrossRef]
  37. Zheng, H.; Long, Y.; Wood, R.; Moran, D.; Zhang, Z.; Meng, J.; Feng, K.; Hertwich, E.; Guan, D. Author Correction: Ageing Society in Developed Countries Challenges Carbon Mitigation. Nat. Clim. Change 2022, 12, 593. [Google Scholar] [CrossRef]
  38. Mi, Z.; Zheng, J.; Meng, J.; Ou, J.; Hubacek, K.; Liu, Z.; Coffman, D.M.; Stern, N.; Liang, S.; Wei, Y.M. Economic Development and Converging Household Carbon Footprints in China. Nat. Sustain. 2020, 3, 529–537. [Google Scholar] [CrossRef]
  39. Hori, K.; Saito, O.; Hashimoto, S.; Matsui, T.; Akter, R.; Takeuchi, K. Projecting Population Distribution under Depopulation Conditions in Japan: Scenario Analysis for Future Socio-Ecological Systems. Sustain. Sci. 2021, 16, 295–311. [Google Scholar] [CrossRef] [PubMed]
  40. Wu, L.; Jia, X.; Gao, L.; Zhou, Y. Effects of Population Flow on Regional Carbon Emissions: Evidence from China. Environ. Sci. Pollut. Res. 2021, 28, 62628–62639. [Google Scholar] [CrossRef] [PubMed]
  41. Kira, N.; Long, Y.; Shigetomi, Y. Measuring the Rebound of Japan’s per-Industry Household Carbon Footprints and Emission Inequalities during the COVID-19 Pandemic in 2020–2021. Resour. Conserv. Recycl. 2024, 203, 107414. [Google Scholar] [CrossRef]
  42. Yu, M.; Meng, B.; Li, R. Analysis of China’s Urban Household Indirect Carbon Emissions Drivers under the Background of Population Aging. Struct. Change Econ. Dyn. 2022, 60, 114–125. [Google Scholar] [CrossRef]
  43. Leontief, W. Environmental Repercussions and the Economic Structure: An Input-Output Approach. Rev. Econ. Stat. 1970, 52, 262. [Google Scholar] [CrossRef]
  44. Kitzes, J. An Introduction to Environmentally-Extended Input-Output Analysis. Resources 2013, 2, 489–503. [Google Scholar] [CrossRef]
  45. Wiedmann, T. A Review of Recent Multi-Region Input-Output Models Used for Consumption-Based Emission and Resource Accounting. Ecol. Econ. 2009, 69, 211–222. [Google Scholar] [CrossRef]
  46. Dalton, H. The Measurement of the Inequality of Incomes. Econ. J. 1920, 30, 348. [Google Scholar] [CrossRef]
  47. Dagum, C. A New Approach to the Decomposition of the Gini Income Inequality Ratio. Empir. Econ. 1997, 22, 515–531. [Google Scholar] [CrossRef]
  48. Domma, F.; Condino, F.; Giordano, S. A New Formulation of the Dagum Distribution in Terms of Income Inequality and Poverty Measures. Phys. A Stat. Mech. Its Appl. 2018, 511, 104–126. [Google Scholar] [CrossRef]
  49. Xiao, W.; He, M. Characteristics, Regional Differences, and Influencing Factors of China’s Water-Energy-Food (W-E–F) Pressure: Evidence from Dagum Gini Coefficient Decomposition and PGTWR Model. Environ. Sci. Pollut. Res. 2023, 30, 66062–66079. [Google Scholar] [CrossRef]
  50. Agency for Natural Resources and Energy Prefectural Energy Consumption Statistics—Survey Results. Available online: https://www.enecho.meti.go.jp/statistics/energy_consumption/ec002/results.html#headline1 (accessed on 28 May 2025).
  51. Agency for Natural Resources and Energy Comprehensive Energy Statistics—National Aggregated Results. Available online: https://www.enecho.meti.go.jp/statistics/total_energy/results.html#headline2 (accessed on 28 May 2025).
  52. National Institute of Population and Social Security Research Estimated Future Population by Region in Japan. Available online: https://www.ipss.go.jp/pp-shicyoson/j/shicyoson23/t-page.asp (accessed on 25 April 2025).
  53. Ministry of Internal Affairs and Communications Input-Output Table of Japan. Available online: https://www.soumu.go.jp/toukei_toukatsu/data/io/ichiran.htm (accessed on 25 April 2025).
  54. Ministry of Internal Affairs and Communications National Survey of Family Income and Expenditure. Available online: https://www.e-stat.go.jp/stat-search?page=1&toukei=00200564 (accessed on 25 April 2025).
  55. Hasegawa, R.; Kagawa, S.; Tsukui, M. Carbon Footprint Analysis through Constructing a Multi-Region Input–Output Table: A Case Study of Japan. J. Econ. Struct. 2015, 4, 5. [Google Scholar] [CrossRef]
  56. Shigetomi, Y.; Nansai, K.; Kagawa, S.; Tohno, S. Trends in Japanese Households’ Critical-Metals Material Footprints. Ecol. Econ. 2015, 119, 118–126. [Google Scholar] [CrossRef]
  57. Ministry of Economy, Trade and Industry. Input–Output Structural Survey (Margin Survey). Available online: https://www.e-stat.go.jp/stat-search?page=1&toukei=00550470&survey=%E7%94%A3%E6%A5%AD%E9%80%A3%E9%96%A2%E8%A1%A8 (accessed on 17 May 2025).
  58. Cravino, J.; Levchenko, A.; Rojas, M. Population Aging and Structural Transformation. Am. Econ. J. Macroecon. 2022, 14, 479–498. [Google Scholar] [CrossRef]
  59. Higo, M.; Khan, H.T. Global Population Aging: Unequal Distribution of Risks in Later Life between Developed and Developing Countries. Glob. Soc. Policy 2015, 15, 146–166. [Google Scholar] [CrossRef]
  60. Varlamova, J.; Larionova, N. Macroeconomic and Demographic Determinants of Household Expenditures in OECD Countries. Procedia Econ. Financ. 2015, 24, 727–733. [Google Scholar] [CrossRef]
  61. Yagita, Y.; Iwafune, Y. Residential Energy Use and Energy-Saving of Older Adults: A Case from Japan, the Fastest-Aging Country. Energy Res. Soc. Sci. 2021, 75, 102022. [Google Scholar] [CrossRef]
  62. Long, Y.; Yoshida, Y.; Huang, L.; Chen, P.; Wu, Y.; Gasparatos, A. Demographic Transitions Hinder Climate Change Mitigation for Japan’s Shrinking and Aging Households. Cell Rep. Sustain. 2024, 1, 100053. [Google Scholar] [CrossRef]
  63. Ando, A.; Modigliani, F. The “Life Cycle” Hypothesis of Saving: Aggregate Implications and Tests. Am. Econ. Rev. 1963, 53, 55–84. [Google Scholar]
  64. Gao, Z.; Jia, Z.; Zhao, Y.; Hao, Y. Enhancing the Synergistic Pathways of Industrial Pollution and Carbon Reduction (PCR) in China: An Energy Efficiency Perspective. Energies 2025, 18, 2413. [Google Scholar] [CrossRef]
  65. Mochi, P. Perspective on Challenges and Opportunities in Integrated Electricity-Hydrogen Market. Energy Sustain. Dev. 2025, 87, 101728. [Google Scholar] [CrossRef]
  66. Cabinet Office Prefectural Economic Calculation (2006–2018). Available online: https://www.esri.cao.go.jp/jp/sna/data/data_list/kenmin/files/contents/main_2018.html (accessed on 27 January 2022).
  67. Ministry of Internal Affairs and Communications. The Japanese National Census in 2005. Available online: https://www.e-stat.go.jp/stat-search/files?page=1&toukei=00200521&tstat=000001007251&result_page=1 (accessed on 19 May 2025).
  68. Geospatial Information Authority of Japan. The Map of Japan. Available online: https://www.gsi.go.jp/tizu-kutyu.html (accessed on 19 May 2025).
Figure 1. The conceptual research framework diagram.
Sustainability 17 05627 g001
Figure 2. The analytical framework of the Dagum–Gini approach.
Sustainability 17 05627 g002
Figure 3. National-level HCF by income and age group in 2020. Note: the “overall HCF” subplot presents age-group categories on the X-axis, whereas the remaining subplots display distinct household income brackets.
Sustainability 17 05627 g003
Figure 4. Total HCF across prefectures in Japan (2005).
Sustainability 17 05627 g004
Figure 5. Breakdown of per-household HCF by prefecture in Japan for 2005. Note: In the legend, blue hues correspond to essential expenditures, while red hues indicate discretionary expenditures.
Sustainability 17 05627 g005
Figure 6. Prefectural HCF across age groups in 2005. Note: for detailed geographic locations of the prefectures shown in this figure, please refer to the prefecture map in Figure A1 of the Appendix A.
Sustainability 17 05627 g006
Figure 7. Projected trends of HCF across different age groups (2020–2050).
Sustainability 17 05627 g007
Figure 8. Spatial inequalities in HCF across age groups and their decomposition in 2005.
Sustainability 17 05627 g008
Disclaimer/Publisher’s Note: The statements, opinions and data contained in all publications are solely those of the individual author(s) and contributor(s) and not of MDPI and/or the editor(s). MDPI and/or the editor(s) disclaim responsibility for any injury to people or property resulting from any ideas, methods, instructions or products referred to in the content.

