Article

Economic Viability of Vehicle-to-Grid (V2G) Reassessed: A Degradation Cost Integrated Life-Cycle Analysis

1
School of Automotive Engineering, Harbin Institute of Technology, Weihai 264209, China
2
Southampton Ocean Engineering Joint Institute, Harbin Engineering University, Harbin 150006, China
3
School of Naval Architecture Ocean Engineering, Harbin Institute of Technology, Weihai 264209, China
*
Author to whom correspondence should be addressed.
Sustainability 2025, 17(12), 5626; https://doi.org/10.3390/su17125626
Submission received: 6 May 2025 / Revised: 12 June 2025 / Accepted: 17 June 2025 / Published: 18 June 2025

Abstract

This study presents a comprehensive life-cycle assessment of Vehicle-to-Grid (V2G) economic viability, explicitly integrating the costs of both battery cycling degradation and calendar aging. While V2G offers revenue through energy arbitrage, its net profitability is critically dependent on regional electricity price differentials and the associated battery degradation costs. We develop a dynamic cost–benefit model, validated over a 10-year horizon across five diverse regions (Shanghai, Chengdu, the U.S., the U.K., and Australia). The results reveal stark regional disparities: Chengdu (0.65 USD/kWh peak–valley gap) and Australia (0.53 USD/kWh) achieve substantial net revenues of up to USD 25,000 per vehicle, whereas Shanghai’s narrow price differential (0.03 USD/kWh) renders V2G unprofitable. Sensitivity analysis quantifies critical break-even price differentials, varying by EV model and annual mileage (e.g., 0.12 USD/kWh minimum for Tesla Model Y). Crucially, calendar aging emerged as the dominant degradation cost (67% at 10,000 km/year), indicating significant battery underutilization potential. Policy insights emphasize the necessity of targeted interventions, such as Chengdu’s discharge incentives (0.69 USD/kWh), to bridge profitability gaps. This research provides actionable guidance for policymakers, grid operators, and EV owners by quantifying the trade-offs between V2G revenue and battery longevity, enabling optimized deployment strategies.

1. Introduction

Under the global backdrop of advancing energy transition and sustainable development, the deep integration between transportation and energy sectors has become an inevitable trend. As a pivotal component in this transformation, electric vehicles (EVs) are experiencing exponential growth worldwide. In 2018, global EV sales exceeded 2 million units, with a stock of 5.1 million vehicles—a 63% increase from 2017 [1]. The International Energy Agency (IEA) forecasts that by 2030, the global market value of EVs will reach 20 times that of 2021 [2]. With continuous technological advancements, EVs no longer merely function as clean transportation tools but also have evolved into promising distributed energy storage units. Vehicle-to-Grid (V2G) technology enables bidirectional energy flow between EVs and the grid, allowing EV batteries to serve as distributed energy storage systems [3,4]. This capability not only provides grid services such as peak shaving, frequency regulation, and load balancing but also creates economic opportunities for EV owners through energy arbitrage and participation in electricity markets [5]. This study will focus on the critical period of 2025–2035 for V2G development. According to the latest projections by Ouyang Minggao, the global market share of energy vehicles (EVs) is expected to approach 40% in 2024, reach nearly 50% in 2025, and exceed 50% in 2026, marking the dominance of EVs in the automotive market. As shown in Figure 1, electric vehicles (EVs) will experience explosive growth, with the cumulative number of vehicles participating in the market projected to surpass 200 million by 2035 [6].
Although V2G technology has attracted extensive attention since its proposal in 1991 [7], its large-scale application faces challenges in economic viability and sustainability. Technically, V2G still faces multiple challenges. For instance, frequent charge–discharge cycles accelerate battery degradation, and energy losses occur during power transmission. Additionally, incompatibility issues persist between grid systems and end-user infrastructure. Currently, most mainstream charging solutions only support unidirectional charging architectures, lacking bidirectional energy exchange capabilities. While V2G generates revenue by exploiting price differences between charging and discharging electricity, the associated battery wear and tear may offset these gains, reducing the overall net benefit. Therefore, understanding the trade-offs between V2G revenue and battery degradation is crucial for optimizing V2G strategies and ensuring the technology’s economic feasibility.
Scholars worldwide have conducted in-depth research on national V2G projects: Gandhi and White (2021) used Bayesian optimization to model user behavior and identify optimal V2G scenarios based on data from six U.S. cities [8]. Niels et al. (2024) analyzed the potential benefits of V2G and its impacts on the energy sector in Norwegian and Danish markets using the Balmorel energy system [9]. Zhang et al. (2024) evaluated the V2G potential of Japan’s 47 prefectures using an agent-based modeling approach [10]. Waldron et al. (2024) analyzed real-time charging data from the UK’s EV-elocity pilot project, elucidating V2G feasibility and behavioral characteristics [11]. Studies in Northern Europe, South Korea, Portugal, and other regions have also simulated and validated regional V2G projects [12,13,14].
Technical research on V2G’s application in grid services is well-established: Jonathan Coignard et al. (2018) demonstrated that V1G/V2G charging–discharging effectively mitigates grid fluctuations caused by large-scale solar integration [15]. Yinghao Shan et al. (2019) proposed a model predictive control strategy without PID regulators, utilizing MPVP to regulate AC/DC interconnected converters, ensuring AC voltage stability and power flow between microgrids and the main grid [16]. Zhenyu Zhou et al. (2019) developed a secure and efficient V2G energy trading framework by integrating blockchain, contract theory, and edge computing [17]. Pedro et al. (2020) introduced a power management strategy (PMS) capable of achieving high ESS performance and power flow control in DC microgrids without degrading DC bus voltage [18]. Rajendra et al. (2023) evaluated the performance of PFC and DC-DC converter topologies under low-power, high-efficiency operating conditions using hardware-in-the-loop (HIL) testing [19]. Peter et al. (2023) proposed a hierarchical scheduling model for EV charging stations based on mixed-integer linear programming (MILP) and reinforcement learning (MDP-RL), reducing peak grid loads by 48.17% and increasing revenues by 20–28% [20]. Reference [21] proposed a fuzzy inference system (FIS)-based planning framework to optimize the utilization of second-life batteries (SLBs) in EVCS-WPE-SLB systems. Sebastián et al. (2024) developed a vehicle route optimization model under dynamic pricing, achieving a total revenue fluctuation gain of 2% through strategic charging–discharging detours [22]. Jiafeng Lin et al. (2025) developed a fuzzy inference system (FIS) based on a fuzzy Bayesian algorithm to quantitatively assess EVCMC [23,24]. This approach integrates non-ideal lithium ion battery characteristics to enhance the safety of grid systems [23,24].
However, a systematic review of 197 papers (2015–2017) revealed that only 3% addressed social and economic dimensions, with most studies focusing on technical feasibility [25]. Economically, Wang et al. (2021) simulated the decarbonization scenario of the California grid in 2030 and found that annual V2G revenues were USD 32–48 higher than those of smart charging [26]. Zhang et al. (2023) developed a profit model for Chengdu, showing that lowering the state-of-charge (SOC) threshold and increasing discharge prices could yield daily revenue per vehicle ranging from CNY 3.94 to CNY 65.54 [27]. Kenechukwu et al. (2020) integrated nonlinear battery degradation costs into a distributed real-time pricing optimization model, reducing the sum of EV charging–discharging costs and battery degradation costs from USD 251 to −USD 153 [28]. Charging–discharging prices, a core factor in V2G economics, directly influence user revenue calculations. Han HC (2024) proposed a fast-charging guide and pricing strategy considering different EV user charging preferences, effectively optimizing the uniform distribution of EV charging loads and guiding charging station pricing [29]. Durgesh Choudhary et al. (2025) developed a dynamic demand-response pricing model integrating the power grid and renewable energy generation based on Stackelberg games, providing real-time charging–discharging price signals for charging stations [30].
From a temporal perspective, most EV users have sufficient availability for V2G scheduling. Sun Yanyi (2018) identified that users driving less than 50 km daily, characterized by longer idle times and higher dispatchable capacity, are more likely to profit from V2G [31]. Zheng et al. (2023) confirmed the economic viability of V2G in home and workplace charging scenarios, where EVs possess sufficient idle time [32]. Huang et al. (2022) demonstrated through detailed analysis of Shanghai’s EV and grid characteristics that private EVs are more suitable for V2G due to extended idle periods, whereas electric buses face operational constraints during daytime hours [33].
Notably, most studies evaluating the economic benefits of V2G fail to account for battery degradation [34,35,36]. While some scholars have considered battery aging, their analyses typically focus only on cycle degradation, neglecting calendar aging. It is another critical factor in battery capacity loss [37,38,39]. Only a handful of researchers, such as Rahmat et al. (2024), optimized V2G scheduling with a MILP model incorporating detailed calendar and cycle aging degradation, demonstrating cost reduction potential [40]. However, they did not account for the additional charging costs required to maintain sufficient battery capacity for V2G participation, nor did they conduct comparative analyses under different national V2G policy frameworks or electricity pricing scenarios. Furthermore, the existing literature generally overlooks the direct impact of regional peak–valley price differentials on V2G economics. Although Zhou et al. (2020) developed a modeling framework for China to deliver economic benefits to EV owners and improve energy efficiency, their analysis of economic benefits only considered charging prices, failing to integrate discharging price mechanisms [41]. While references [5,42] identified regional peak–valley price spreads, they lacked global comparisons and failed to establish a direct link between price differentials and user profitability. The absence of dynamic adjustment mechanisms based on user driving patterns and vehicle specifications, coupled with insufficient analysis of regional price variance effects, results in policy formulations lacking empirical support. This critical gap hinders the development of targeted guidance for EV users, grid operators, and policymakers regarding V2G implementation suitability across different regions.
In response to the limitations identified in the existing literature, this study introduces multifaceted innovations and breakthroughs. A full life-cycle dynamic cost–benefit model is proposed, integrating a dual-factor dynamic framework that accounts for both cycling degradation and calendar aging of batteries. A 10-year simulation framework is established to comprehensively capture the economic variation of batteries from their initial state to end-of-life. Through comparative analyses across five representative regions—Shanghai, Chengdu, the United States, the United Kingdom, and Australia—the study illustrates the profit-loss dynamics of V2G under scenarios of low and high peak–valley electricity price differentials. This provides a quantitative tool for optimizing grid charging–discharging pricing, informing policy design, and guiding decision-making for EV owners with diverse vehicle types and driving habits, thereby advancing the large-scale adoption of vehicle–grid interaction systems.
Figure 2 illustrates the overall study structure. The research innovatively introduces the concept of critical peak–valley price differentials, calculating equilibrium thresholds for V2G profitability across different EV models and annual driving distances. These thresholds represent the minimum price differentials required to achieve break-even points for battery degradation costs. The results are expected to inform policymakers, grid operators, and EV owners with different vehicle types and annual driving distances about the potential benefits and limitations of V2G, facilitating the development of strategies to maximize its value while minimizing adverse effects on battery life. Ultimately, this study seeks to support the transition toward a more sustainable and resilient energy system by unlocking the full potential of V2G technology. Figure 2 is the overall structure, and give a summary of the whole study process.
This study aims to bridge the gap between theoretical V2G potential and its practical implementation, paving the way for a more sustainable and economically viable energy future. There are four main contributions of the research:
  • Regional Analysis: A comparative evaluation of V2G revenue potential across multiple regions, highlighting the impact of local electricity price structures on profitability.
  • Battery Degradation Modeling: Incorporation of battery cycle degradation costs and calendar aging costs into the economic assessment of V2G, providing a more realistic estimate of net benefits.
  • Sensitivity Analysis: Exploration of the sensitivity of V2G profitability to critical parameters, such as cycle cost and annual usage patterns, to identify optimal operational strategies. We incorporated V2G data from diverse global regions for analysis, and accounted for the implicit charging costs associated with V2G operations.
  • Practical Insights: Practical recommendations for stakeholders to enhance the economic viability of V2G, including policy incentives, pricing mechanisms, and battery management practices.

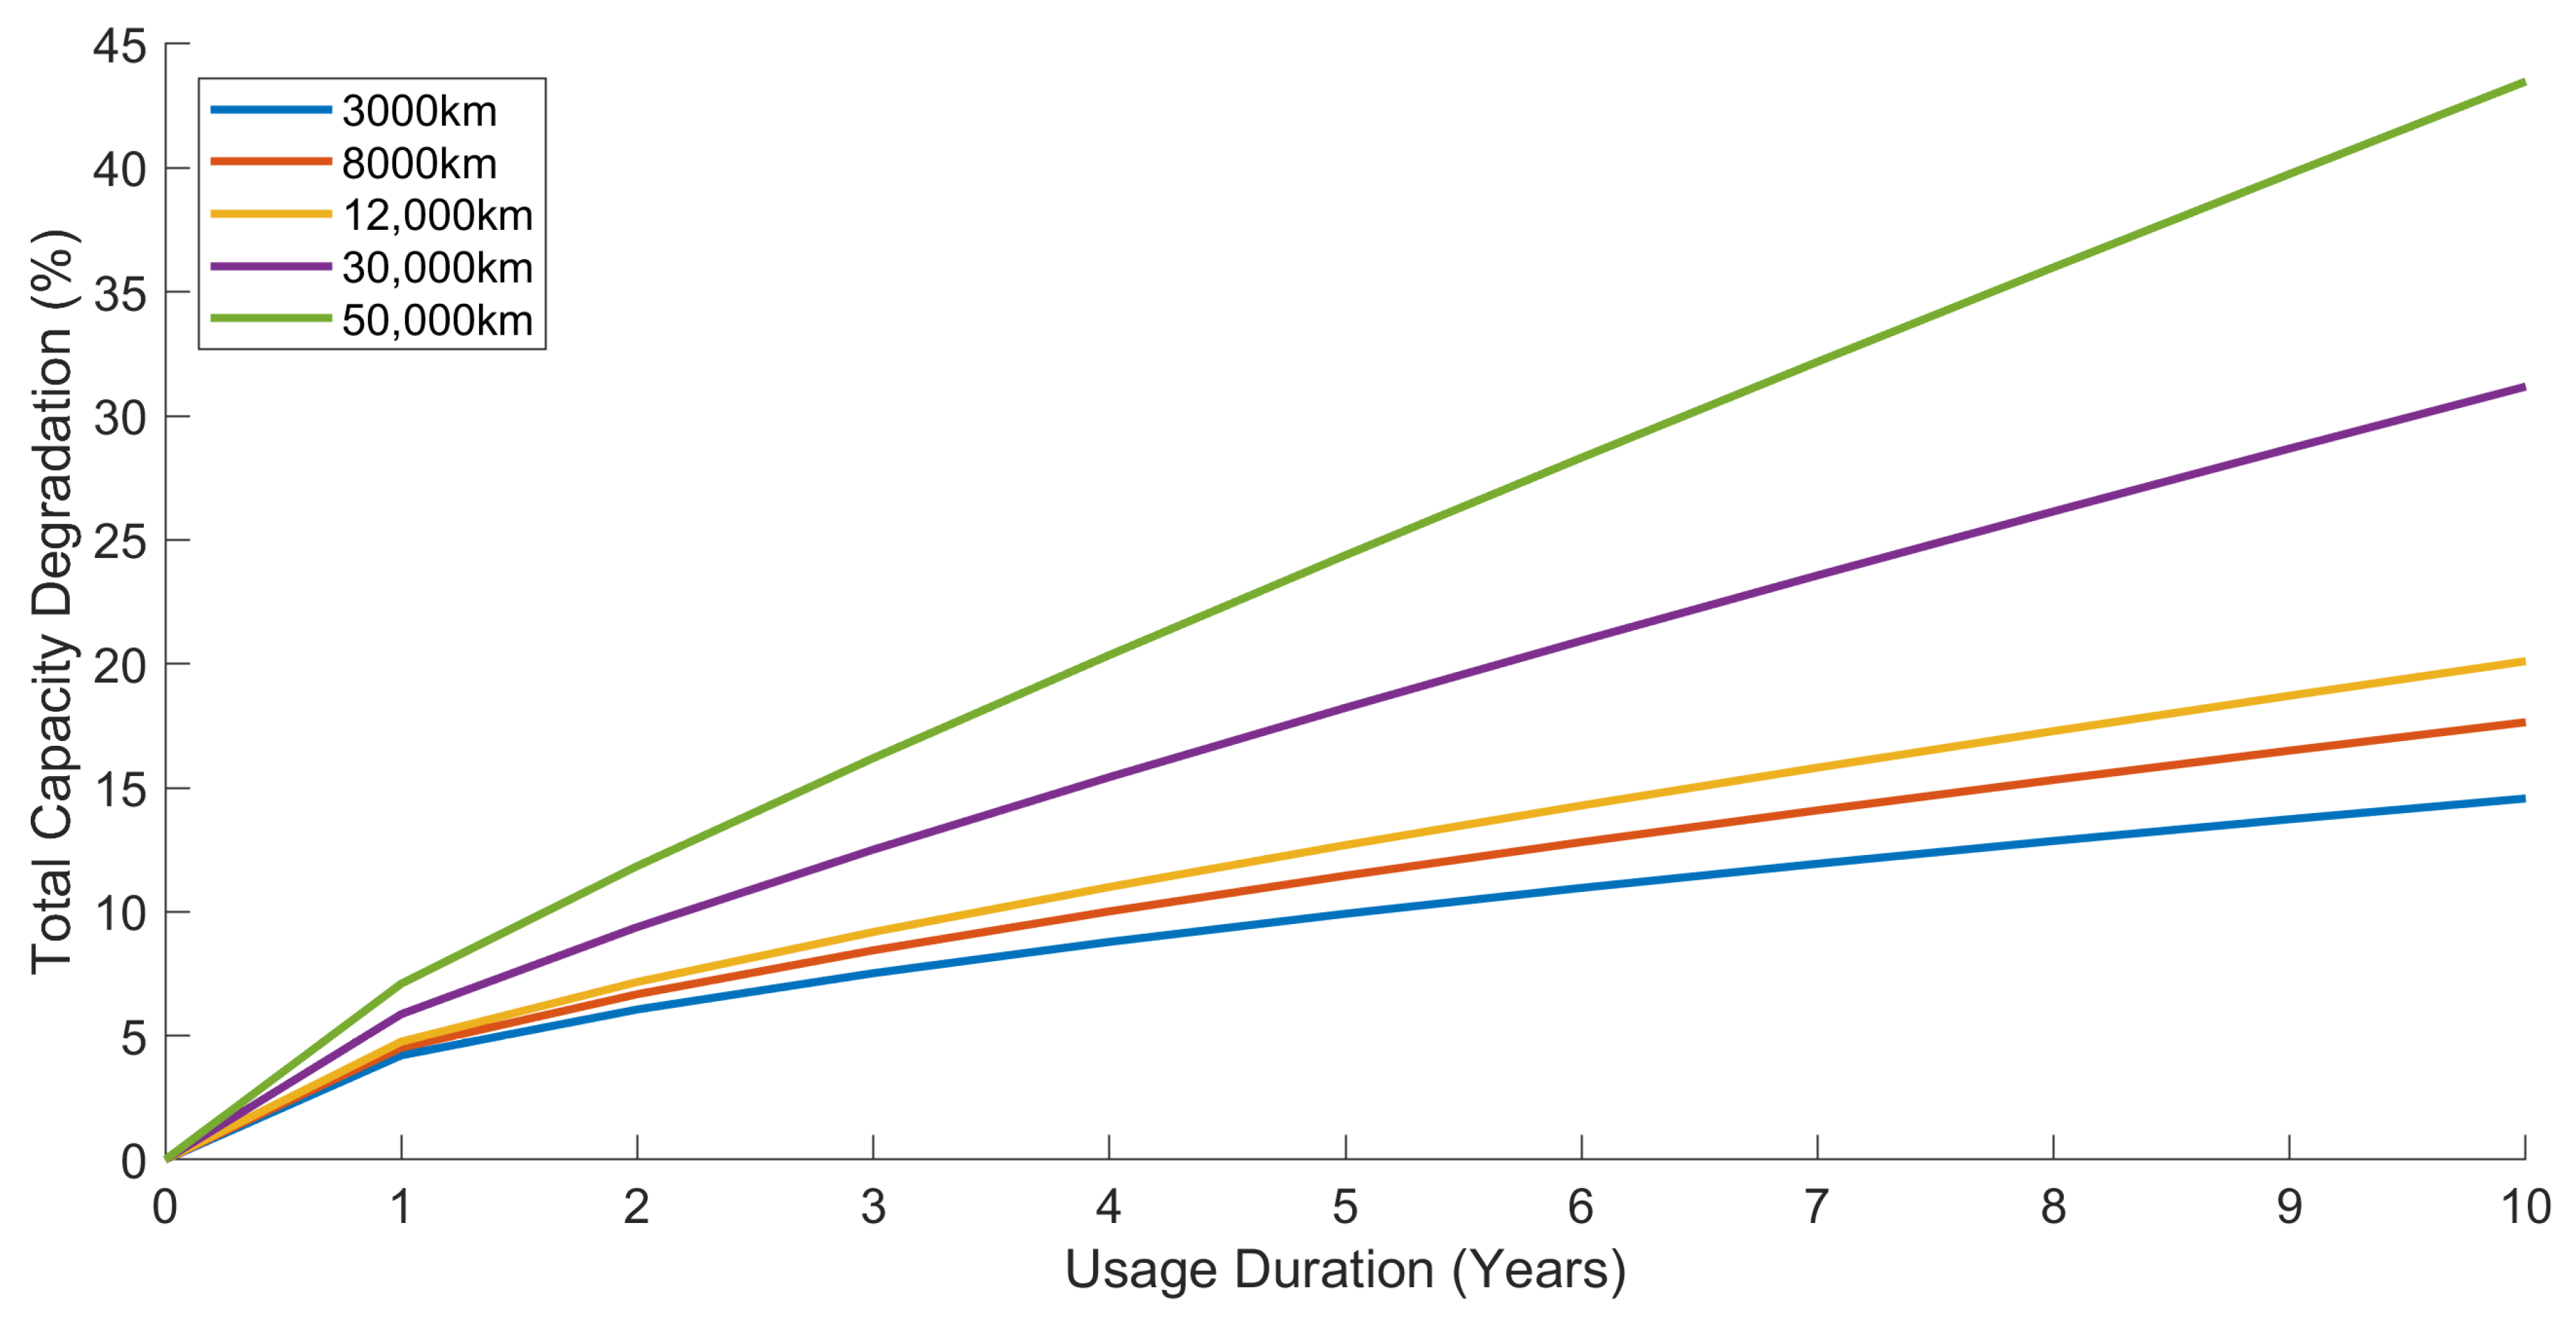
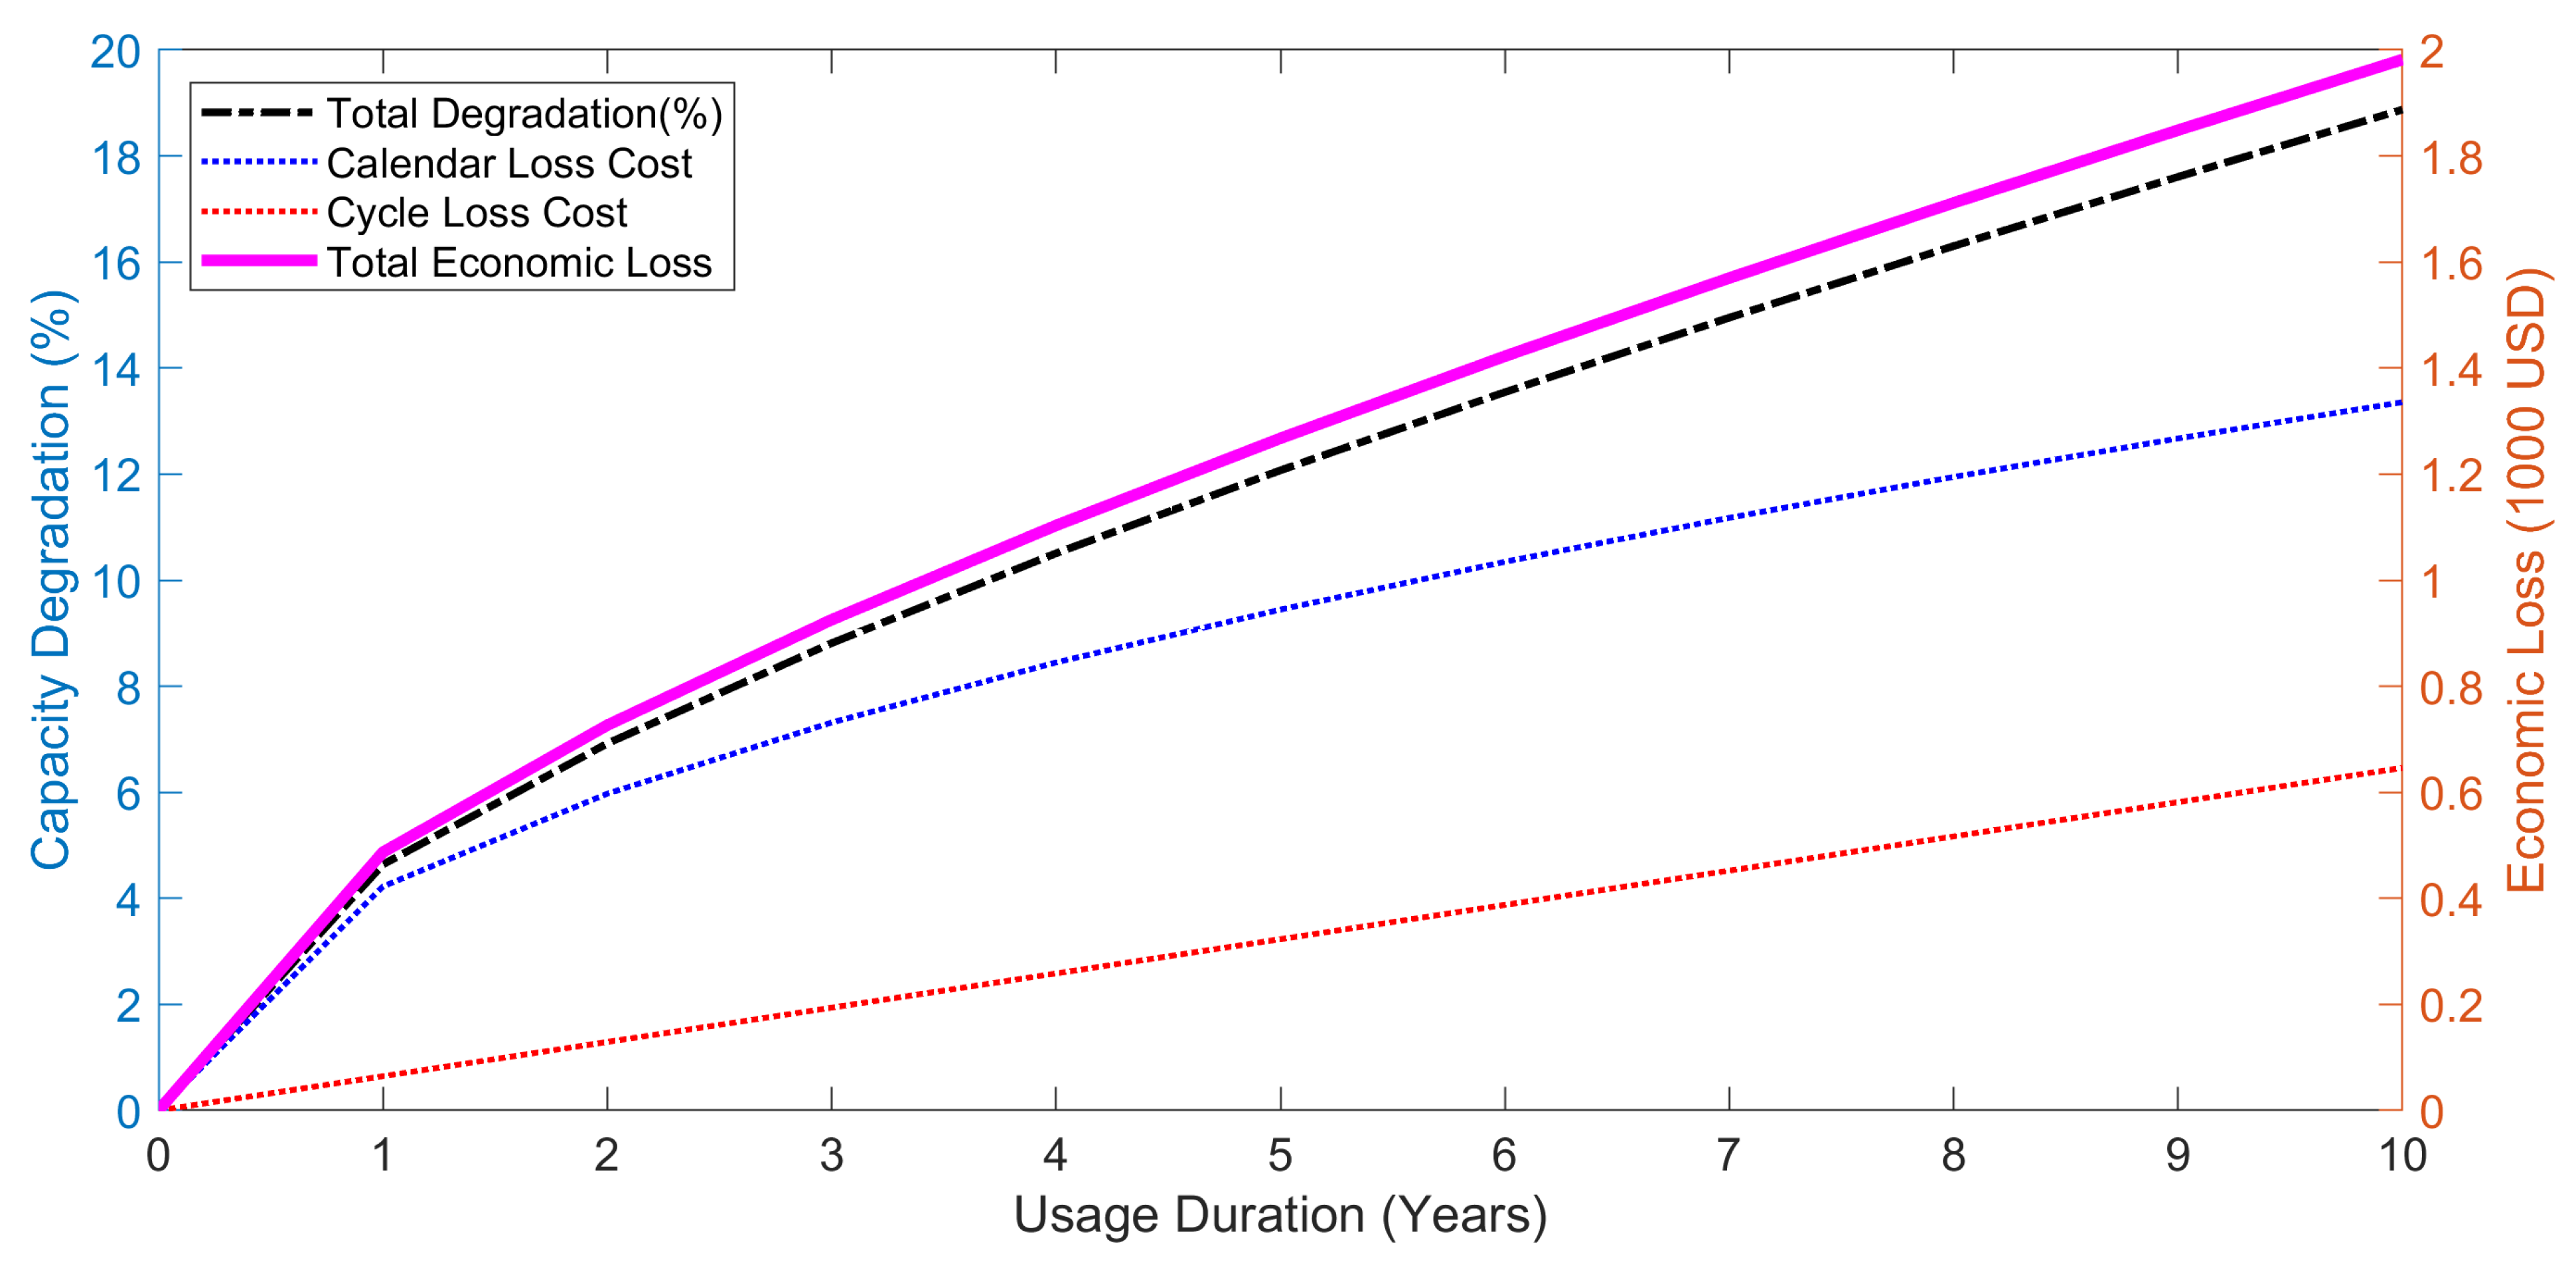
2. Battery Degradation Model

Battery degradation is a critical factor in evaluating the long-term performance and economic viability of energy storage systems, including Vehicle-to-Grid (V2G) applications. Degradation is primarily caused by two mechanisms: cycle degradation (due to charge–discharge cycles) and calendar loss (due to aging over time).
This study developed a semi-empirical lifespan model based on references [43,44] to characterize both calendar aging and cycle aging of batteries. According to Tesla’s 2023 Impact Report, Tesla Model 3 and Model Y vehicles exhibited only 15% average capacity degradation after 14 years or 322,000 km of driving [45]. Building upon Tesla’s latest battery data, this paper recalculated and refitted the original model equations. Below is a detailed explanation of the formulas used to quantify these degradation mechanisms.

2.1. Cycle Degradation Calculation

Cycle degradation refers to the degradation of battery capacity caused by repeated charge–discharge cycles. Formula (1) is based on the Arrhenius equation; it is influenced by factors such as temperature and the number of cycles. The cycle degradation can be modeled using the following formula:
D C y c l e L o s s = a T 2 + b T + c e d T + e I r a t e A h t h r o u g h
where the parameters a, b, c, d, and e are determined through curve fitting. T is the absolute temperature (in Kelvin), I r a t e is the current C-rate, and A h t h r o u g h represents the amount of charge delivered by the battery during cycling (in Ah).

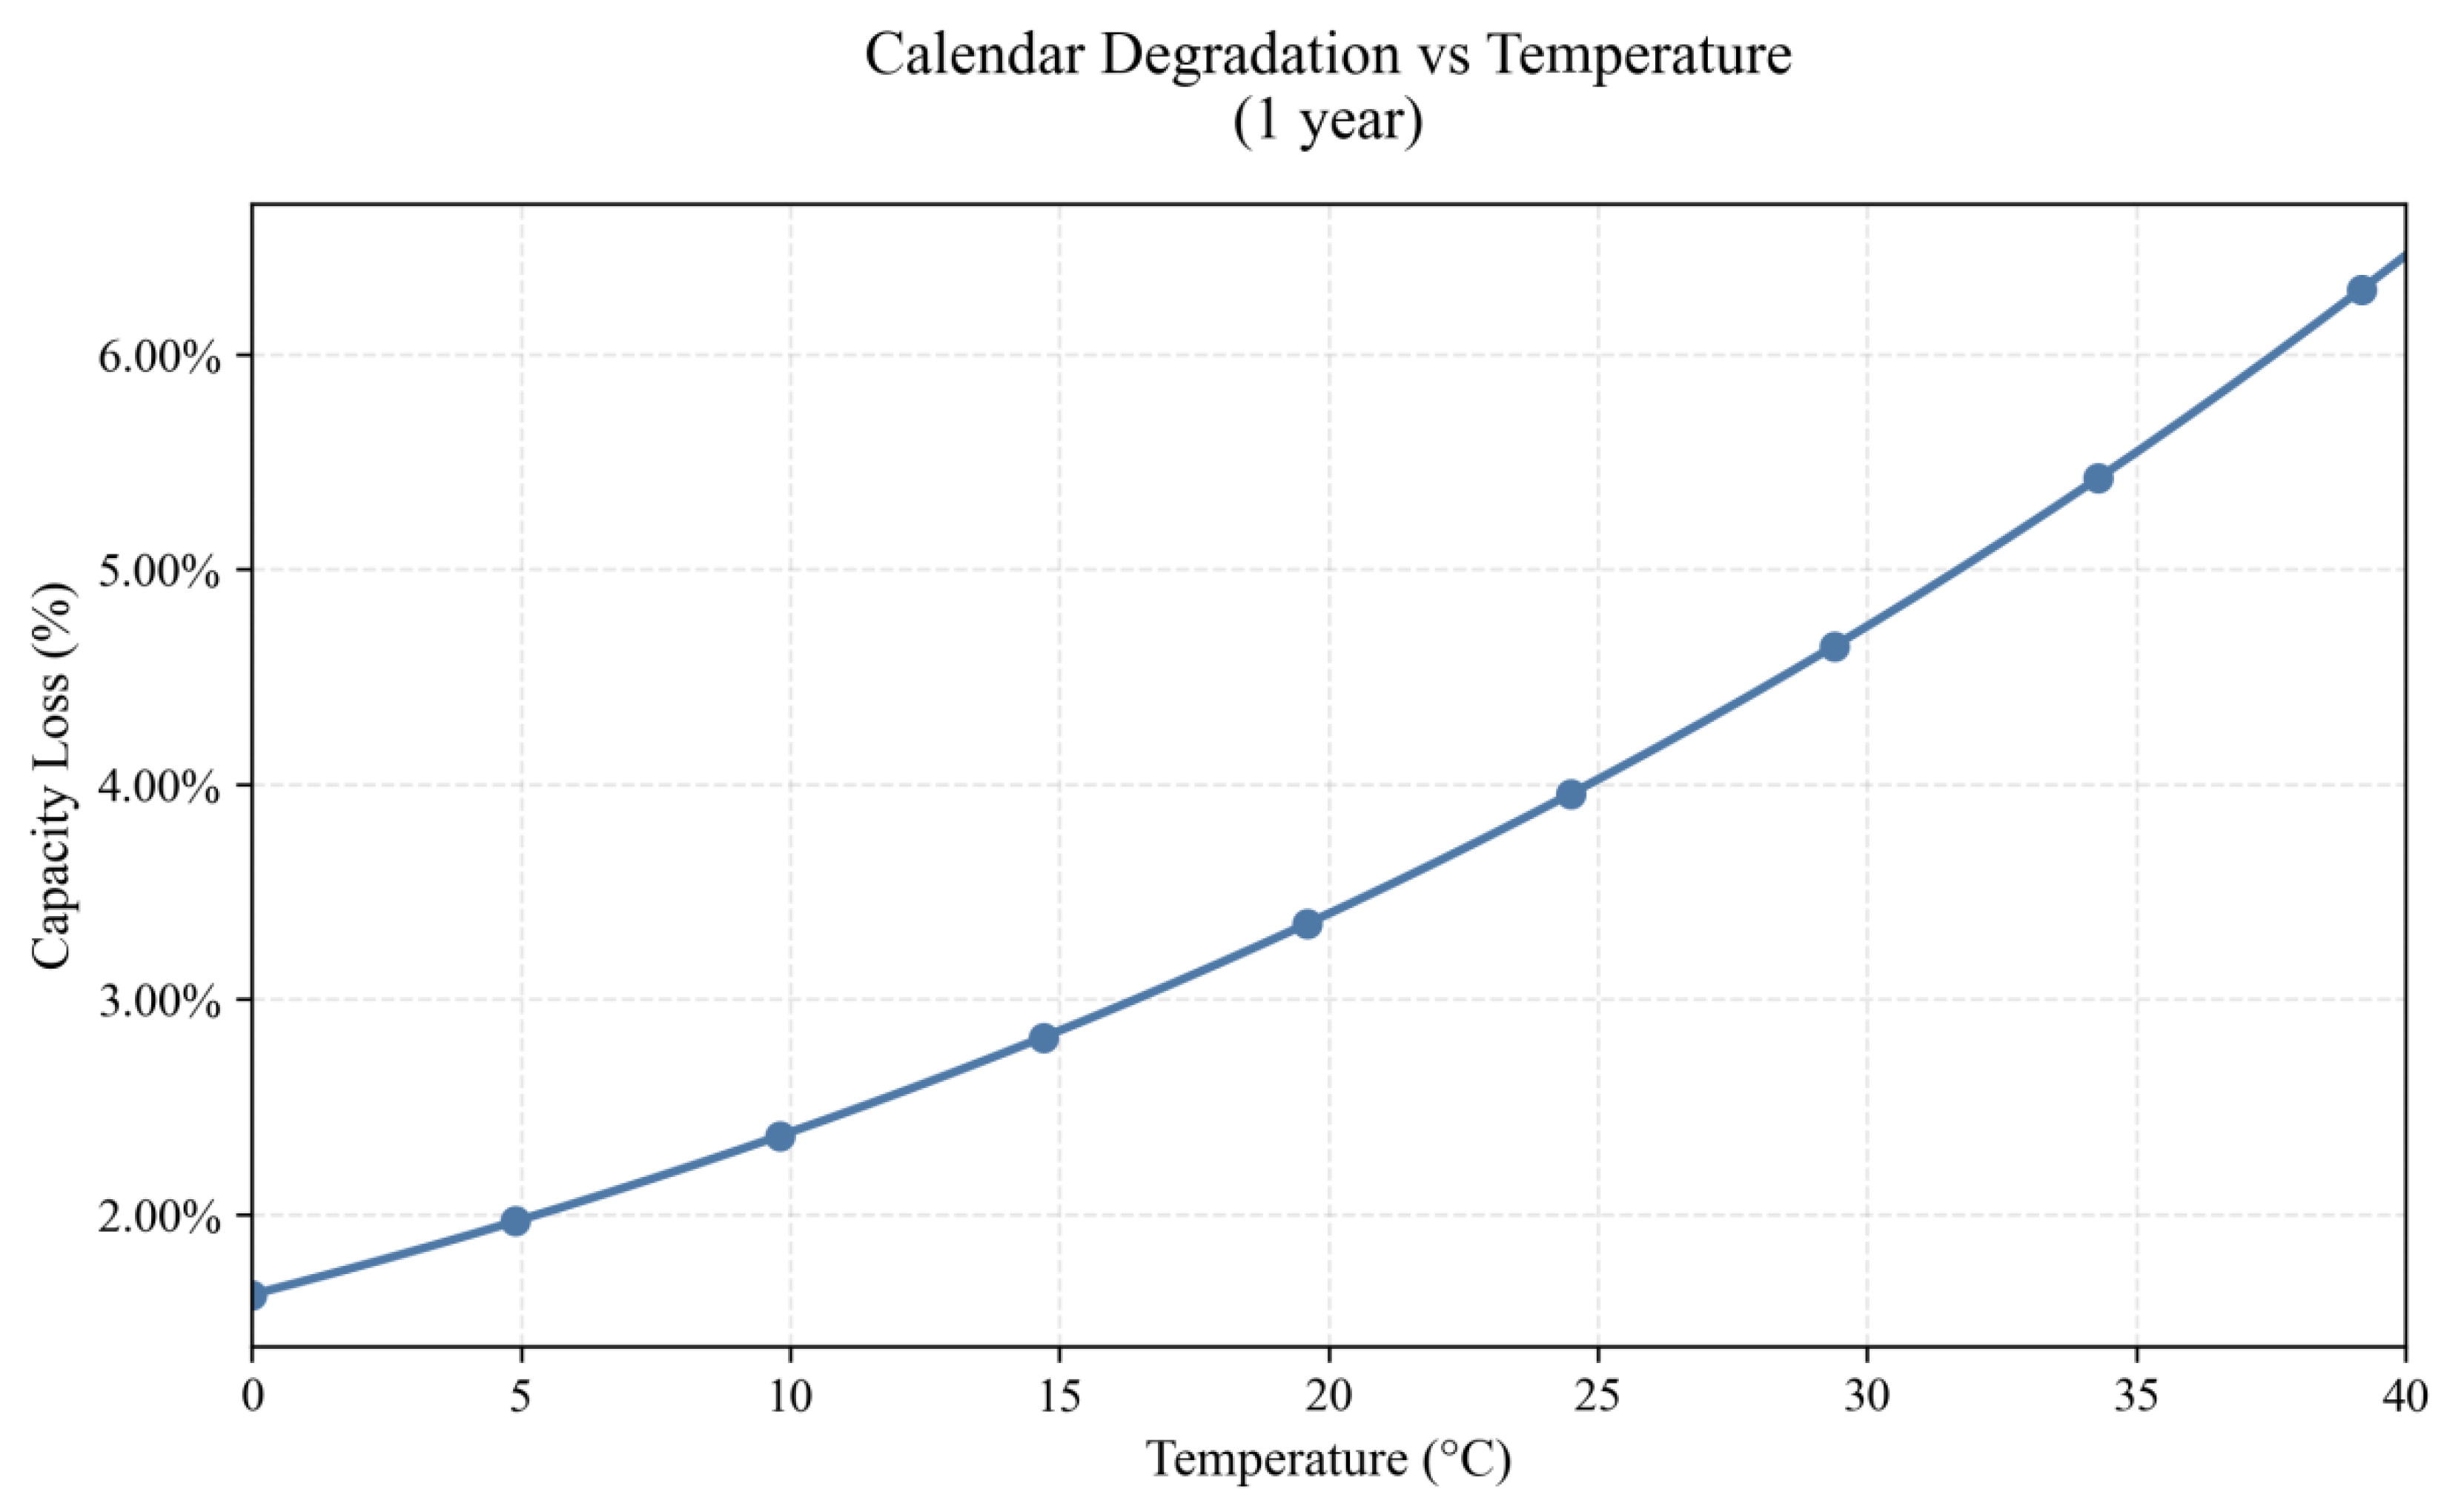
2.2. Calendar Loss Calculation
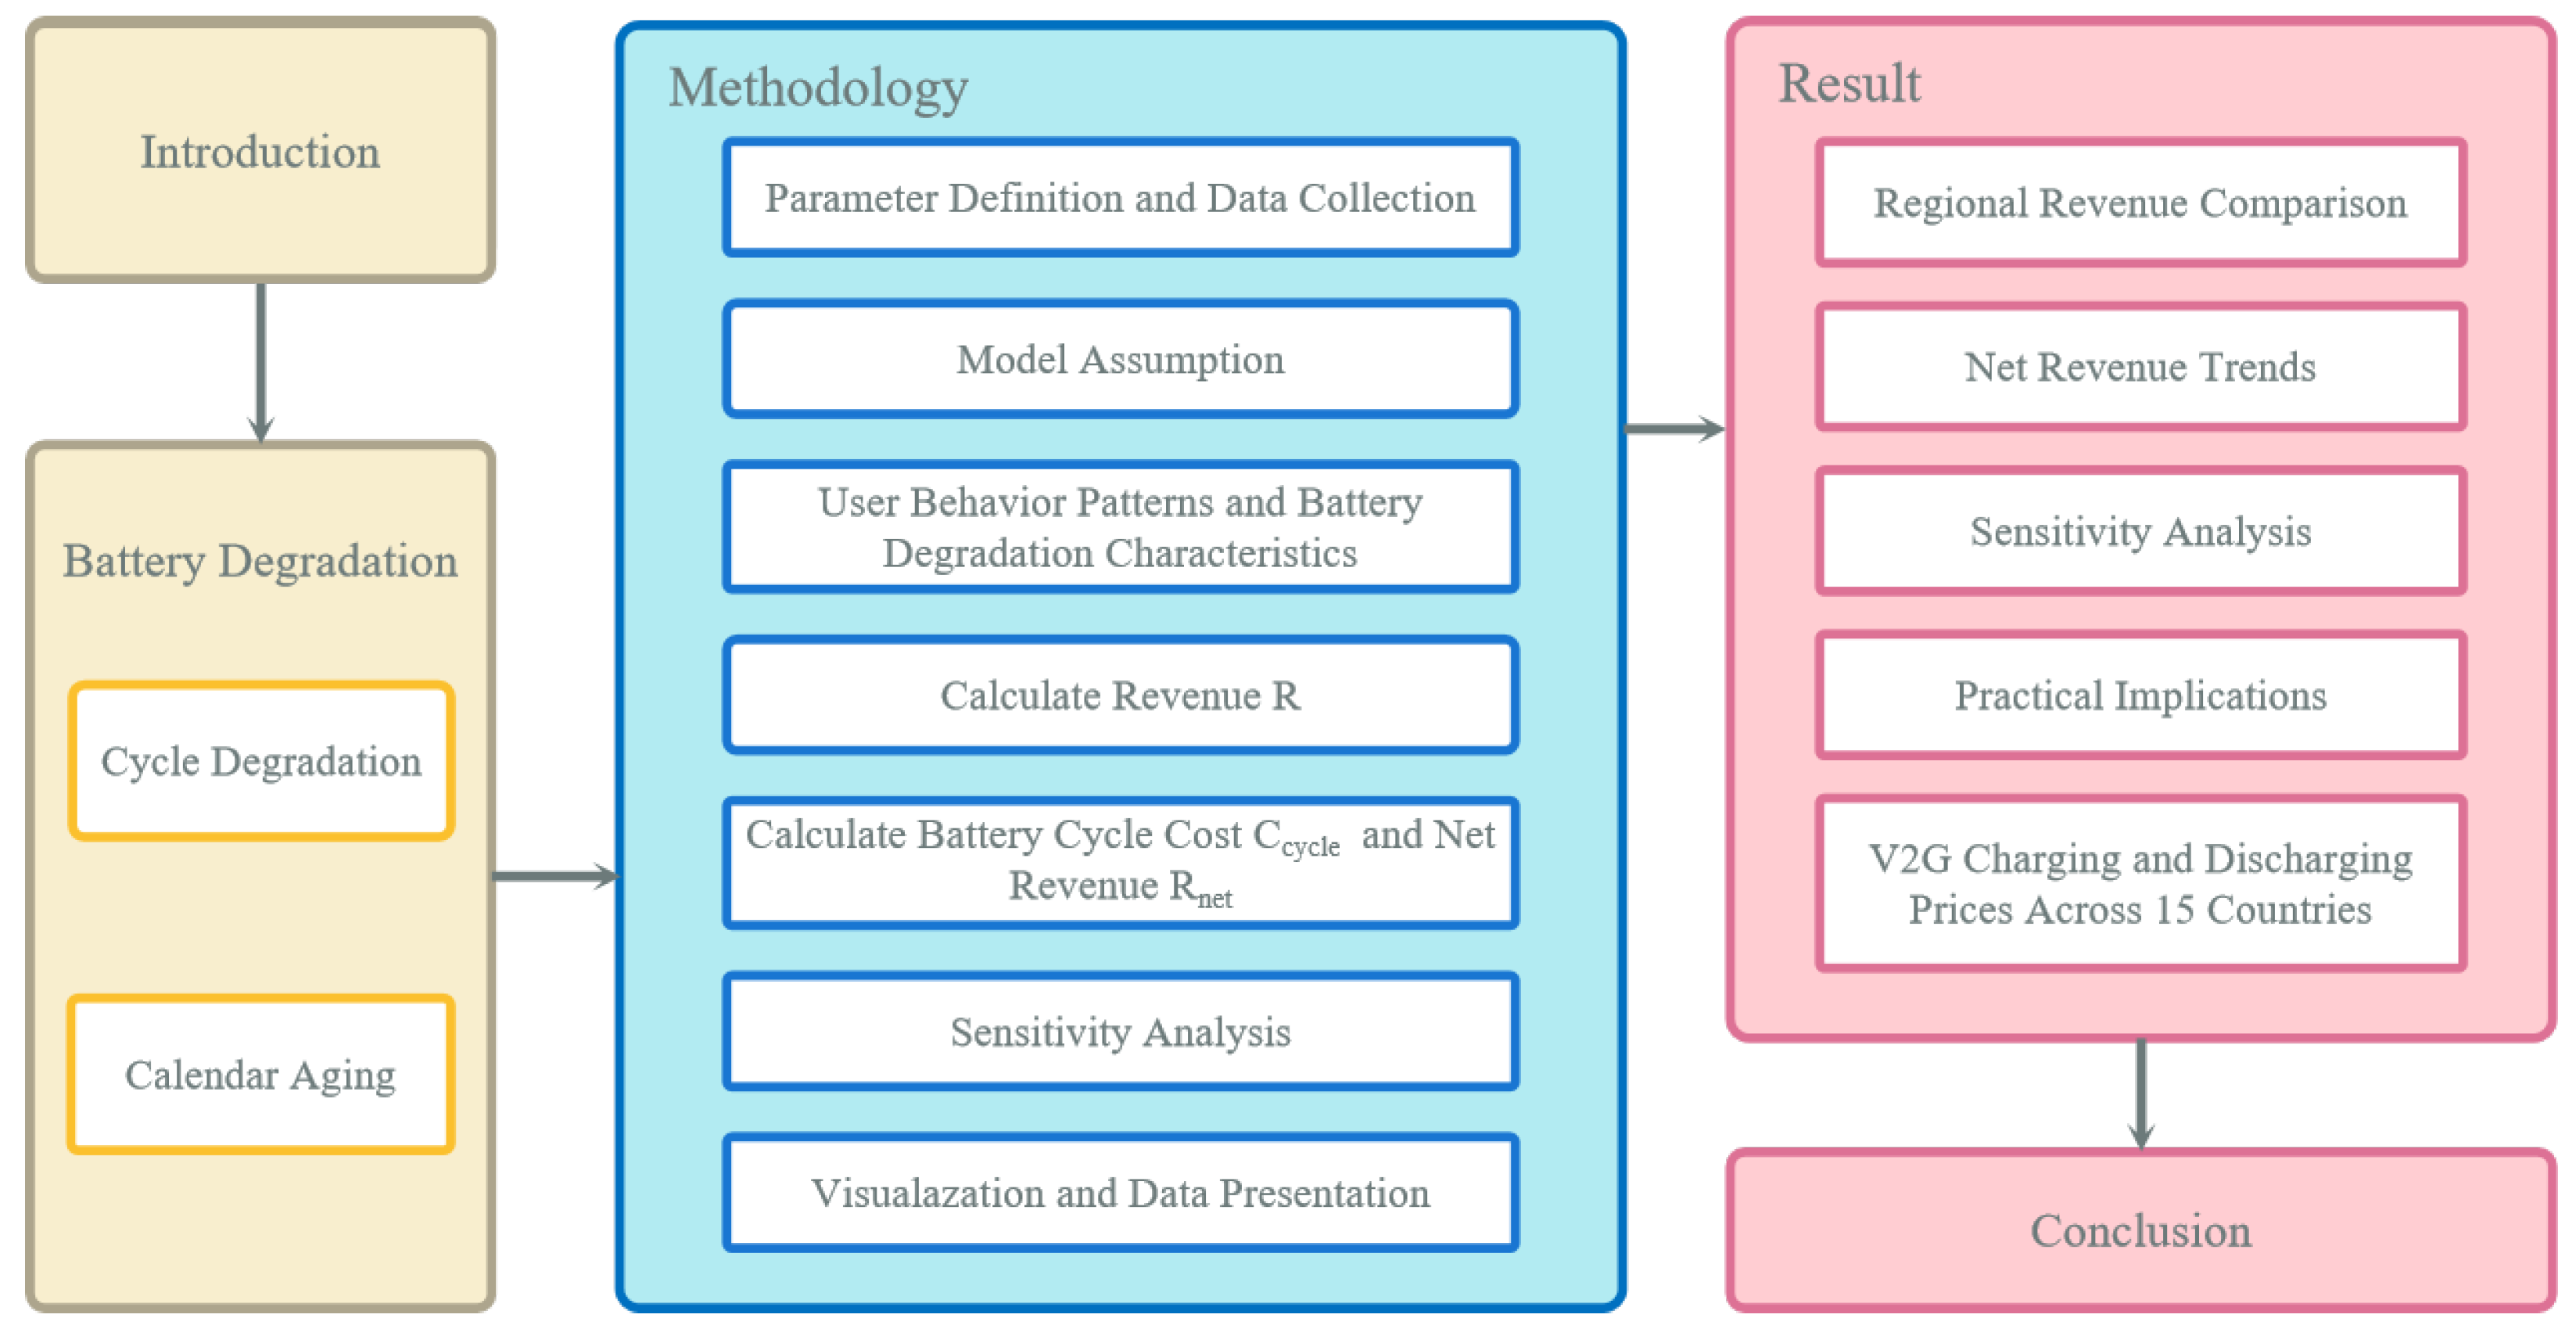
Calendar loss refers to the gradual degradation of battery capacity over time, even when the battery is not in use. It is primarily influenced by temperature and the state of charge (SoC). The calendar loss can be modeled using the following formula:
D C a l e n d a r L o s s = f t 0.5 e E a / R T
Here, parameter f quantifies the capacity fade rate induced by long-term calendar aging, where t is the days, Ea = 24.5 kJ/mol is the activation energy, and R = 8.314 J/mol·K is the gas constant. Detailed parameter values and units are listed in Table 1.
Using the Tesla Model Y as a representative case, Figure 3 demonstrates battery longevity impacts under different annual mileage scenarios over 10 years. Figure 4 illustrates the percentage of battery degradation and associated degradation costs over the years.
When the electric vehicle battery temperature is maintained at 25 °C (289.15 K) and subjected to 200 cycles, Figure 5 illustrates the impact of varying charge/discharge rates (C-rates) on cycle degradation. The results demonstrate that higher C-rates accelerate battery capacity degradation.
When evaluating a one-year usage period, Figure 6 demonstrates the effect of temperature variations on calendar aging. The results clearly show that calendar aging accelerates with increasing temperature.

3. Methodology

This study employs a comprehensive framework to evaluate the economic performance of Vehicle-to-Grid (V2G) technology, focusing on revenue generation from energy arbitrage and the associated costs of battery degradation. The methodology is divided into seven main components: (1) parameter definition and data collection, (2) model assumption, (3) user behavior patterns and battery degradation characteristics, (4) revenue calculation, (5) battery degradation cost estimation, (6) sensitivity analysis, and (7) visualization and data presentation. Each component is described in detail below.

3.1. Parameter Definition and Data Collection

The study begins by defining key parameters and collecting relevant data to model V2G operations. The parameters include:
  • Battery Capacity: The total energy storage capacity of the EV battery (in kWh).
  • Annual Cycles: The number of full charge–discharge cycles per year, representing the intensity of V2G usage.
  • Electricity Prices: Regional electricity prices for charging and discharging, sourced from historical or projected data.
  • Cycle Cost: The cost of battery degradation per cycle, reflecting the wear and tear associated with V2G operations.
Regional electricity price data was collected for five representative regions: Chengdu, Shanghai, Australia, the USA, and the UK. These regions were selected to capture diverse electricity market structures and price dynamics. The dynamic electricity prices for charging and discharging in five representative scenarios are shown in Figure 7. These data were sourced from references [46,47,48,49,50].
As illustrated in the figure, Australia exhibits the highest discharge price, followed by Chengdu, the UK, the US, and Shanghai (with the lowest). Similarly, Australia also ranks highest in charging prices, followed by the UK, Shanghai, Chengdu, and the US. Chengdu demonstrates the largest peak–valley price differential due to its combination of high discharge prices and low charging prices, with Australia ranking second, followed by the UK and the US. Shanghai shows the narrowest peak–valley price differential across all regions analyzed.
Regarding battery capacity and cycle cost per cycle, we have compiled data from seven representative EV models as reference cases: BYD Han, BYD Seal, Hyundai Ioniq 5, Tesla Model Y, Tesla Model 3, Ford Mach-E, and Honda Prologue. These seven models cover mainstream battery technologies (such as NMC, LFP, etc.) and cater to a wide range of consumer groups. They rank among the top 10 best-selling models globally, occupying a significant market share.

3.2. Model Assumptions

This study was conducted under the following premises and assumptions:
  • Battery parameters: Using Tesla Model Y as a representative case, its battery capacity (kWh) and energy consumption per 100 km are adopted as baseline EV parameters.
  • Dispatch strategies: The calculation of V2G economic benefits is based on time-of-use (TOU) electricity pricing in the peak and valley regions.
  • User availability: EV users are assumed to have sufficient idle time for V2G participation. Existing research indicates that over 71% of EV users travel less than 15 km daily [51], demonstrating adequate vehicle downtime for grid scheduling.

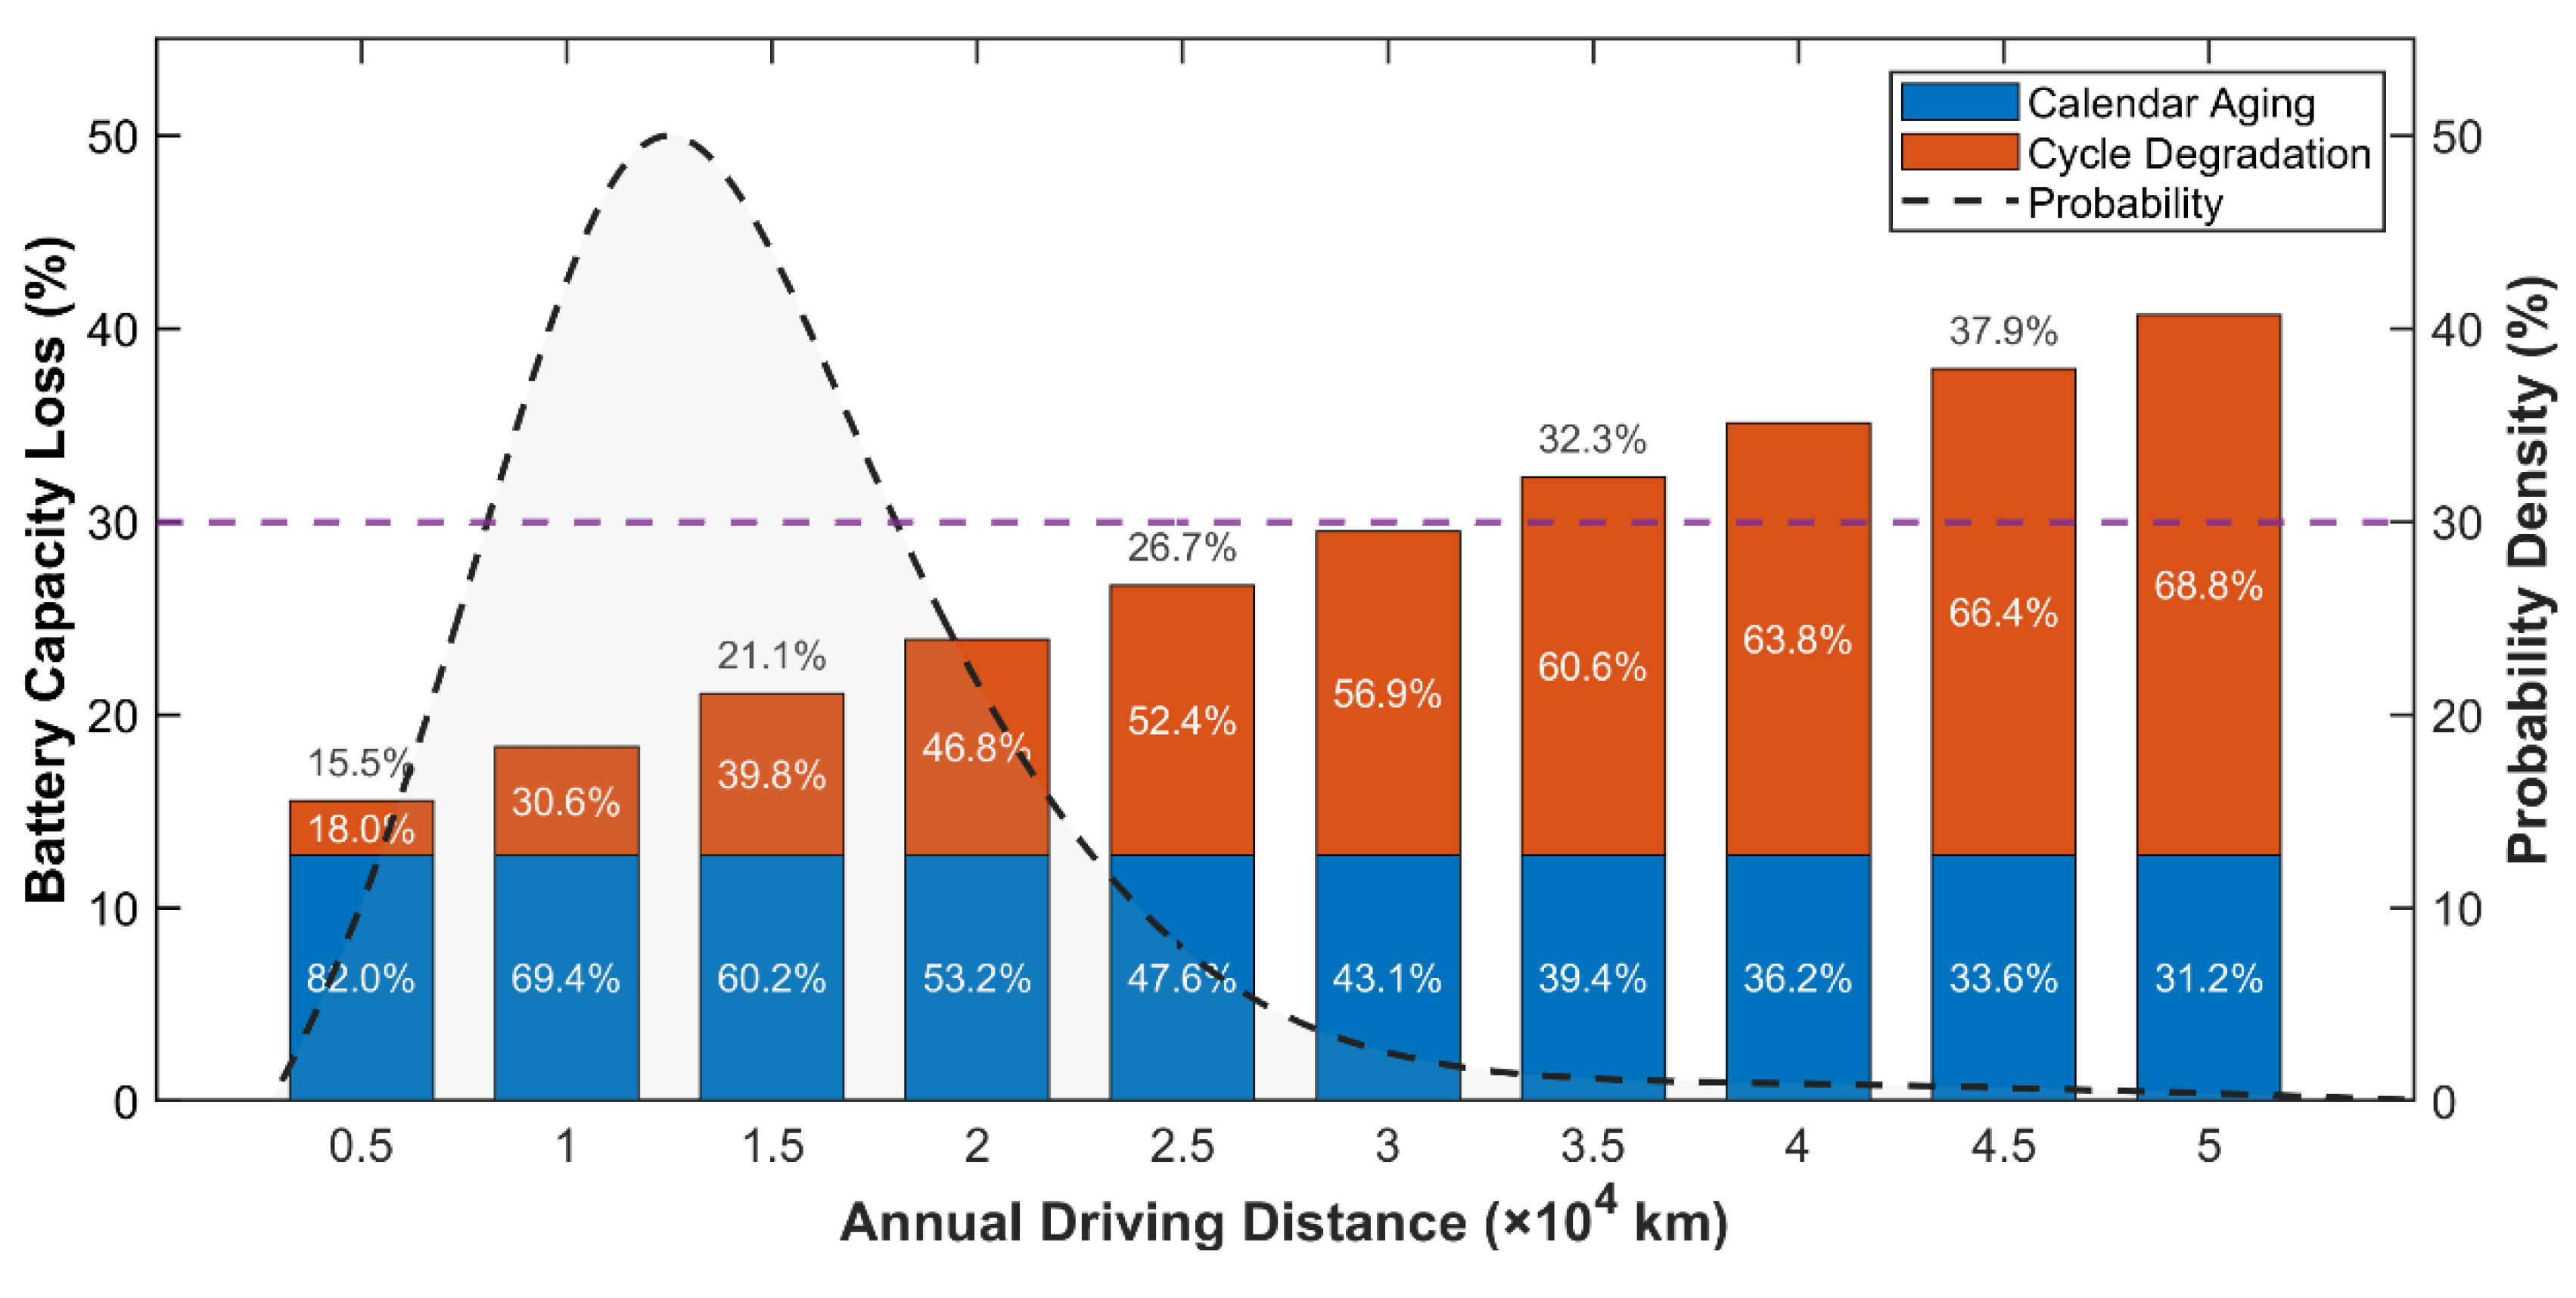
3.3. User Behavior Patterns and Battery Degradation Characteristics

To investigate the actual utilization efficiency of EV batteries from user, we take Tesla Model Y as a representative case, integrating battery degradation modeling with driving mileage data analysis. As depicted in Figure 8, under the 10,000 km annual mileage scenario, calendar aging costs constitute 67.2% of total battery degradation cost, significantly outweighing cycle degradation costs (32.6%). This cost distribution pattern reveals that temporal deterioration mechanisms dominate battery economic losses, indicating the battery is not being fully utilized. Furthermore, analysis with Figure 9 similarly confirms that calendar aging dominates under low-mileage conditions.
Figure 10 analyzes battery degradation patterns based on mileage distribution, revealing that the annual mileage of most EV users remains below 30,000 km. As is known, when the battery’s State of Health (SOH) degrades to 70%, the vehicle becomes unsuitable for continued operation. However, users with annual mileage under 30,000 km exhibit less than 30% capacity degradation after a decade of usage, demonstrating significant underutilization of battery resources. Therefore, for EV users with annual driving distances below 30,000 km, participation in Vehicle-to-Grid (V2G) technology is strongly recommended. By leveraging idle time and peak–valley electricity price differentials for strategic cyclic charging–discharging, users can generate additional revenue streams while substantially improving battery utilization efficiency.

3.4. Revenue Calculation

The revenue from V2G operations is calculated based on the price difference between charging and discharging electricity. The revenue for each region is computed using the following formula:
R = P d i s c h a r g e P c h a r g e N m a x N c y c l e C b a t t e r y y e a r s
Here, P d i s c h a r g e denotes peak discharge electricity price, P c h a r g e represents valley charging price, C b a t t e r y indicates battery capacity, N m a x signifies annual maximum cycle count, N c y c l e corresponds to daily driving-induced cycle consumption, and y e a r s represents operational duration.
This calculation was performed for a time horizon of 0 to 10 years to analyze the cumulative revenue potential over the long term. As previously established, over 82% of EV users exhibit annual mileage below 30,000 km, resulting in suboptimal battery utilization. To address this underutilization, we formulate the following operational strategy:
Assuming users implement 70 annual charge–discharge cycles (equivalent to a 35,000 km mileage scenario), while prioritizing cycles for essential mobility needs, all residual cycle capacity ( N m a x N c y c l e ) should be allocated to V2G participation. This strategic cycle redistribution enables concurrent optimization of user profitability through peak–valley arbitrage.

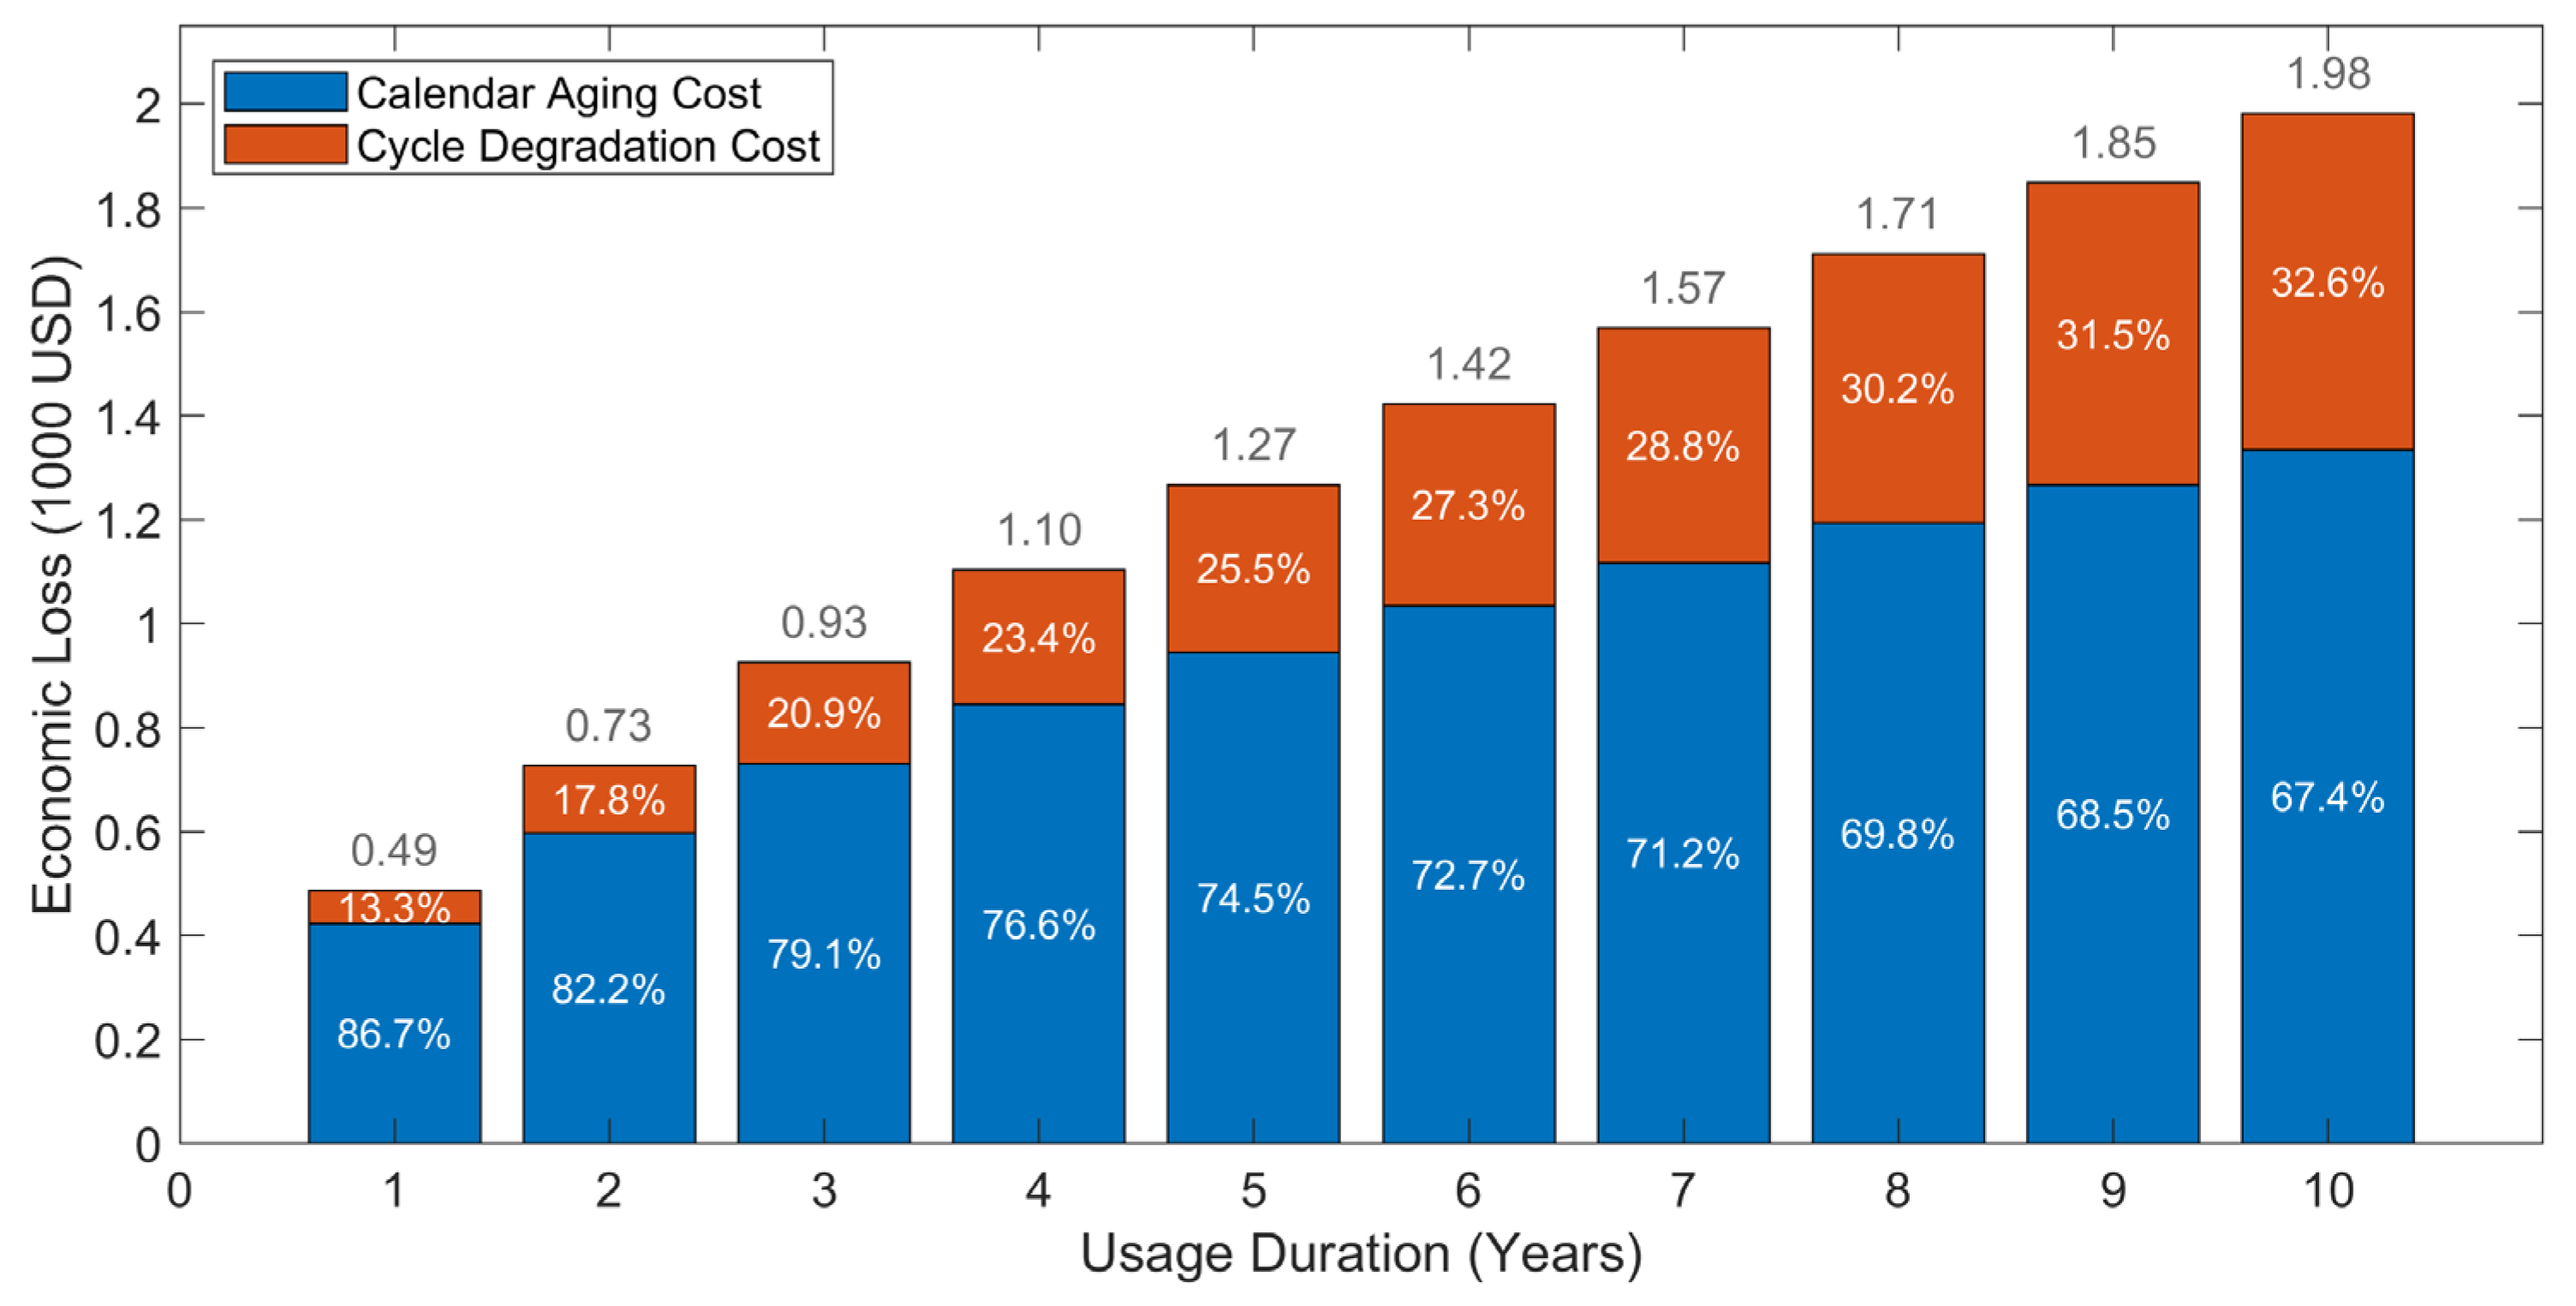
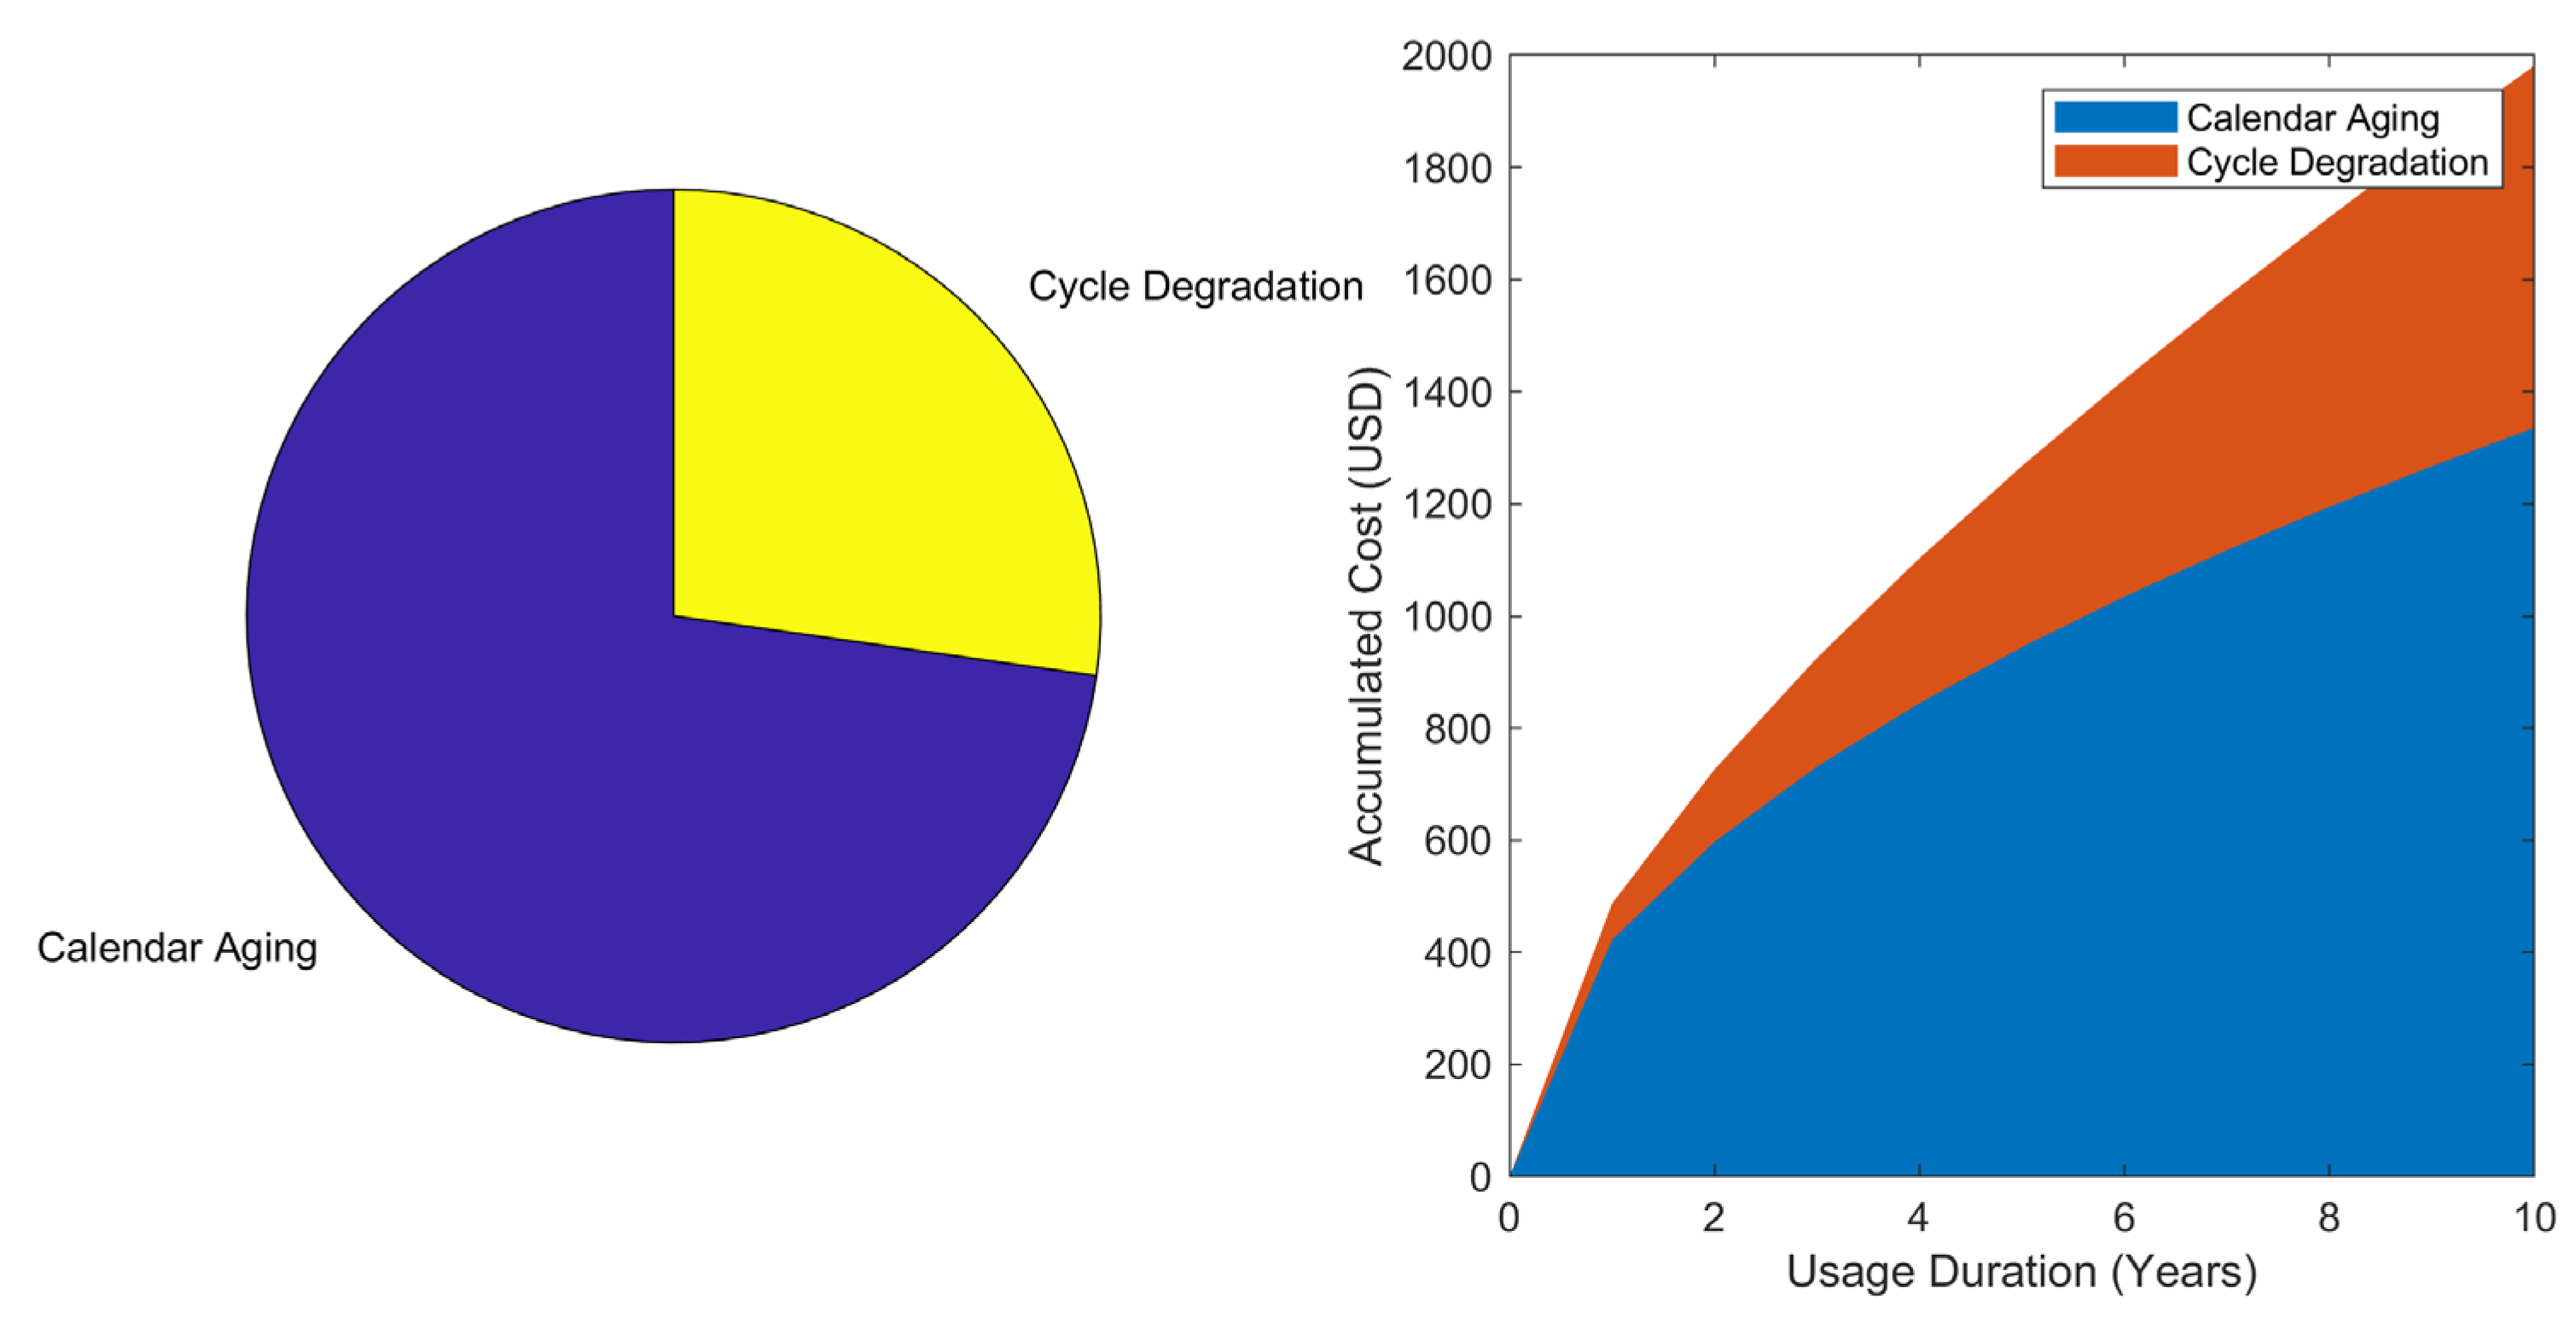
3.5. Battery Degradation Cost Estimation

To account for the impact of V2G operations on battery life, this study incorporates battery degradation costs. The cycle degradation cost is estimated based on the number of cycles and the cost per cycle, while the calendar aging degradation cost is derived from a calendar aging degradation model. The total degradation cost over a given period is calculated by integrating both degradation mechanisms:
C c y c l e = C p e r N m a x y e a r s C c a l e n d a r = f 365 y e a r s e E a / R T
where C p e r is the cycle cost per cycle.
The net revenue from V2G is then derived by subtracting the total degradation cost from the gross revenue:
R n e t = R C c y c l e C c a l e n d a r
This approach provides a more realistic assessment of V2G profitability by considering the trade-off between revenue generation and battery degradation.
To evaluate the robustness of the results and identify critical factors influencing V2G profitability, a sensitivity analysis is conducted. The analysis examines the impact of variations in key parameters, including the following:
  • Cycle Cost: The cost of battery degradation per cycle is varied within a defined range to assess its influence on net revenue.
  • Annual Driving Distance: The number of charge–discharge cycles per year is adjusted to reflect different driving distance.
  • Regional Price Differences: The price differentials between charging and discharging are analyzed to determine their effect on revenue potential.
The sensitivity analysis was performed using a range of scenarios, and the results were visualized to highlight the most significant drivers of V2G profitability.

3.6. Visualization and Data Presentation

The results of the analysis are presented using a combination of line graphs, bar charts, and pie charts to facilitate interpretation. Key findings, such as regional revenue comparisons, net revenue trends, and sensitivity analysis results, are visualized to provide actionable insights for stakeholders.

4. Results

The results of this study provide valuable insights into the economic performance of Vehicle-to-Grid (V2G) technology across different regions, considering both revenue generation from energy arbitrage and the costs associated with battery degradation. The analysis is divided into three main sections: (1) regional revenue comparison, (2) net revenue trends, and (3) sensitivity analysis. Each section is discussed in detail below.

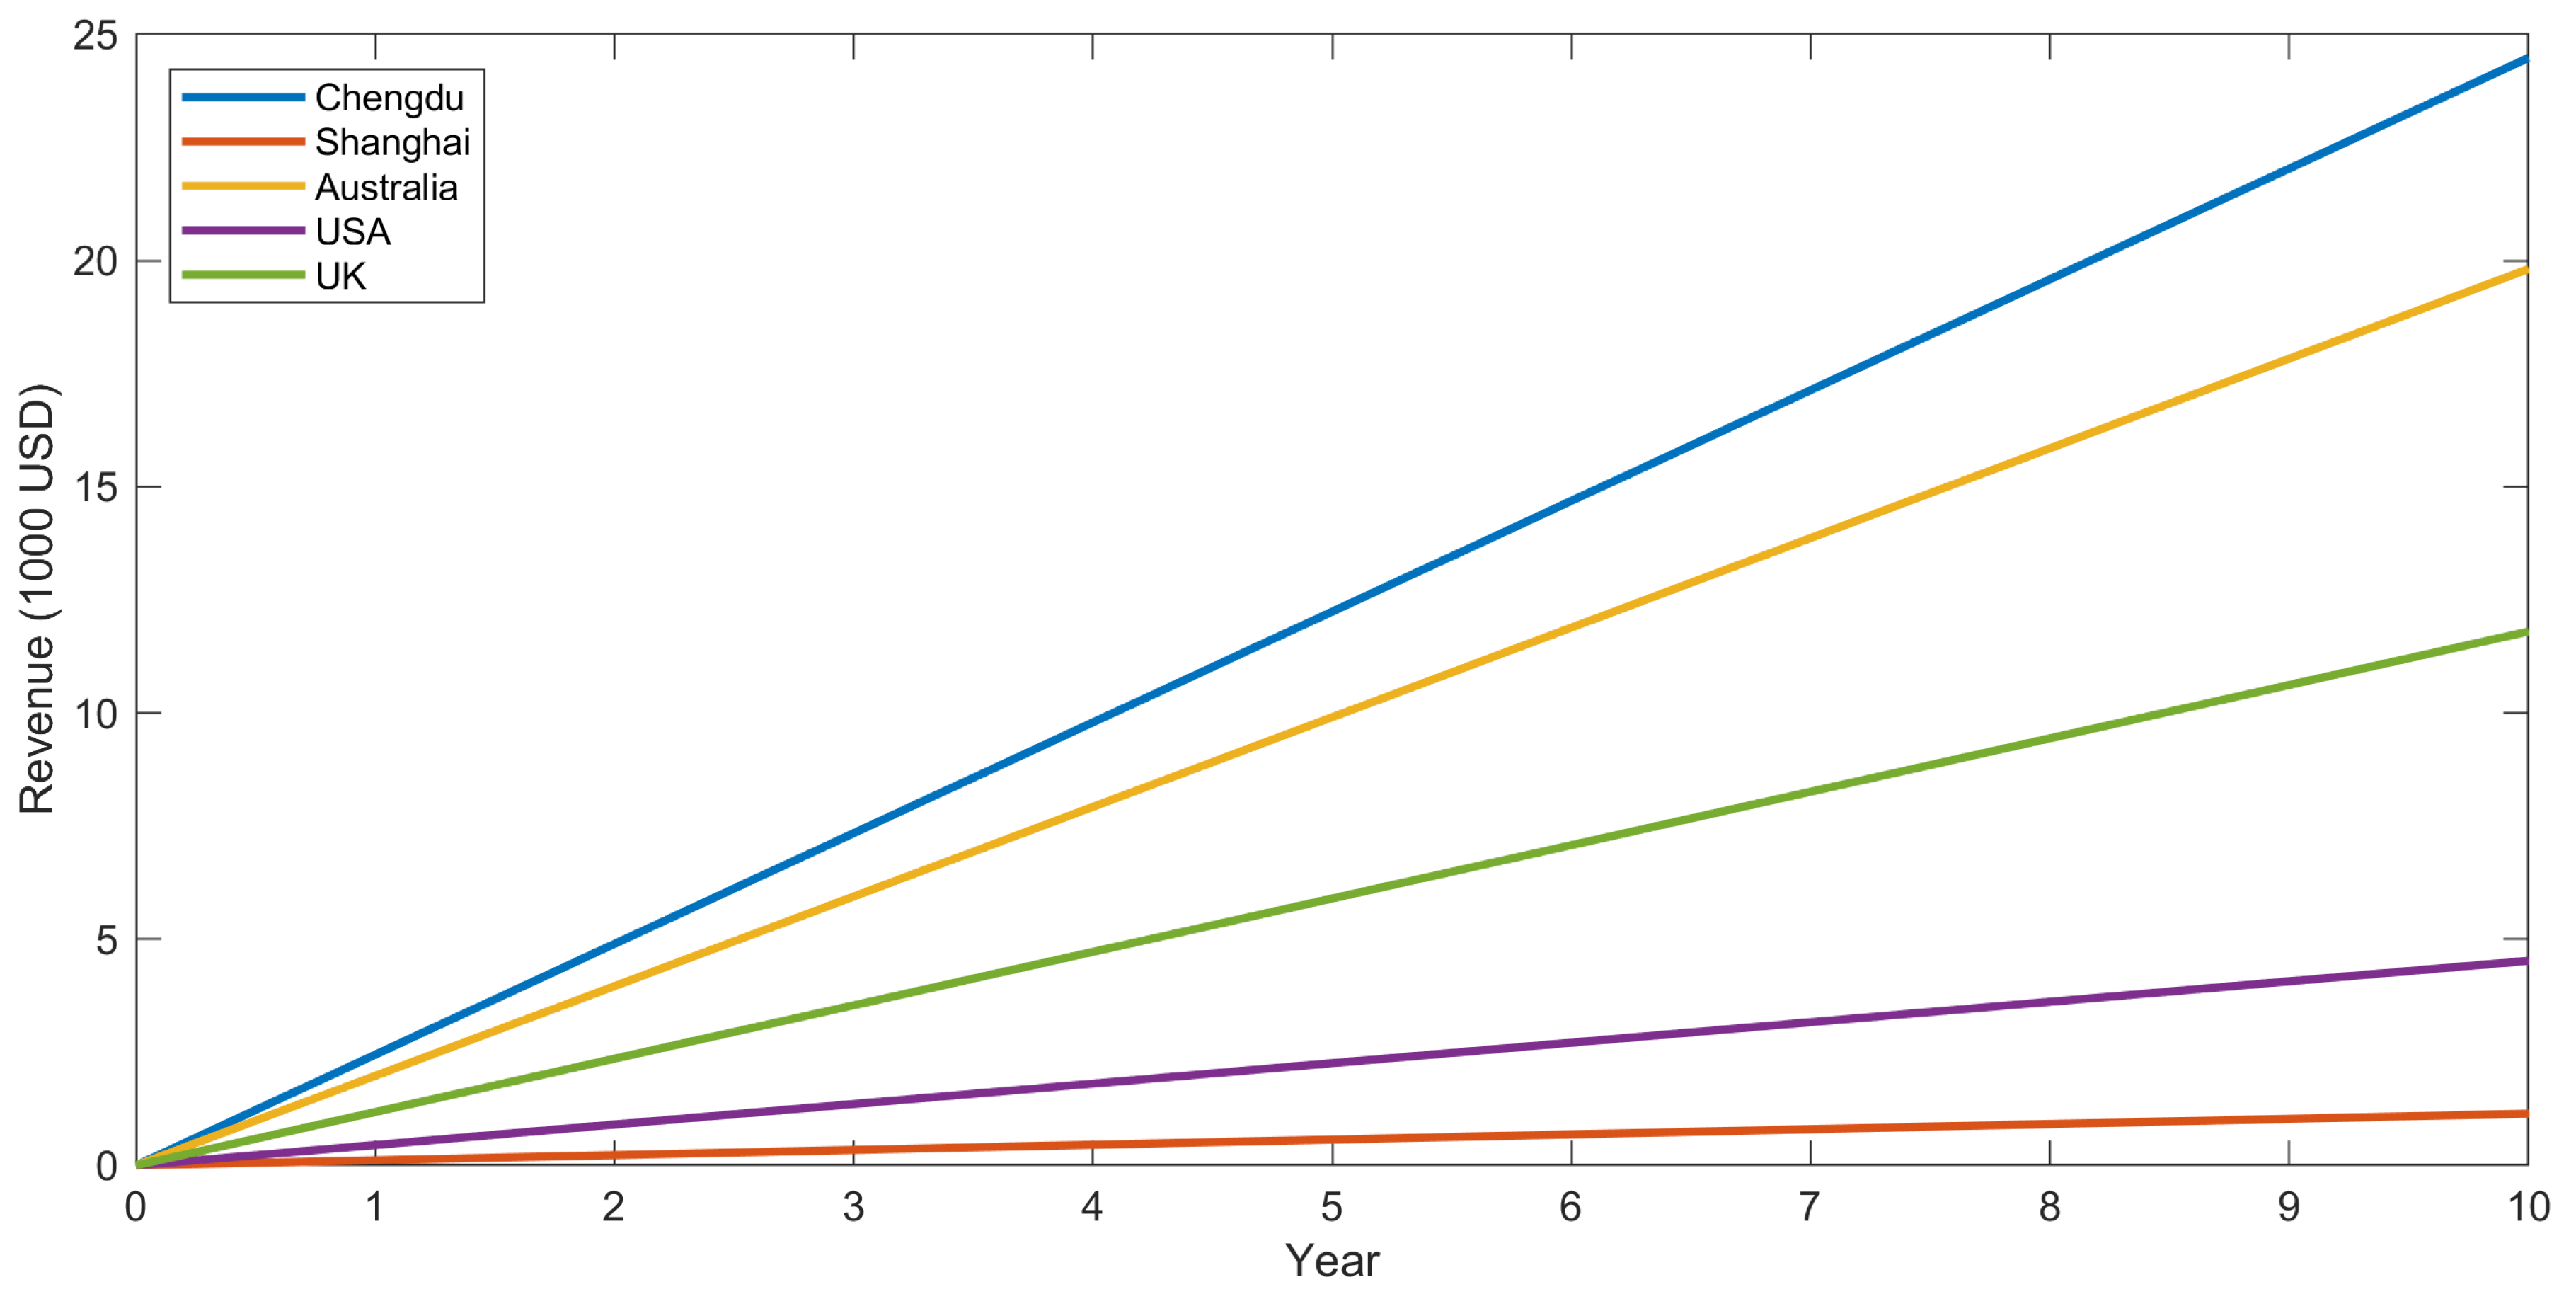
4.1. Regional Revenue Comparison

The revenue potential of V2G varies significantly across regions due to differences in electricity price structures. Key findings include the following:
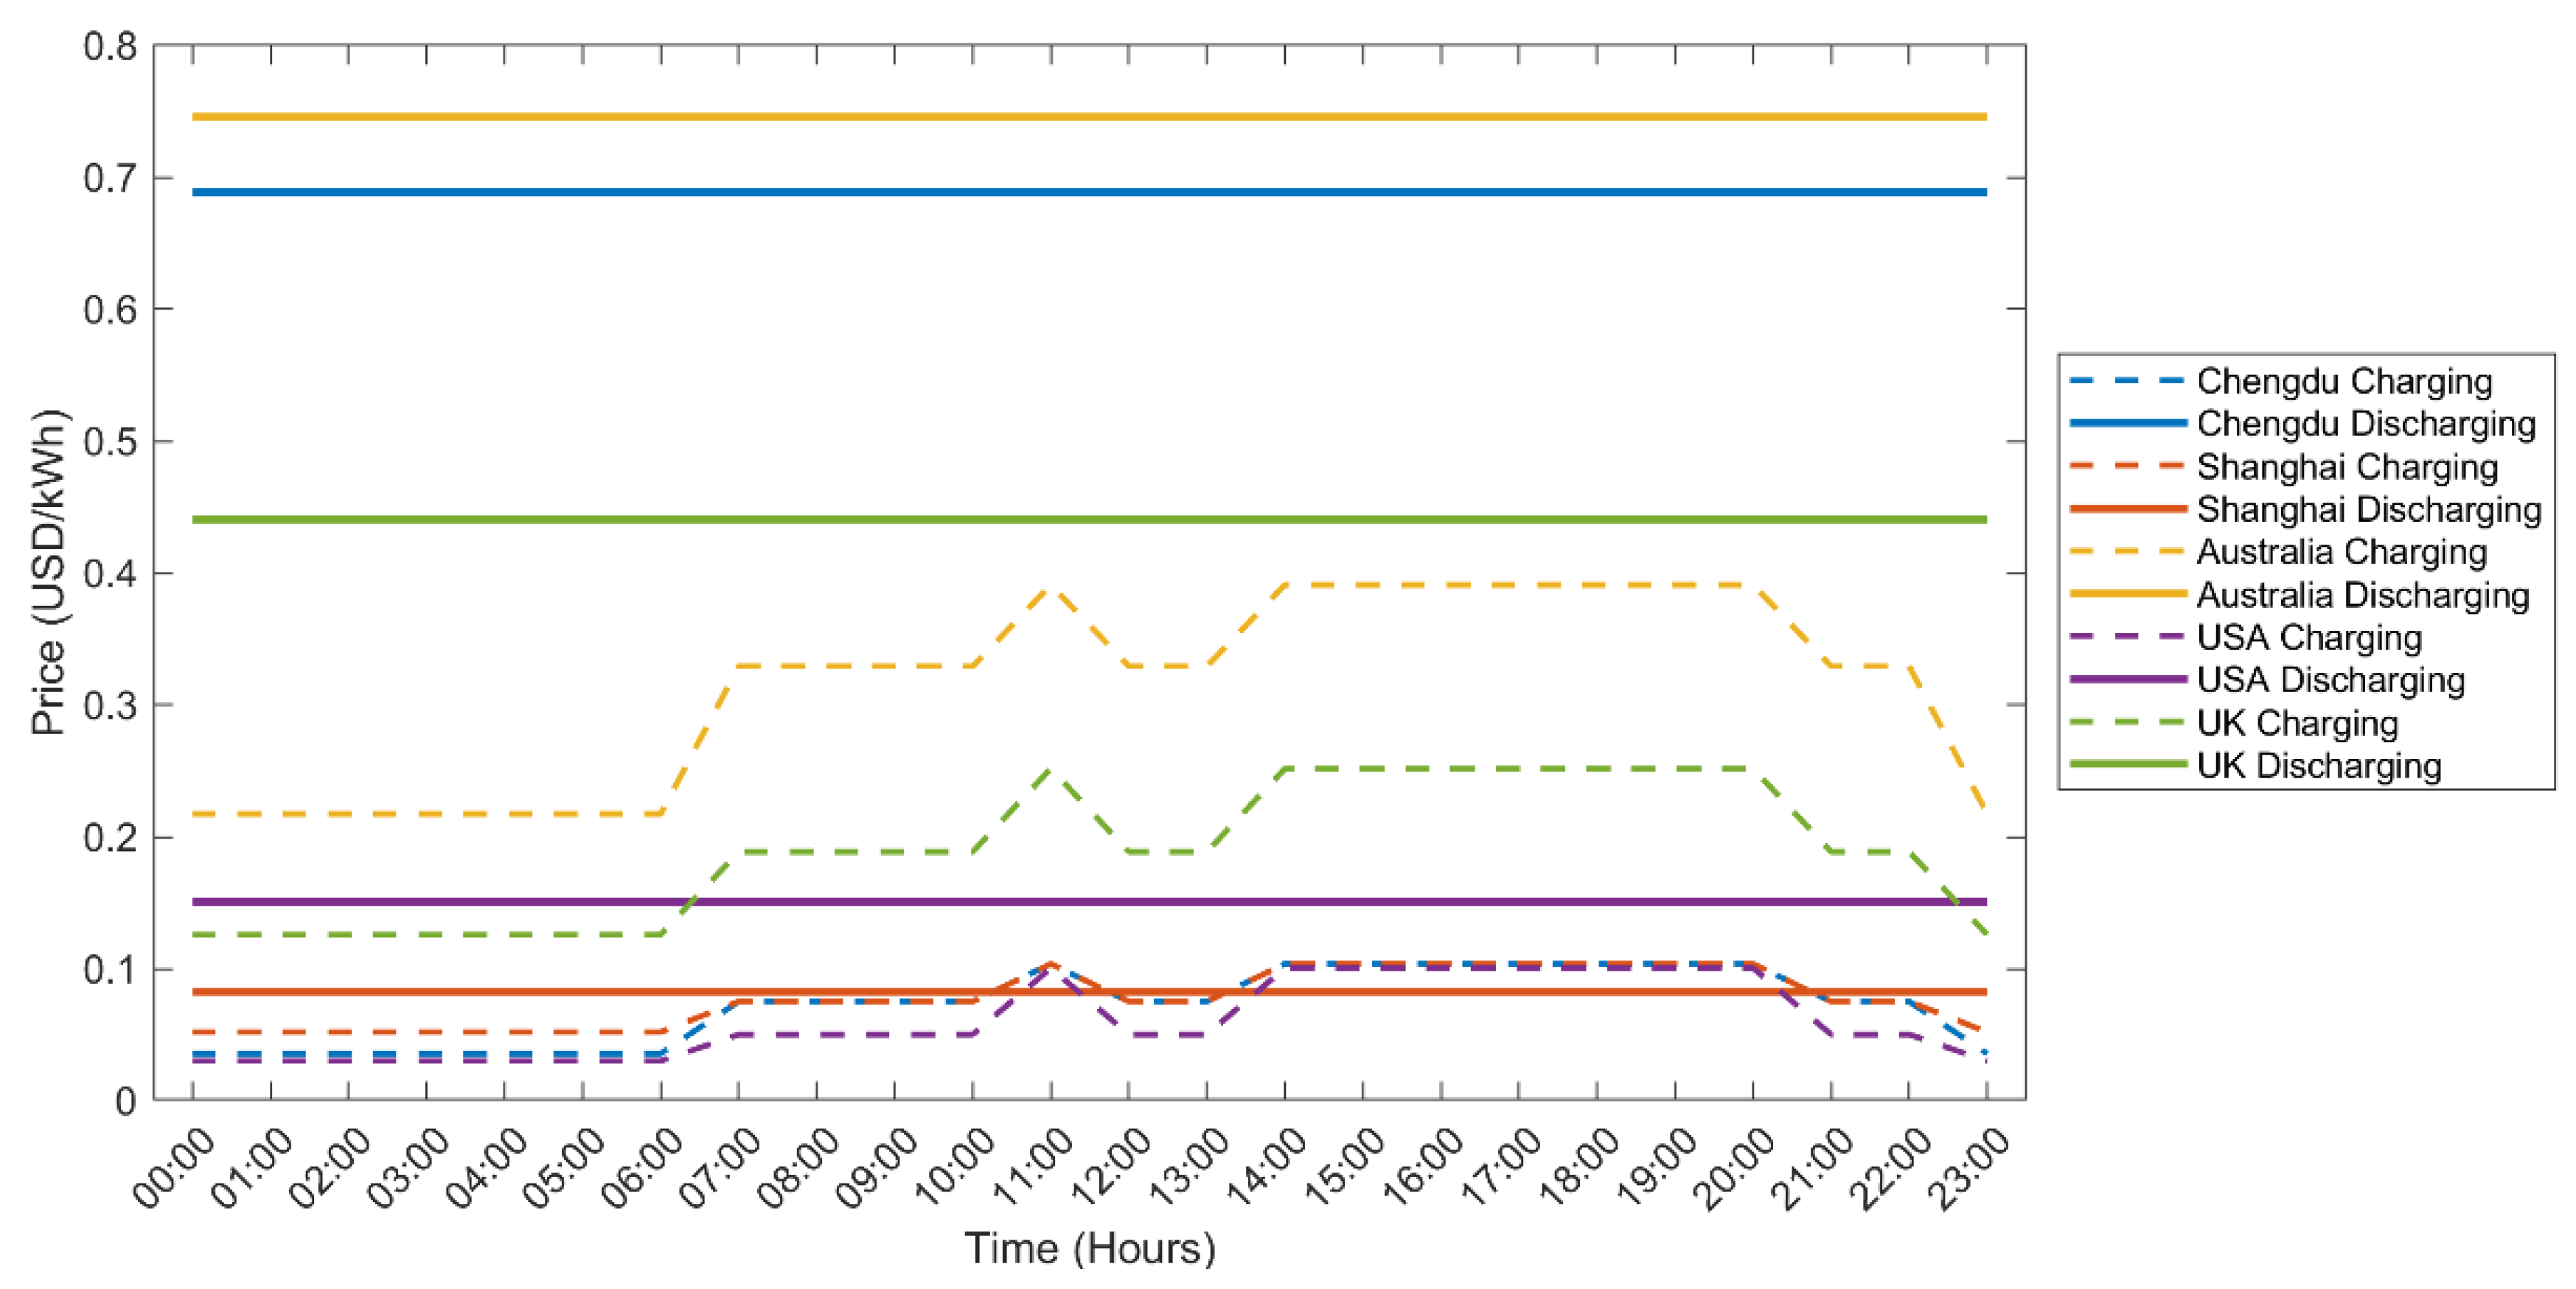
  • Chengdu: High discharging prices (0.6887 USD/kWh) result in substantial revenue, making it one of the most profitable regions for V2G operations.
  • Shanghai: Lower price differentials (0.0305 USD/kWh) lead to modest revenue, highlighting the impact of regional price dynamics on V2G profitability.
  • Australia: High price differentials (0.4663 USD/kWh) contribute to significant revenue, reflecting favorable market conditions for V2G.
  • USA and UK: Moderate price differentials (0.1206 and 0.3147 USD/kWh, respectively) result in intermediate revenue levels, demonstrating the variability in V2G profitability across regions.
These results underscore the importance of regional electricity market characteristics in determining the economic viability of V2G.
Figure 11 illustrates the annual revenue growth of V2G implementation across five regions: Chengdu, Shanghai, Australia, the United States, and the United Kingdom. Chengdu exhibits the most rapid revenue growth, increasing from USD 0 initially to approximately USD 25,000 by Year 10, attributable to its significantly higher peak–valley price differential (0.6528 USD/kWh). Australia, with a price differential of 0.5283 USD/kWh, also demonstrates notable revenue growth, reaching nearly USD 20,000 in Year 10. In contrast, the UK and the US show relatively moderate growth trajectories, while Shanghai’s minimal price differential (0.0305 USD/kWh) results in negligible revenue gains, remaining near USD 0 even after a decade. The limited peak–valley price gap in Shanghai primarily stems from China’s current time-of-use (TOU) pricing policy, which prioritizes residential electricity stability through administrative price caps, thereby compressing commercial and industrial arbitrage margins. In contrast, Chengdu has implemented targeted V2G discharge subsidies (0.6887 USD/kW) to incentivize participation, creating a policy-driven high-arbitrage zone. These marked regional disparities underscore the critical influence of electricity pricing mechanisms and market policies on V2G profitability. The successful practices in Chengdu and Australia provide actionable insights for other regions seeking to optimize V2G adoption through tailored regulatory frameworks and economic incentives.

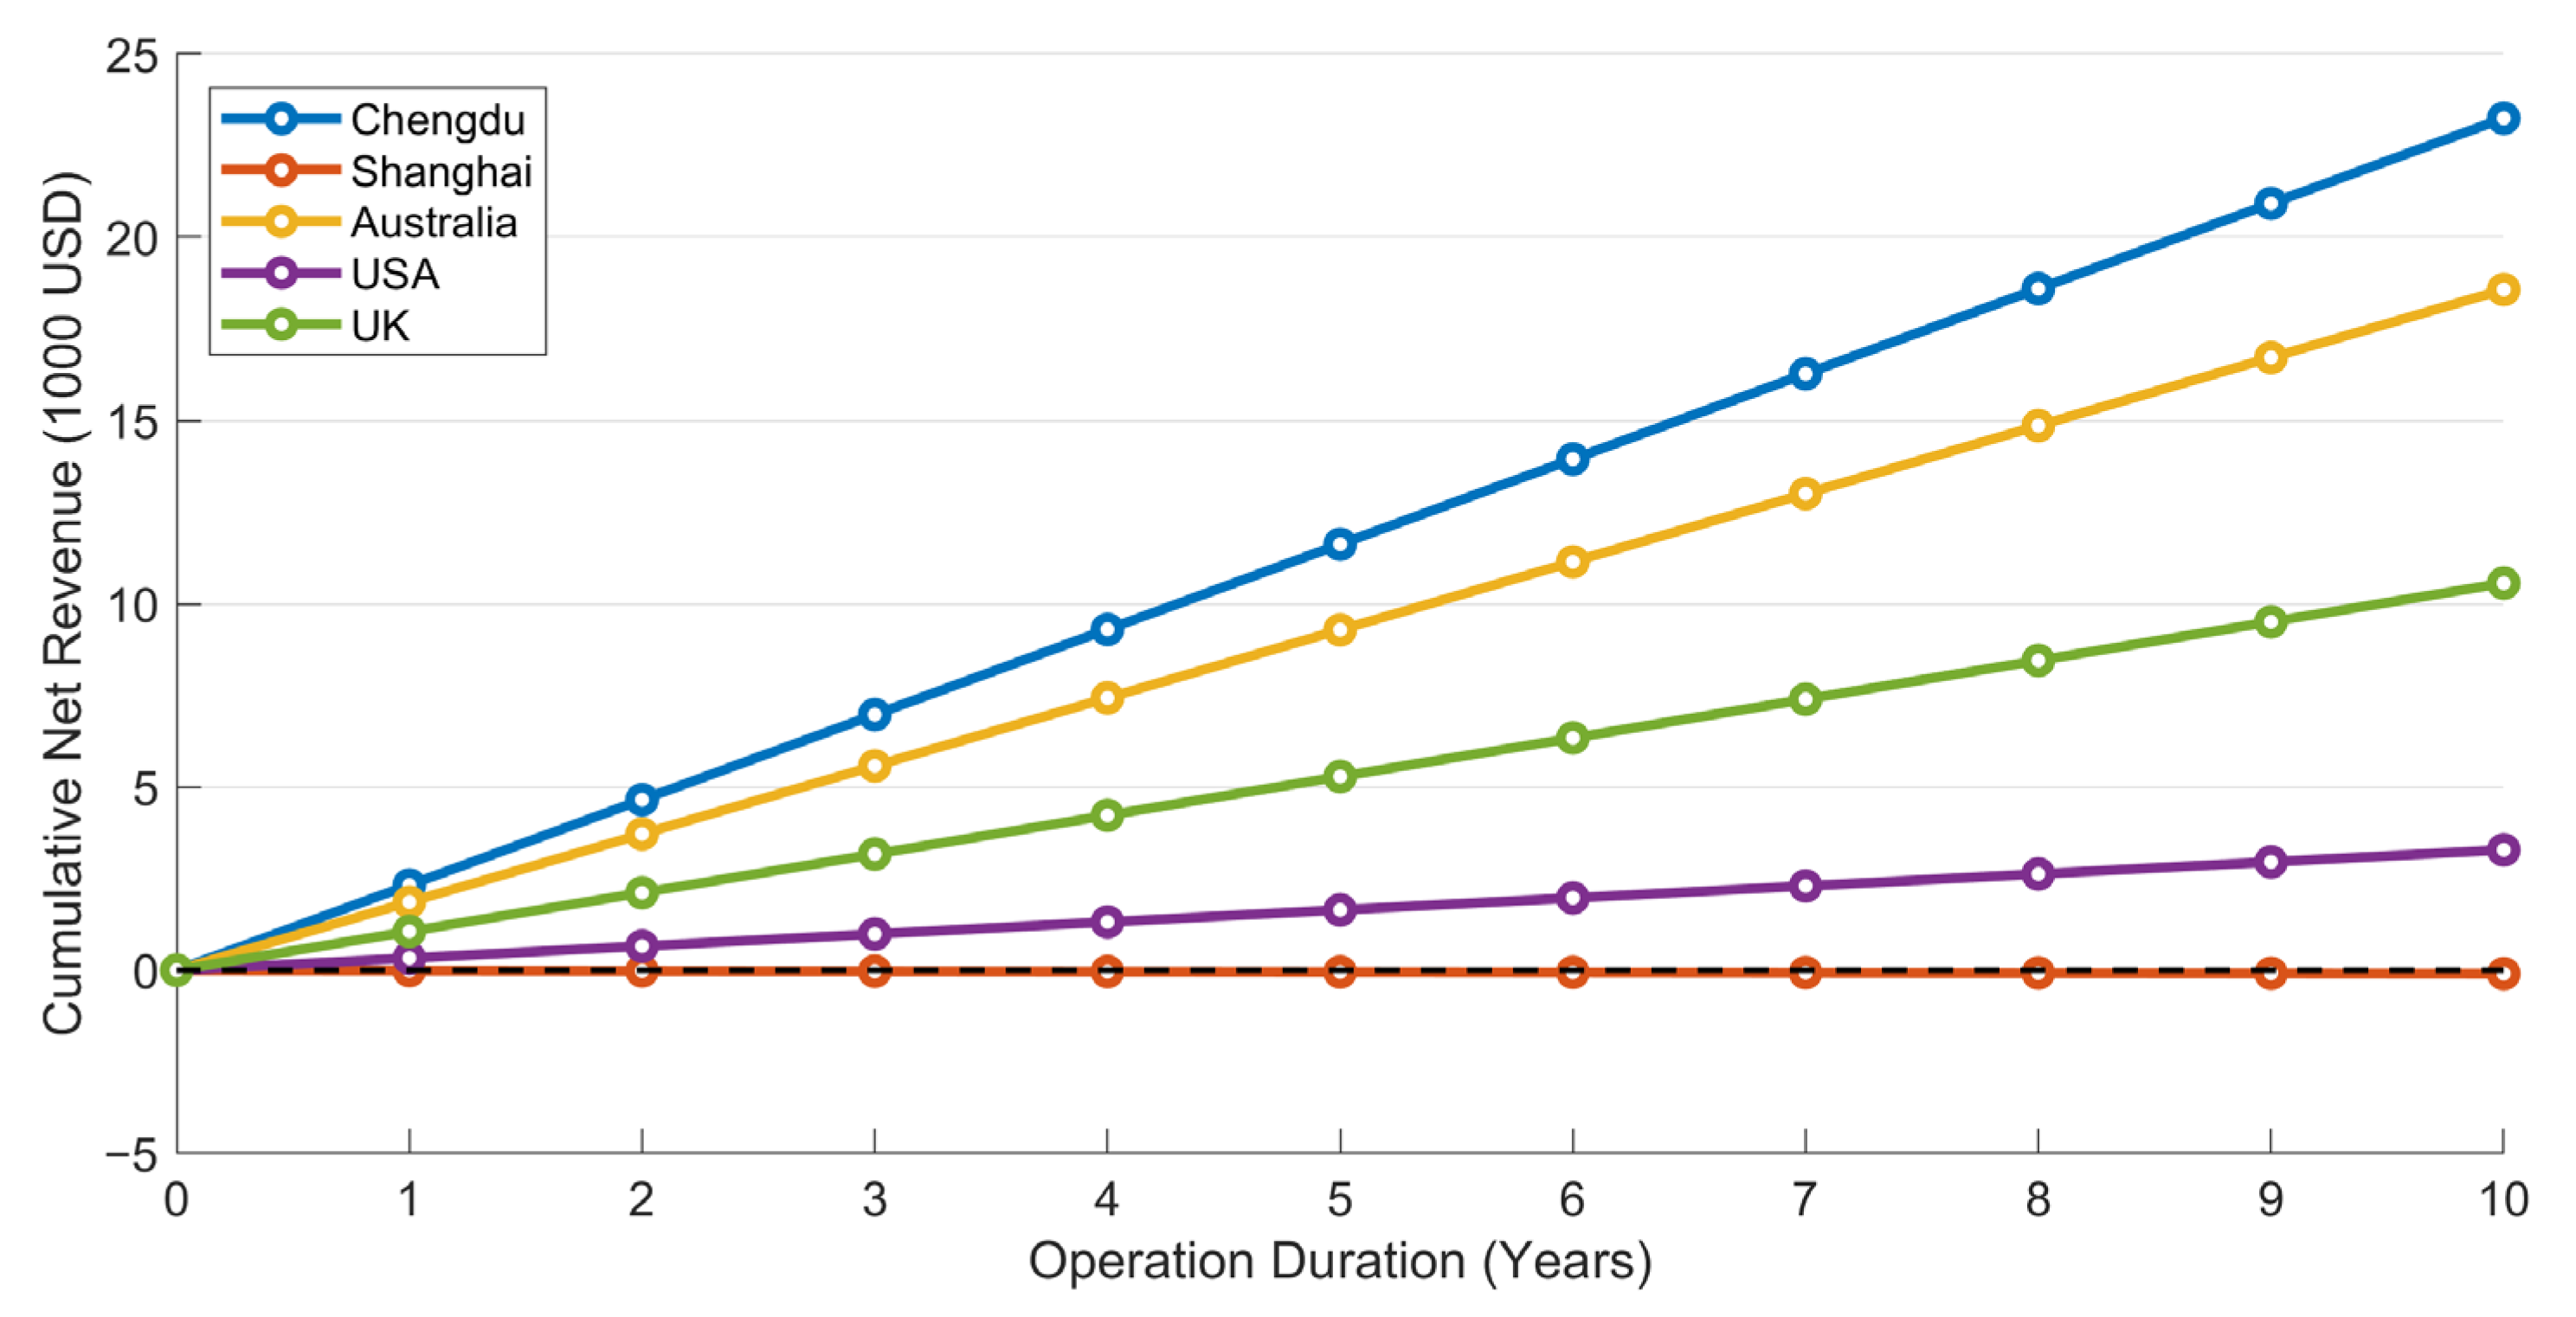
4.2. Net Revenue Trends

When battery degradation costs are included, the net revenue from V2G operations is reduced, but the overall profitability remains positive in most regions. Key observations include the following:
  • Chengdu and Australia: Despite high cycle costs, these regions maintain strong net revenue due to their high price differentials.
  • Shanghai: The combination of low revenue and moderate cycle costs results in marginal net revenue, raising questions about the economic feasibility of V2G in this region.
  • USA and UK: These regions achieve moderate net revenue, balancing relatively low price differentials with manageable cycle costs.
Figure 12 illustrates the cumulative net revenue of Vehicle-to-Grid (V2G) systems, accounting for battery cycle degradation costs, across five regions—Chengdu, Shanghai, Australia, the United States, and the United Kingdom—as a function of operation duration. As observed, Chengdu demonstrates the most pronounced growth in cumulative net revenue, indicating robust profitability even after factoring in battery degradation costs. Australia exhibits significant growth, which underscores its favorable economic viability. The United Kingdom shows steady growth, reflecting moderate profitability for V2G in this region. In contrast, the United States experiences relatively flat growth. Notably, Shanghai’s cumulative net revenue remains near zero throughout the period, even displaying slight negative value, highlighting the economic challenges of V2G implementation in this region when battery degradation costs are considered. The analysis reveals that while battery degradation costs significantly impact V2G profitability, regions with high price differentials can still achieve substantial net benefits.

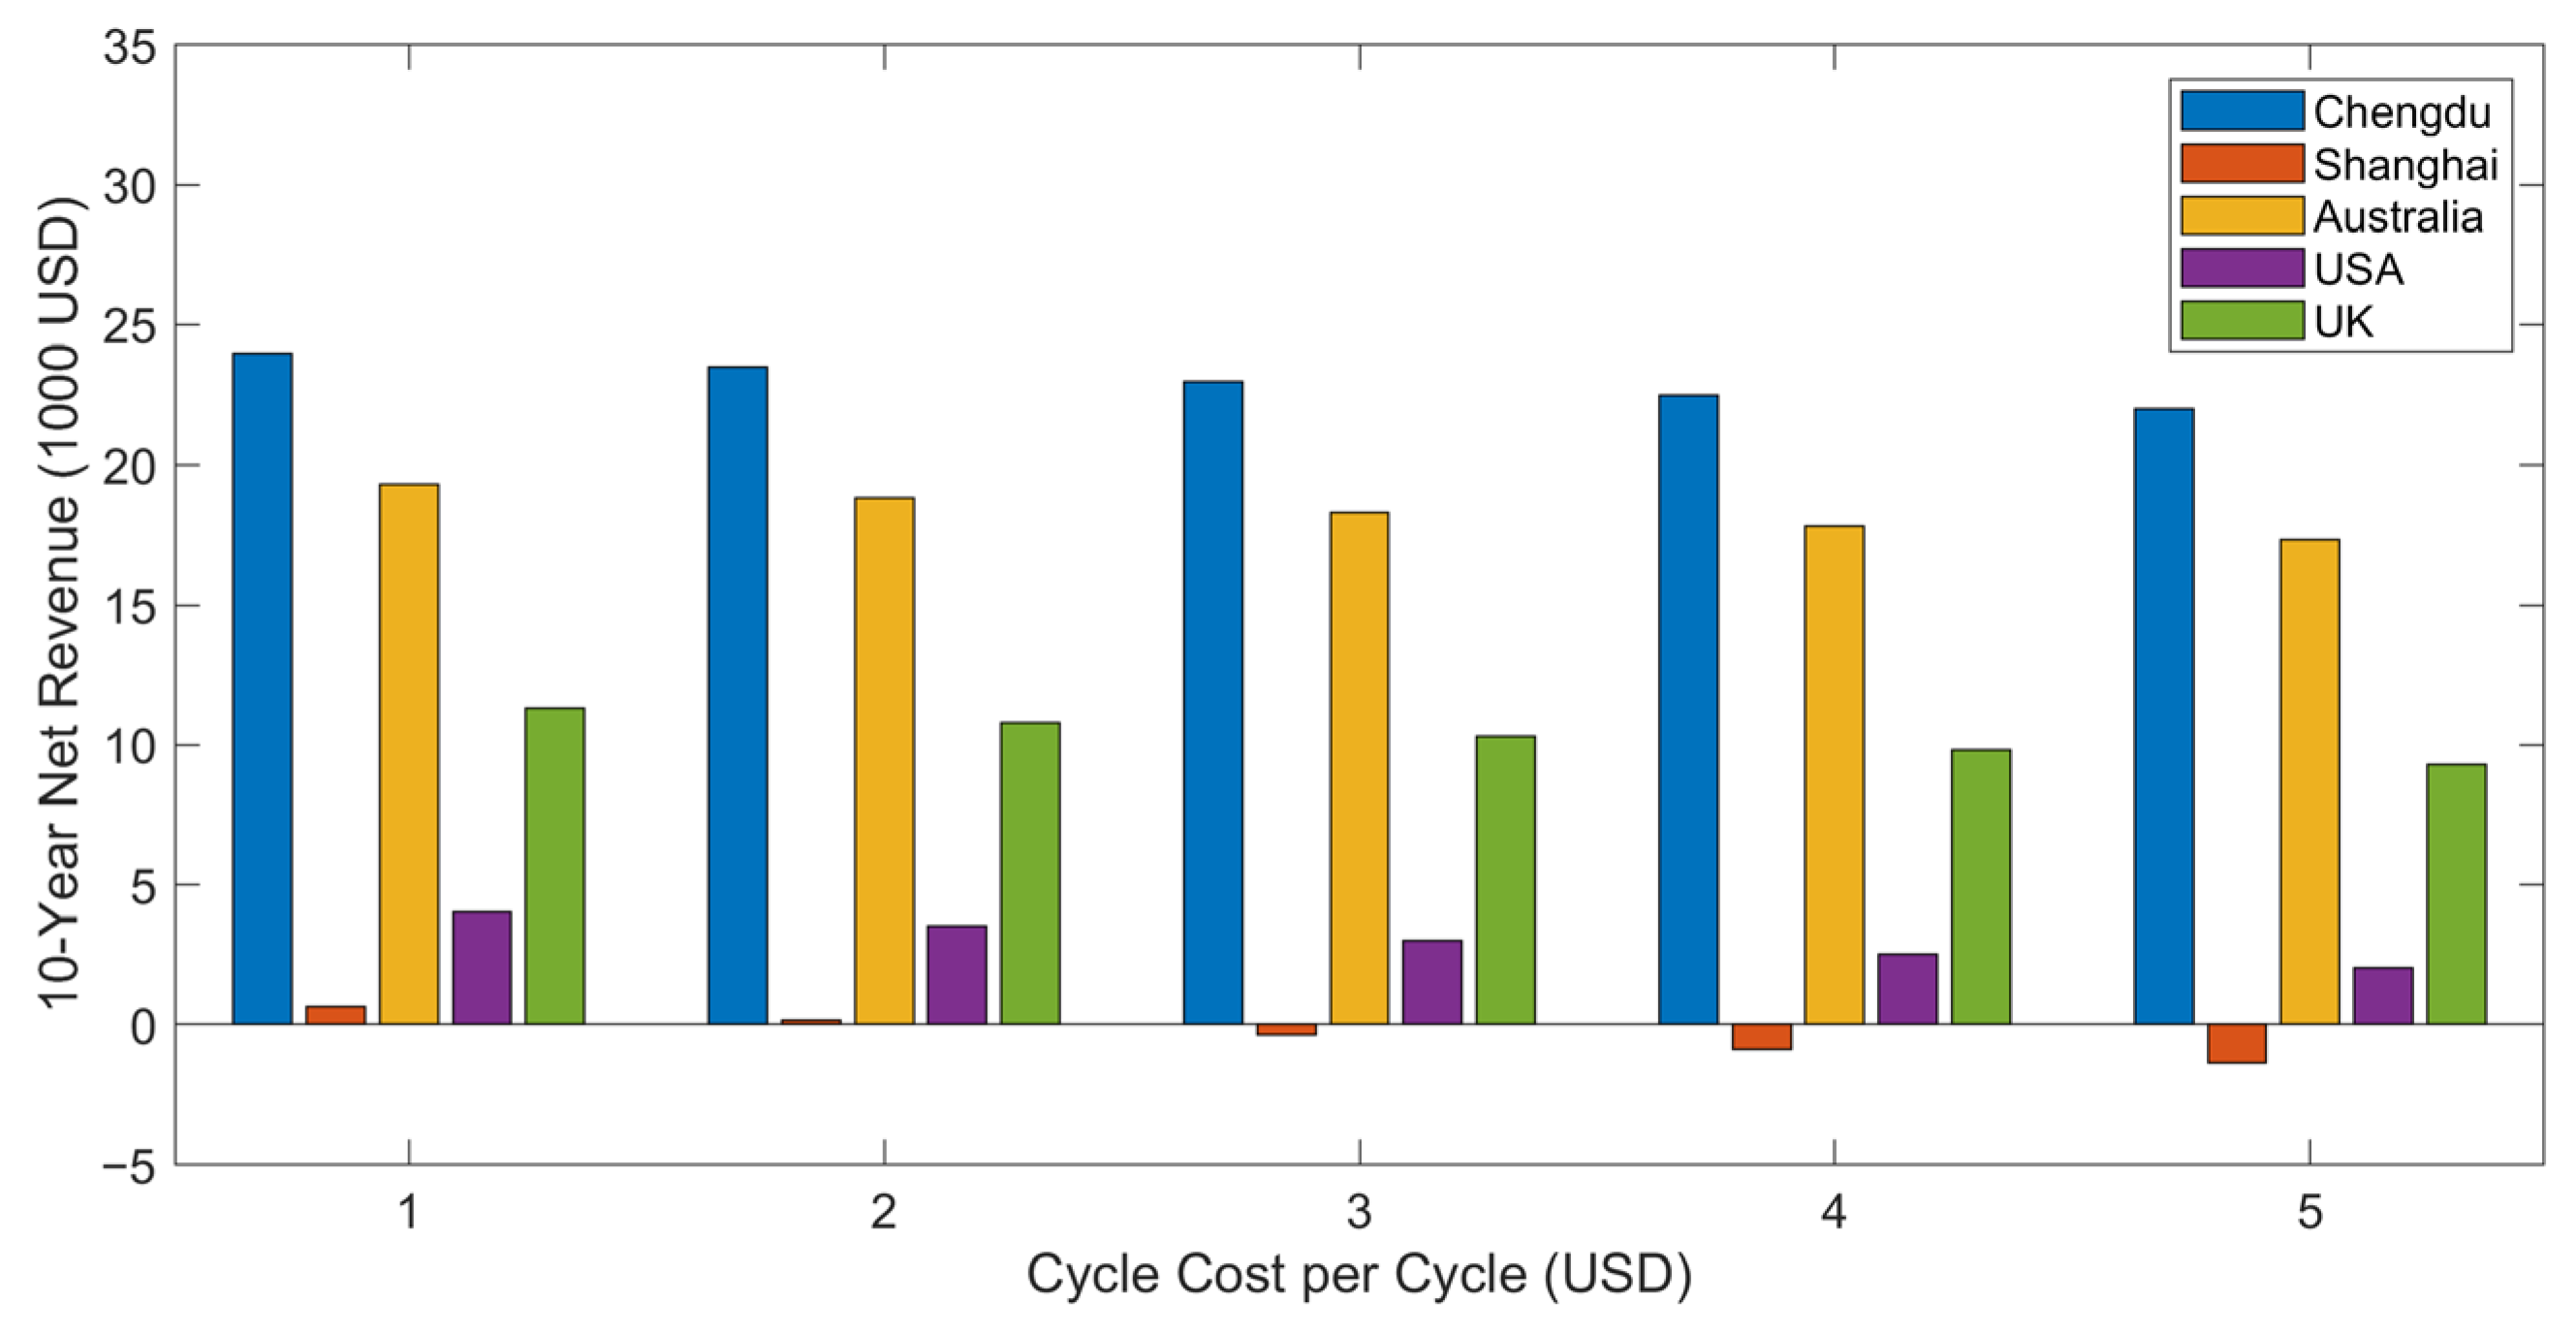
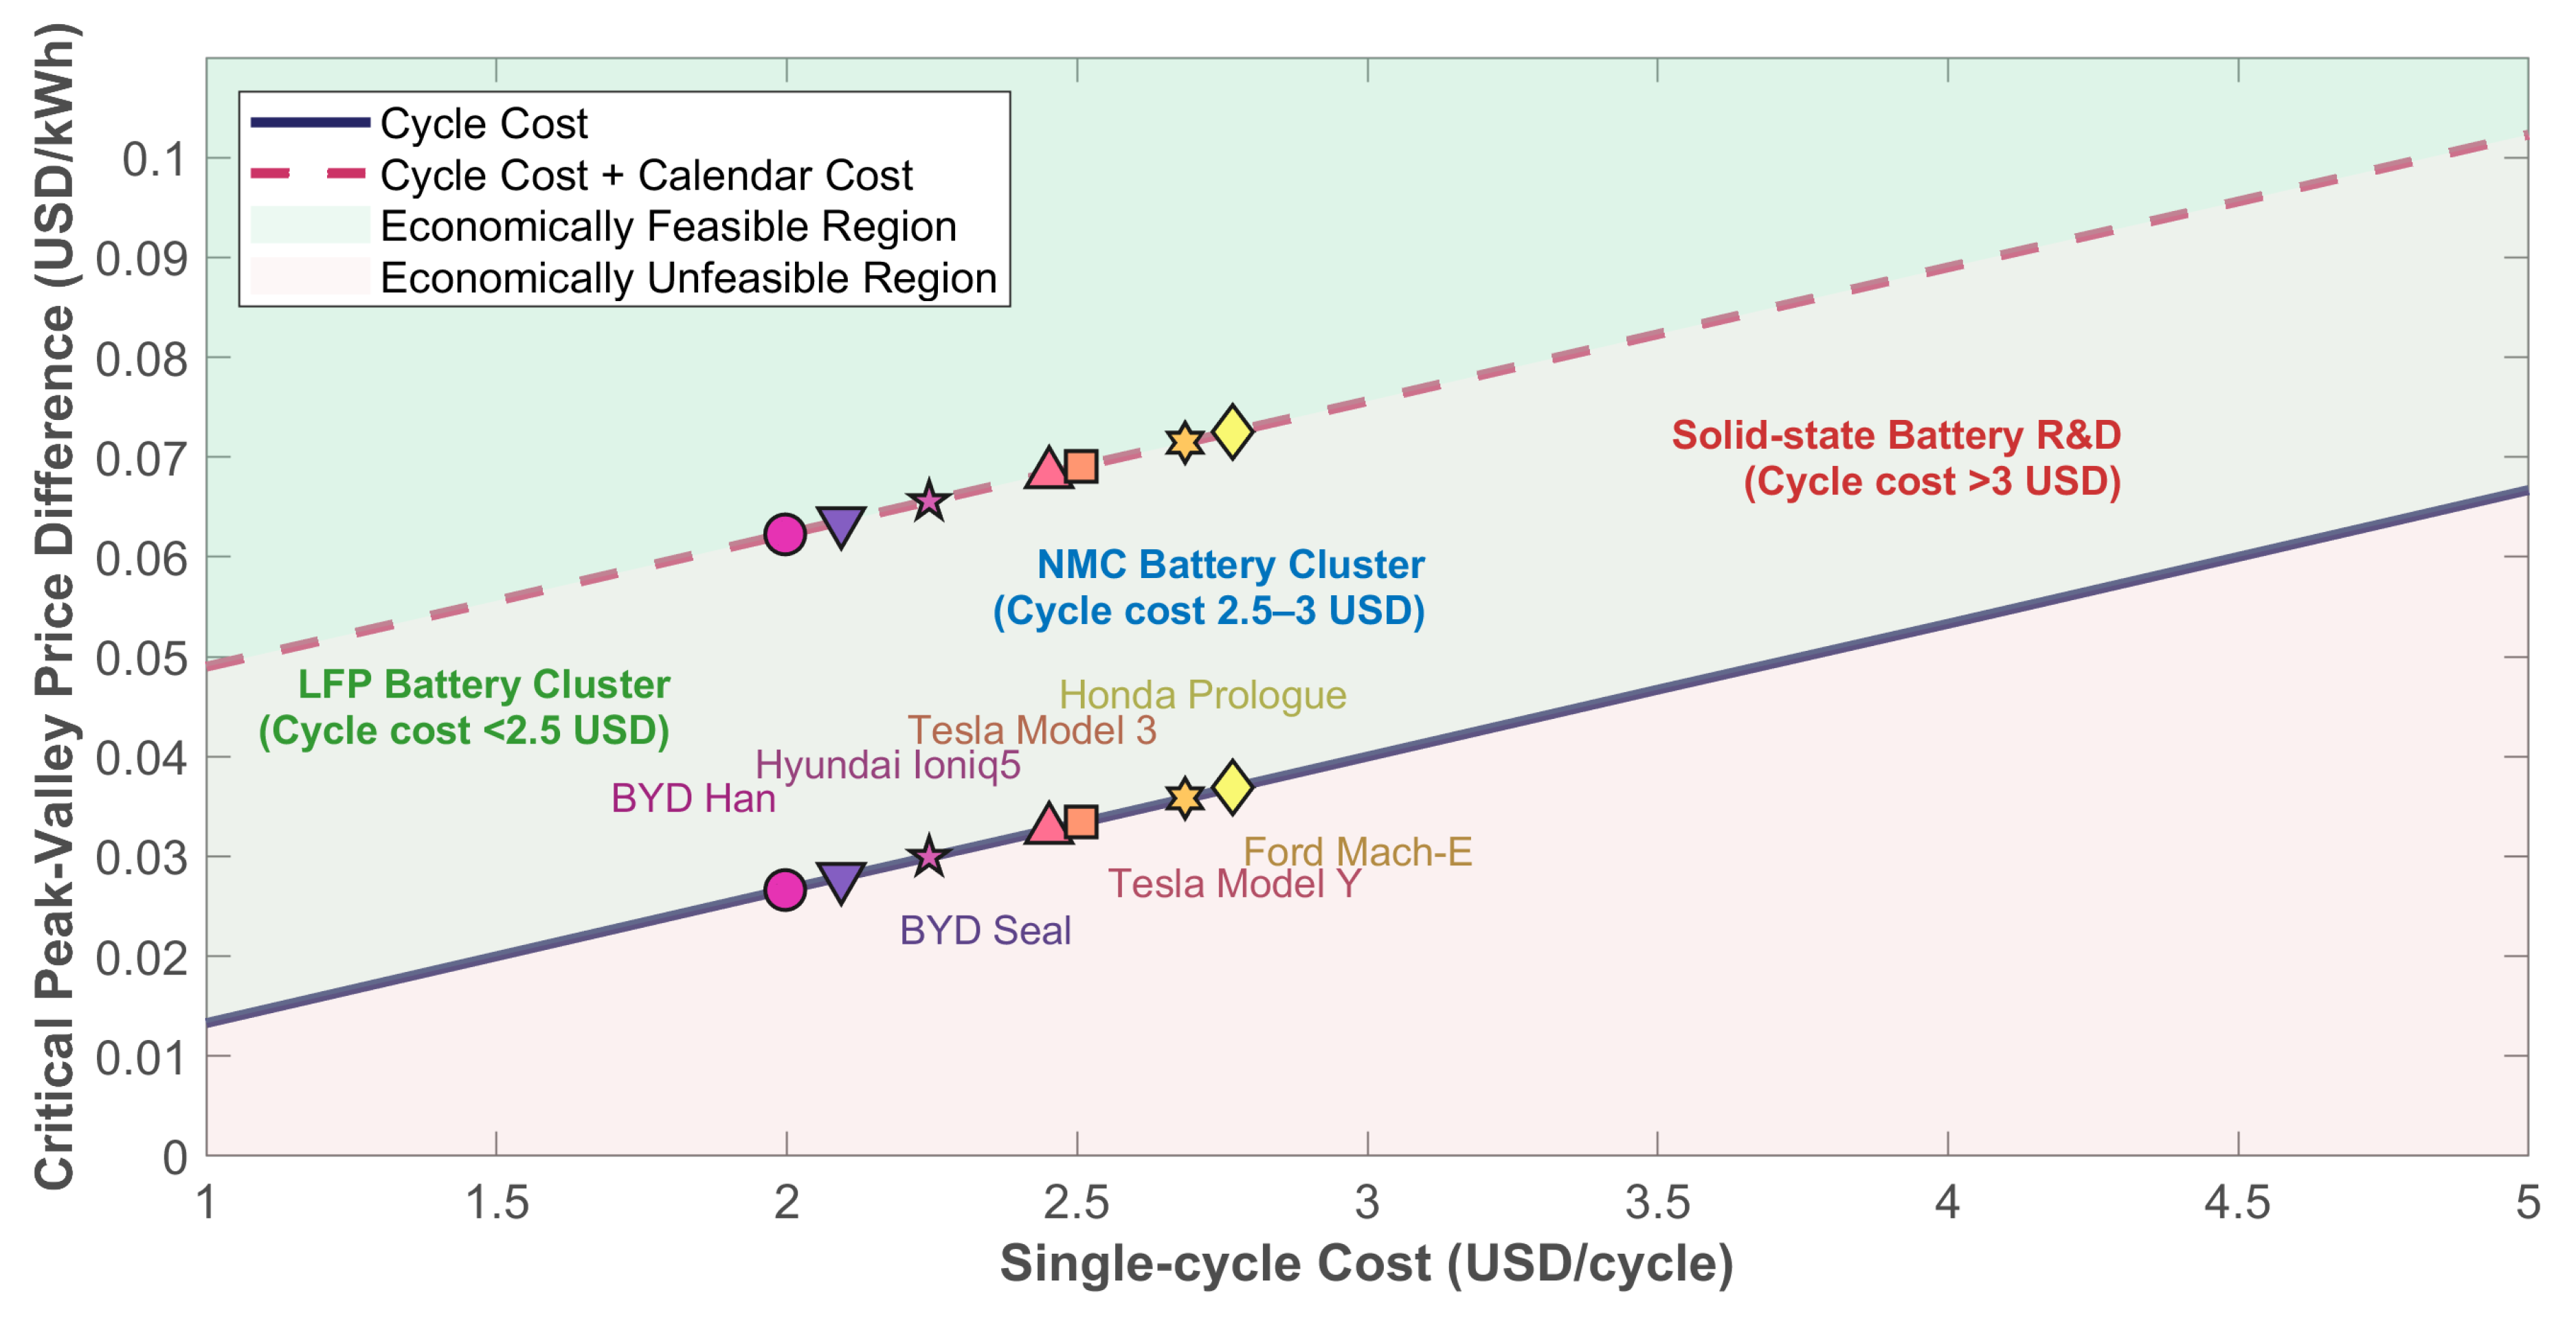
4.3. Sensitivity Analysis

The sensitivity analysis examines the impact of key parameters on V2G profitability. Key findings include the following:
  • Cycle Cost: Variations in cycle cost have a significant effect on net revenue, particularly in regions with low price differentials. For example, in Shanghai, even small increases in cycle cost can render V2G unprofitable.
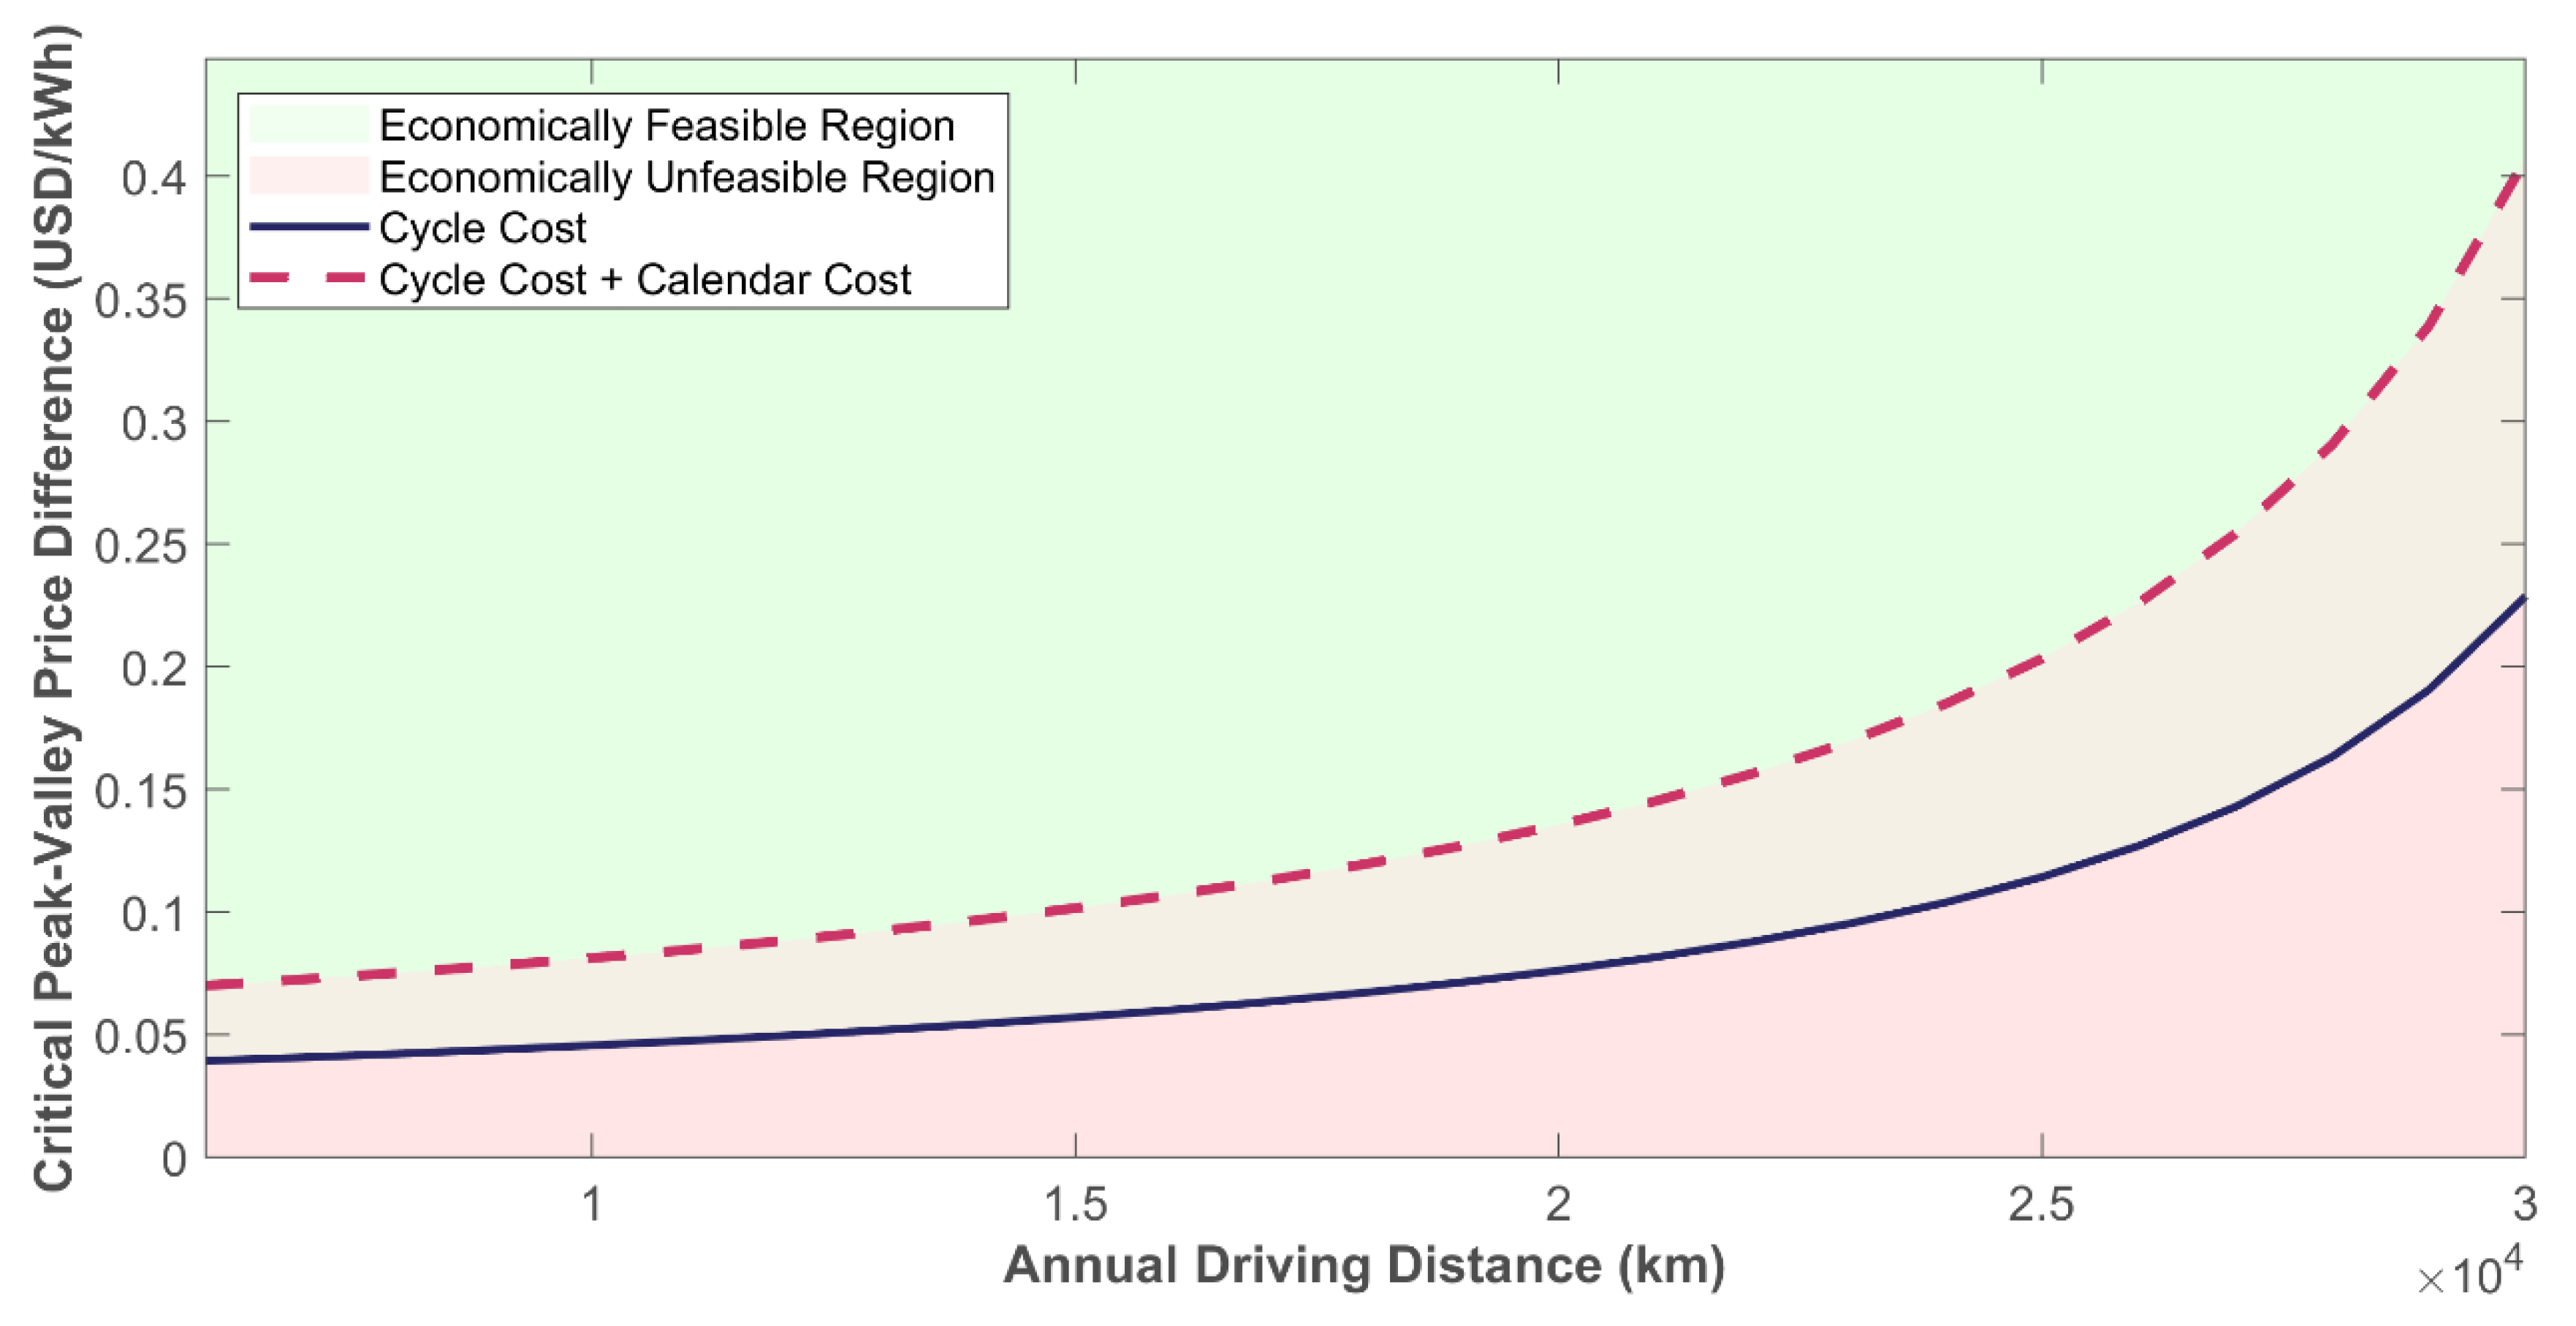
  • Annual Driving Distance: Higher annual mileage correlates with increased annual cycles. While higher annual cycles amplify both revenue and degradation costs, the net effect depends on the price differential. Specifically, in regions like Chengdu and Australia, amplified cycling generates positive profitability (0.6529 USD/kWh). Conversely, in with compressed price spreads like Shanghai, equivalent cycling acceleration exacerbates net losses (0.0305 USD/kWh), primarily due to degradation costs outweighing constrained revenue potential.
  • Regional Price Differences: Regions with larger price differentials are more resilient to changes in cycle cost and annual cycles, demonstrating the critical role of electricity market dynamics in V2G economics.
Figure 13 illustrates the 10-year net revenue of V2G systems across different regions under varying cycle costs per cycle. The results indicate that as the cycle cost per cycle increases, battery degradation costs rise, leading to a generalized decline in V2G net revenue across all regions. Chengdu achieves the highest net revenue, demonstrating relative resilience to cost escalation due to its substantial peak–valley price differential. In contrast, Shanghai exhibits the lowest net revenue, with its minimal price differential amplifying the adverse impact of rising cycle costs. Notably, when the cycle cost reaches 3 USD/cycle, Shanghai’s V2G net revenue transitions into negative growth. This underscores the critical importance of balancing cycle costs against peak–valley price differentials to ensure V2G profitability for electric vehicles operating in regions with diverse time-of-use electricity pricing mechanisms.
These results highlight the importance of optimizing V2G operations based on regional conditions and operational parameters. Electric vehicles of different models exhibit distinct per-cycle degradation costs. This cost divergence directly dictates user net revenue outcomes, with higher per-cycle costs demonstrating an inversely proportional relationship with critical profitability. Consequently, each EV model requires unique peak–valley price differentials to achieve economic balance in V2G.
Figure 14 provides a comparison of break-even price thresholds across seven industry-leading EVs: BYD Han, BYD Seal, Hyundai Ioniq 5, Tesla Model Y, Tesla Model 3, Ford Mach-E, and Honda Prologue. In the graphical representation, the black line denotes the critical peak–valley price differential calculated under cycling degradation costs alone, while the red line illustrates this threshold when both cycling degradation and calendar aging degradation costs are integrated into the model. As illustrated in Figure 14, the green areas above the two lines represent the economically feasible regions when only the cycling cost is considered and when both the cycling cost and the calendar cost are considered, respectively. If the peak–valley price difference falls within this area, electric vehicle users engaging in V2G can make a profit. In contrast, the red areas below the two lines represent the economically unfeasible regions. If the peak–valley price difference falls within this area, electric vehicle users engaging in V2G will incur losses. The part where the colors intersect in the middle represents the region that is economically feasible when only the cycling cost is considered but economically unfeasible when both the cycling cost and the calendar degradation cost are taken into account.
Elevated annual mileage directly increases operational charge–discharge cycles, concurrently amplifying V2G revenue potential and accelerating cyclic degradation costs. This dual effect necessitates proportional escalation of required peak–valley price differentials to maintain cost–benefit equilibrium. Figure 15 delineates mileage-dependent critical price thresholds that enable net-zero economic balance (NPV = 0) for EV users across varying driving intensity cohorts. Similarly, the black line represents the critical peak–valley price differential when only battery cycling degradation costs are considered, while the red line reflects this threshold under the combined effects of cycling degradation and calendar aging degradation costs. Similarly, as in Figure 14, the green areas above the two lines in the figure represent the economically feasible regions when only the cycling cost is considered and when both the cycling cost and the calendar cost are considered, respectively. The red areas below the two lines represent the economically unfeasible regions. The part where the colors intersect in the middle represents the region that is economically feasible when only the cycling cost is considered but economically unfeasible when both the cycling cost and the calendar degradation cost are taken into account.

4.4. Practical Implications

The findings of this study have several practical implications for stakeholders:
  • Policymakers: Policies that incentivize V2G adoption in regions with favorable price differentials can enhance grid stability and reduce energy costs. Policymakers could draw lessons from Chengdu’s V2G pilot experience by implementing a “flexibility premium” mechanism that provides additional subsidies to users participating in grid services. A government subsidy policy that provides a financial incentive of CNY 5 per kWh discharged can enhance the profitability of V2G participation for EV owners, thereby incentivizing greater user engagement in V2G dispatch programs and alleviating grid load pressures.
  • Grid Operators: Understanding regional variations in V2G profitability can help operators design effective pricing mechanisms and grid services.
  • EV Owners: EV owners can determine the critical peak–valley price differential suitable for their participation based on their annual driving distance and vehicle model characteristics. If the regional peak–valley price differential exceeds this critical threshold, V2G implementation becomes economically viable; conversely, regions with price differentials below the threshold are unsuitable for profitable V2G operations.

5. Discussion

This study demonstrates that V2G profitability is governed by regional electricity price differentials and battery degradation dynamics. Wide price spreads in Chengdu (0.65 USD/kWh) and Australia (0.53 USD/kWh) enable net revenues > USD 20,000/vehicle over 10 years, while narrow differentials (Shanghai: 0.03 USD/kWh) make V2G unviable. Crucially, calendar aging dominates degradation costs (67% at 10,000 km/year), revealing battery underutilization in typical low-mileage usage.
We establish minimum profitability thresholds (e.g., 0.12 USD/kWh for Tesla Model Y), enabling targeted policies and user decisions. Discharge subsidies (e.g., Chengdu’s 0.69 USD/kWh) prove essential for marginal markets. As noted by reviewers, aggregators are essential intermediaries for scaling V2G by optimizing fleet dispatch. While this study focuses on EV owner incentives and geographic comparisons (Figure 12, Figure 13, Figure 14 and Figure 15), granular aggregator economics (operational costs, coordination fees) were intentionally excluded from its scope.

6. Conclusions

This analysis establishes that V2G profitability exhibits profound regional heterogeneity, governed primarily by electricity arbitrage margins and battery degradation dynamics. Our integrated life-cycle model, accounting for both cycling degradation and calendar aging, confirms that regions with robust peak–valley differentials (≥0.53 USD/kWh) generate positive lifetime returns exceeding USD 20,000 per vehicle. Conversely, narrow differentials (≤0.03 USD/kWh) result in net economic loss. The dominance of calendar aging (67% of degradation costs at typical usage levels) underscores substantial untapped battery capacity for grid services. By establishing critical break-even thresholds that vary according to vehicle specifications and annual mileage, this study equips EV owners with actionable criteria for participation decisions and provides policymakers with empirical justification for targeted market interventions. Grid operators may leverage these findings to design effective dynamic pricing architectures, while discharge subsidies—as successfully implemented in Chengdu—prove essential for bridging viability gaps in constrained markets. Collectively, these insights advance V2G implementation by transforming battery degradation from an implementation barrier into a quantifiable economic variable, enabling optimized grid resilience and enhanced asset utilization throughout the EV life-cycle.

Author Contributions

Conceptualization, Methodology and Writing C.Z. and X.W.; Validation, Y.W. and P.T.; Resources, C.Z.; supervision, C.Z.; project administration, Y.W.; funding acquisition, C.Z. All authors have read and agreed to the published version of the manuscript.

Funding

This research was funded by Shandong Provincial Natural Science Foundation Project, grant numbers ZR2023QE192, 2023HWYQ-071, and IDFA10202018.

Institutional Review Board Statement

Not applicable.

Informed Consent Statement

Not applicable.

Data Availability Statement

The raw data supporting the conclusions of this article will be made available by the authors on request.

Conflicts of Interest

The authors declare no conflict of interest.

References

  1. International Energy Agency. Global EV Outlook 2019; International Energy Agency: Paris, France, 2019. [Google Scholar]
  2. International Energy Agency. Global Energy and Climate Model: Announced Pledges Scenario (APS). 2024. Available online: https://www.iea.org/reports/global-energy-and-climate-model (accessed on 28 April 2025).
  3. De la Torre, S.; Aguado, J.A.; Sauma, E. Optimal scheduling of ancillary services provided by an electric vehicle aggregator. Energy 2023, 265, 126147. [Google Scholar] [CrossRef]
  4. Li, Q.; Zhao, D.; Li, X.; Wang, X. Electric vehicle sharing based “energy sponge” service interfacing transportation and power systems. Clean. Logist. Supply Chain 2022, 3, 100022. [Google Scholar] [CrossRef]
  5. Andersen, D.; Powell, S. Policy and pricing tools to incentivize distributed electric vehicle-to-grid charging control. Energy Policy 2025, 198, 114496. [Google Scholar] [CrossRef]
  6. Ouyang, M.G. Technical Potential and Implementation Feasibility of Vehicle-to-Grid (V2G) Technology [PPT]. In China EV 100 Forum; Tsinghua University: Beijing, China, 2021. [Google Scholar]
  7. Hirst, E.; Yourstone, E.; Gettings, M. A New Model of Incremental Decision Making for Resource Acquisition by Electric Utilities (ORNL/CON-315); Oak Ridge National Laboratory: Oak Ridge, TN, USA, 1991. [Google Scholar]
  8. Gandhi, H.A.; White, A.D. City-wide modeling of vehicle-to-grid economics to understand effects of battery performance. ACS Sustain. Chem. Eng. 2021, 9, 14975–14985. [Google Scholar] [CrossRef]
  9. Nagel, N.O.; Jåstad, E.O.; Martinsen, T. The grid benefits of vehicle-to-grid in Norway and Denmark: An analysis of home-and public parking potentials. Energy 2024, 293, 130729. [Google Scholar] [CrossRef]
  10. Zhang, C.; Kitamura, H.; Goto, M. Feasibility of vehicle-to-grid (V2G) implementation in Japan: A regional analysis of the electricity supply and demand adjustment market. Energy 2024, 311, 133317. [Google Scholar] [CrossRef]
  11. Waldron, J.; Rodrigues, L.; Deb, S.; Gillott, M.; Naylor, S.; Rimmer, C. Exploring opportunities for vehicle-to-grid implementation through demonstration projects. Energies 2024, 17, 1549. [Google Scholar] [CrossRef]
  12. Kester, J.; Noel, L.; de Rubens, G.Z.; Sovacool, B.K. Promoting Vehicle to Grid (V2G) in the Nordic region: Expert advice on policy mechanisms for accelerated diffusion. Energy Policy 2018, 116, 422–432. [Google Scholar] [CrossRef]
  13. Park, K.; Jang, D.; Kim, S.; Lim, Y.; Lee, J. A grid-friendly electric vehicle infrastructure: The Korean approach. IEEE Power Energy Mag. 2023, 21, 28–37. [Google Scholar] [CrossRef]
  14. Makeen, P.; Ghali, H.A.; Memon, S.; Duan, F. Insightful electric vehicle utility grid aggregator methodology based on the G2V and V2G technologies in Egypt. Sustainability 2023, 15, 1283. [Google Scholar] [CrossRef]
  15. Coignard, J.; Saxena, S.; Greenblatt, J.; Wang, D. Clean vehicles as an enabler for a clean electricity grid. Environ. Res. Lett. 2018, 13, 054031. [Google Scholar] [CrossRef]
  16. Shan, Y.; Hu, J.; Chan, K.W.; Fu, Q.; Guerrero, J.M. Model predictive control of bidirectional DC–DC converters and AC/DC interlinking converters—A new control method for PV-wind-battery microgrids. IEEE Trans. Sustain. Energy 2018, 10, 1823–1833. [Google Scholar] [CrossRef]
  17. Zhou, Z.; Wang, B.; Dong, M.; Ota, K. Secure and efficient vehicle-to-grid energy trading in cyber physical systems: Integration of blockchain and edge computing. IEEE Trans. Syst. Man Cybern. Syst. 2019, 50, 43–57. [Google Scholar] [CrossRef]
  18. dos Santos Neto, P.J.; dos Santos Barros, T.A.; Silveira, J.P.C.; Ruppert Filho, E.; Vasquez, J.C.; Guerrero, J.M. Power management strategy based on virtual inertia for DC microgrids. IEEE Trans. Power Electron. 2020, 35, 12472–12485. [Google Scholar] [CrossRef]
  19. Upputuri, R.P.; Subudhi, B. A comprehensive review and performance evaluation of bidirectional charger topologies for V2G/G2V operations in EV applications. IEEE Trans. Transp. Electrif. 2023, 10, 583–595. [Google Scholar] [CrossRef]
  20. Makeen, P.; Ghali, H.A.; Memon, S.; Duan, F. Smart techno-economic operation of electric vehicle charging station in Egypt. Energy 2023, 264, 126151. [Google Scholar] [CrossRef]
  21. Lin, J.; Qiu, J.; Yang, Y.; Lin, W. Planning of electric vehicle charging stations considering fuzzy selection of second life batteries. IEEE Trans. Power Syst. 2023, 39, 5062–5076. [Google Scholar] [CrossRef]
  22. de la Torre, S.; Aguado, J.; Sauma, E.; Lozano-Martos, A. Optimal routing for electric vehicle macro-groups in urban areas: Application to the city of Santiago, Chile. Energy 2024, 313, 133996. [Google Scholar]
  23. Lin, J.; Qiu, J.; Yang, Y.; Sun, X.; Lu, X.; Yuan, Z. Data integrity attack resilience for electric vehicle charging management centers in distributed optimal power flow with non-ideal Li-ion battery models. Appl. Energy 2025, 391, 125897. [Google Scholar] [CrossRef]
  24. Lin, J.; Qiu, J.; Liu, G.; Yao, Z.; Yuan, Z.; Lu, X. A Fuzzy Logic Approach to Power System Security with Non-Ideal Electric Vehicle Battery Models in Vehicle-to-Grid Systems. IEEE Internet Things J. 2025, 12, 21876–21891. [Google Scholar] [CrossRef]
  25. Sovacool, B.K.; Noel, L.; Axsen, J.; Kempton, W. The neglected social dimensions to a vehicle-to-grid (V2G) transition: A critical and systematic review. Environ. Res. Lett. 2018, 13, 013001. [Google Scholar] [CrossRef]
  26. Wang, M.; Craig, M.T. The value of vehicle-to-grid in a decarbonizing California grid. J. Power Sources 2021, 513, 230472. [Google Scholar] [CrossRef]
  27. Zhang, H.; Liu, Y.; Li, J.; Yu, H.; Xu, H.; Ma, K.; Liang, Y.; An, X.; Hu, X. Influence Factors of the V2G Economic Benefits of Pure Electric Logistics Vehicles: A Case Study in Chengdu. Int. J. Automot. Technol. 2023, 24, 1411–1422. [Google Scholar] [CrossRef]
  28. Ginigeme, K.; Wang, Z. Distributed optimal vehicle-to-grid approaches with consideration of battery degradation cost under real-time pricing. IEEE Access 2020, 8, 5225–5235. [Google Scholar] [CrossRef]
  29. Han, H.; Miu, H.; Lv, S.; Yuan, X.; Pan, Y.; Zeng, F. Fast Charging Guidance and Pricing Strategy Considering Different Types of Electric Vehicle Users’ Willingness to Charge. Energies 2024, 17, 4716. [Google Scholar] [CrossRef]
  30. Choudhary, D.; Mahanty, R.N.; Kumar, N. Plug-in electric vehicle dynamic pricing strategies for bidirectional power flow in decentralized and centralized environment. Sustain. Energy Grids Netw. 2024, 38, 101317. [Google Scholar] [CrossRef]
  31. Sun, Y.; Yue, H.; Zhang, J.; Booth, C. Minimization of residential energy cost considering energy storage system and EV with driving usage probabilities. IEEE Trans. Sustain. Energy 2018, 10, 1752–1763. [Google Scholar] [CrossRef]
  32. Zheng, Y.; Shao, Z.; Shang, Y.; Jian, L. Modeling the temporal and economic feasibility of electric vehicles providing vehicle-to-grid services in the electricity market under different charging scenarios. J. Energy Storage 2023, 68, 107579. [Google Scholar] [CrossRef]
  33. Huang, S.; Liu, W.; Zhang, J.; Liu, C.; Sun, H.; Liao, Q. Vehicle-to-grid workplace discharging economics as a function of driving distance and type of electric vehicle. Sustain. Energy Grids Netw. 2022, 31, 100779. [Google Scholar] [CrossRef]
  34. Khezri, R.; Razmi, P.; Mahmoudi, A.; Bidram, A.; Khooban, M.H. Machine learning-based sizing of a renewable-battery system for grid-connected homes with fast-charging electric vehicle. IEEE Trans. Sustain. Energy 2022, 14, 837–848. [Google Scholar] [CrossRef]
  35. Tan, M.; Ren, Y.; Pan, R.; Wang, L.; Chen, J. Fair and efficient electric vehicle charging scheduling optimization considering the maximum individual waiting time and operating cost. IEEE Trans. Veh. Technol. 2023, 72, 9808–9820. [Google Scholar] [CrossRef]
  36. Shao, S.; Sartipizadeh, H.; Gupta, A. Scheduling EV charging having demand with different reliability constraints. IEEE Trans. Intell. Transp. Syst. 2023, 24, 11018–11029. [Google Scholar] [CrossRef]
  37. Shibl, M.M.; Ismail, L.S.; Massoud, A.M. Electric vehicles charging management using deep reinforcement learning considering vehicle-to-grid operation and battery degradation. Energy Rep. 2023, 10, 494–509. [Google Scholar] [CrossRef]
  38. Ebrahimi, M.; Rastegar, M.; Mohammadi, M.; Palomino, A.; Parvania, M. Stochastic charging optimization of V2G-capable PEVs: A comprehensive model for battery aging and customer service quality. IEEE Trans. Transp. Electrif. 2020, 6, 1026–1034. [Google Scholar] [CrossRef]
  39. Zhang, L.; Yin, Q.; Zhu, W.; Lyu, L.; Jiang, L.; Koh, L.H.; Cai, G. Research on the orderly charging and discharging mechanism of electric vehicles considering travel characteristics and carbon quota. IEEE Trans. Transp. Electrif. 2023, 10, 3012–3027. [Google Scholar] [CrossRef]
  40. Khezri, R.; Steen, D.; Wikner, E.; Tuan, L.A. Optimal V2G scheduling of an EV with calendar and cycle aging of battery: An MILP approach. IEEE Trans. Transp. Electrif. 2024, 10, 10497–10507. [Google Scholar] [CrossRef]
  41. Zhou, C.; Xiang, Y.; Huang, Y.; Wei, X.; Liu, Y.; Liu, J. Economic analysis of auxiliary service by V2G: City comparison cases. Energy Rep. 2020, 6, 509–514. [Google Scholar] [CrossRef]
  42. Li, J.; Li, A. Optimizing electric vehicle integration with vehicle-to-grid technology: The influence of price difference and battery costs on adoption, profits, and green energy utilization. Sustainability 2024, 16, 1118. [Google Scholar] [CrossRef]
  43. Wang, J.; Purewal, J.; Liu, P.; Hicks-Garner, J.; Soukazian, S.; Sherman, E.; Sorenson, A.; Vu, L.; Tataria, H.; Verbrugge, M.W. Degradation of lithiumion batteries employing graphite negatives and nickel–cobalt–manganese oxide+ spinel manganese oxide positives: Part 1, aging mechanisms and life estimation. J. Power Sources 2014, 269, 937–948. [Google Scholar] [CrossRef]
  44. Zhang, C.; Min, H.; Yu, Y.; Wang, D.; Luke, J.; Opila, D.; Saxena, S. Using CPE function to size capacitor storage for electric vehicles and quantifying battery degradation during different driving cycles. Energies 2016, 9, 903. [Google Scholar] [CrossRef]
  45. Tesla. 2023 Impact Report. 2023. Available online: https://www.tesla.cn/impact (accessed on 28 April 2025).
  46. Xiao, T.Y. Unlocking China’s V2G Potential: Opportunities and Challenges in the Evolving Market: China Briefing. 2024. Available online: https://www.china-briefing.com/news/unlocking-chinas-v2g-potential-opportunities-and-challenges-in-the-evolving-market/ (accessed on 28 April 2025).
  47. Ma, Y.; Lu, Y.; Yin, Y.; Lei, Y. Pricing strategy of V2G demand response for industrial and commercial enterprises based on cooperative game. Int. J. Electr. Power Energy Syst. 2024, 160, 110051. [Google Scholar] [CrossRef]
  48. Christopher Bonasia. EV Fleets Earn More Than $10k Per Vehicle in Australian V2G Pilot. The Energy Mix. 2023. Available online: https://www.theenergymix.com/ev-fleets-earn-more-than-10k-per-vehicle-in-australian-v2g-pilot/ (accessed on 28 April 2025).
  49. Elite Power Group. V2G, V2L&V2H Explained: Vehicle-to-Grid in Australia. 2025. Available online: https://www.elitepowergroup.com.au/news/what-is-vehicle-to-grid/ (accessed on 28 April 2025).
  50. Meelen, T.; Doody, B.; Schwanen, T. Vehicle-to-Grid in the UK fleet market: An analysis of upscaling potential in a changing environment. J. Clean. Prod. 2021, 290, 125203. [Google Scholar] [CrossRef]
  51. Sun, M.; Shao, C.; Zhuge, C.; Wang, P.; Yang, X.; Wang, S. Uncovering travel and charging patterns of private electric vehicles with trajectory data: Evidence and policy implications. Transportation 2021, 49, 1–31. [Google Scholar] [CrossRef]
Figure 1. EV stock prediction in the next 10 years.
Sustainability 17 05626 g001
Figure 2. Overall structure.
Sustainability 17 05626 g002
Figure 3. Impact of annual mileage on degradation.
Sustainability 17 05626 g003
Figure 4. Battery capacity degradation economic analysis.
Sustainability 17 05626 g004
Figure 5. Effect of C-rate on cycle degradation.
Sustainability 17 05626 g005
Figure 6. Effect of temperature on calendar degradation.
Sustainability 17 05626 g006
Figure 7. The 24-h charging and discharging price curves.
Sustainability 17 05626 g007
Figure 8. Annual battery degradation cost breakdown.
Sustainability 17 05626 g008
Figure 9. Composition of battery life-cycle cost.
Sustainability 17 05626 g009
Figure 10. Battery degradation analysis with driving distance distribution.
Sustainability 17 05626 g010
Figure 11. V2G revenue comparison across regions (0–10 years).
Sustainability 17 05626 g011
Figure 12. V2G net revenue analysis (including battery cycle degradation).
Sustainability 17 05626 g012
Figure 13. Cycle cost sensitivity analysis.
Sustainability 17 05626 g013
Figure 14. V2G economic break-even points and mainstream vehicle model distribution.
Sustainability 17 05626 g014
Figure 15. V2G economic break-even analysis of Tesla Model Y.
Sustainability 17 05626 g015
Table 1. Parameter values and units.
ParameterValueUnit
a−7.4066 × 10−71/(K2·Ah)
b4.413 × 10−41/(K·Ah)
c−0.06561/Ah
d−6.7 × 10⁻³¹/(K·C-rate)
e2.351/C-rate
f41291/day1/2
Disclaimer/Publisher’s Note: The statements, opinions and data contained in all publications are solely those of the individual author(s) and contributor(s) and not of MDPI and/or the editor(s). MDPI and/or the editor(s) disclaim responsibility for any injury to people or property resulting from any ideas, methods, instructions or products referred to in the content.

