Article

A Novel Study for Machine-Learning-Based Ship Energy Demand Forecasting in Container Port

Department of Maritime Transportation and Management Engineering, Zonguldak Bülent Ecevit University, Zonguldak 67300, Turkey
Sustainability 2025, 17(12), 5612; https://doi.org/10.3390/su17125612
Submission received: 26 May 2025 / Revised: 12 June 2025 / Accepted: 16 June 2025 / Published: 18 June 2025
(This article belongs to the Special Issue Sustainable Fuel, Carbon Emission and Sustainable Green Energy)

Abstract

:
Maritime transportation is crucial for global trade, yet it is a significant source of emissions. This study aims to enhance the operational efficiency and sustainability of container ports by accurately estimating energy needs. Analyzing data from 440 ships visiting a container port within a year, including parameters such as main engine (ME) power, auxiliary engine (AE) power, gross registered tonnage (GRT), twenty-foot equivalent unit (TEU), and hoteling time, regression analysis techniques were employed within MATLAB’s Regression Learner App. The model predicted future energy demands with an accuracy of 82%, providing a robust framework for energy management and infrastructure investment. The strategic planning based on these predictions supports sustainability goals and enhances energy supply reliability. The study highlights the dual benefit for port and ship owners in precise energy need assessments, enabling cost-effective energy management. This research offers valuable insights for stakeholders, paving the way for greener and more efficient port operations.

1. Introduction

Maritime transportation is the most efficient and cost-effective method for transportation [1,2], which also accounts for greater than 80% of global trade [3]. The global economy, the global supply chain, and the rise of trade all benefit enormously from the vast scale of maritime transport. Despite its important contribution to international trade and logistics operations and its recognition as the most environmentally friendly mode of transport, the shipping sector is one of the world’s largest sources of emissions due to its market dominance and ever-expanding fleet. According to the current scenario, maritime transportation emissions, which have surged as a result of the recent spectacular expansion in international trade, are anticipated to rise by 50% to 250% [4,5].
The main hubs of economic activity are ports, which serve as an essential and significant node in the management of the global supply chain [6,7]. Determining the importance of ports in a maritime transport network is necessary and important, especially for reducing global warming and air pollution. Accordingly, ports play a key role in emission reduction, and this role is constantly expanding [8]. Increasing port production and trade volumes have led to high energy consumption and high pollution levels, having a notable negative effect on oceanic and land ecosystems [9]. The issue of air quality has been the most important environmental priority in the port sector since 2013, according to the European Sea Ports Organisation [10].
In ports close to cities and densely populated areas, the impact of pollution from port emissions on the environment and human health is significant [11]. Air pollution contributes to the deaths of nine million people worldwide per year from heart disease, lung cancer, chronic obstructive pulmonary disease, stroke, and acute respiratory infections [12]. Extreme weather events and other natural disasters will become more frequent if average surface temperatures rise by more than 1.5 °C, according to the Intergovernmental Panel on Climate Change [13]. Since the Industrial Revolution, the world’s climate has been changing at an unprecedented level [14].
A useful way of reducing air pollution is to categorize port emission sources. In this context, there are many studies that identify emission sources and produce mitigation policies specific to these sources [15,16,17,18,19,20,21]. Ship-borne emissions and their mitigation are more commonly addressed in the literature than other emission sources in ports [22,23,24]. However, cargo handling equipment (CHE), which is one of the other emission sources, plays an important role in port emissions [25,26,27]. Other sources of emissions are heavy duty vehicles (HDVs) and locomotives that distribute cargo on land [28,29,30].
Emissions in port regions can be reduced through specific measures that ships and ports can take. Technical measures that ships can implement include waste heat recovery and high-efficiency propellers; operational measures such as speed reduction; clean fuels such as LNG and hydrogen; and alternative power sources such as fuel cells and renewable energy sources [31,32,33]. Ports can use operational methods such as cold ironing, automated mooring systems, berth allocation, port–city integration, and pollution reduction for vehicles, forklifts, and cranes [19,34,35]. They can also use smart grids and micro-grids. Other ship–port interface methods include cold ironing, speed reduction, and reduced vessel turnaround time [36,37]. In addition, machine learning algorithms are used in ports for emission estimation and reduction [38,39,40].
Ships require electricity to power various systems such as lighting, ventilation, cooling, heating, communication, and cargo operations [41]. The power demand of ships can range from a few kilowatts to tens of megawatts, depending on their activities and dimensions. Ships generate the necessary electricity by utilizing fossil fuels to power their auxiliary engines. Fossil fuel consumption exacerbates air pollution [42,43]. Cold ironing (CI) is a power technology that allows ships to utilize shore power rather than their auxiliary engines while they are berthed for hoteling periods. The CI system’s objective is to mitigate greenhouse gas emissions. Carbon intensity has a beneficial impact on public health due to its ability to decrease emissions in ports situated near densely populated coastlines [44]. The power source for the CI system is supplied by the national grid, renewable energy sources, or alternative fuels [45,46]. The environmental and economic feasibility of the CI system depends on the emissions of the national power grid and the electricity tariffs of each country [47,48]. Hence, ports could anticipate economic and environmental consequences through exploratory research prior to making investments in the system.
This study calculated the energy demand of 440 ships visiting a container port. Identifying energy needs provides stakeholders with a strategic framework for addressing these requirements. The energy demand at full capacity can be assessed by evaluating the ratio of energy needs to the port’s utilization capacity. This approach enables the precise determination of the necessary scale of port investments. By aligning investment decisions with energy demand metrics, ports can ensure optimal resource allocation and enhance operational efficiency. In addition, the study also estimates the current energy demand of a container port based on the ships visiting the port annually, using information on ME power, AE power, hoteling time, GRT, and TEU for energy demand forecasting, and presents a forecasting model for the future in light of this information.
The forecast information is highly valuable for port and ship owners. When ship owners accurately determine their energy needs during port operations, they can conduct cost analyses based on two different scenarios. Firstly, if the ship utilizes shore power, they can calculate the required amount of electricity and its associated costs. Secondly, if the energy needs are met through conventional auxiliary engines, they can determine the amount of fuel required and the corresponding fuel costs. These assessments are crucial for effective energy management and cost optimization. Estimating energy needs is also beneficial for ports. If the energy required by ships is to be supplied by the port, the energy management system can be strategically planned based on the anticipated arrival of ships. This allows for the efficient provision of energy from various sources, including the national grid, alternative fuels, or renewable energy sources. By aligning energy supply with demand, ports can optimize resource use and enhance sustainability in their operations.
The remainder of this article is structured as follows. Section 2 provides a comprehensive review of the existing literature on port-related emissions, mitigation strategies, energy demand forecasting, and the application of machine learning within maritime sustainability efforts. Section 3 outlines the data collection process, including the characteristics of 440 ships visiting a container port. Section 4 details the methodological framework, describing the regression-based modeling approach developed to estimate ship-level energy demand using MATLAB’s Regression Learner App. Section 5 presents the results of the predictive analysis, highlighting model performance and estimation accuracy. Section 6 discusses the broader implications of the findings in terms of energy planning, operational efficiency, and environmental sustainability for ports. Finally, Section 7 concludes the study by summarizing the key insights and offering suggestions for future research directions to expand the applicability of the model and address existing limitations.

2. Literature Review

Ports play a central role in the global supply chain but are also hotspots of air pollution due to the concentration of ship activity, cargo handling equipment (CHE), and land-based transport operations. Especially in ports located near densely populated areas, emissions have become a critical concern due to their direct impact on public health and local ecosystems. As a response, various mitigation strategies have been developed, targeting both ship-related and port-related sources. Technological improvements such as cold ironing, fuel cells, and energy-efficient propulsion systems have been proposed alongside operational measures like berth scheduling, smart grid integration, and cleaner cargo operations [19,41]. These measures collectively aim to reduce the carbon footprint of port activities and contribute to sustainable port development.
A variety of forecasting studies have been conducted in the maritime sector, encompassing diverse applications and employing numerous approaches, including data-driven strategies. The data-driven method is a potent approach to statistical pattern identification that utilizes a dataset to provide highly accurate predictions [46]. Yu et al. [49] estimated emissions using the stochastic impacts using a regression on population, affluence, and technology (STIRPAT); a long short-term memory (LSTM) network; and an autoregressive integrated moving average with explanatory variable (ARIMAX) model, taking into account visiting vessels, cargo handled in the past, and past carbon emissions. In addition, five machine learning models, including a gradient boosting regression (GBR), random forest regression (RF), BP network (BP), liner regression (LR), and K-nearest neighbor regression (KNN), were used to predict the energy demand from the characteristics of the arrival ships with an accuracy of 94% [50]. Predicting the energy demand and emissions from ships is also essential for determining the ways to be followed to reduce related emissions and ensure energy efficiency [30]. In this way, prediction methodologies will be able to bring ports to the forefront on the way to greener ports [51,52,53].
In addition to the estimation of the current situation, it is also necessary to create various scenarios and include them in the estimation methodology to increase emission reductions and energy efficiency [54]. In this context, Liu et al. [55] have analyzed the current ship traffic in various major ports of the world and have shown, with the help of a time series, how much emissions can be reduced with the help of alternative fuels.
While mitigation efforts and emission forecasting play a central role in sustainable port development, the implementation of a functional energy management system is equally critical. Such systems integrate energy demand forecasting, supply planning, and smart operational controls to balance consumption and resource availability [56,57]. Accurate estimations of energy usage are essential for deploying these systems effectively. However, in many ports, energy data is either based on simplified calculations or subjective assumptions, which limits our ability to pinpoint inefficiencies or evaluate the impact of energy-saving technologies [58]. Without precise consumption data, it becomes difficult to assess the carbon footprint of port operations or design context-specific efficiency measures. Although real-time monitoring systems can enhance responsiveness and adaptability, they often require costly infrastructure such as smart meters and digital energy management platforms. Therefore, data-driven forecasting approaches, such as the one proposed in this study, offer a cost-effective and scalable alternative for supporting smart energy management in ports.
Although the recent literature demonstrates a growing interest in applying machine learning to maritime emissions forecasting, there remains a notable lack of studies focusing specifically on the prediction of ship-level energy consumption during hoteling periods in ports. This gap is particularly relevant in the context of infrastructure planning for onshore power supply and energy management systems. The present study addresses this shortcoming by developing a machine-learning-based energy demand model grounded in real operational ship data. By doing so, it contributes to a more precise, operationally applicable framework that supports ports in aligning sustainability goals with data-informed decision making.

3. Data Collection

The area of Izmit Bay is characterized by extensive industrialization, leading to significant air pollution that affects a population of about 17 million people residing in Istanbul and Kocaeli Province [59]. This specific port was selected due to its strategic location in one of Turkey’s most industrialized and densely populated regions, where port-related emissions pose a critical risk to air quality and public health. The geographical location of this area is illustrated in Figure 1 to provide spatial context. Unlike alternative ports with limited traffic or insufficient data availability, the selected port offers a high volume of vessel activity and diverse ship profiles, providing a robust dataset for developing and validating energy demand prediction models. Additionally, the existence of cooperative communication with local ship agents ensured reliable access to technical data, which would have been more difficult to obtain in other regions. For this reason, a container port located in this region was preferred. In the study, the ship names and the duration of the ships’ stay in the port were taken from the official website of the port. However, due to commercial concerns, it was requested by the port manager not to share the port’s name. Information on the gross tonnage (GRT), twenty-foot equivalent unit (TEU), main engine (ME) power, and auxiliary engine (AE) power of the ships were obtained from the agents of the ships in the port.
A total of 440 ships visited the container port between 1 January 2023 and 31 December 2023. Vessel characteristics and hoteling times are given in Table 1. This information was used to determine the input part of the study and to provide the energy requirement.

4. Methodology

In the study, the energy needs of ships in the port were first identified. Then, they were estimated based on different parameters. In this context, it was possible to determine the energy supply of the port providing energy to the ships in line with the information of the ships visiting the port. A flowchart of the study is illustrated in Figure 2.

4.1. Energy Demand of Ships in Port

The ships utilize their auxiliary engines to meet their energy demand in the port. So, the determination of the energy demand depends on the auxiliary engine that meets the energy requirement of the ship in the port and the load factor of the engine. The energy demand equation is presented in Equation (1).
E g = t h . A E k W . L F A E %
A E k W represents the auxiliary engine power in kilowatts, and   L F A E represents the load factor in percentage. t(h) is the duration of the ship’s hoteling in the port in hours. The energy demand calculated for each ship is included in the estimation methodology as output in the study.

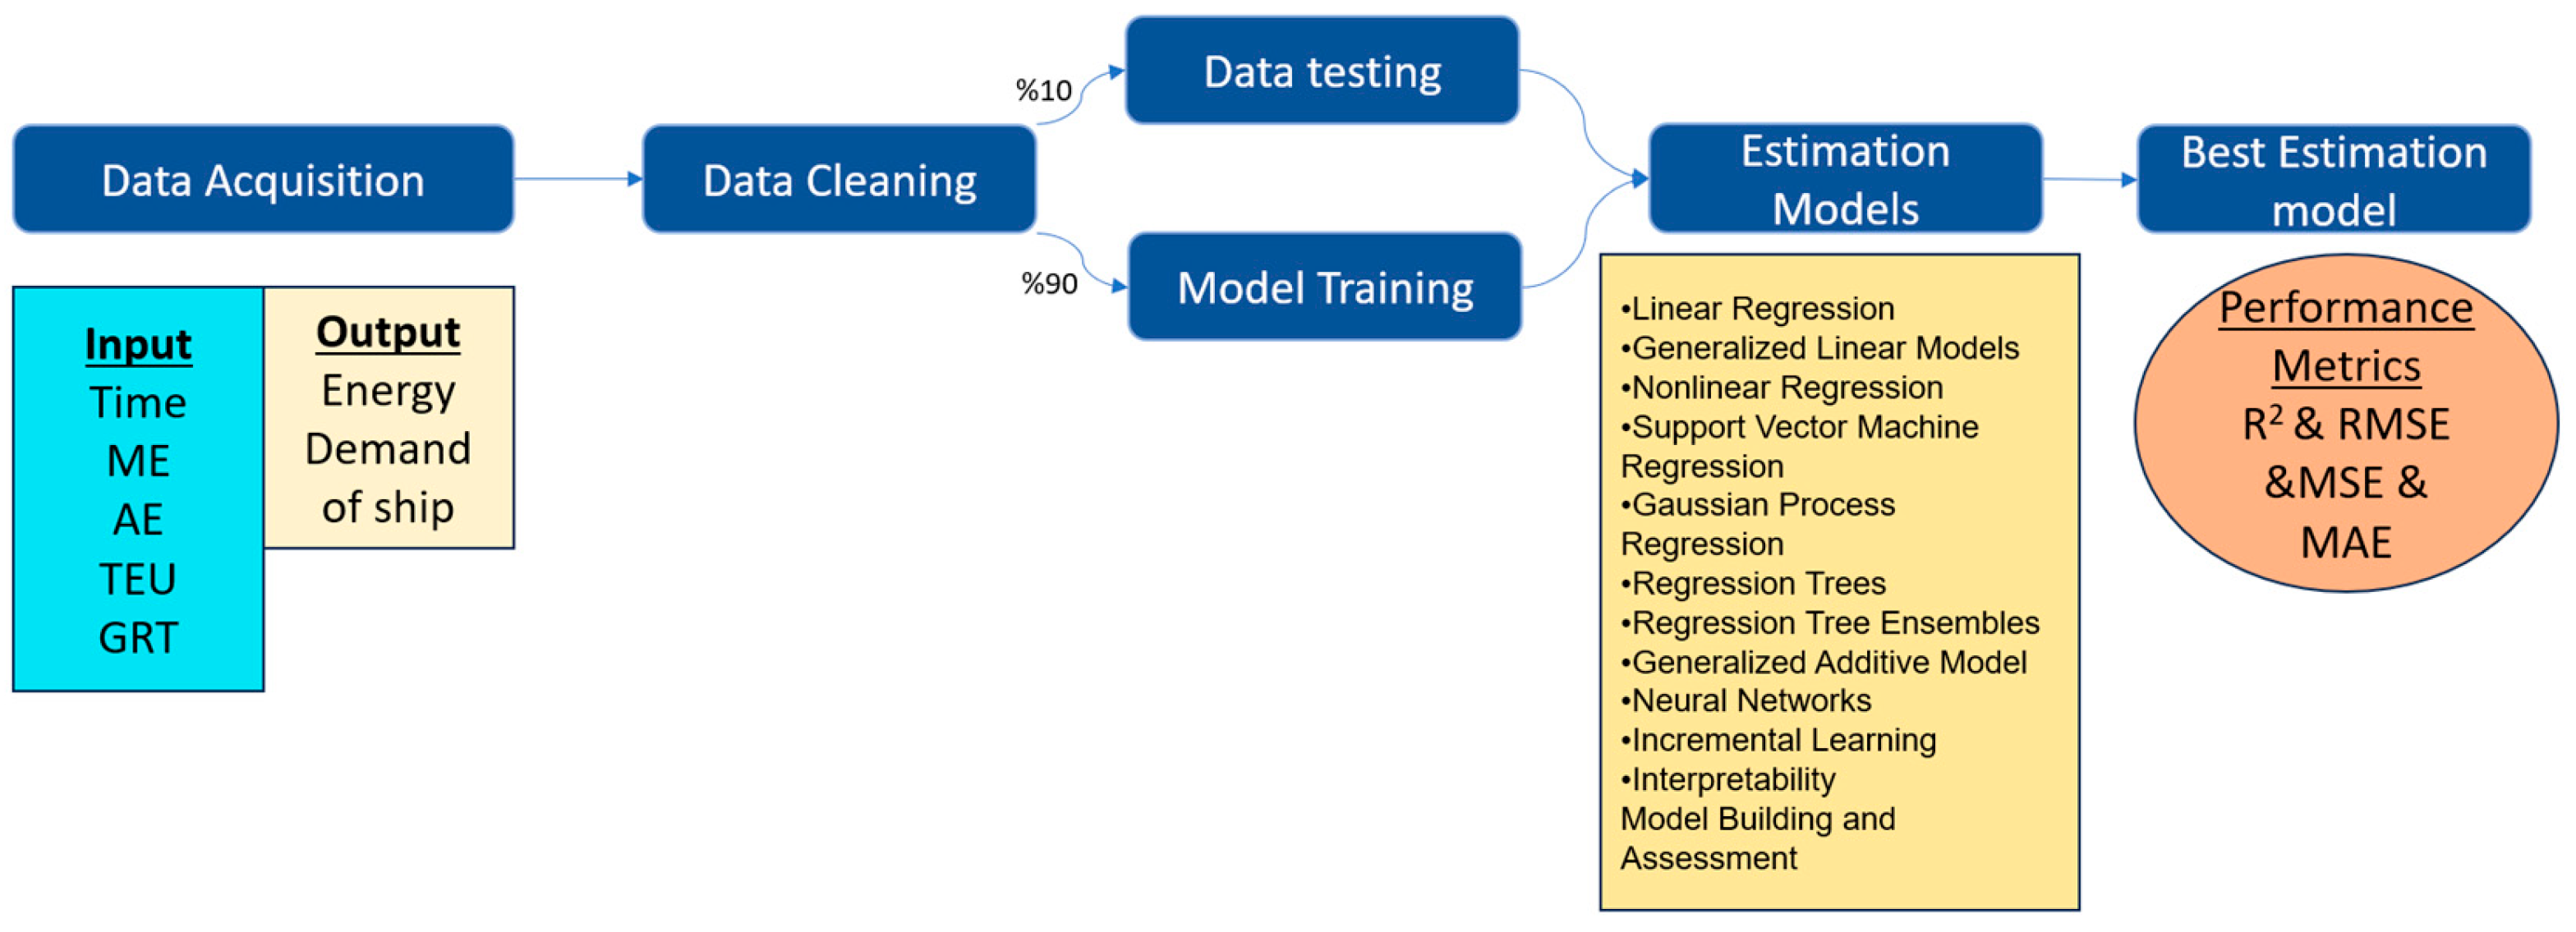
4.2. Prediction Methodology

Artificial intelligence technologies, programming languages, and software enable the use of regression analysis, artificial neural networks, and median polishing algorithms to predict future years based on past years’ data [60,61,62]. In addition, the estimation of certain outputs with the help of various inputs is one of the preferred estimation methods in the maritime field [63,64,65]. This study employed the regression analysis technique using the Regression Learner App of MATLAB R2024a’s Statistics and Machine Learning Toolbox to forecast the energy demand of ships in the port. Regression analysis is a statistical method used to succinctly describe the connection between a certain variable and one or more variables that are anticipated to influence it. Regression models elucidate the correlation between a dependent variable and one or more independent variables. The flowchart utilized in the development of the regression model is depicted in Figure 3.
Data such as the length overall (LOA), ship width, and ship age was excluded from the input part since meaningful results could not be obtained. From the collected data, the values of ships’ time in port, ME power, AE power, TEU, and GRT, which produce statistically significant results, are integrated into the system as input. In addition, the energy requirements of the ships calculated in the previous section constitute the output part of our prediction algorithm.
The inputs and outputs were identified by labelling in the Regression Learner App of MATLAB R2024a’s Statistics and Machine Learning Toolbox. Afterwards, the “Model Type” component of the Regression Learner program presents many models including linear regressions, regression trees, support vector machines, Gaussian process regression models, ensemble learning methods, and their respective sub-methods.
Prior to model training, all input and output variables were automatically normalized by MATLAB’s Regression Learner App. Normalization is a common preprocessing step that scales numerical data into a standard range, typically around a mean of zero. As a result, most values observed in the prediction plots appear within the range of approximately −0.5 to 0.5. This transformation ensures comparability across variables and improves model performance during training.
This application enables simultaneous testing of all models, automatic training of several models, and identification of the best appropriate model for prediction. In the study, we conducted a comprehensive evaluation of all models and examined the regression models to determine their suitability. This evaluation involved analyzing the margins of error that arose during the training process. For instance, the choice of the prediction model that was developed using the Regression Learner App can be seen in Figure 4.
RMSE (root mean square error) and R2 (R-squared) are terms that are encountered in the evaluation of errors. The root mean square error (RMSE) is a statistical measure that quantifies the standard deviation of the prediction mistakes in a machine learning model. It demonstrates the level of data concentration around the line of best fit. As the RMSE value approaches 0, it signifies a decrease in inaccuracy of the estimation.
The coefficient of determination (R2) represents the fraction of the variability in the dependent variable that can be accurately predicted by the independent variable(s). A higher value of R2 (max of 1) indicates a stronger match between the data and the model.
I exported the most compatible regression models with our datasets and made the desired prediction with Equation (2) for this model.
y f i t = t r a i n e d M o d e l . p r e d i c t F c n ( T )
yfit: Estimated values to be found;
trainedModel: Exported regression model;
predictFcn: Predict command;
T: Data to be estimated.
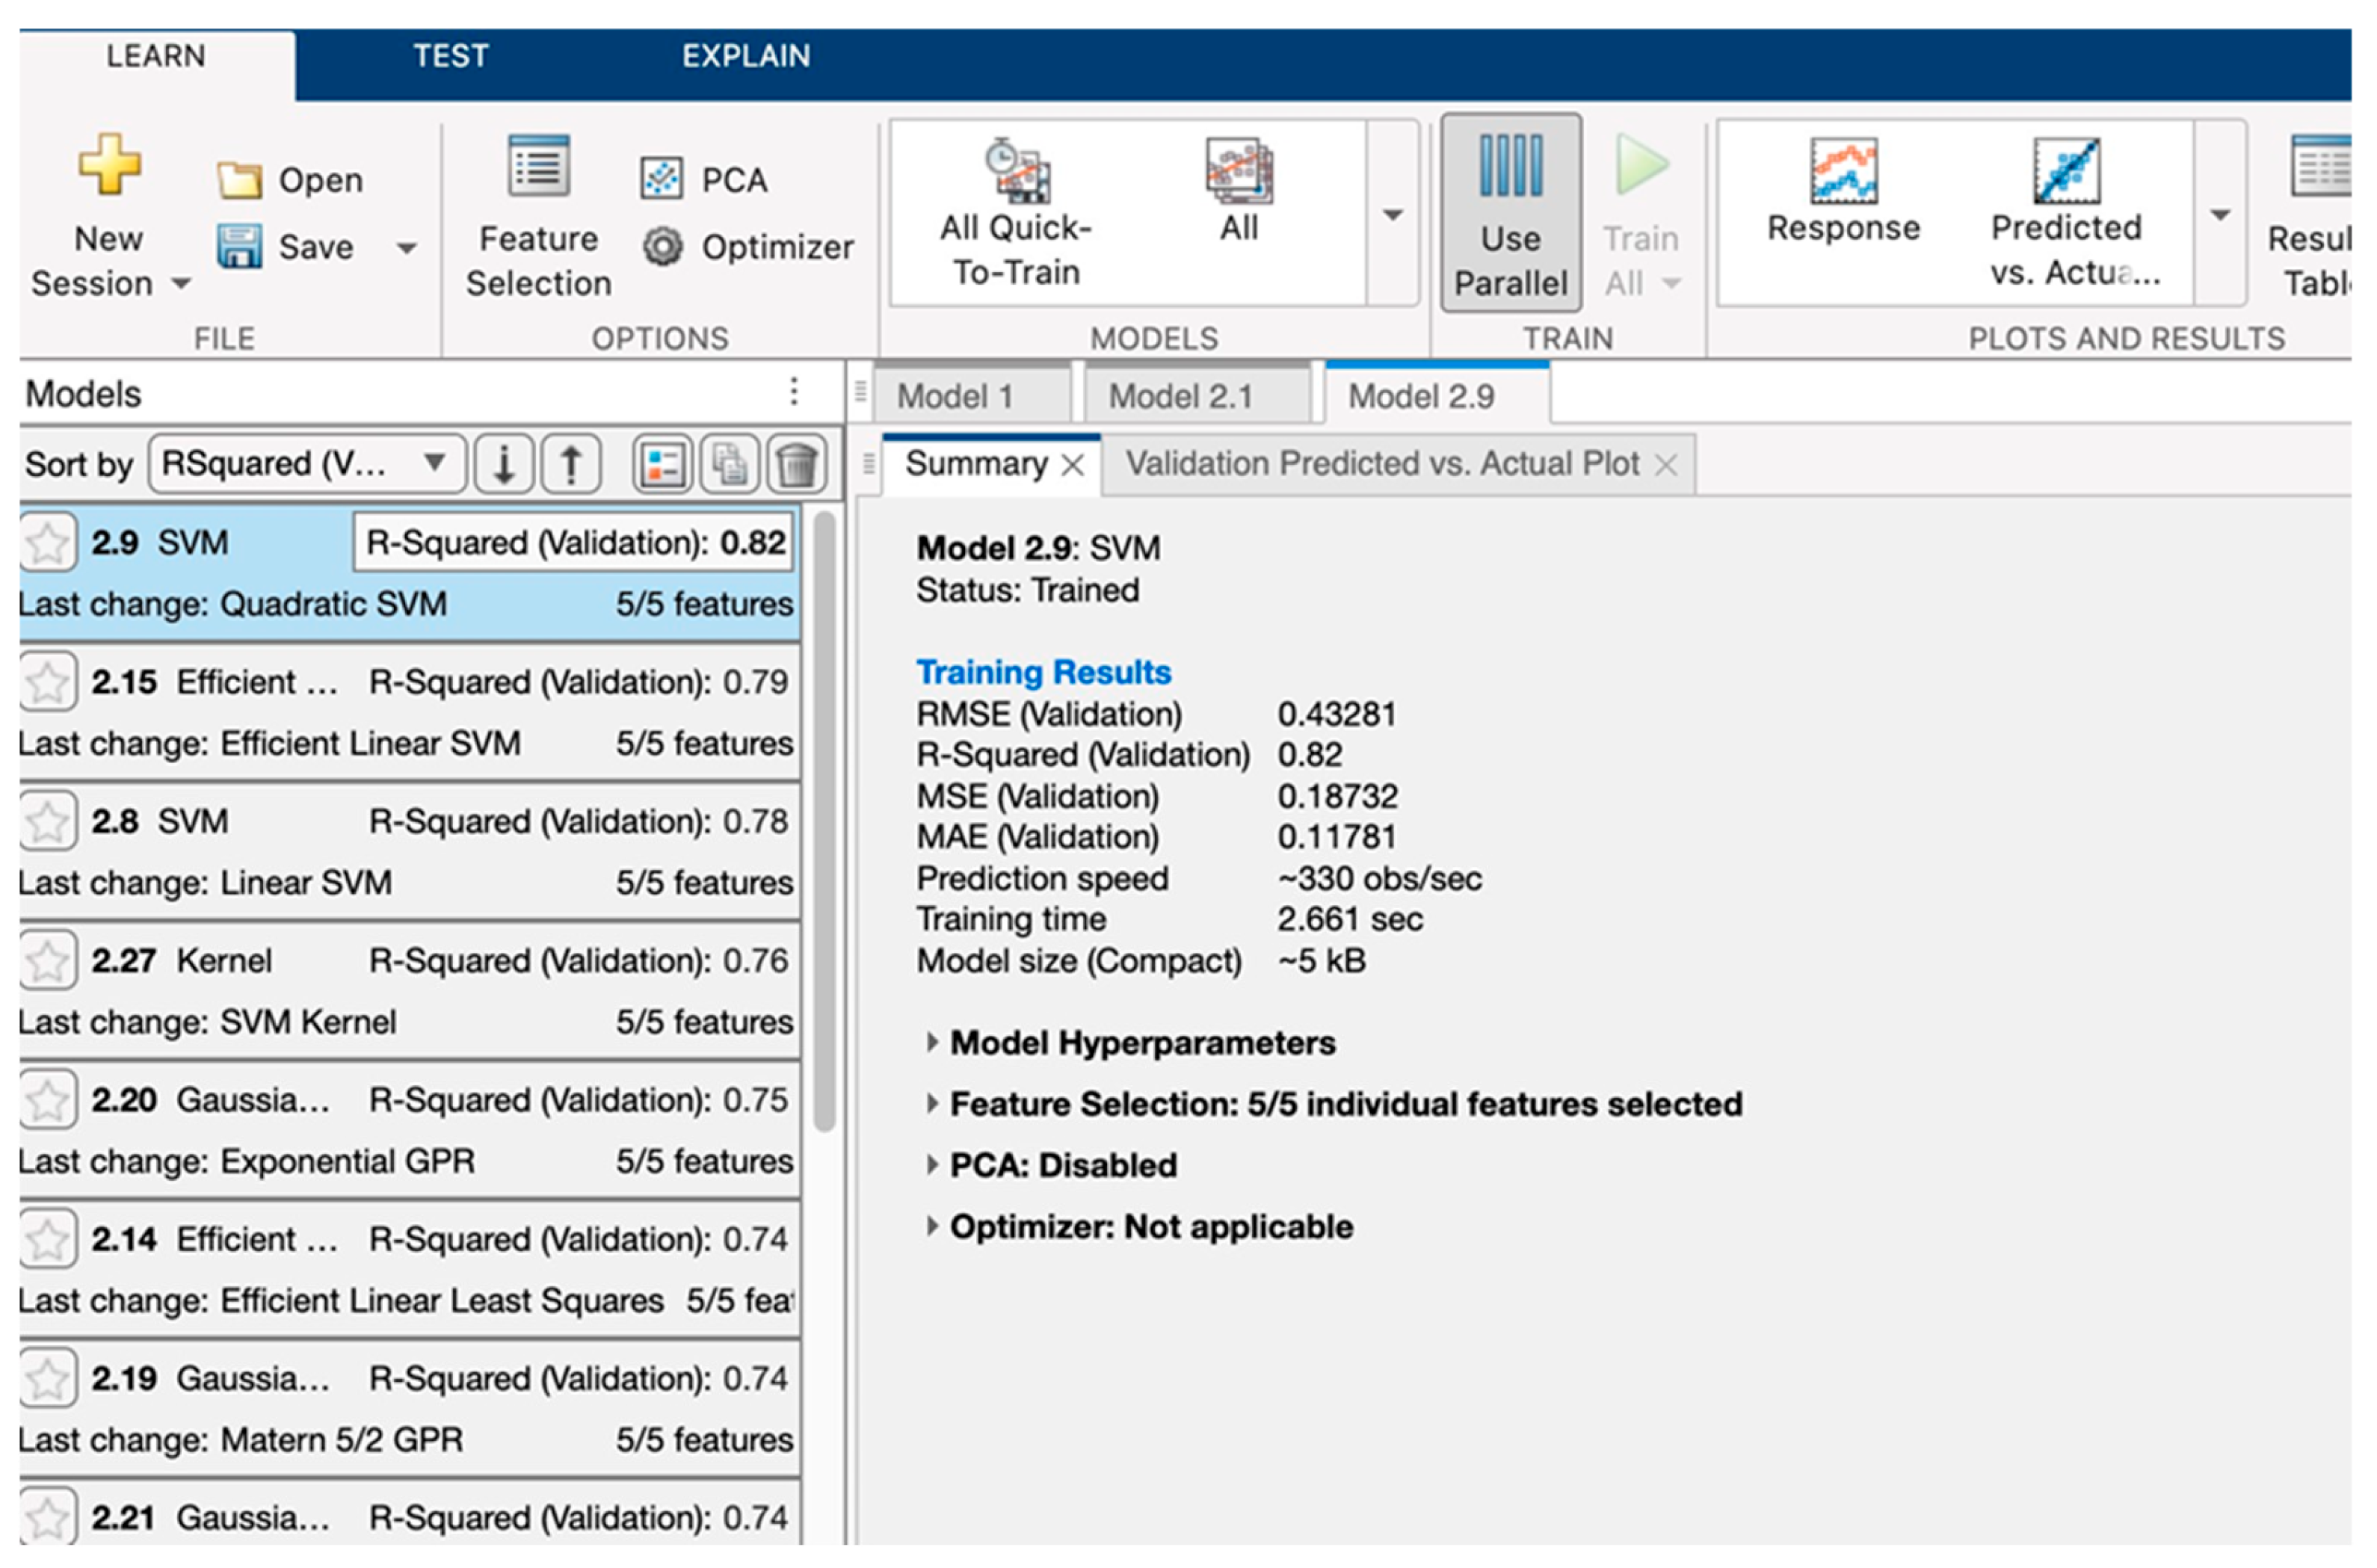
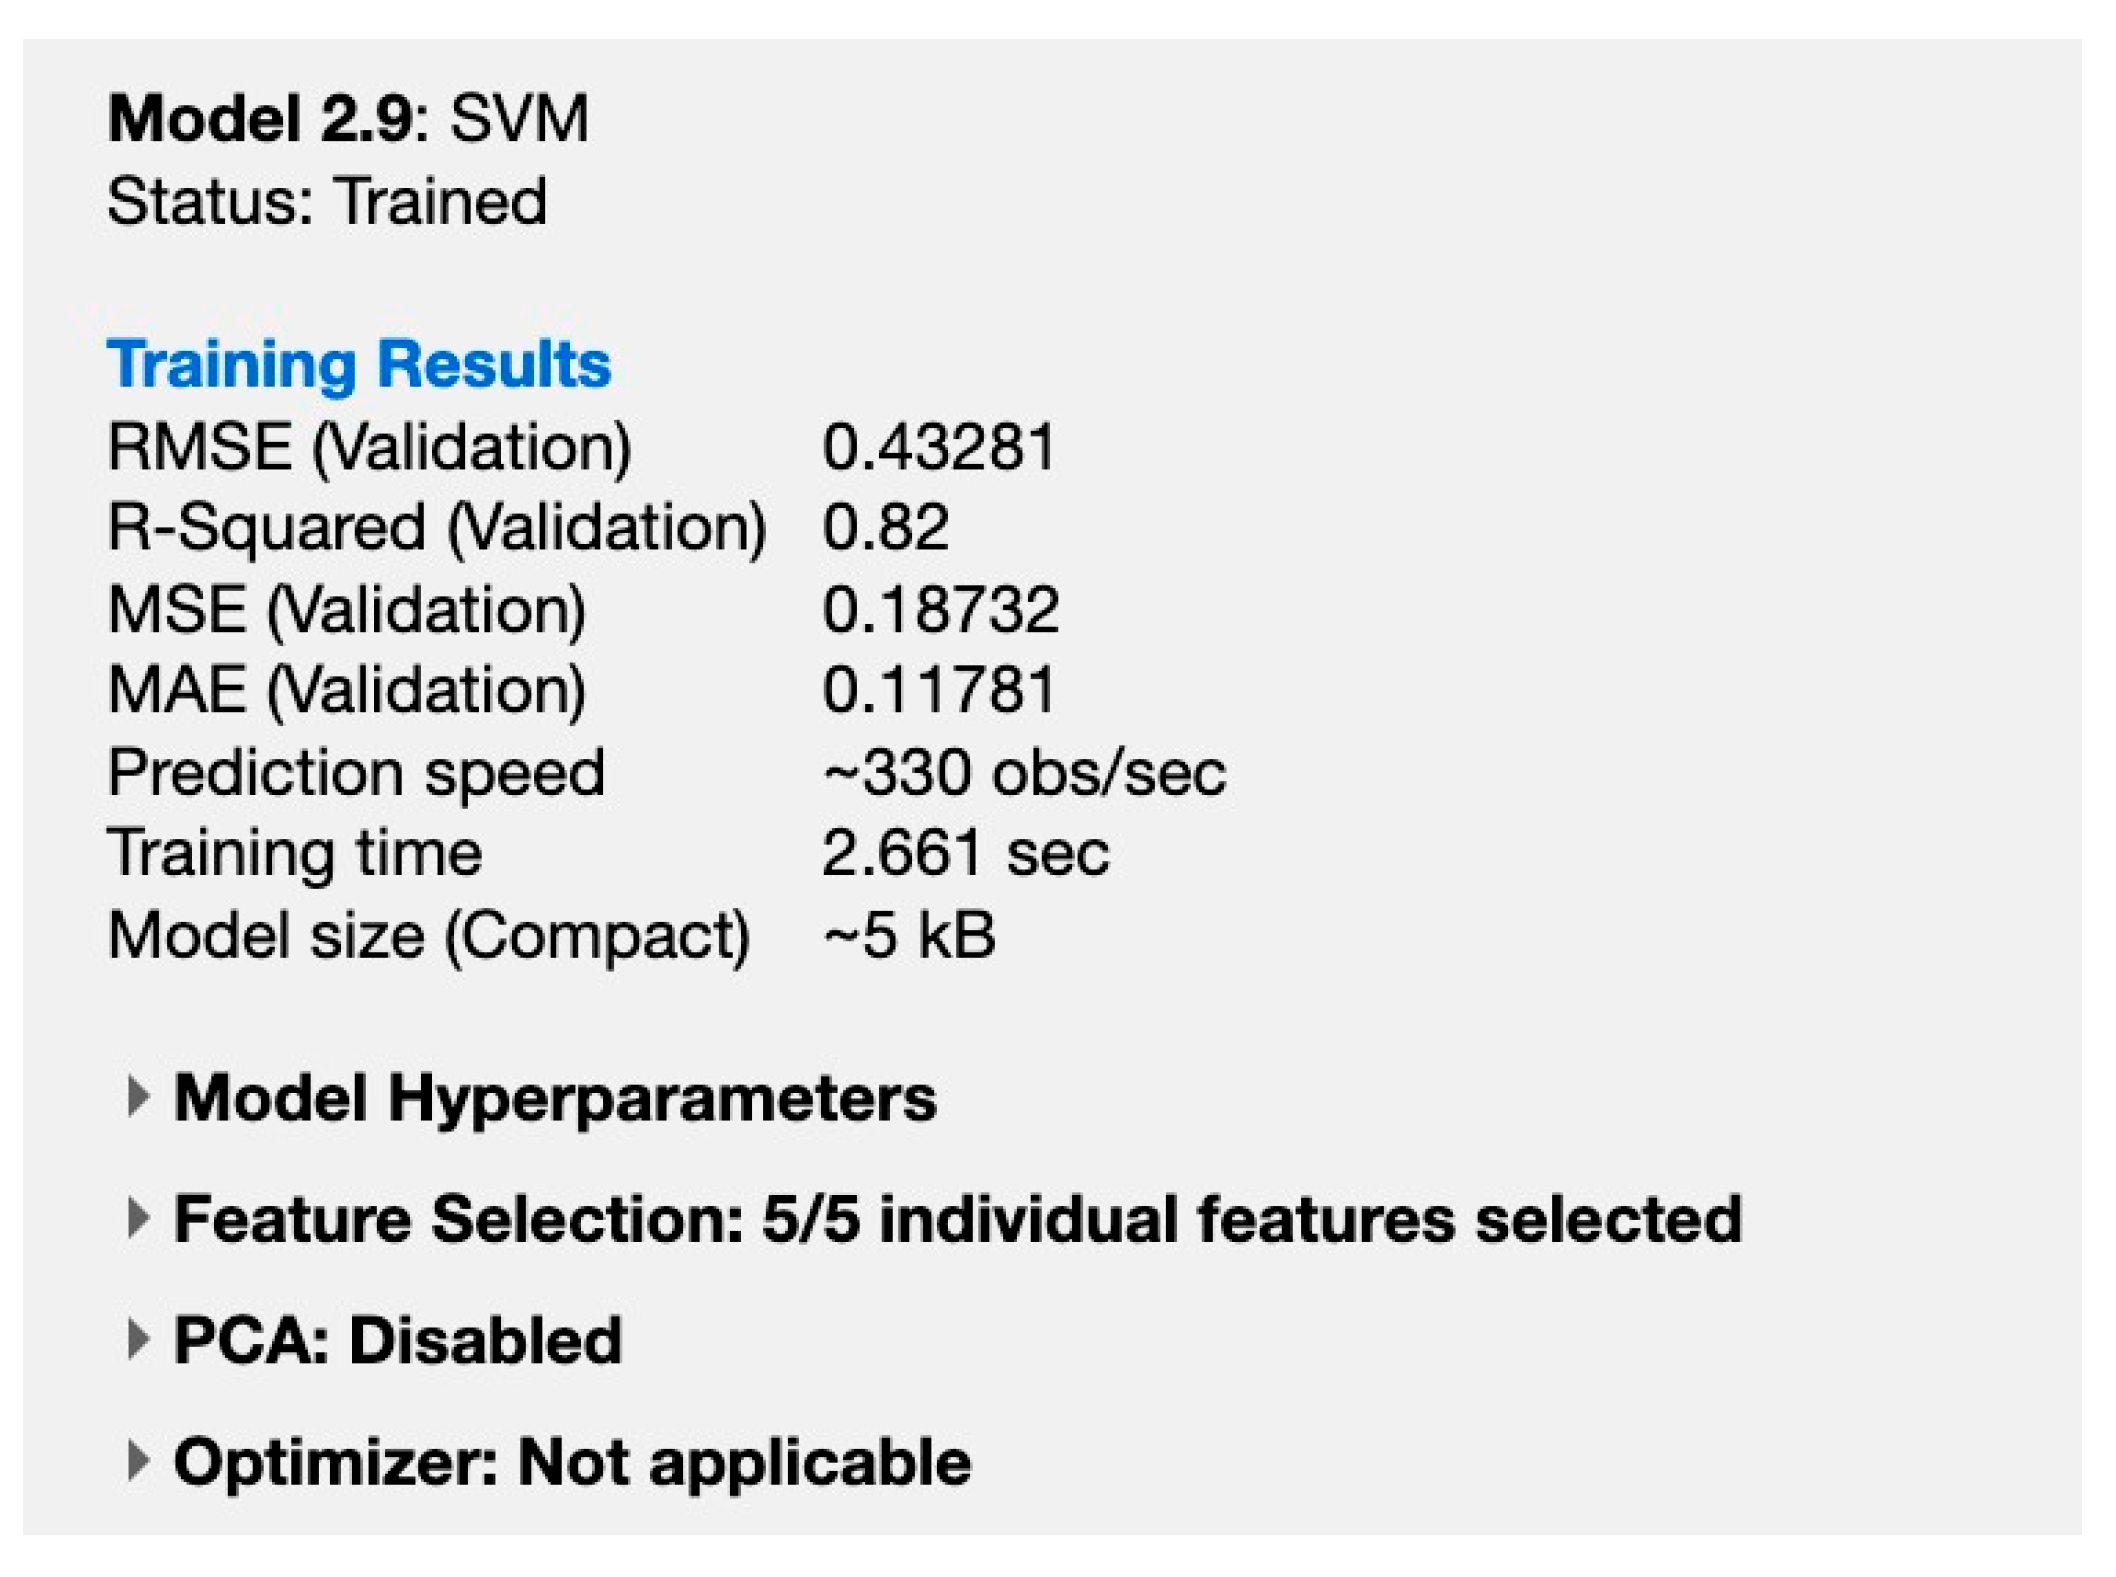
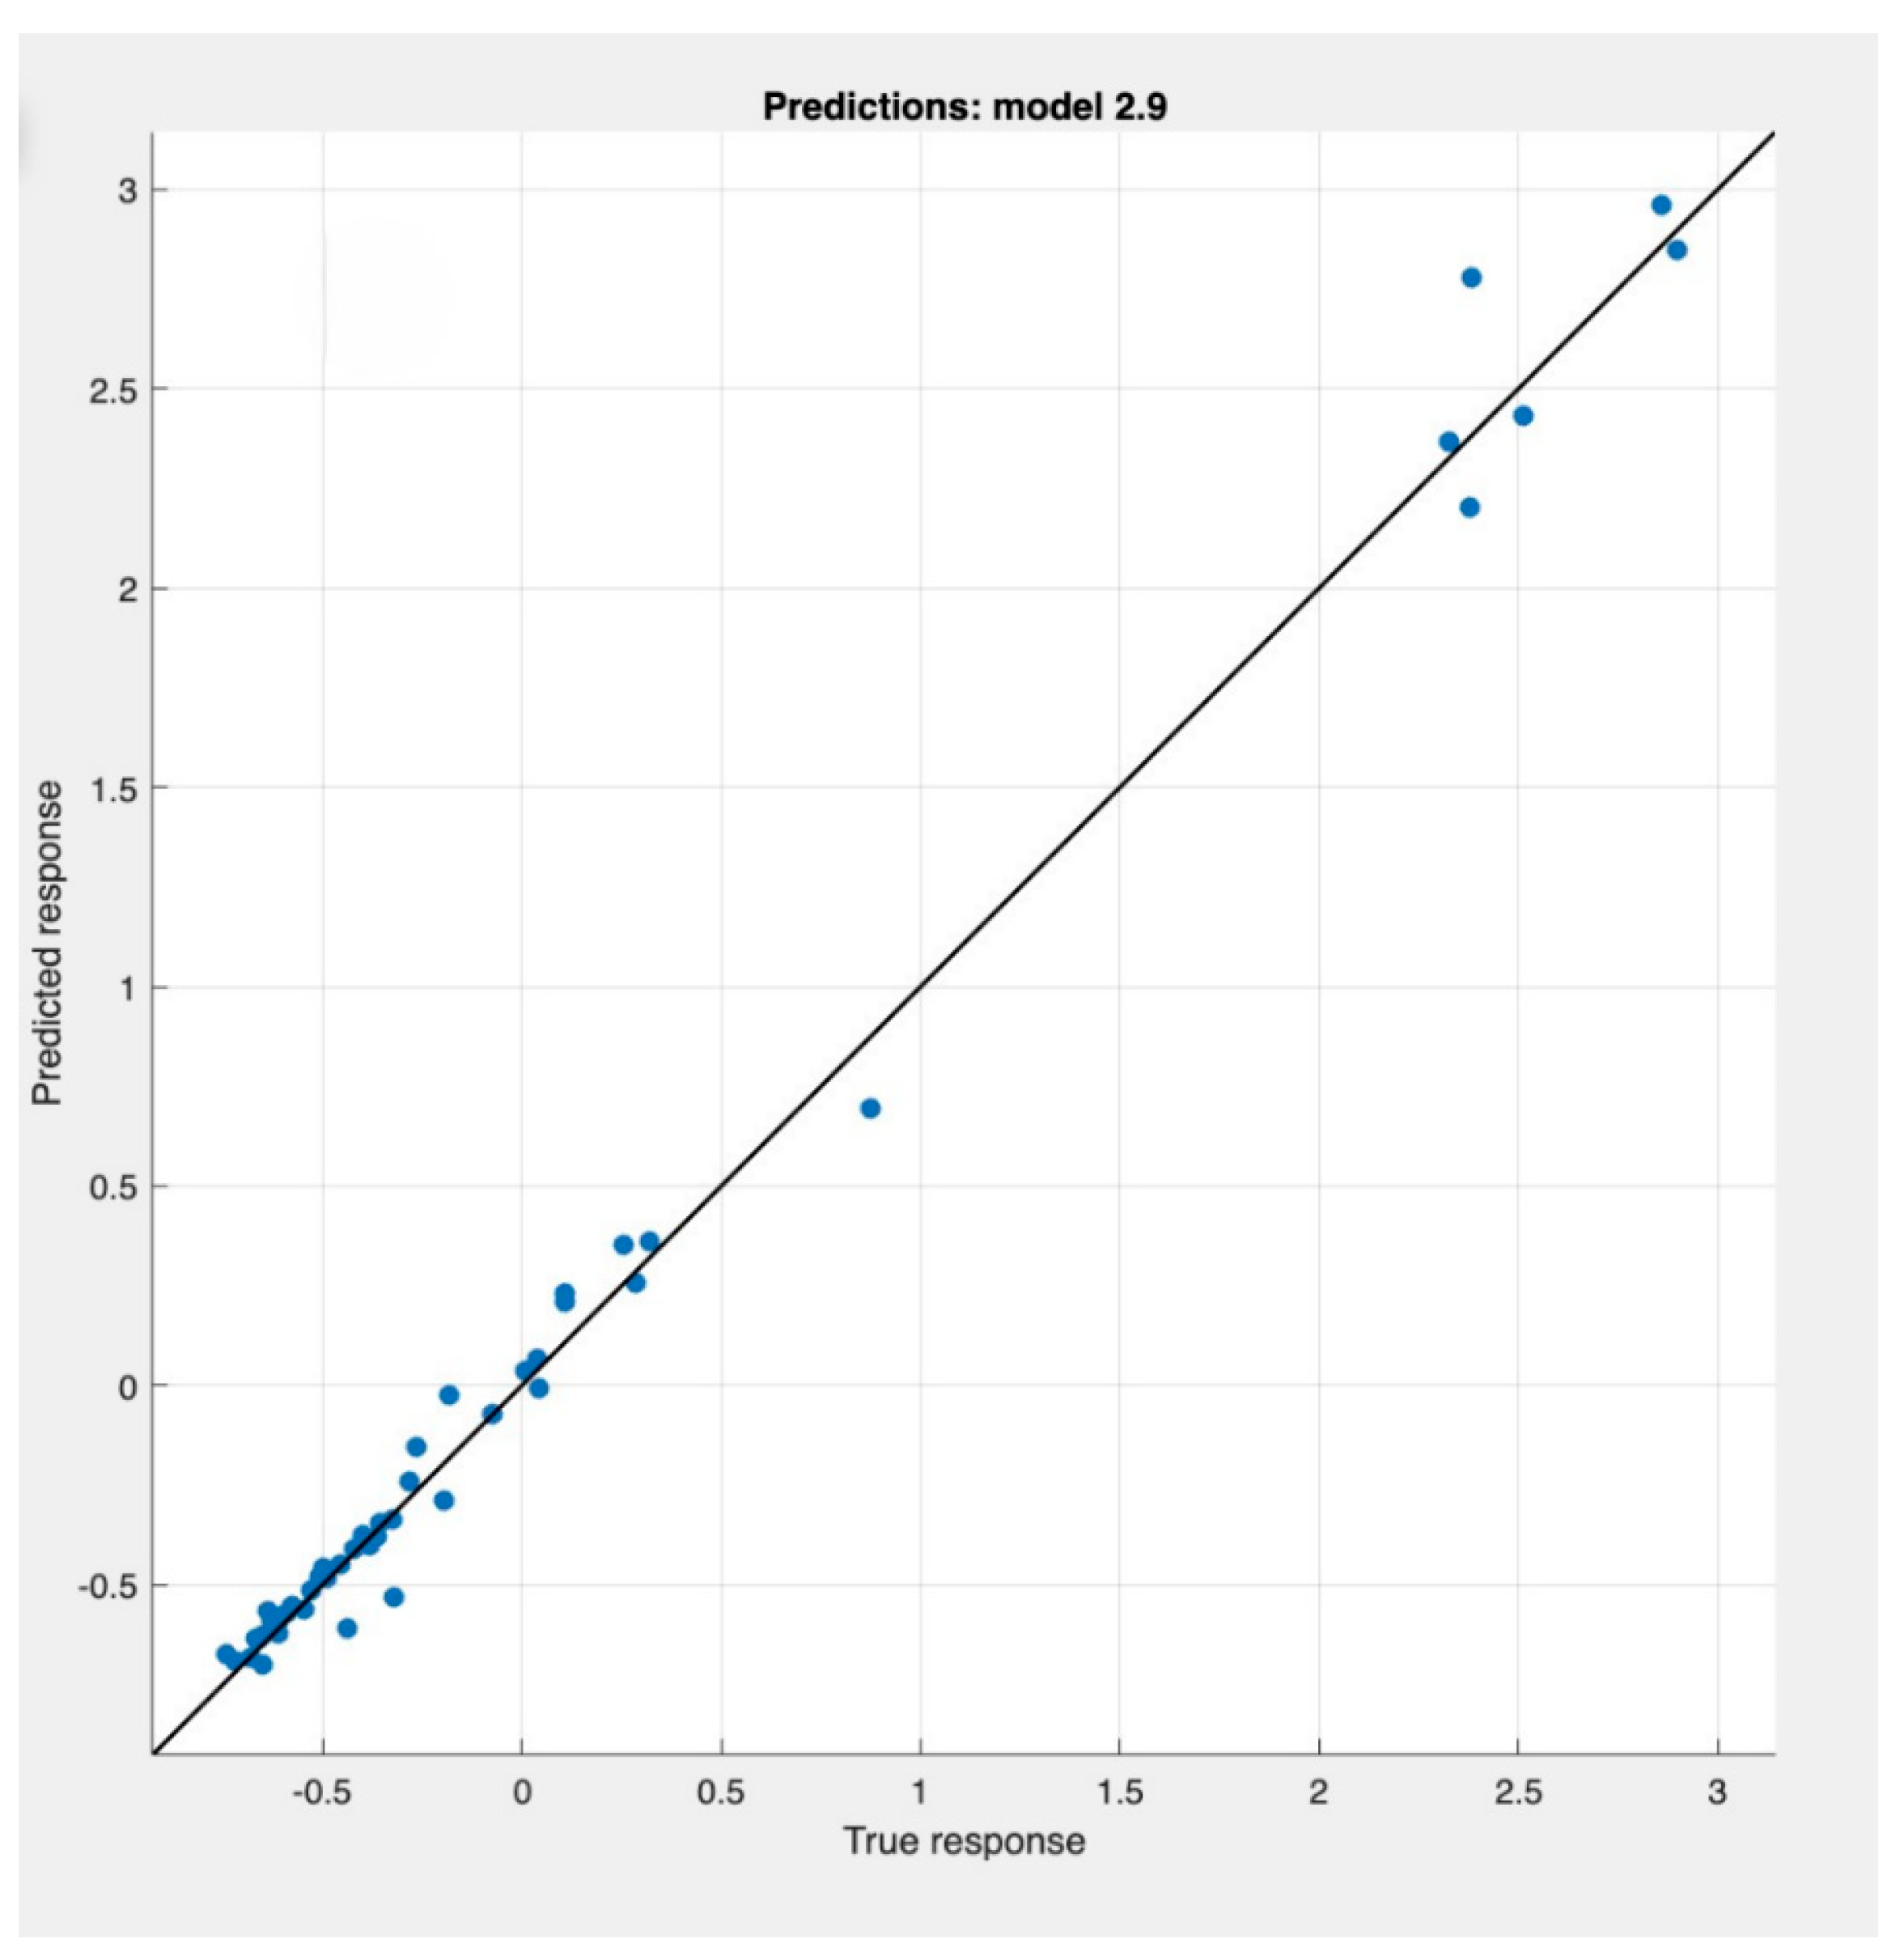
5. Results

In our study, we first calculated the individual energy requirements of 440 ships visiting in 2023. As a result of these calculations, it was determined that the annual energy requirement is 36,667,349 kW. In Table 2, in addition to the average data, the resulting average energy requirements are also shown.
The engine power and, accordingly, the energy requirement increase with ship size. Ships over 80,000 GRT stay in the port approximately twice as long as the other ship types. In this way, the energy demand increases. It is understood that the energy demand, which is directly proportional to the ship size, machine power, and duration of stay, increases exponentially.
With the ‘Regression Learner Application’ in MATLAB R2024a, we determined the most appropriate models for energy demand forecasts by taking into account the error values. The regression models and error values are given in Figure 5.
A quadratic support vector machine was the model that produced the most appropriate values for the inputs and output. The model can make predictions with an 82% accuracy. To assess the accuracy of the prediction models, error measures such as the mean squared error, mean absolute error, and coefficient of determination were also considered. Furthermore, the ‘response and predicted-actual plots’ of the appropriate regression model determined for the energy demand forecasts of the model are shown in Figure 6.

6. Discussion

The accurate forecasting of ship energy demand plays a pivotal role in enhancing the operational and environmental performance of container ports. This study demonstrates that machine-learning-based models, particularly a quadratic support vector machine, can predict port-side energy needs with a high accuracy (82%) using ship-specific features such as auxiliary engine power, gross tonnage, and hoteling time. These findings align with previous research that emphasizes the benefits of predictive modeling for port electrification strategies, including cold ironing and microgrid integration [66]. A recent comparative study by Micallef et al. (2025) also highlighted the effectiveness of random forest and Gaussian process regressions in forecasting electricity demand in port microgrids, achieving similar or higher accuracies depending on the feature set and forecast setup employed [67].
By applying a data-driven approach to 440 ship calls at a highly industrialized container port in Izmit Bay, this study provides empirical evidence on how predictive analytics can inform infrastructure planning and energy management. Ports are increasingly expected to operate as sustainable energy hubs, and the ability to forecast energy demand precisely enables a better alignment between supply and demand. This, in turn, supports the integration of renewable energy sources, improves grid stability, and reduces the reliance on fossil-fuel-powered auxiliary engines [45,68].
From an operational perspective, the forecasting model enables both port authorities and shipowners to make informed decisions. For port authorities, demand forecasts help optimize energy procurement and distribution strategies, thereby minimizing operational costs and environmental impacts. This proactive approach aligns with recent findings by Li et al. [69], who highlight that changes in vessel arrivals and port congestion levels have both immediate and lagged effects on emissions, emphasizing the importance of predictive planning to mitigate environmental volatility. For shipowners, access to predicted energy consumption facilitates cost comparisons between cold ironing and traditional fuel use, contributing to better energy budgeting and emissions control [44].
Moreover, this study addresses a gap in the literature by focusing specifically on ship-level energy consumption while hoteling, which is often overlooked in broader emission inventories. While many studies focus on overall port emissions or vessel navigation emissions, relatively few investigate port-specific energy demands using machine learning techniques [70]. Thus, this research contributes novel insights into how artificial intelligence can be practically applied in the maritime sector for environmental and operational optimization. This perspective is further supported by Wang et al. [71], who demonstrated that incorporating shore power (SP) data and accounting for emissions from auxiliary boilers and low-load main engines significantly improve the accuracy of ship-at-berth emission estimates.
Despite its contributions, the study is subject to several limitations. The dataset is limited to one container port, which may restrict the generalizability of the model across different port typologies or regions. In addition, factors such as real-time operational conditions, energy pricing variability, and weather impacts were not included in the model. Another limitation is the lack of data on the number of refrigerated containers handled at the port or present onboard the ships. Since refrigerated containers (reefers) significantly increase energy consumption during hoteling periods, the absence of this variable may have affected the accuracy of the energy demand estimations. These aspects present opportunities for future research to enhance the robustness and adaptability of forecasting models.
In summary, this study advances the maritime literature by presenting a scalable, high-accuracy machine learning model for forecasting ship energy demand at berth. The proposed framework provides practical value for stakeholders aiming to implement energy-efficient and low-emission port operations in alignment with global sustainability goals.

7. Conclusions

This study presents a novel application of machine learning to forecast ship-level energy demand during hoteling periods at a container port. Using real-world data from 440 ship calls and employing regression models via MATLAB’s Regression Learner App, the quadratic support vector machine model achieved an 82% prediction accuracy. This high-performance forecasting framework provides not only operational benefits but also strategic insights for port infrastructure planning and energy management.
From a theoretical perspective, this research advances the application of data-driven methods in maritime energy studies by addressing a critical and often underexplored area: ship-specific energy consumption while at berth. The study contributes to the growing body of literature that integrates machine learning into port sustainability research, demonstrating that predictive analytics can significantly enhance our understanding of port-side energy dynamics. By developing a replicable and scalable methodology for forecasting energy demand based on empirical data, this study lays a foundation for future theoretical models that link port operations with environmental impact reduction strategies.
The study also has clear policy implications. For port authorities and regulatory bodies, accurate energy forecasting enables more informed decision making regarding investments in shore power infrastructure, energy procurement strategies, and emissions reduction targets. Incorporating such models into policy frameworks can support the transition toward greener ports by optimizing the use of renewable energy sources and reducing reliance on fossil-fuel-based auxiliary engines. Additionally, national maritime administrations or regional port authorities can use predictive models like the one suggested here to create common energy efficiency standards and reward programs that promote cold ironing and energy-saving practices for ships. In doing so, these authorities can also assess whether existing port infrastructure can accommodate the high energy demand of cold ironing systems and strategically plan electricity sourcing from national grids, renewable energy, or alternative fuels to ensure reliable power delivery. However, it should also be noted that technical fleet vessels, responsible for waste, sewage, and sludge collection under MARPOL Annexes I, IV, and V, typically operate on conventional petroleum-based fuels and remain outside the scope of shore power systems, which limits the full environmental benefits of cold ironing at ports.
Future research should consider integrating additional variables such as refrigerated container load, weather conditions, and real-time operational dynamics to further improve prediction accuracy. Expanding the model across different port types and geographical regions would also enhance its generalizability and policy relevance.
By bridging operational forecasting with sustainability-oriented port governance, this study offers both academic and practical contributions that support the maritime sector’s global decarbonization and digitalization goals.

Funding

This research received no external funding.

Institutional Review Board Statement

Not applicable.

Informed Consent Statement

Not applicable.

Data Availability Statement

Data not available due to commercial restrictions.

Conflicts of Interest

The authors declare no conflicts of interest.

References

  1. Perčić, M.; Ančić, I.; Vladimir, N. Life-Cycle Cost Assessments of Different Power System Configurations to Reduce the Carbon Footprint in the Croatian Short-Sea Shipping Sector. Renew. Sustain. Energy Rev. 2020, 131, 110028. [Google Scholar] [CrossRef]
  2. Pérez Osses, J.R.; Palma, V.M.; Reusser, C.A. Emissions Assessment of a Tanker in a Chilean Port Using Bi-Directional Cold Ironing Integrated to LNG. Sustain. Energy Technol. Assess. 2022, 52, 102135. [Google Scholar] [CrossRef]
  3. UNCTAD. Review of Maritime Transport 2021; UN: New York, NY, USA, 2021; ISBN 9210000978. [Google Scholar]
  4. Weng, J.; Shi, K.; Gan, X.; Li, G.; Huang, Z. Ship Emission Estimation with High Spatial-Temporal Resolution in the Yangtze River Estuary Using AIS Data. J. Clean. Prod. 2020, 248, 119297. [Google Scholar] [CrossRef]
  5. Gray, N.; McDonagh, S.; O’Shea, R.; Smyth, B.; Murphy, J.D. Decarbonising Ships, Planes and Trucks: An Analysis of Suitable Low-Carbon Fuels for the Maritime, Aviation and Haulage Sectors. Adv. Appl. Energy 2021, 1, 100008. [Google Scholar] [CrossRef]
  6. Verschuur, J.; Koks, E.E.; Hall, J.W. Ports’ Criticality in International Trade and Global Supply-Chains. Nat. Commun. 2022, 13, 4351. [Google Scholar] [CrossRef]
  7. Dvorak, J.; Burkšienė, V. Sustainability Factors Shaping Port Security: A Case Study of Baltic Ports. In Global Challenges in Maritime Security: Sustainability and the Sea; Otto, L., Menzel, A., Eds.; Springer International Publishing: Cham, Switzerland, 2024; pp. 81–111. ISBN 978-3-031-59903-3. [Google Scholar]
  8. Wang, S.; Luo, Y.; Liu, Z.; Lu, B. Analysis on Energy Conservation and Emission Reduction Efficiency and Influencing Factors for Ports around Bohai in China under the Low Carbon Target. Sustainability 2022, 14, 14765. [Google Scholar] [CrossRef]
  9. Hua, C.; Chen, J.; Wan, Z.; Xu, L.; Bai, Y.; Zheng, T.; Fei, Y. Evaluation and Governance of Green Development Practice of Port: A Sea Port Case of China. J. Clean. Prod. 2020, 249, 119434. [Google Scholar] [CrossRef]
  10. Darbra Roman, R.M.; Wooldridge, C.; Puig Duran, M. ESPO Environmental Report 2020-EcoPortsInsights 2020; ESPO: Adelaide, SA, Australia, 2020. [Google Scholar]
  11. Bojić, F.; Gudelj, A.; Bošnjak, R. Port-Related Shipping Gas Emissions—A Systematic Review of Research. Appl. Sci. 2022, 12, 3603. [Google Scholar] [CrossRef]
  12. Manisalidis, I.; Stavropoulou, E.; Stavropoulos, A.; Bezirtzoglou, E. Environmental and Health Impacts of Air Pollution: A Review. Front. Public Health 2020, 8, 505570. [Google Scholar] [CrossRef]
  13. Allen, M.; Abdul Halim, S.; Antwi-Agyei, P.; Aragón-Durand, F.; Babiker, M.; Bertoldi, P.; Bindi, M.; Brown, S. Technical Summary. In: Global Warming of 1.5 °C. An IPCC Special Report on the Impacts of Global Warming of 1.5 °C Above Pre-Industrial Levels and Related Global Greenhouse Gas Emission Pathways, in the Context of Strengthening the Global Response to the Threat of Climate Change, Sustainable Development, and Efforts to Eradicate Poverty. Available online: https://www.ipcc.ch/site/assets/uploads/sites/2/2018/12/SR15_TS_High_Res.pdf (accessed on 19 March 2021).
  14. McPhaden, M.J.; Santoso, A.; Cai, W. Introduction to El Niño Southern Oscillation in a Changing Climate. In El Niño Southern Oscillation in a Changing Climate; John Wiley & Sons, Inc.: Hoboken, NJ, USA, 2020; pp. 1–19. [Google Scholar]
  15. Mamatok, Y.; Jin, C. An Integrated Framework for Carbon Footprinting at Container Seaports: The Case Study of a Chinese Port. Marit. Policy Manag. 2017, 44, 208–226. [Google Scholar] [CrossRef]
  16. Martínez-Moya, J.; Vazquez-Paja, B.; Gimenez Maldonado, J.A. Energy Efficiency and CO2 Emissions of Port Container Terminal Equipment: Evidence from the Port of Valencia. Energy Policy 2019, 131, 312–319. [Google Scholar] [CrossRef]
  17. Sadek, I.; Elgohary, M. Assessment of Renewable Energy Supply for Green Ports with a Case Study. Environ. Sci. Pollut. Res. 2020, 27, 5547–5558. [Google Scholar] [CrossRef] [PubMed]
  18. Ding, Y.; Yang, Y.; Heilig, L.; Lalla-Ruiz, E.; Voss, S. Deployment and Retrofit Strategy for Rubber-Tyred Gantry Cranes Considering Carbon Emissions. Comput. Ind. Eng. 2021, 161, 107645. [Google Scholar] [CrossRef]
  19. Seyhan, A.; Ay, C.; Deniz, C. Evaluating the Emission Reduction Efficiency of Automatic Mooring System and Cold Ironing: The Case of a Port in Izmit Bay. Aust. J. Marit. Ocean Aff. 2022, 15, 227–245. [Google Scholar] [CrossRef]
  20. Tang, D.; Jiang, T.; Xu, C.; Chen, Z.; Yuan, Y.; Zhao, W.; Guerrero, J.M. Assessing the Potential for Energy Efficiency Improvement through Cold Ironing: A Monte Carlo Analysis with Real Port Data. J. Mar. Sci. Eng. 2023, 11, 1780. [Google Scholar] [CrossRef]
  21. Wang, B.; Liu, Q.; Wang, L.; Chen, Y.; Wang, J. A Review of the Port Carbon Emission Sources and Related Emission Reduction Technical Measures. Environ. Pollut. 2023, 320, 121000. [Google Scholar] [CrossRef]
  22. Chen, S.; Meng, Q.; Jia, P.; Kuang, H. An Operational-Mode-Based Method for Estimating Ship Emissions in Port Waters. Transp. Res. D Transp. Environ. 2021, 101, 103080. [Google Scholar] [CrossRef]
  23. He, Z.; Lam, J.S.L.; Liang, M. Impact of Disruption on Ship Emissions in Port: Case of Pandemic in Long Beach. Sustainability 2023, 15, 7215. [Google Scholar] [CrossRef]
  24. Toscano, D.; Murena, F.; Quaranta, F.; Mocerino, L. Assessment of the Impact of Ship Emissions on Air Quality Based on a Complete Annual Emission Inventory Using AIS Data for the Port of Naples. Ocean Eng. 2021, 232, 109166. [Google Scholar] [CrossRef]
  25. Li, Z.; Feng, C.J.; Ya, D.J. Air Pollution and Control of Cargo Handling Equipments in Ports. E3S Web Conf. 2019, 93, 02001. [Google Scholar]
  26. Zhou, Y.; Zhang, Y.; Ma, D.; Lu, J.; Luo, W.; Fu, Y.; Li, S.; Feng, J.; Huang, C.; Ge, W. Port-Related Emissions, Environmental Impacts and Their Implication on Green Traffic Policy in Shanghai. Sustainability 2020, 12, 4162. [Google Scholar] [CrossRef]
  27. Okşaş, O. Carbon Emission Strategies for Container Handling Equipment Using the Activity-Based Method: A Case Study of Ambarlı Container Port in Turkiye. Mar. Policy 2023, 149, 105480. [Google Scholar] [CrossRef]
  28. Mousavi, A.; Sowlat, M.H.; Hasheminassab, S.; Pikelnaya, O.; Polidori, A.; Ban-Weiss, G.; Sioutas, C. Impact of Particulate Matter (PM) Emissions from Ships, Locomotives, and Freeways in the Communities near the Ports of Los Angeles (POLA) and Long Beach (POLB) on the Air Quality in the Los Angeles County. Atmos. Environ. 2018, 195, 159–169. [Google Scholar] [CrossRef]
  29. Huang, D.; Han, M.; Jiang, Y. Research on Freight Transportation Carbon Emission Reduction Based on System Dynamics. Appl. Sci. 2021, 11, 2041. [Google Scholar] [CrossRef]
  30. Cammin, P.; Sarhani, M.; Heilig, L.; Voß, S. Applications of Real-Time Data to Reduce Air Emissions in Maritime Ports. In Design, User Experience, and Usability. Case Studies in Public and Personal Interactive Systems; Springer: Berlin/Heidelberg, Germany, 2020; pp. 31–48. [Google Scholar]
  31. Mac Kinnon, M.; Razeghi, G.; Samuelsen, S. The Role of Fuel Cells in Port Microgrids to Support Sustainable Goods Movement. Renew. Sustain. Energy Rev. 2021, 147, 111226. [Google Scholar] [CrossRef]
  32. Zhu, S.; Mac Kinnon, M.; Soukup, J.; Paradise, A.; Dabdub, D.; Samuelsen, S. Assessment of the Greenhouse Gas, Episodic Air Quality and Public Health Benefits of Fuel Cell Electrification of a Major Port Complex. Atmos. Environ. 2022, 275, 118996. [Google Scholar] [CrossRef]
  33. Bakar, N.N.A.; Guerrero, J.M.; Vasquez, J.C.; Bazmohammadi, N.; Othman, M.; Rasmussen, B.D.; Al-Turki, Y.A. Optimal Configuration and Sizing of Seaport Microgrids Including Renewable Energy and Cold Ironing—The Port of Aalborg Case Study. Energies 2022, 15, 431. [Google Scholar] [CrossRef]
  34. Spengler, T.; Tovar, B. Environmental Valuation of In-Port Shipping Emissions per Shipping Sector on Four Spanish Ports. Mar. Pollut. Bull. 2022, 178, 113589. [Google Scholar] [CrossRef]
  35. Zhang, Y.; Liang, C.; Shi, J.; Lim, G.; Wu, Y. Optimal Port Microgrid Scheduling Incorporating Onshore Power Supply and Berth Allocation under Uncertainty. Appl. Energy 2022, 313, 118856. [Google Scholar] [CrossRef]
  36. Sifakis, N.; Tsoutsos, T. Planning Zero-Emissions Ports through the Nearly Zero Energy Port Concept. J. Clean. Prod. 2021, 286, 125448. [Google Scholar] [CrossRef]
  37. Ducruet, C.; Itoh, H. Spatial Network Analysis of Container Port Operations: The Case of Ship Turnaround Times. Netw. Spat. Econ. 2022, 22, 883–902. [Google Scholar] [CrossRef]
  38. Fahdi, S.; Elkhechafi, M.; Hachimi, H. Machine Learning for Cleaner Production in Port of Casablanca. J. Clean. Prod. 2021, 294, 126269. [Google Scholar] [CrossRef]
  39. Dawangi, I.D.; Budiyanto, M.A. Ship Energy Efficiency Management Plan Development Using Machine Learning: Case Study of CO2 Emissions of Ship Activities at Container Port. Int. J. Technol. 2021, 12, 1048–1057. [Google Scholar] [CrossRef]
  40. Fabregat, A.; Vázquez, L.; Vernet, A. Using Machine Learning to Estimate the Impact of Ports and Cruise Ship Traffic on Urban Air Quality: The Case of Barcelona. Environ. Model. Softw. 2021, 139, 104995. [Google Scholar] [CrossRef]
  41. Zhang, L.; Zeng, Q.; Wang, L. How to Achieve Comprehensive Carbon Emission Reduction in Ports? A Systematic Review. J. Mar. Sci. Eng. 2024, 12, 715. [Google Scholar] [CrossRef]
  42. Rony, Z.I.; Mofijur, M.; Hasan, M.M.; Rasul, M.G.; Jahirul, M.I.; Ahmed, S.F.; Kalam, M.A.; Badruddin, I.A.; Khan, T.M.Y.; Show, P.-L. Alternative Fuels to Reduce Greenhouse Gas Emissions from Marine Transport and Promote UN Sustainable Development Goals. Fuel 2023, 338, 127220. [Google Scholar] [CrossRef]
  43. Ha, S.; Jeong, B.; Jang, H.; Park, C.; Ku, B. A Framework for Determining the Life Cycle GHG Emissions of Fossil Marine Fuels in Countries Reliant on Imported Energy through Maritime Transportation: A Case Study of South Korea. Sci. Total Environ. 2023, 897, 165366. [Google Scholar] [CrossRef]
  44. Barberi, S.; Sambito, M.; Neduzha, L.; Severino, A. Pollutant Emissions in Ports: A Comprehensive Review. Infrastructures 2021, 6, 114. [Google Scholar] [CrossRef]
  45. Sifakis, N.; Vichos, E.; Smaragdakis, A.; Zoulias, E.; Tsoutsos, T. Introducing the Cold-ironing Technique and a Hydrogen-based Hybrid Renewable Energy System into Ports. Int. J. Energy Res. 2022, 46, 20303–20323. [Google Scholar] [CrossRef]
  46. Bakar, N.N.A.; Uyanik, T.; Arslanoglu, Y.; Vasquez, J.C.; Guerrero, J.M. Two-Stage Energy Management Framework of the Cold Ironing Cooperative with Renewable Energy for Ferry. Energy Convers. Manag. 2024, 311, 118518. [Google Scholar] [CrossRef]
  47. Stolz, B.; Held, M.; Georges, G.; Boulouchos, K. The CO2 Reduction Potential of Shore-Side Electricity in Europe. Appl. Energy 2021, 285, 116425. [Google Scholar] [CrossRef]
  48. Adefarati, T.; Bansal, R.C.; Shongwe, T.; Naidoo, R.; Bettayeb, M.; Onaolapo, A.K. Optimal Energy Management, Technical, Economic, Social, Political and Environmental Benefit Analysis of a Grid-Connected PV/WT/FC Hybrid Energy System. Energy Convers. Manag. 2023, 292, 117390. [Google Scholar] [CrossRef]
  49. Yu, Y.; Sun, R.; Sun, Y.; Shu, Y. Integrated Carbon Emission Estimation Method and Energy Conservation Analysis: The Port of Los Angles Case Study. J. Mar. Sci. Eng. 2022, 10, 717. [Google Scholar] [CrossRef]
  50. Peng, X.; Wen, Y.; Wu, L.; Xiao, C.; Zhou, C.; Han, D. A Sampling Method for Calculating Regional Ship Emission Inventories. Transp. Res. D Transp. Environ. 2020, 89, 102617. [Google Scholar] [CrossRef]
  51. Paternina-Arboleda, C.D.; Agudelo-Castañeda, D.; Voß, S.; Das, S. Towards Cleaner Ports: Predictive Modeling of Sulfur Dioxide Shipping Emissions in Maritime Facilities Using Machine Learning. Sustainability 2023, 15, 12171. [Google Scholar] [CrossRef]
  52. Xiao, G.; Wang, Y.; Wu, R.; Li, J.; Cai, Z. Sustainable Maritime Transport: A Review of Intelligent Shipping Technology and Green Port Construction Applications. J. Mar. Sci. Eng. 2024, 12, 1728. [Google Scholar] [CrossRef]
  53. Sun, R.; Abouarghoub, W.; Demir, E.; Potter, A. A Comprehensive Analysis of Strategies for Reducing GHG Emissions in Maritime Ports. Mar. Policy 2025, 171, 106455. [Google Scholar] [CrossRef]
  54. Yan, R.; Yang, D.; Wang, T.; Mo, H.; Wang, S. Improving Ship Energy Efficiency: Models, Methods, and Applications. Appl. Energy 2024, 368, 123132. [Google Scholar] [CrossRef]
  55. Liu, J.; Duru, O.; Law, A.W.-K. Assessment of Atmospheric Pollutant Emissions with Maritime Energy Strategies Using Bayesian Simulations and Time Series Forecasting. Environ. Pollut. 2021, 270, 116068. [Google Scholar] [CrossRef]
  56. Arévalo, P.; Jurado, F. Impact of Artificial Intelligence on the Planning and Operation of Distributed Energy Systems in Smart Grids. Energies 2024, 17, 4501. [Google Scholar] [CrossRef]
  57. Buonomano, A.; Del Papa, G.; Giuzio, G.F.; Palombo, A.; Russo, G. Future Pathways for Decarbonization and Energy Efficiency of Ports: Modelling and Optimization as Sustainable Energy Hubs. J. Clean. Prod. 2023, 420, 138389. [Google Scholar] [CrossRef]
  58. Martinez-Marquez, D.; Pingali, S.; Panuwatwanich, K.; Stewart, R.A.; Mohamed, S. Application of Eye Tracking Technology in Aviation, Maritime, and Construction Industries: A Systematic Review. Sensors 2021, 21, 4289. [Google Scholar] [CrossRef] [PubMed]
  59. Yurdakul, S.; Çelik, I.; Çelen, M.; Öztürk, F.; Cetin, B. Levels, Temporal/Spatial Variations and Sources of PAHs and PCBs in Soil of a Highly Industrialized Area. Atmos. Pollut. Res. 2019, 10, 1227–1238. [Google Scholar] [CrossRef]
  60. Ay, C.; Seyhan, A.; Bal Beşikçi, E. Quantifying Ship-Borne Emissions in Istanbul Strait with Bottom-up and Machine-Learning Approaches. Ocean Eng. 2022, 258, 111864. [Google Scholar] [CrossRef]
  61. Zhou, X.; Ruan, X.; Wang, H.; Zhou, G. Exploring Spatial Patterns and Environmental Risk Factors for Global Maritime Accidents: A 20-Year Analysis. Ocean Eng. 2023, 286, 115628. [Google Scholar] [CrossRef]
  62. Oyeduntan, K.P.; Oshinubi, K. Statistical Analysis of the Impact of Maritime Transport Gross Domestic Product on Nigeria’s Economy. Int. J. Econ. Manag. Eng. 2024, 18, 182–192. [Google Scholar]
  63. Okumuş, F.; Ekmekçioğlu, A.; Kara, S.S. Modelling Ships Main and Auxiliary Engine Powers with Regression-Based Machine Learning Algorithms. Pol. Marit. Res. 2021, 28, 83–96. [Google Scholar] [CrossRef]
  64. Senol, Y.E.; Seyhan, A. A Novel Machine-Learning Based Prediction Model for Ship Manoeuvring Emissions by Using Bridge Simulator. Ocean Eng. 2024, 291, 116411. [Google Scholar] [CrossRef]
  65. Munim, Z.H.; Sørli, M.A.; Kim, H.; Alon, I. Predicting Maritime Accident Risk Using Automated Machine Learning. Reliab. Eng. Syst. Saf. 2024, 248, 110148. [Google Scholar] [CrossRef]
  66. Bakar, N.N.A.; Bazmohammadi, N.; Çimen, H.; Uyanik, T.; Vasquez, J.C.; Guerrero, J.M. Data-Driven Ship Berthing Forecasting for Cold Ironing in Maritime Transportation. Appl. Energy 2022, 326, 119947. [Google Scholar] [CrossRef]
  67. Micallef, A.; Apap, M.; Licari, J.; Spiteri Staines, C.; Xiao, Z. A Comparative Framework for Evaluating Machine Learning Models in Forecasting Electricity Demand for Port Microgrids. Energy AI 2025, 20, 100494. [Google Scholar] [CrossRef]
  68. Iris, Ç.; Lam, J.S.L. Optimal Energy Management and Operations Planning in Seaports with Smart Grid While Harnessing Renewable Energy under Uncertainty. Omega 2021, 103, 102445. [Google Scholar] [CrossRef]
  69. Li, X.; Zhao, Y.; Cariou, P.; Sun, Z. The Impact of Port Congestion on Shipping Emissions in Chinese Ports. Transp. Res. D Transp. Environ. 2024, 128, 104091. [Google Scholar] [CrossRef]
  70. Zhang, C.; Hu, H.; Yang, Y.; Wang, N. Optimizing the Portfolio of Smart Technologies to Maximize Port Carbon Emission Efficiency: A Configurational Theory Approach. Marit. Policy Manag. 2025, 1–39. [Google Scholar] [CrossRef]
  71. Wang, J.; Li, H.; Yang, Z.; Ge, Y.E. A Novel Scheme for Shore Power Data to Enhance Containership-at-Berth Emission Estimation. Transp. Res. D Transp. Environ. 2024, 134, 104353. [Google Scholar] [CrossRef]
Figure 1. Location of Izmit Bay (Turkey). Source: Google Earth.
Sustainability 17 05612 g001
Figure 2. Flowchart of the study.
Sustainability 17 05612 g002
Figure 3. Constructing a regression model using the Regression Learner application.
Sustainability 17 05612 g003
Figure 4. Selecting regression model for energy demand.
Sustainability 17 05612 g004
Figure 5. Regression model and error values of the model.
Sustainability 17 05612 g005
Figure 6. ‘Response’ and ‘Predicted vs. Actual’ Plots of the emissions.
Sustainability 17 05612 g006
Table 1. Ship characteristics of the study.
GRTCountAvg. Time (h)Avg. ME (kW)Avg. AE (kW)Avg. GRTAvg. TEU
80,000 < GRT7736.366,90315,864143,54513,691
40,000 < GRT < 80,0009717.146,48011,92550,40211,925
30,000 < GRT < 40,0007816.530,65410,83735,8033377
25,000 < GRT < 30,00011812.623,590631627,3622619
25,000 > GRT7019.311,670296513,8871318
Total4401935,572949252,1264891
Table 2. Average energy demands of ships (categorized by GRT).
GRTCountAvg. Time (h)Avg. ME (kW)Avg. AE (kW)Avg. GRTAvg. TEUAvg. Energy Demand (kW)Total Energy Demand (kW)
80,000 < GRT7736.366,90315,864143,54513,691238,47118,362,272
40,000 < GRT < 80,0009717.146,48011,92550,40211,92581,2207,878,390
30,000 < GRT < 40,0007816.530,65410,83735,803337770,7825,521,035
25,000 < GRT < 30,00011812.623,590631627,362261931,9403,768,972
25,000 > GRT7019.311,670296513,887131816,2381,136,679
Total4401935,5729,49252,1264,89183,33536,667,349
Disclaimer/Publisher’s Note: The statements, opinions and data contained in all publications are solely those of the individual author(s) and contributor(s) and not of MDPI and/or the editor(s). MDPI and/or the editor(s) disclaim responsibility for any injury to people or property resulting from any ideas, methods, instructions or products referred to in the content.

