Article

From Entrepreneurship to Sustainable Futures: Investigating the Nexus Between New Business Density, Economic Growth, and Carbon Emissions

by
Kamer Ilgin Cakiroglu
1,*,
Korkmaz Yildirim
2,
Tunahan Haciimamoglu
3 and
Coskun Erkan
1
1
The Department of Business, Faculty of Economics and Administrative Science, Recep Tayyip Erdogan University, Rize 53100, Türkiye
2
The Department of Political Science and Public Administration, Faculty of Economics and Administrative Science, Recep Tayyip Erdogan University, Rize 53100, Türkiye
3
The Department of Economics, Faculty of Economics and Administrative Science, Recep Tayyip Erdogan University, Rize 53100, Türkiye
*
Author to whom correspondence should be addressed.
Sustainability 2025, 17(12), 5615; https://doi.org/10.3390/su17125615
Submission received: 7 May 2025 / Revised: 13 June 2025 / Accepted: 16 June 2025 / Published: 18 June 2025

Abstract

:
The readiness of businesses to address global climate change is pivotal for achieving sustainable development. However, the dynamics of business development remain underexplored, thereby limiting the depth and scope of research in this area. To this aim, the study examines the relationship between CO2 emissions and new business density (NBD) in the top 14 countries with the highest NBD (Hong Kong, Cyprus, New Zealand, Estonia, Malta, United Kingdom, Australia, Botswana, Iceland, Latvia, Mauritius, Norway, Sweden, and Georgia) from 2006 to 2020, within the framework of Schumpeter’s theory and the environmental Kuznets curve (EKC) hypothesis, incorporating control variables such as renewable energy consumption (REC) and population size. To estimate the relationships between variables, we employ the novel Method of Moments Quantile Regression (MMQR) approach. The findings suggest that higher NBD is associated with increased CO2 emissions. The results support the EKC hypothesis, positing an inverted U-shaped relationship between economic growth and environmental degradation, and highlight the mitigating effects of REC and population growth on CO2 emissions. These findings emphasize the need for countries to align labor legislation with sustainable development objectives and to promote strategies grounded in environmental principles, green economic practices, and eco-friendly technologies.

1. Introduction

The pursuit of sustainable living and policy efforts to address climate change faces significant challenges. Global carbon emissions continue to rise [1], and international obligations, notably the Paris Agreement of 2016, are increasingly difficult to meet [2,3]. It appears inevitable that further policies, strategies, and plans for sustainable and zero-carbon living through effective collaboration among the public and private sectors and civil society across all governmental levels will be required. However, thus far, adherence has primarily followed national government-led objectives. A comprehensive and effective sustainable climate-smart policy necessitates collaboration, coordination, and consistency among businesses, civil society organizations, citizens, and the public sector, notwithstanding certain unresolved problems [4]. In addition to this cooperation, we must further explore the relationship between entrepreneurial activities and climate-friendly policies. Global sustainable and climate-friendly policies must align with new entrepreneurship practices, particularly by examining how new enterprises affect CO2 emissions. Debates over entrepreneurship’s components and effects complicate its role in combating climate change. Researchers (e.g., [5,6,7]) have suggested that increased entrepreneurship increases CO2 emissions, especially in the short term. However, new technologies and strategies such as renewable energy, energy efficiency, and circular economies, adopted by entrepreneurs, are vital for combating climate change and promoting sustainable lifestyles. Eco-friendly practices and innovative strategies by new businesses reduce CO2 emissions and offer opportunities to address climate change impacts, enabling significant mitigation steps. So, we examine entrepreneurship’s potential to foster sustainable environments by considering ecological constraints. Its primary motivation is to analyze new business density’s (NBD’s) relationship with CO2 emissions, alongside macroeconomic and social indicators such as economic growth (GDP), renewable energy consumption (REC), and population size (POP). Insufficient government and stakeholder actions to address climate change further emphasize the private sector’s growing role in achieving sustainable development goals. Thus, we address the following question in the study: Does increased NBD elevate CO2 emissions in nations with high new business registrations? In other words, is NBD a blessing or a burden for CO2 emissions? We found limited studies on this correlation (e.g., [8,9,10,11]), lacking comprehensive analyses of business attributes and CO2 emissions. Because today’s initiatives shape tomorrow’s business landscape, examining new business characteristics is critical for sustainable development.
For this study, we selected the top 14 countries with the highest annually registered NBD (see Table A1, Appendix A) based on several considerations. First, the entrepreneurial structures and activities within these countries have the potential to drive innovative solutions to climate change and promote sustainable living, thereby fostering economic growth, ecological resilience, and social progress. However, currently, in most of these countries, financial incentives, tax cuts, and funding mechanisms remain insufficient to effectively promote green energy, primarily due to various constraints—particularly due to financial and technological limitations. Second, we obtained entrepreneurship data from the World Bank’s new business density indicators, allowing for cross-national comparisons and insights into NBD’s link to CO2 emissions. Third, many of these countries possess robust institutional frameworks and policy environments that promote entrepreneurship, supported by legal systems that encourage innovative and environmentally sustainable business models. Fourth, their political stability and business-friendly climates in these countries may facilitate the swift adoption of sustainable business practices, thereby stimulating entrepreneurial initiatives aimed at improving environmental quality.
The objective of this research is to explore how new entrepreneurial initiatives relate to climate change mitigation efforts. So, we analyze the relationship between NBD and CO2 emissions in the 14 countries with the highest rates of new business registrations, within the framework of Schumpeter’s theory and the Environmental Kuznets Curve (EKC) hypothesis, and by incorporating factors such as REC and POP. This study offers several novel contributions: First, it is among the first empirical studies to investigate the relationship between NBD and CO2 emissions, addressing a gap in the existing literature by providing an in-depth analysis of the environmental implications of entrepreneurial activity. Second, rather than being a purely economic assessment, this research adopts an interdisciplinary approach that contributes to policy development from a sustainable development perspective. This approach supports the formulation of policies that balance economic growth with environmental sustainability and promotes the implementation of sustainable entrepreneurship strategies. Third, the study explores the role of entrepreneurship in addressing climate change through a broader and more diverse lens, drawing on Schumpeter’s theory of creative destruction and the EKC hypothesis. This provides a more comprehensive framework for understanding the environmental effects of entrepreneurial activities. Fourth, we employ the novel Method of Moments Quantile Regression (MMQR) approach to estimate the relationships between the variables. This method yields more robust and reliable results by capturing the heterogeneous effects of NBD on CO2 emissions across different quantiles of the emission distribution.
The paper is organized as follows. Section 2 discusses the role of entrepreneurship in dealing with climate change theoretically within the scope of literature theory, specifically focusing on Schumpeter’s theory of creative destruction and the EKC hypothesis. Then, we review the literature concerning variables such as NBD, GDP, POP, and REC to clarify methodological gaps. Section 3 explains the data, model, details the estimation strategy used and includes research findings and discussions. Section 4 presents conclusions, limitations, and policy recommendations.

2. Literature Review

The ongoing rise in global CO2 emissions necessitates researchers to identify key factors of these emissions in studies focusing on the environment–energy–growth nexus [12]. Achieving sustainable economic growth while considering ecological constraints is a worldwide challenge confronting all nations [13]. Entrepreneurship is among the key determinants of sustainable economic growth [5,14]. We observed that few studies have examined the causal relationship between entrepreneurship and CO2 emissions at both macro and micro levels. Moreover, studies that have evaluated the relationship between new entrepreneurial activities and CO2 emissions through a defined theoretical background are notably limited.

2.1. Theoretical and Conceptual Framework

Entrepreneurial activities play a vital role in shaping climate change policy and strategies. In this respect, Schumpeter’s theory of creative destruction offers a useful framework for understanding the dynamics of new entrepreneurial ventures. Indeed, this theory is based on the continuous innovation brought about by the capitalist system. Schumpeter [15] emphasized that old structures will disappear if innovations occur in markets, products, and production techniques. By reallocating resources toward more productive sectors, this process drives economic growth. Entrepreneurs orchestrate this process and are considered the essential component of the creative destruction process [15] Similarly, Śledzik [16] examined Schumpeter’s perspective on innovation and entrepreneurship concepts and the role of these concepts in economic growth. Śledzik [16] stated that the entrepreneur’s main task is to innovate and restructure the economic system. Śledzik [16] argued that innovation provides a competitive advantage and accelerates economic growth.
New ventures disrupt markets, redistributing resources as innovative firms gain market share, while less innovative ones decline. In this process, resources are reallocated among entrepreneurs, employees, and suppliers. According to Spencer et al. [17], technology-based enterprises are key drivers of innovation and catalysts for economic growth. This process supports economic growth and structural transformation, replacing inefficient units with innovative ones. However, institutional barriers, such as job insecurity and underdeveloped financial systems, hinder restructuring, causing stagnation and reduced productivity. In contrast, international trade and deregulation enhance creative destruction, boosting sectoral reconstruction and productivity [18]. However, a critical question remains: What impact will the green economy and technological breakthroughs—both essential for addressing climate change—have on this process? So, this study firstly seeks to address this question.
Proposed by Simon Kuznets [19], the EKC illustrates an inverted U-shaped relationship between economic growth and environmental degradation, a concept that remains central to related research. Grossman and Krueger [20] examined the relationship between GDP and environmental pollution within the framework of the EKC hypothesis. The EKC hypothesis posits that as GDP increases, environmental degradation initially rises and then declines [21]. Researchers have agreed that environmental quality declines with economic growth in the early stages but rises in the later stages [22]. In this context, while the increase in business density positively influences GDP, environmental degradation may increase during the early stages of economic development; however, once per capita income exceeds a certain threshold, indicators of environmental quality start to improve.

2.2. Relationship Between Business Density, Economic Growth, and Pathways for Sustainable Development

The causal relationship between new entrepreneurship and climate change manifests directly and indirectly. NBD, defined as the number of new businesses established in a specific industry, region, and period, enables entrepreneurial analysis of economic activities [23]. Entrepreneurship is not only an individual decision; it is influenced by factors such as regional industrial composition, economic diversification, and infrastructure [24]. Aldrich and Zimmer [25] argued that entrepreneurship is a social process, where strong social ties provide financial support, and weak social ties offer new opportunities.
Legal regulations, including freedom of establishment, competitive markets, strike rights, anticorruption measures, and compulsory education promote entrepreneurial activities and new business formation [26]. Kopczewska et al. [27] argued that population density directly affects NBD, with new businesses emerging first in services, then in innovative sectors (e.g., technology, finance, related fields).
The entrepreneurship-economic growth-innovation nexus indirectly affects CO2 emissions. Fritsch and Schroeter [28] argued that technology and research and development (R&D)-oriented initiatives drive long-term growth. Mueller [29] found a positive relationship between the rate of new business establishments and economic growth. Mueller also argued that the impact of entrepreneurship is stronger in innovative sectors. Private sector R&D investments are a crucial determinant of economic growth. Regional knowledge spillovers increase entrepreneurial opportunities. New businesses thus have a greater impact on growth. In this context, researchers found that increased innovative entrepreneurial activities are more effective in terms of economic growth than the increase in general entrepreneurship. Feki and Mnif [14] argued that in developing countries, emerging technologies cause job losses in the short term but foster growth in the long term. Cumming et al. [30] argued that entrepreneurship has a positive impact on economic growth and employment; an increase in the rate of new business start-ups increases GDP; the establishment of new businesses reduces unemployment; the impact of entrepreneurship on economic growth differs among nations; and this variation is due to legal and institutional frameworks. High legal and institutional barriers, including limited access to credit, lender rights, and venture capital, minimize entrepreneurship’s influence on economic growth. Klapper et al. [31] noted that governance quality, political stability, and reduced bureaucratic barriers—in other words, fast and low-cost, streamlined start-up procedures—increase entrepreneurship. According to Xu, Murshed, and Li [32], political instability makes it impossible to achieve a clean energy transition and increases CO2 emissions. They emphasize that economic and environmental factors alone are not sufficient for the transition to clean energy (green transformation); political stability and quality of governance are also important.
Fritsch and Mueller [33] investigated the effects of new business formations on regional economic development over time. Fritsch and Mueller argued that newly established businesses increase competition and thus increase productivity in the regional economy. Increased competition thus drives “creative destruction” [15] as old and inefficient firms lose market share, while innovative and efficient firms gain prominence. This situation leads to the emergence of novel ideas and technology, along with an increase in the diversity of products and services in the market as efforts are made to better satisfy customer needs. In this sense, governments should support entrepreneurship to accelerate regional economic growth.
New businesses entering the market enable existing ones to work more efficiently and improve their processes through competition. In this sense, entrepreneurship may affect existing businesses not only through the process of creative destruction but also through the process of creative improvement. New businesses contribute to the economy not only by innovating or developing new business models but also by encouraging existing businesses to operate more efficiently through competition [34].
In regions with low entrepreneurship rates, new businesses increase employment, but in regions with high entrepreneurship rates, the effect diminishes and may become negative. Moreover, the influence of new firms on employment is more pronounced in areas with higher population density and higher R&D intensity. Research has suggested that entrepreneurship generates more employment in regions with a high proportion of middle-educated workers. At the same time, a high unemployment rate weakens the employment creation effect of new enterprises. In this sense, new businesses may encourage GDP by creating regional employment growth; entrepreneurship can increase productivity by increasing competition; and, if there are new businesses operating in the fields of R&D and high technology, it can contribute to GDP in the long term. Fritsch and Schroeter [28] argued that business start-up rates do not always contribute to GDP and that regional factors determine this relationship. Kasseeah [35] found that the impact of entrepreneurship on GDP is strong but is affected by regional factors. Kasseeah [35] argued that as the new business density increases, GDP increases. In this sense, encouraging entrepreneurship in all nations, regardless of their level of development, can contribute to economic growth.
Feki and Mnif [14] examined the relationship between entrepreneurship and economic growth in developing countries. Feki and Mnif [14] analyzed entrepreneurship through two factors: NBD and innovation potential. Their findings have shown that there is a significant and positive relationship between NBD and GDP and that, although the short-term effect of innovation on GDP is negative, it is positive in the long term. Feki and Mnif [14] argued that entrepreneurship can contribute to GDP by increasing competition but that the impact of innovation becomes evident in the long term. Entrepreneurship and innovation support policies are important for developing countries to achieve sustainable economic growth. Kwilinski et al. [36] found a strong positive relationship between green economic development and entrepreneurship in their study investigating the role of entrepreneurship in achieving green economic development in European Union (EU) countries. Countries that support green entrepreneurship achieve environmental sustainability. Kwilinski et al. [36] noted that as new business density increases, innovative and sustainable business models contribute more to the economy. Kwilinski et al. [36] argued that policies to facilitate business start-ups and support green initiatives (green start-up procedures) can significantly affect the green economy. At the same time, businesses can increase green technology innovation by going digital. Such actions can reduce CO2 emissions. The CO2 emission-reducing effect of digitalization is also reinforced by green financing practices [37]. In their study, Zheng and Jin [38] discussed the importance of green investment as a method for low-carbon economic transformation. Such investments will reduce environmental problems and ensure long-term development. Green investments can reduce CO2 emissions in businesses. It is crucial to prioritize management and entrepreneurs in business decisions. Tian, Lin, and Jiang [39] state that CO2 emission trading policies have been implemented in China to enable large-scale enterprises with particularly high carbon intensity to implement green technology innovations. These policies have led to a significant increase in green technology innovation among large-scale businesses. Emissions trading systems encourage companies to reduce CO2 emissions and promote technological transformation. Large-scale and carbon-intensive businesses exhibit greater openness and positive responses to these policies. Therefore, it can be said that as business density increases, the impact of carbon policies becomes more apparent. Xu, Pata, and Dai [40] state that economic growth in BRICS countries initially reduced environmental quality but improved it after a certain income level. In this sense, they indicate that green electricity consumption increased ecological quality and thus ensured sustainable growth.
Given all of these reviews, the study’s first hypothesis is formulated as follows:
H1: 
In countries with high levels of new entrepreneurial initiatives, economic growth leads to an increase in carbon emissions.

2.3. The Role of New Business Density in Shaping Carbon Emissions: Evidence from Entrepreneurial Activities

Business start-up initiatives influence CO2 emissions in various ways. For example, Omri and Afi [7] argued that all types of entrepreneurship—classified by entrepreneurs’ motivations, business structures, and registration status (e.g., opportunity-driven, necessity-driven, formal, informal)—contribute to an increase in CO2 emissions. They further emphasized that necessity-driven and informal entrepreneurship are the types most strongly associated with higher emission levels. In contrast, Cai et al. [41] found that entrepreneurship can reduce CO2 emissions when it incorporates sustainable production methods and green technologies. However, they also highlighted that the entrepreneur’s individual characteristics, moral values, and business model preferences play a crucial role in determining this environmental impact.
Zhu and Wang [42] examined the impact of entrepreneurship on the carbon footprint, finding a negative but statistically insignificant effect in the sub-Saharan Africa region. Their findings indicate that entrepreneurs can contribute to reducing the carbon footprint through the development of clean technologies, renewable energy applications, circular economy initiatives, sustainable agricultural practices, green transportation solutions, and educational programs. Similarly, Ayoungman et al. [43] argued that corporate entrepreneurship can mitigate the carbon footprint by fostering new laws and norms that promote environmental sustainability, whereas social entrepreneurship contributes to emission reductions by enhancing waste management and resource efficiency through the adoption of circular economy principles. They identified both corporate and social entrepreneurship as significant drivers in reducing carbon footprints within Brazil, Russia, India, China, and South Africa (BRICS) countries. In a related context, Feiock and Bae [44] explored the influence of policy decisions, political institutions, entrepreneurship, and public entrepreneurs on the determination of and reduction in greenhouse gas emissions by city governments. Their findings underscored the decisive role of political structures, entrepreneurial types, and community engagement in local governments’ efforts to combat climate change. Whereas civic and elected entrepreneurs are instrumental in advancing community-based projects that lower CO2 emissions, bureaucratic entrepreneurs contribute primarily through administrative and operational initiatives.
Although the environmental impacts of entrepreneurial activities shape the relationship between GDP and sustainable development, strategies aimed at reducing CO2 emissions also play a critical role. Industrial agglomeration initially increases CO2 emissions; however, it helps reduce them over time by promoting green innovation and attracting environmentally friendly talent [45]. Parrish and Foxon [46] argued that sustainability-oriented entrepreneurship not only contributes to GDP by lowering CO2 emissions but also accelerates the transition to low-carbon economies. In this process, the reduction in emissions creates new economic opportunities while simultaneously fostering social development through innovative business models. Although entrepreneurial activities may lead to a temporary increase in CO2 emissions, long-term environmental improvements can be achieved through the adoption of sustainable practices and innovative approaches. As Khezri et al. [5] noted, promoting entrepreneurial initiatives that reduce energy intensity is a key strategy for lowering CO2 emissions and ensuring sustainable economic development. Sun et al. [47] emphasized the role of environmental entrepreneurship in advancing sustainable development. Although environmental pollution tends to increase during the early stages of economic growth, improvements are observed once a certain income threshold is reached. Additionally, Sun et al. [47] found that trade openness enhances environmental quality in low-income countries but contributes to increased emissions in middle-income economies. In this context, supporting environmental entrepreneurship, boosting investments in renewable energy, and implementing incentives for green markets are essential for reducing CO2 emissions and achieving sustainable development in sub-Saharan African countries [47]. Similarly, Iqbal et al. [48] asserted that environmentally friendly business models and renewable energy projects significantly contribute to lowering CO2 emissions. Gu and Zheng [49] emphasize that the negative impact of entrepreneurial downturns on emissions is stronger, highlighting the importance of sustainable entrepreneurship for sustainable development.
The environmental impact of entrepreneurial activities is a key factor in understanding the relationship between economic growth and sustainable development. Omri [6] found that in high-income countries, entrepreneurial activities initially have a negative impact on the environment but contribute to environmental improvement after reaching a certain level of development. In contrast, in countries outside the high-income group, entrepreneurship is generally associated with environmental degradation. Omri [6] also highlighted that increased energy consumption exacerbates environmental harm, with the industrial sector identified as the primary contributor. In particular, both the industrial and service sectors are responsible for significant CO2 emissions in high-income countries, underlining the importance of supporting entrepreneurs who adopt sustainable business models. Gu and Zheng [49], examining the relationship between sustainable entrepreneurship, GDP, and environmental pollution, argued that although GDP can reduce environmental impacts in the long term by promoting technology-oriented production, it tends to increase pollution in the short term because of industrial expansion. Although GDP often leads to higher environmental pollution through increased production and fossil fuel consumption, this trend may reverse as companies become more environmentally conscious. However, environmental degradation can persist or even worsen with the growth of company size and the absence of technological transformation. Despite potentially increasing environmental degradation in the short term, sustainable entrepreneurship plays a crucial role in promoting sustainable development over the long term. Supporting this view, Nkusi et al. [50] emphasized that technology-based initiatives foster economic growth through highly efficient energy solutions and carbon-reducing processes. Similarly, Zhu and Wang [42] examined the effects of entrepreneurship on carbon footprints in sub-Saharan Africa and noted the role of entrepreneurs in proposing incentive mechanisms, such as clean technologies, renewable energy projects, circular economy practices, sustainable agriculture, green transportation, and educational programs, to mitigate their environmental impact. Xu, Chen, and Dong [51] state that financial technologies are effective in energy transformation. This finding is important in terms of utilizing digital financial tools to reduce CO2 emissions in areas with high business density.
In short, considering the role of NBD on CO2 emissions, the reduction in CO2 emissions is influenced by the type of entrepreneurship [7], the individual characteristics of entrepreneurs and their business models [41], the adoption of eco-friendly technologies and production methods [42,43], involvement in corporate and social entrepreneurship [43], engagement with local government [44], the production structure and sectoral expansion [49], the structuring of entrepreneurial activities in a way that reduces energy intensity [5], the level of economic development of countries [6], and the use of technological transformation in entrepreneurial activities [49,50]. Thus, it can be said that business density has a direct impact on CO2 emissions in terms of production and energy consumption and an indirect impact through many channels in terms of technology use, business models, social impacts, and policymaking.
Given all of these reviews, the study’s second hypothesis is formulated as follows:
H2: 
Entrepreneurial initiatives have a negative impact on CO2 emissions.

2.4. Nexus Between Renewable Energy Consumption and Carbon Reduction
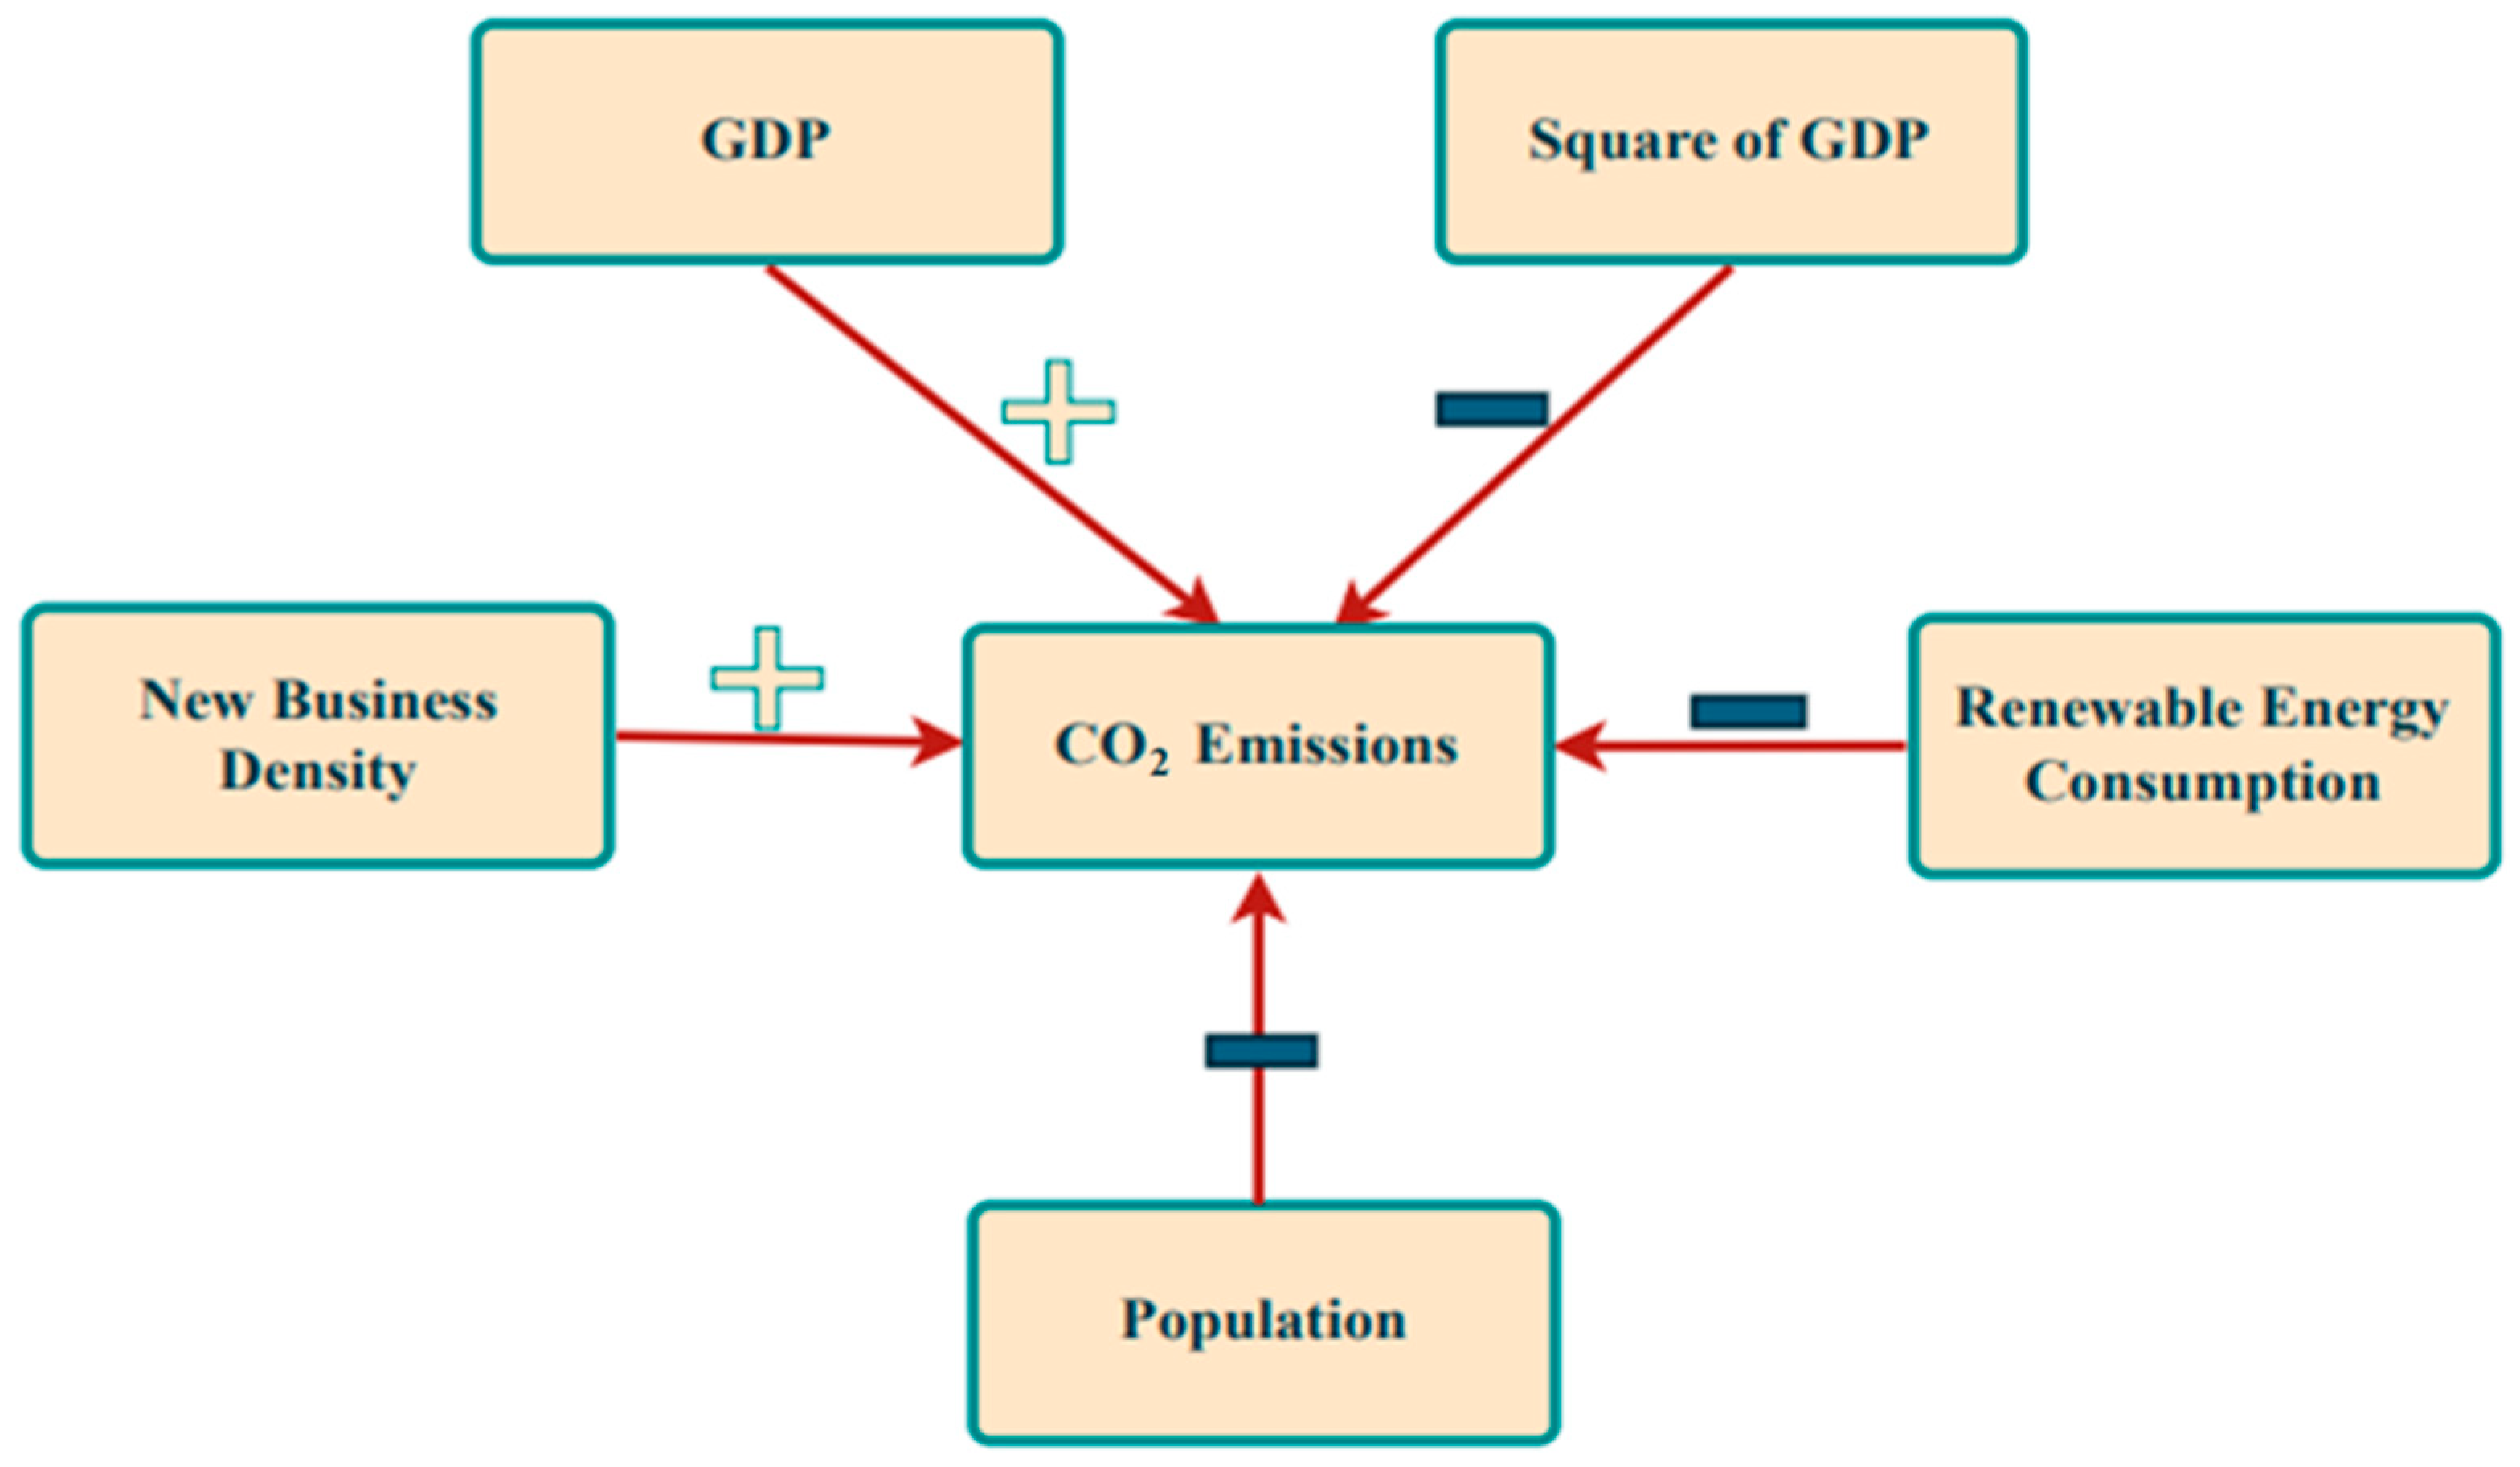
Researchers have recognized CO2 emissions as one of the primary drivers of climate change. Given that energy production and consumption are central to this issue, examining their effectiveness in relation to CO2 emissions is crucial for both scientific inquiry and policymaking [52]. Moreover, renewable energy sources are considered essential not only for achieving sustainable development goals but also for meeting the United Nations’ 1.5 °C target aimed at mitigating the global climate crisis. In this context, researchers must identify factors influencing CO2 emissions, accurately measure these emissions, and formulate appropriate climate policies and strategies, which are of paramount importance [53].
Renewable energy sources such as wind, hydroelectric, and solar power hold significant potential in the transition toward a sustainable and low-carbon lifestyle, and they occupy a central role in the global energy portfolio [54]. Sun et al. [55] analyzed the impact of GDP, urbanization, and REC on CO2 emissions in Middle East and North Africa (MENA) countries using data from 1991 to 2019. They found that the use of renewable energy is the most effective approach to controlling CO2 emissions in the MENA region. Similarly, not only the adoption of renewable energy sources but also the implementation of energy efficiency practices plays a crucial role in efforts to combat climate change [56]. Undoubtedly, ensuring a lifestyle grounded in sustainable development requires both the efficient use of energy and the integration of renewable sources, along with an understanding of the factors that influence these elements [13]. However, given that energy production and consumption are largely driven by the private sector, researchers must further analyze how CO2 emissions evolve in countries where private sector initiatives are particularly prominent.
Although numerous studies have directly examined the causal relationship between the energy sector and CO2 emissions, few have considered the role of renewable energy as an intermediary or control variable. Additionally, treating energy consumption as an independent variable highlights not only the supply side but also the demand dimension of the issue. For example, Kirikkaleli et al. [57] analyzed the impact of financial development and REC on CO2 emissions in Chile, empirically demonstrating that renewable energy consumption, in particular, has a mitigating effect on emissions. Similarly, Yuping et al. [58] investigated the effects of renewable and nonrenewable energy consumption, along with GDP, on CO2 emissions in Argentina for the period 1970–2018. They found that although REC contributes to a reduction in CO2 emissions, nonrenewable energy consumption leads to an increase.
Although many countries have increased their investments in renewable energy, the actual impact of these investments on CO2 emissions requires empirical validation. For example, Yang et al. [59] examined the causal relationship between renewable energy investments and CO2 emissions across 13 countries using data from 2010 to 2019 and found that increased investments in renewable energy were associated with a rise in CO2 emissions. Interestingly, Yang et al. [59] also found that although investments in solar and bioenergy contributed to higher emission levels, overall investments in renewable energy had a proportional effect in reducing emissions. In this context, researchers have aimed to understand how these dynamics unfold in countries with high levels of new business density.
Renewable energy and technological innovation offer substantial benefits for sustainable development and the reduction in CO2 emissions. However, some scholars have argued that various external factors, such as market conditions, also play a significant role in this process [60]. Accordingly, researchers must thoroughly examine the relationship between private sector dynamics, market characteristics, and the intersection of CO2 emissions and renewable energy use. At the same time, renewable energy plays a crucial role in balancing economic and ecological priorities, placing it at the heart of ongoing academic and political debates [61]. Sustainable living approaches require economic development strategies that consider ecological constraints. In this regard, Adams and Acheampong [3] analyzed the impact of democracy and renewable energy on CO2 emissions in 46 sub-Saharan African countries using data from 1980 to 2015, and they found that renewable energy contributes to reducing CO2 emissions.
Similarly, He et al. [60] analyzed the effects of renewable energy and technological innovation on the carbon performance of 25 provinces in China using data from 2002 to 2015. They found that both renewable energy and technological development contribute to reducing CO2 emissions, although they are influenced by market factors. Wang et al. [62] examined the relationship between renewable and nonrenewable energy production, socioeconomic variables, and CO2 emissions in countries with a high economic complexity index, using data from 1980 to 2014. They concluded that, in the long term, the use of renewable energy clearly reduces CO2 emissions. Similarly, Mukhtarov et al. [63] investigated the impact of REC on CO2 emissions in Azerbaijan, using data from 1993 to 2019, and found a significant negative relationship between the REC and CO2 emissions.
Given all of these reviews, the study’s third hypothesis is formulated as follows:
H3: 
In countries with high levels of new entrepreneurial initiatives, renewable energy use leads to reduce CO2 emissions.

3. Data and Model

We examine the relationship between new business density and CO2 emissions in the 14 countries with the highest new business density between 2006 and 2020 using the EKC hypothesis with control variables such as renewable energy consumption and population. Table 1 contains descriptive information on the variables. We calculated CO2 emissions (CO2) in metric tons per capita, which is a critical indicator of environmental sustainability. We obtained these data from the Global Carbon Atlas (GCA) database [64]. NBD is a major indicator of economic dynamism and the level of entrepreneurship. GDP is acknowledged as one of the key indicators of economic performance at the national and international levels. We include GDP2 in the model to explore the nonlinear relationship between CO2 and economic growth. REC reflects the ratio of renewable energy consumption to total final energy consumption. REC is an essential indicator of sustainable development and of energy security. Finally, the population (POP) represents the total population. POP is incorporated in the model to test the relationship between demographic structure and environmental variables. We obtained NBD, GDP, GDP2, REC, and POP data from the World Bank’s World Development Indicators (WDI) database [65].
Following the study of Khezri et al. [5], the basic model of the study is written as
C O 2 = f ( N B D , G D P , G D P 2 , R E C , P O P )
C O 2 i t = ϕ 0 + ϕ 1 N B D i t + ϕ 2 G D P i t + ϕ 3 G D P i t 2 + ϕ 4 R E C i t + ϕ 5 P O P i t + ω i t
where CO2 is considered the dependent variable, while NBD, GDP, GDP2, and POP are included as independent variables. We include GDP2 in the model to verify if there is a possible nonlinear linkage between GDP and CO2 according to the EKC hypothesis. i stands for countries, t for time period, and ω for the error term. ϕ 0 represents the constant term, whereas ϕ 1 , ϕ 2 , ϕ 3 , ϕ 4 , and ϕ 5 refer to the coefficient parameters.

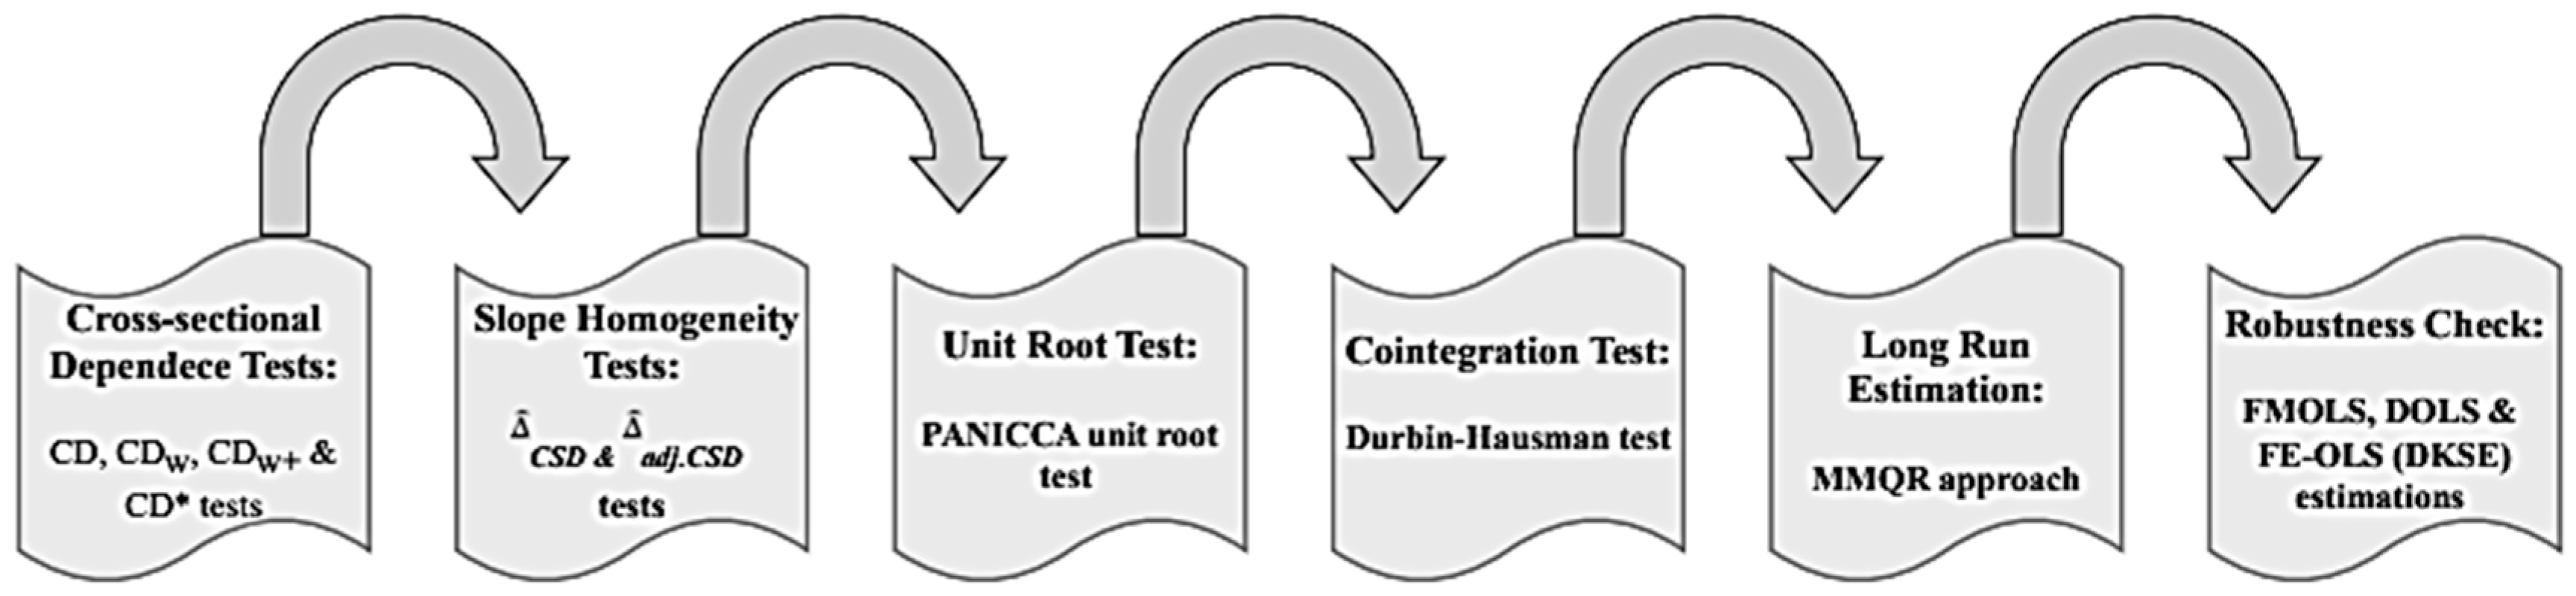
3.1. Estimation Strategy

The estimation strategy of this study consists of six main steps. First, we check for cross-sectional dependence (CSD). We examine CSD in panel analysis to ascertain the size and direction of interactions between different countries, regions, or periods. The existence of CSD implies that economic, political, and natural disasters must be considered in panel analysis. We must use second-generation panel data techniques in this case. Otherwise, using traditional techniques leads to biased and inconsistent estimates. We applied Pesaran’s [66,67] CD, Juodis and Reese’s [68] CDw, Fan et al.’s [69] CDW+, and Xie and Pesaran’s [70] CD*tests to check whether CSD exists. In the second stage, after addressing CSD, we checked for slope homogeneity (SH) using the ^ CSD and ^ adj.CSD tests, which are suitable under serial correlation, heteroskedasticity, and CSD, as Bersvendsen and Ditzen [71] recently suggested.
In the third stage, we investigate the stationarity properties of the variables. For this purpose, we employed the principal components-based Panel Analysis of Non-stationarity in Idiosyncratic and Common components (PANIC) and the Cross-section Average (CA), i.e., the PANICCA unit root test that Reese and Westerlund [72] proposed. This test, based on common factor modeling, is robust to CSD and SH problems. The PANICCA test incorporates the main features of the PANIC test and exhibits asymptotic properties. This unit root test is notably effective for small and medium-sized N, and it is one of the most recent tests.
In the fourth stage, we tested the existence of long-run relationships. In this context, we applied the Durbin–Hausman (DH) test that Westerlund [73] proposed. The rationale for selecting the DH test includes its ability to handle CSD and SH problems. The DH test accounts for CSD and SH issues. It offers significant flexibility to cointegration tests by permitting independent variables to be stationary at level, provided that the dependent variable is stationary at first order. Cointegration analyses thus account for the possibility that the stationarity orders of the variables may differ from each other. The DH test yields two distinct test statistics for heterogeneous (DHgroup) and homogeneous (DHpanel) panels.
In the fifth stage, we estimate long-run coefficients using the method of moments quantile regression (MMQR) approach that Machado and Silva [74] introduced. We chose the MMQR method for the following reasons: (a) it offers distributional flexibility to panel data analyses by exhibiting robust performance in analyzing nonnormally distributed data; (b) it provides a clearer understanding of how variables relate to each other by looking at effects at various quantile levels (0.10, 0.20, …, 0.90) instead of just average effects; (c) it tackles multicollinearity and endogeneity issues and successfully deals with the outlier issue; (d) because the MMQR approach allows fixed effects to affect all conditional quantiles, it offers a more inclusive and flexible analysis than the traditional fixed-effect approach; and (e) MMQR permits more robust modeling of nonlinearities and asymmetric effects in the dependent variables within moment restrictions. Moreover, this method allows for more detailed inferences on sustainable development policies, especially by capturing the dynamic effects of economic and environmental variables over time. The MMQR is characterized by the functional form in Equation (2):
Q Y τ / X i t = α i + δ i q τ + X i t β + Z i t γ q ( τ )
In Equation (2), Q Y τ / X i t represents the conditional quantile regression function of the dependent variable Y at the τ th quantile. α i and δ i q τ denote the individual effect parameter and the quantile-level-dependent individual effect, respectively. X i t β shows how the main explanatory variables affect the dependent variable, whereas Z i t γ q ( τ ) stands for the effects of additional explanatory variables at different quantile levels.
We tested the robustness of the MMQR results using dynamic ordinary least squares (DOLS), fully modified ordinary least squares (FMOLS), and fixed effect ordinary least squares with Driscoll–Kraay (FE-OLS) regression approaches. Figure 1 depicts the flowchart of the estimation strategy.

3.2. Empirical Findings and Discussion

Table 2 displays the descriptive statistics. We found that POP has the highest mean, median, and maximum values, whereas CO2 has the lowest mean, median, and maximum values. REC has the lowest minimum value, whereas POP has the highest minimum value. REC exhibits the highest standard deviation. POP is right-skewed, whereas CO2, NBD, GDP, and REC are left-skewed. NBD shows a kurtosis similar to a normal distribution. Whereas CO2, GDP, and POP exhibit platykurtic distribution, the REC variable shows leptokurtic distribution. Within the scope of normality tests, we conducted Chen–Shapiro and Shapiro–Francia tests. These tests indicate that only NBD exhibits a normal distribution, whereas CO2, GDP, REC, and POP do not conform to a normal distribution.
Table 3 shows both CSD and SH test results for the variables. We rejected the null hypothesis that there was no CSD in all variables, revealing the presence of CSD. We rejected the null hypothesis that the model was homogeneously distributed, confirming that it was heterogeneously distributed. These results indicated that testing techniques that can deal with CSD and SH should be preferred in the analysis as opposed to traditional estimation methods. After controlling for CSD and SH problems, we analyzed the stationarity properties of the variables.
Table 4 presents the unit root test results. The PANICCA test results indicate that CO2, NBD, GDP, GDP2, REC, and POP were not stationary at level (i.e., they contained a unit root). However, the results indicate that all variables became stationary when first differences were taken. Therefore, these results confirm that the variables were integrated at first order (I [1]). Accordingly, the analysis continued by applying cointegration tests and long-run coefficient estimation methods.
Table 5 presents the DH cointegration test results. Because we found the model to be heterogeneous, the decision on whether there was cointegration is based on the DHgroup test statistic. According to the results of the DHgroup test statistic, we rejected the null hypothesis of no cointegration at the 5% significance level, and we found the variables to be cointegrated. These results indicate that the variables in the model moved together in the long run. Following the determination of the cointegration relationship, we proceeded to analyze the long-run coefficient relationships between the variables.
Table 6 presents the MMQR estimation results (see Figure 2). In the study, we estimated the effects of the NBD, GDP, GDP2, REC, and POP variables on CO2 emissions across nine different quantiles (0.10, 0.20, …, 0.90). The MMQR results demonstrate that NBD has a positive and significant effect on CO2 emissions in all quantiles except the 0.10, 0.20, and 0.30 quantiles. These results indicate that NBD increases environmental pressure by increasing CO2 emissions. In this regard, these findings are consistent with the findings of Omri and Afi [7], who determined that types of entrepreneurship increase CO2 emissions. Similarly, the study findings demonstrate an indirect alignment with Lee and Ahn’s [75] conceptualization of entrepreneurial proactiveness, Pricopoaia et al.’s [76] findings on the circular economy, and George et al.’s [77] assessment of the relationship between entrepreneurial activities and CO2 emissions through digital technology, whereas they contradict the findings of Zhu and Wang [42]. These results clearly indicate a positive relationship between the number of new entrepreneurs and CO2 emissions, which is directly linked to the environmental impacts of economic growth and industrialization processes. Indeed, the increase in new entrepreneurial activities leads to an increase in CO2 emissions, particularly because of their association with energy consumption and production patterns. A rational explanation for this can be that new enterprises often carry out activities based on traditional, nonenvironmentally friendly methods, resulting in an increase in CO2 emissions.
This relationship is also linked to the evaluations of Audretsch et al. [24] regarding regional industrial structure, economic diversity, and infrastructure differences; Aldrich and Zimmer [25] regarding social networks; and Carbonara et al. [26] regarding the relationship between legal regulations and entrepreneurial activities. Furthermore, as Caballero [18] pointed out, innovative methods can lead to positive outcomes, including increased efficiency. Similarly, Spencer et al. [17] emphasized that entrepreneurship based on innovative technology can be pioneering in their study. These findings underscore the importance of transitioning to sustainable business models and innovative technologies and clearly indicate that policies and strategies aimed at reducing environmental impacts need to be strengthened. As Carlton [78] also noted, supporting environmentally friendly entrepreneurship through more effective policies to attract new enterprises may yield positive results in terms of CO2 emissions in the short and medium term. Gasbarro et al. [79] suggested that the success of sustainable entrepreneurship can be enhanced by aligning it with other political practices.
The estimation results of the model reveal that the GDP variable has a positive and significant effect on CO2 emissions across all quantiles. However, the GDP2 is negative and significant at all quantiles, lending support to the Environmental Kuznets Curve (EKC) hypothesis, which posits an inverted U-shaped relationship between economic growth and environmental degradation. Based on these findings, the inverted U-shaped relationship between economic growth and CO2 emissions suggest that, in the initial stage, industrialization and increasing production activities lead to environmental degradation. However, as economic growth surpasses a certain threshold, CO2 emissions begin to decline, likely because of more efficient energy use, a transition to renewable energy sources, and the adoption of environmentally friendly technologies. This analysis further reinforces the idea that countries with a high density of new entrepreneurial activity can steer economic growth in a more sustainable way through the implementation of environmentally conscious policies and innovations, even though some degree of environmental degradation may be inevitable in the initial phases of development. The findings of the study are also consistent with those of [14,29,30,36,80] regarding the relationship between entrepreneurship and economic growth. The increase in entrepreneurial activities is effective in terms of economic growth; however, this initially leads to an increase in emissions, followed by a decrease thereafter. The findings of this study provide strong evidence for the need to promote green entrepreneurship models in the countries analyzed. So, entrepreneurial activity should be supported through a holistic framework that encompasses not only economic growth, but also broader dimensions of sustainability, including environmental and social considerations.
The results also show that REC has a reducing effect on CO2 emissions across all quantiles. These findings suggest that the widespread adoption of REC could serve as an effective policy tool in reducing CO2 emissions in the countries. REC adoption could play a strategic role in the design of energy-environment policies aligned with sustainable development goals. The findings of the study are also consistent with those of [13,55,57,58,62,63], whereas they contradict the findings of [59]. Based on these findings, we predict that the negative relationship between renewable energy consumption and CO2 emissions stems from the lower CO2 emissions associated with renewable energy sources compared to fossil fuels. Indeed, the findings reaffirm that renewable energy sources, such as solar, wind, geothermal, biomass, and hydroelectric power, significantly reduce CO2 emissions by decreasing dependence on fossil fuels for electricity generation. In this context, further investments in renewable energy would encourage cleaner energy production methods and reduce the carbon footprint. This transition would generally support environmental sustainability. Moreover, the use of renewable energy will enhance energy supply security and promote environmentally friendly development strategies in these countries.
If the business environment is improved, either business concentration or population concentration will occur. An increase in business density will lead to an increase in energy consumption. Together with the rebound effect, CO2 emissions may not be optimized [9]. However, using green technology can reduce emissions [37,39,81]. The results show that POP has a reducing effect on CO2 emissions across all quantiles, suggesting that population level may alleviate environmental pressure through technological advancement, energy efficiency, and increased environmental awareness. In particular, it is thought that the population growth’s mitigating effect on environmental pressure may be linked to structural factors such as urbanization rates, innovative infrastructure investments, energy efficiency practices, technological advancement levels, and environmental awareness levels in the top 14 countries with the highest NBD. In this context, it can be stated that population growth in these countries with high urbanization and institutional capacity may have a reducing effect on CO2 emissions, contrary to traditional expectations. The findings of the study do not align with those of [27]; there was no increase in emissions due to the positive relationship between population density and business density. Based on these findings, the negative relationship between population level and CO2 emissions can be explained by the tendency toward more sustainable lifestyles and low-emission technologies in the countries. Factors such as more efficient energy use and the widespread adoption of environmentally friendly technologies in developed and densely populated regions may have contributed to a reduction in CO2 emissions. Practices such as sustainable transportation systems, more efficient waste management, and the use of renewable energy in densely populated areas could be more commonly preferred. In addition, the increase in environmental awareness that accompanies population growth and urbanization may encourage individuals to adopt eco-friendly lifestyles. However, this may not always be the case, and population growth, increased energy consumption, and inefficient energy use may lead to higher CO2 emissions, particularly in underdeveloped and developing regions. Moreover, the results reinforce the view that investments in clean energy and environmentally friendly technologies not only may help mitigate environmental impacts, but also create new business opportunities and foster sustainable economic development.
In Table 7 we report the robustness test results of the study. In this context, the FMOLS, DOLS, and FE-OLS results show that NBD has a positive and significant effect on CO2 emissions. These results imply that NBD contributes to an increase in CO2 emissions. In this context, the development of systematic training, consultancy, and aware-ness-raising programs aimed at fostering environmental responsibility among entrepreneurs is likely to yield significant benefits. The results similarly show that GDP has a positive and significant effect on CO2 emissions, whereas GDP2 has a negative and significant effect. These results evidently support the EKC hypothesis. Finally, the results demonstrate that REC and POP have a significant effect in reducing CO2 emissions based on these tests. The robustness test results are consistent with the findings obtained from the MMQR estimations in a one-to-one manner and support all the results. Thus, this consistency across different testing techniques enhances the reliability of the analyses. Figure 2 illustrates the summary of the estimation results.

4. Conclusions, Limitations, and Policy Recommendations

Current initiatives have suggested that the possibility of meeting international commitments, particularly those outlined in the Paris Agreement, and achieving sustainable and carbon-friendly lifestyles is gradually decreasing. Although we expect that the public, private sector, and civil society will contribute effectively and collaboratively at each level of government, evidence has suggested that carbon-neutral initiatives solely driven by national governments will not suffice. In this context, we predict that the private sector and entrepreneurial activities will prioritize ecological constraints and create a more positive impact on CO2 emissions and energy efficiency. In this context, we examined the impact of NBD on CO2 emissions in the top 14 countries with the highest levels of new enterprises during the period 2006–2020. We employed the innovative MMQR approach, considering the control variables of GDP, REC, and POP within the framework of the EKC hypothesis. The results indicate that NBD contributes to an increase in CO2 emissions in the sample countries. Furthermore, the findings confirm an inverted U-shaped relationship between GDP and CO2 emissions, supporting the validity of the EKC hypothesis. In addition, these results show that REC and POP have a mitigating effect on CO2 emissions.
Based on these findings, we present several strategic policy recommendations for achieving sustainable development and entrepreneurship goals:
  • Promoting Green Entrepreneurship Models through Policy Incentives.
    We recommend supporting and promoting green entrepreneurship models that minimize the environmental impact of new businesses. Such initiatives will undoubtedly contribute to the reduction in CO2 emissions, enhance sustainable development, and improve environmental quality standards. To this end, policies, such as tax reductions and financial incentives for green entrepreneurs, might be prioritized in the top 14 countries with the highest NBD and relatively strong institutional capacities;
  • Redesigning Entrepreneurship Policies through a Sustainability-Oriented Framework.
    We recommend that countries redesign their entrepreneurship support policies with a holistic approach that encompasses not only economic growth but also other dimensions of sustainability, including environmental and social aspects. In this regard, governments should develop entrepreneurship programs that incorporate environmental and social performance criteria. This recommendation particularly applies to the top 14 countries with the highest NBD, where entrepreneurial dynamism intersects with complex sustainability challenges. We predict that this approach will foster both sustainable economic growth and ecological balance while simultaneously increasing social welfare and protecting natural resources;
  • Fostering Environmental Responsibility in Entrepreneurship through Education and Regulation.
    In line with the sustainable development framework, we recommend that governments establish systematic education, consultancy, and awareness-raising programs that foster environmental responsibility among entrepreneurs. Governments should implement and reinforce regulations and incentives to reduce carbon footprints and improve environmental quality. Such institutional mechanisms are especially relevant for the top 14 countries with the highest NBD that already exhibit governance structures conducive to climate-conscious entrepreneurship. In this regard, laws that limit CO2 emissions, as well as environmental inspections for businesses, should be implemented and reinforced, irrespective of whether businesses are newly established or well-established;
  • Investing in Clean Technologies to Foster Green Growth and Low-Carbon Transitions.
    We recommend that investments in clean energy and environmentally friendly technologies reduce environmental impacts and create new business opportunities and green jobs. Thus, in particular, the top 14 countries with the highest NBD should develop comprehensive programs that use financial incentives, tax reductions, and green investment funds to promote the adoption of renewable energy. However, these programs should be designed to facilitate the acceleration of businesses’ transition to energy-efficient practices and low-carbon technologies.
As in every scientific study, this research has certain limitations. First, we examined only the impact of officially registered new businesses on CO2 emissions. Second, because this study is confined to countries with high new business density, researchers should exercise caution when generalizing the results to other country groups, such as BRICS, newly industrialized countries, and the Association of Southeast Asian Nations. In addition, one of the main limitations of the study is the exclusion of other fundamental factors that may influence CO2 emissions such as institutional quality, political risks, and financial development. Third, the analysis period of this study is restricted to the years 2006–2020 to maintain data consistency and model integrity. Fourth, although robust estimators were used, the study ignores applying instrumental variable or dynamic GMM methods, which are useful for addressing endogeneity and reverse causality to strengthen causal inference. In future studies, researchers should analyze the relationships between variables, such as institutional structure, both internal and external factors influencing this structure, business types, investors’ environmental responsibilities, and CO2 emissions in a comprehensive manner, beyond merely focusing on new business registrations, using instrumental variable or dynamic GMM methods to better address endogeneity and strengthen causal interpretation.

Author Contributions

Conceptualization: K.I.C., K.Y. and T.H.; Literature: K.I.C., K.Y. and C.E.; methodology: T.H.; software: T.H.; validation: K.Y. and T.H.; formal analysis: K.I.C. and K.Y.; resources: K.I.C., K.Y., T.H. and C.E.; data curation: T.H.; writing—original draft preparation and editing: K.I.C., K.Y., T.H. and C.E. All authors have read and agreed to the published version of the manuscript.

Funding

This research received no external funding.

Institutional Review Board Statement

Ethical approval was not required as the study did not involve human participants.

Informed Consent Statement

Informed consent was not required as the study did not involve human participants.

Data Availability Statement

The data presented in this study are available on request from the corresponding author.

Acknowledgments

The authors would like to thank the board of editors and the anonymous reviewers for their time and suggestions, which were most helpful in improving this article.

Conflicts of Interest

The authors declare no competing interests.

Appendix A

Table A1. The top 14 countries with the highest new business density (2006–2020).
RankCountryRank Country
1Hong Kong8Botswana
2Cyprus9Iceland
3New Zealand10Latvia
4Estonia11Mauritius
5Malta12Norway
6United Kingdom13Sweden
7Australia14Georgia

References

  1. IPPC. IPCC, 2023: Climate Change 2023: Synthesis Report, Summary for Policymakers. Contribution of Working Groups I, II and III to the Sixth Assessment Report of the Intergovernmental Panel on Climate Change; Core Writing Team, Lee, H., Romero, J., Eds.; IPCC: Geneva, Switzerland, 2023. [Google Scholar]
  2. UN Environment (Ed.) United Nations Global Environment Outlook—GEO-6: Healthy Planet, Healthy People; Cambridge University Press: Cambridge, UK, 2019; ISBN 9781108627146. [Google Scholar]
  3. Adams, S.; Acheampong, A.O. Reducing Carbon Emissions: The Role of Renewable Energy and Democracy. J. Clean. Prod. 2019, 240, 118245. [Google Scholar] [CrossRef]
  4. Günzel-Jensen, F.; Rask, M. Combating Climate Change through Collaborations? Lessons Learnt from One of the Biggest Failures in Environmental Entrepreneurship. J. Clean. Prod. 2021, 278, 123941. [Google Scholar] [CrossRef]
  5. Khezri, M.; Karimi, M.S.; Naysary, B. Exploring the Impact of Entrepreneurial Indicators on CO2 Emissions within the Environmental Kuznets Curve Framework: A Cross-Sectional Study. Environ. Dev. Sustain. 2024. [Google Scholar] [CrossRef]
  6. Omri, A. Entrepreneurship, Sectoral Outputs and Environmental Improvement: International Evidence. Technol. Forecast. Soc. Change 2018, 128, 46–55. [Google Scholar] [CrossRef]
  7. Omri, A.; Afi, H. How Can Entrepreneurship and Educational Capital Lead to Environmental Sustainability? Struct. Change Econ. Dyn. 2020, 54, 1–10. [Google Scholar] [CrossRef]
  8. Houqe, M.N.; Abdelfattah, T.; Zahir-ul-Hassan, M.K.; Ullah, S. Impact of Business Strategy on Carbon Emissions: Empirical Evidence from U.S. Firms. Bus. Strategy Environ. 2024, 33, 5939–5954. [Google Scholar] [CrossRef]
  9. Li, P.; Liu, X. Does Business Environment Optimization Improve Carbon Emission Efficiency? Evidence from Provincial Panel Data in China. Environ. Sci. Pollut. Res. 2024, 31, 24077–24098. [Google Scholar] [CrossRef]
  10. Morgan, E.; Foxon, T.J.; Tallontire, A. ‘I Prefer 30°’?: Business Strategies for Influencing Consumer Laundry Practices to Reduce Carbon Emissions. J. Clean. Prod. 2018, 190, 234–250. [Google Scholar] [CrossRef]
  11. Yi, L. E-Business/ICT and Carbon Emissions. In Impact of E-Business Technologies on Public and Private Organizations: Industry Comparisons and Perspectives; Bak, Ö., Stair, N., Eds.; IGI Global: Hershey, PA, USA, 2011; pp. 1833–1852. [Google Scholar]
  12. Dogan, E.; Seker, F. The Influence of Real Output, Renewable and Non-Renewable Energy, Trade and Financial Development on Carbon Emissions in the Top Renewable Energy Countries. Renew. Sustain. Energy Rev. 2016, 60, 1074–1085. [Google Scholar] [CrossRef]
  13. Shah, W.U.H.; Hao, G.; Yan, H.; Zhu, N.; Yasmeen, R.; Dincă, G. Role of Renewable, Non-Renewable Energy Consumption and Carbon Emission in Energy Efficiency and Productivity Change: Evidence from G20 Economies. Geosci. Front. 2024, 15, 101631. [Google Scholar] [CrossRef]
  14. Feki, C.; Mnif, S. Entrepreneurship, Technological Innovation, and Economic Growth: Empirical Analysis of Panel Data. J. Knowl. Econ. 2016, 7, 984–999. [Google Scholar] [CrossRef]
  15. Schumpeter, J.A. Capitalism, Socialism and Democracy; Routledge: London, UK, 2003; ISBN 9780203202050. [Google Scholar]
  16. Śledzik, K. Schumpeter’s View on Innovation and Entrepreneurship. In Management Trends in Theory and Practice; Hittmar, S., Ed.; University of Zilina & Institute of Management by University of Zilina: Zilina, Slovakia, 2013. [Google Scholar]
  17. Spencer, A.S.; Kirchhoff, B.A.; White, C. Entrepreneurship, Innovation, and Wealth Distribution. Int. Small Bus. J. Res. Entrep. 2008, 26, 9–26. [Google Scholar] [CrossRef]
  18. Cabellero, R.J. Creative Destruction. In Economic Growth; Derlauf, S.N., Blume, L.E., Eds.; Palgrave Macmillan: London, UK, 2008; pp. 24–29. [Google Scholar]
  19. Kuznets, S. Economic Growth and Income Inequality. In The Gap Between Rich and Poor; Mitchell, A.S., Ed.; Routledge: New York, NY, USA, 2019; pp. 25–37. [Google Scholar]
  20. Grossman, G.; Krueger, A. Environmental Impacts of a North American Free Trade Agreement; National Bureau of Economic Research: Cambridge, MA, USA, 1991. [Google Scholar]
  21. Stern, D.I. The Environmental Kuznets Curve. In Companion to Environmental Studies; Castree, N., Hulme, M., Proctor James, D., Eds.; Routledge: London, UK, 2018; pp. 49–54. [Google Scholar]
  22. Kasman, A.; Duman, Y.S. CO2 Emissions, Economic Growth, Energy Consumption, Trade and Urbanization in New EU Member and Candidate Countries: A Panel Data Analysis. Econ. Model. 2015, 44, 97–103. [Google Scholar] [CrossRef]
  23. Fritsch, M.; Falck, O. New Business Formation by Industry over Space and Time: A Multidimensional Analysis. Reg. Stud. 2007, 41, 157–172. [Google Scholar] [CrossRef]
  24. Audretsch, D.B.; Falck, O.; Feldman, M.P.; Heblich, S. Local Entrepreneurship in Context. Reg. Stud. 2012, 46, 379–389. [Google Scholar] [CrossRef]
  25. Aldrich, H.; Zimmer, C. The Art and Science of Entrepreneurship. In Entrepreneurship Through Social Networks; Sexton, D., Smilor, R., Eds.; Ballinger Publishing Company: Cambridge, MA, USA, 1986; pp. 3–23. [Google Scholar]
  26. Carbonara, E.; Santarelli, E.; Tran, H.T. De Jure Determinants of New Firm Formation: How the Pillars of Constitutions Influence Entrepreneurship. Small Bus. Econ. 2016, 47, 139–162. [Google Scholar] [CrossRef]
  27. Kopczewska, K.; Kubara, M.; Kopyt, M. Population Density as the Attractor of Business to the Place. Sci. Rep. 2024, 14, 22234. [Google Scholar] [CrossRef]
  28. Fritsch, M.; Schroeter, A. Why Does the Effect of New Business Formation Differ across Regions? Small Bus. Econ. 2011, 36, 383–400. [Google Scholar] [CrossRef]
  29. Mueller, P. Exploiting Entrepreneurial Opportunities: The Impact of Entrepreneurship on Growth. Small Bus. Econ. 2007, 28, 355–362. [Google Scholar] [CrossRef]
  30. Cumming, D.; Johan, S.; Zhang, M. The Economic Impact of Entrepreneurship: Comparing International Datasets. Corp. Gov. Int. Rev. 2014, 22, 162–178. [Google Scholar] [CrossRef]
  31. Klapper, L.; Lewin, A.; Delgado, J.M.Q. The Impact of the Business Environment on the Business Creation Process. In Entrepreneurship and Economic Development; Palgrave Macmillan: London, UK, 2011; pp. 108–123. [Google Scholar]
  32. Xu, R.; Murshed, M.; Li, W. Does Political (De)Stabilization Drive Clean Energy Transition? Politická Ekon. 2024, 72, 357–374. [Google Scholar] [CrossRef]
  33. Fritsch, M.; Mueller, P. Effects of New Business Formation on Regional Development over Time. Reg. Stud. 2004, 38, 961–975. [Google Scholar] [CrossRef]
  34. Fritsch, M.; Changoluisa, J. New Business Formation and the Productivity of Manufacturing Incumbents: Effects and Mechanisms. J. Bus. Ventur. 2017, 32, 237–259. [Google Scholar] [CrossRef]
  35. Kasseeah, H. Investigating the Impact of Entrepreneurship on Economic Development: A Regional Analysis. J. Small Bus. Enterp. Dev. 2016, 23, 896–916. [Google Scholar] [CrossRef]
  36. Kwilinski, A.; Lyulyov, O.; Pimonenko, T. Green Economic Development and Entrepreneurship Transformation. Entrep. Bus. Econ. Rev. 2024, 12, 157–175. [Google Scholar] [CrossRef]
  37. An, Q.; Shi, Y. Does Enterprise Digitization Reduce Carbon Emissions? Evidence from China. Chin. J. Popul. Resour. Environ. 2023, 21, 219–230. [Google Scholar] [CrossRef]
  38. Zheng, S.; Jin, S. Is Corporate Green Investment a Determinant of Corporate Carbon Emission Intensity? A Managerial Perspective. Heliyon 2023, 9, e22401. [Google Scholar] [CrossRef] [PubMed]
  39. Tian, H.; Lin, J.; Jiang, C. The Impact of Carbon Emission Trading Policies on Enterprises’ Green Technology Innovation—Evidence from Listed Companies in China. Sustainability 2022, 14, 7207. [Google Scholar] [CrossRef]
  40. Xu, R.; Pata, U.K.; Dai, J. Sustainable Growth through Green Electricity Transition and Environmental Regulations: Do Risks Associated with Corruption and Bureaucracy Matter? Politická Ekon. 2024, 72, 228–254. [Google Scholar] [CrossRef]
  41. Cai, L.; Kwasi Sampene, A.; Khan, A.; Oteng-Agyeman, F.; Tu, W.; Robert, B. Does Entrepreneur Moral Reflectiveness Matter? Pursing Low-Carbon Emission Behavior among SMEs through the Relationship between Environmental Factors, Entrepreneur Personal Concept, and Outcome Expectations. Sustainability 2022, 14, 808. [Google Scholar] [CrossRef]
  42. Zhu, L.; Wang, Y. Entrepreneurship and Carbon Footprints in Sub-Saharan Africa. Probl. Ekorozwoju 2024, 19, 221–231. [Google Scholar] [CrossRef]
  43. Ayoungman, F.Z.; Shawon, A.H.; Ahmed, R.R.; Khan, M.K.; Islam, M.S. Exploring the Economic Impact of Institutional Entrepreneurship, Social Innovation, and Poverty Reduction on Carbon Footprint in BRICS Countries: What Is the Role of Social Enterprise? Environ. Sci. Pollut. Res. 2023, 30, 122791–122807. [Google Scholar] [CrossRef] [PubMed]
  44. Feiock, R.C.; Bae, J. Politics, Institutions and Entrepreneurship: City Decisions Leading to Inventoried GHG Emissions. Carbon Manag. 2011, 2, 443–453. [Google Scholar] [CrossRef]
  45. Fu, Y.; Wang, Z. The Impact of Industrial Agglomeration on Urban Carbon Emissions: An Empirical Study Based on the Panel Data of China’s Prefecture-Level Cities. Sustainability 2024, 16, 10270. [Google Scholar] [CrossRef]
  46. Parrish, B.D.; Foxon, T.J. Sustainability Entrepreneurship and Equitable Transitions to a Low-Carbon Economy. Greener Manag. Int. 2006, 55, 47–62. [Google Scholar] [CrossRef]
  47. Sun, H.; Pofoura, A.K.; Adjei Mensah, I.; Li, L.; Mohsin, M. The Role of Environmental Entrepreneurship for Sustainable Development: Evidence from 35 Countries in Sub-Saharan Africa. Sci. Total Environ. 2020, 741, 140132. [Google Scholar] [CrossRef]
  48. Iqbal, N.; Khan, A.; Gill, A.S.; Abbas, Q. Nexus between Sustainable Entrepreneurship and Environmental Pollution: Evidence from Developing Economy. Environ. Sci. Pollut. Res. 2020, 27, 36242–36253. [Google Scholar] [CrossRef] [PubMed]
  49. Gu, W.; Zheng, X. An Empirical Study on the Impact of Sustainable Entrepreneurship: Based on the Environmental Kuznets Model. J. Bus. Res. 2021, 123, 613–624. [Google Scholar] [CrossRef]
  50. Nkusi, I.J.; Habtezghi, S.; Dolles, H. Entrepreneurship and the Carbon Market: Opportunities and Challenges for South African Entrepreneurs. AI Soc. 2014, 29, 335–353. [Google Scholar] [CrossRef]
  51. Xu, R.; Chen, X.; Dong, P. Nexus among Financial Technologies, Oil Rents, Governance and Energy Transition: Panel Investigation from Asian Economies. Resour. Policy 2024, 90, 104746. [Google Scholar] [CrossRef]
  52. Zhang, Y.; Li, L.; Sadiq, M.; Chien, F. The Impact of Non-Renewable Energy Production and Energy Usage on Carbon Emissions: Evidence from China. Energy Environ. 2024, 35, 2248–2269. [Google Scholar] [CrossRef]
  53. Adebayo, T.S.; Awosusi, A.A.; Rjoub, H.; Agyekum, E.B.; Kirikkaleli, D. The Influence of Renewable Energy Usage on Consumption-Based Carbon Emissions in MINT Economies. Heliyon 2022, 8, e08941. [Google Scholar] [CrossRef]
  54. Yuan, X.; Su, C.-W.; Umar, M.; Shao, X.; Lobonţ, O.-R. The Race to Zero Emissions: Can Renewable Energy Be the Path to Carbon Neutrality? J. Environ. Manag. 2022, 308, 114648. [Google Scholar] [CrossRef] [PubMed]
  55. Sun, Y.; Li, H.; Andlib, Z.; Genie, M.G. How Do Renewable Energy and Urbanization Cause Carbon Emissions? Evidence from Advanced Panel Estimation Techniques. Renew. Energy 2022, 185, 996–1005. [Google Scholar] [CrossRef]
  56. Akram, R.; Chen, F.; Khalid, F.; Ye, Z.; Majeed, M.T. Heterogeneous Effects of Energy Efficiency and Renewable Energy on Carbon Emissions: Evidence from Developing Countries. J. Clean. Prod. 2020, 247, 119122. [Google Scholar] [CrossRef]
  57. Kirikkaleli, D.; Güngör, H.; Adebayo, T.S. Consumption-based Carbon Emissions, Renewable Energy Consumption, Financial Development and Economic Growth in Chile. Bus. Strategy Environ. 2022, 31, 1123–1137. [Google Scholar] [CrossRef]
  58. Yuping, L.; Ramzan, M.; Xincheng, L.; Murshed, M.; Awosusi, A.A.; BAH, S.I.; Adebayo, T.S. Determinants of Carbon Emissions in Argentina: The Roles of Renewable Energy Consumption and Globalization. Energy Rep. 2021, 7, 4747–4760. [Google Scholar] [CrossRef]
  59. Yang, Z.; Zhang, M.; Liu, L.; Zhou, D. Can Renewable Energy Investment Reduce Carbon Dioxide Emissions? Evidence from Scale and Structure. Energy Econ. 2022, 112, 106181. [Google Scholar] [CrossRef]
  60. He, A.; Xue, Q.; Zhao, R.; Wang, D. Renewable Energy Technological Innovation, Market Forces, and Carbon Emission Efficiency. Sci. Total Environ. 2021, 796, 148908. [Google Scholar] [CrossRef]
  61. Saidi, K.; Omri, A. The Impact of Renewable Energy on Carbon Emissions and Economic Growth in 15 Major Renewable Energy-Consuming Countries. Environ. Res. 2020, 186, 109567. [Google Scholar] [CrossRef] [PubMed]
  62. Wang, Z.; Ben Jebli, M.; Madaleno, M.; Doğan, B.; Shahzad, U. Does Export Product Quality and Renewable Energy Induce Carbon Dioxide Emissions: Evidence from Leading Complex and Renewable Energy Economies. Renew. Energy 2021, 171, 360–370. [Google Scholar] [CrossRef]
  63. Mukhtarov, S.; Aliyev, F.; Aliyev, J.; Ajayi, R. Renewable Energy Consumption and Carbon Emissions: Evidence from an Oil-Rich Economy. Sustainability 2022, 15, 134. [Google Scholar] [CrossRef]
  64. Global Carbon Project. CO2 Emissions Data. Available online: https://www.globalcarbonatlas.org/en/CO2-emissions (accessed on 15 June 2025).
  65. World Bank. World Development Indicators. Available online: https://databank.worldbank.org/source/world-development-indicators (accessed on 15 June 2025).
  66. Pesaran, M.H. Testing Weak Cross-Sectional Dependence in Large Panels. Econ. Rev. 2015, 34, 1089–1117. [Google Scholar] [CrossRef]
  67. Pesaran, M.H. General Diagnostic Tests for Cross-Sectional Dependence in Panels. Empir. Econ. 2021, 60, 13–50. [Google Scholar] [CrossRef]
  68. Juodis, A.; Reese, S. The Incidental Parameters Problem in Testing for Remaining Cross-Section Correlation. J. Bus. Econ. Stat. 2022, 40, 1191–1203. [Google Scholar] [CrossRef]
  69. Fan, J.; Liao, Y.; Yao, J. Power Enhancement in High-Dimensional Cross-Sectional Tests. Econometrica 2015, 83, 1497–1541. [Google Scholar] [CrossRef] [PubMed]
  70. Xie, Y.; Pesaran, M.H. A Bias-Corrected Cd Test for Error Cross-Sectional Dependence in Panel Data Models with Latent Factors. 2022. Available online: https://papers.ssrn.com/sol3/papers.cfm?abstract_id=4198155 (accessed on 20 February 2025).
  71. Bersvendsen, T.; Ditzen, J. Testing for Slope Heterogeneity in Stata. Stata J. Promot. Commun. Stat. Stata 2021, 21, 51–80. [Google Scholar] [CrossRef]
  72. Reese, S.; Westerlund, J. Panicca: Panic on Cross-Section Averages. J. Appl. Econom. 2016, 31, 961–981. [Google Scholar] [CrossRef]
  73. Westerlund, J. Panel Cointegration Tests of the Fisher Effect. J. Appl. Econom. 2008, 23, 193–233. [Google Scholar] [CrossRef]
  74. Machado, J.A.F.; Santos Silva, J.M.C. Quantiles via Moments. J. Econ. 2019, 213, 145–173. [Google Scholar] [CrossRef]
  75. Lee, S.-Y.; Ahn, Y.-H. Climate-Entrepreneurship in Response to Climate Change. Int. J. Clim. Change Strat. Manag. 2019, 11, 235–253. [Google Scholar] [CrossRef]
  76. Pricopoaia, O.; Lupașc, A.; Mihai, I.O. Implications of Innovative Strategies for Sustainable Entrepreneurship—Solutions to Combat Climate Change. Sustainability 2024, 16, 9742. [Google Scholar] [CrossRef]
  77. George, G.; Merrill, R.K.; Schillebeeckx, S.J.D. Digital Sustainability and Entrepreneurship: How Digital Innovations Are Helping Tackle Climate Change and Sustainable Development. Entrep. Theory Pract. 2021, 45, 999–1027. [Google Scholar] [CrossRef]
  78. Carlton, D.W. The Location and Employment Choices of New Firms: An Econometric Model with Discrete and Continuous Endogenous Variables. Rev. Econ. Stat. 1983, 65, 440–449. [Google Scholar] [CrossRef]
  79. Gasbarro, F.; Annunziata, E.; Rizzi, F.; Frey, M. The Interplay Between Sustainable Entrepreneurs and Public Authorities: Evidence from Sustainable Energy Transitions. Organ. Environ. 2017, 30, 226–252. [Google Scholar] [CrossRef]
  80. Chambers, D.; Munemo, J. The Impact of Regulations and Institutional Quality on Entrepreneurship. 2017. Available online: https://papers.ssrn.com/sol3/papers.cfm?abstract_id=3066312 (accessed on 4 February 2025).
  81. Wang, C.; Wang, L.; Zhao, S.; Yang, C.; Albitar, K. The Impact of Fintech on Corporate Carbon Emissions: Towards Green and Sustainable Development. Bus. Strategy Environ. 2024, 33, 5776–5796. [Google Scholar] [CrossRef]
Figure 1. Flowchart of estimation strategy.
Sustainability 17 05615 g001
Figure 2. Summary of the estimation results.
Sustainability 17 05615 g002
Table 1. Variable descriptions.
VariablesAcronymMeasurementSource
CO2 emissionsCO2Metric tons per capitaGCA
New business densityNBDNew registrations per 1000 peopleWDI
Economic growth GDPGDP per capita (Constant 2015 US$)WDI
Renewable energyRECRenewable energy consumption (% of total final energy consumption)WDI
PopulationPOPTotal populationWDI
Note: GCA—Global Carbon Atlas, WDI—World Development Indicators.
Table 2. Descriptive statistics.
CO2NBDGDPRECPOP
Mean1.7902.43010.0782.60914.972
Median1.8132.40810.3703.26314.902
Maximum2.9563.66411.2474.41718.021
Minimum0.3140.8527.845−2.30212.624
Std. Dev.0.6230.5030.8891.6241.399
Skewness−0.048−0.190−0.731−1.5950.390
Kurtosis2.3923.0652.4285.0032.697
Chen–Shapiro 0.995 ***1.0010.959 ***0.923 ***0.982 ***
Shapiro–Francia0.979 ***0.9910.910 ***0.811 ***0.954 ***
Note: *** denotes statistical significance at 1%.
Table 3. CSD and SH test results.
VariablesCDCDwCDw+CD *
CO26.82 ***−1.48205.93 ***−1.72 *
NBD6.74 ***−0.62178.51 ***1.28
GDP26.36 ***−1.77 *247.57 ***−0.07
GDP226.43 ***−2.43 **248.26 ***−0.05
REC6.79 ***−1.05253.96 ***−0.92
POP11.64 ***−2.79 ***317.85 ***1.28
Model Residuals12.52 ***−0.37200.67 ***1.86 *
SH testTest stats.p-value
^ CSD2.999 ***0.003
^ adj.CSD6.361 ***0.000
Note: ***, **, and * denote statistical significance at 1%, 5%, and 10%, respectively.
Table 4. Unit root test results.
VariablesLevelFirst Difference
Pa, Pb, PMSBPa, Pb, PMSB
CO2−0.472, −0.447, −0.278−8.300 ***, −5.069 ***, −1.941 **
NBD0.440, 0.473, 0.496−2.761 **, −2.176 **, −1.241
GDP0.715, 0.818, 0.902−1.504 *, −1.254, −0.813
GDP20.644, 0.726, 0.786−1.560 *, −1.304 *, −0.843
REC0.032, 0.033, 0.051−2.114 **, −1.748 **, −0.746
POP−0.230, −0.221, −0.178−2.203 **, −5.093 ***, −1.088
Note: ***, **, and * denote statistical significance at 1%, 5%, and 10%, respectively.
Table 5. Cointegration test results.
DH TestTest Statisticp-Value
DHgroup−2.099 **0.018
DHpanel−1.602 *0.055
Note: ** and * denote statistical significance at 5% and 10%, respectively.
Table 6. Method of moments quantile regression results.
VariablesQuantiles
Q(0.10)Q(0.20)Q(0.30)Q(0.40)Q(0.50)Q(0.60)Q(0.70)Q(0.80)Q(0.90)
NBD0.029
[0.075]
0.047
[0.057]
0.060
[0.047)
0.070 *
[0.041]
0.084 **
[0.038]
0.094 **
[0.039]
0.104 **
[0.044]
0.116 **
[0.052]
0.135 *
[0.070]
GDP7.424 ***
[1.857]
7.464 ***
[1.430]
7.494 ***
[1.171]
7.516 ***
[1.031]
7.547 ***
[0.942]
7.571 ***
[0.986]
7.593 ***
[1.104]
7.619 ***
[1.306]
7.663 ***
[1.746]
GDP2−0.374 ***
[0.103]
−0.379 ***
[0.079]
−0.383 ***
[0.065]
−0.386 ***
[0.057]
−0.390 ***
[0.052]
−0.393 ***
[0.054]
−0.396 ***
[0.061]
−0.399 ***
[0.072]
−0.405 ***
[0.097]
REC−0.181 ***
[0.058]
−0.174 ***
[0.044]
−0.169 ***
[0.036]
−0.165 ***
[0.032]
−0.160 ***
[0.029]
−0.156 ***
[0.030]
−0.152 ***
[0.034]
−0.148 ***
[0.041]
−0.141 ***
[0.054]
POP−0.325
[0.425]
−0.360
[0.327]
−0.385
[0.268]
−0.403 *
[0.236]
−0.429 **
[0.216]
−0.450 **
[0.226]
−0.468 *
[0.253]
−0.490
[0.299]
−0.527
[0.400]
Notes: ***, **, and * denote statistical significance at 1%, 5%, and 10%, respectively. Standard errors [S.E] are in square brackets.
Table 7. Robustness results.
VariablesFMOLSDOLSFE-OLS
Coeff.t-Stats.Coeff.t-Stats.Coeff.t-Stats.
NBD0.082 ***4.920.0790 ***3.730.0798 **−2.42
GDP8.411 ***16.926.241 ***9.537.537 ***6.99
GDP2−0.436 ***−16.26−0.320 ***−8.85−0.389 ***−6.45
REC−0.161 ***−15.33−0.177 ***−6.99−0.162 ***−4.45
POP−0.430 ***−4.47−0.428 ***−3.59−0.421 ***−2.61
Note: *** and ** denote statistical significance at 1% and 5%, respectively.
Disclaimer/Publisher’s Note: The statements, opinions and data contained in all publications are solely those of the individual author(s) and contributor(s) and not of MDPI and/or the editor(s). MDPI and/or the editor(s) disclaim responsibility for any injury to people or property resulting from any ideas, methods, instructions or products referred to in the content.

