Article

Spatial Perception Differences in Mountain City Park for Youth Experience: A Case Study of Parks in Yuzhong District, Chongqing

1
Faculty of Architecture and Urban Planning, Chongqing University, Chongqing 400045, China
2
Key Laboratory of New Technology for Construction of Cities in Mountain Area, Ministry of Education, Chongqing University, Chongqing 400045, China
3
School of Architecture and Urban Planning, Shandong Jianzhu University, Jinan 250101, China
*
Author to whom correspondence should be addressed.
Sustainability 2025, 17(12), 5581; https://doi.org/10.3390/su17125581
Submission received: 8 January 2025 / Revised: 2 June 2025 / Accepted: 13 June 2025 / Published: 17 June 2025
(This article belongs to the Section Sustainable Urban and Rural Development)

Abstract

:
Traditional park designs no longer meet the diverse needs of young users amid rising visitor numbers and environmental challenges. Exploring the impact of mountain city parks on youth is crucial, yet localised studies on their spatial perceptions in such unique environments are lacking. Landscape design based on spatial perception evaluation offers a promising approach for renewing mountain parks to address these complex needs. Therefore, a pilot study was conducted in Chongqing’s Pipa Mountain and Eling Parks, involving questionnaire surveys and on-site spatial data collection. Using principal component analysis to select the visual and auditory indicators most related to environmental satisfaction in the overall park and various types of gathering spaces, the results showed that the first principal component of the visual environment in the entrance platform and key nodes (r = 0.41, r = 0.45), as well as the first principal component of the auditory environment in the entrance platform, path platform, and elevated points (r = 0.67, r = 0.85, r = 0.68), all showed significant positive correlations with environmental satisfaction (p < 0.01). Moreover, naturalness and aesthetics were identified as the main factors influencing environmental satisfaction. A random forest model analysed nonlinear relationships, ranking spatial factors by importance. Simultaneously, SHAP analysis highlighted the effects of key factors like elevation changes, green view index, colour diversity, and natural elements. Elevation changes were positively correlated with satisfaction at elevated points but showed a negative correlation in the overall park environment and other gathering spaces. This study explored space-perception dynamics in mountain city parks, proposing strategies to improve environmental quality in various gathering spaces and the park. These findings support creating liveable mountainous environments and guide “human-centred health,” quality enhancement, and sustainable development in renewing mountain city parks.

1. Introduction

China’s mountainous areas and towns account for nearly half of the country’s total population [1]. These cities often exhibit a closer human–environment relationship than flatland areas because of their multidimensional and rich topographical advantages, terrace spaces at different altitudes, and three-dimensional ecological patterns [2]. Parks are essential for mountainous cities’ ecology and living environment and are characterised by typical “multifunctional and composite values”. They play a significant role in developing ecologically friendly and healthier cities [3]. Owing to topographical constraints, mountainous cities are characterised by uneven park distribution, scarcity, and the multi-layered richness of park spaces. The spatial characteristics of parks and the human–environment relationship in these cities are not only reflected in multi-level accessibility and urban regeneration but also in the interaction between multidimensional perception and three-dimensional spaces. Existing research on mountain city parks has primarily focused on urban public space renewal [4], park renovation [5], environmental effects, and landscape design [1]. In recent years, with urban renewal entering its fourth stage, the focus of research has shifted to how mountain city parks can achieve “human-centred health, quality enhancement,” and sustainable development [6,7]. However, these studies often remain general and lack targeted exploration of specific user groups—particularly youth—whose unique psychological needs and spatial perceptions are frequently overlooked.
Urban parks are widely acknowledged for promoting public health through psychological, physiological, and social benefits [8,9]. Exposure to green environments demonstrates significant stress reduction and enhanced well-being [10], aligning with Stress Recovery Theory [11], which posits that humans have evolved to exhibit positive psychophysiological responses to natural settings due to their historically low-risk, resource-rich characteristics. Empirical studies have consistently shown that green and blue spaces significantly improve mental well-being [12,13], underscoring the critical role of accessible natural environments in promoting urban resilience and individual health. With the growing mental health crisis among youth in China, urban parks offer an essential space for them to reconnect with nature and improve their psychological well-being [14], making it urgent to explore how mountain city parks can contribute to mental health restoration.
Mountain city parks, shaped by natural ecology and urban evolution, are vital for maintaining psychological health, promoting social interaction, and fostering cultural identity. For instance, Wang’s research indicates that cultural heritage sites have notable psychophysiological restorative effects, particularly in terms of fascination [15]. Fekete [16] further corroborates the role of vistas, views, and prospects in maintaining historical authenticity while meeting modern societal and sustainable needs, demonstrating how appropriate landscape design can effectively balance heritage preservation with contemporary demands. Studies targeting young adults have revealed that dynamic landscape elements—such as visual richness, natural soundscapes, and olfactory features—can reduce anxiety, foster social interaction, and stimulate vitality [9,10]. In addition, a systematic review emphasised the critical role of urban park design in promoting physical activity among children and youth, thereby addressing sedentary lifestyles and improving overall health outcomes [17]. These findings indicate the potential of mountainous historical parks to enhance youth well-being by promoting physical activity and facilitating mental restoration through interactions with natural landscapes. Integrating these elements into park design can significantly enhance the youth’s physical, mental, and social health. With the rising presence of youth in mountain city parks, traditional spatial configurations are increasingly inadequate to support their evolving needs for sensory stimulation and environmental quality. As such, a deeper understanding of how youth perceive and interact with diverse gathering spaces is necessary to inform design strategies that better support restorative experiences, social engagement, and physical activity.
According to Schnall [18], embodied perception can be scientifically defined as the process by which perception emerges from the dynamic interaction between the brain, body movement, posture, and the surrounding environment, forming a comprehensive understanding of spatial and situational stimuli. In mountainous park regeneration, user-centred embodied perception enhances urban restorative potential while reinforcing spatial identity and sociocultural meaning. Recent studies have emphasised its relevance in landscape evaluation, particularly in assessing visual and auditory quality [19,20], subjective soundscape perception [21,22], and user preferences [23,24]. Xiang et al. [20] integrated perceived affective qualities of soundscapes (PAQs) and perceived sensory dimensions (PSDs) to evaluate audiovisual interactions in various urban parks. He et al. [25] utilised the “soundwalk approach” to evaluate the acoustic environment of historical districts and proposed strategies for optimising soundscapes in these areas. In embodied perception research methods, Jin et al. [26] examined the link between audiovisual characteristics and behavioural vitality, while Gan et al. [27] analysed the interplay between soundscape and visual preferences. Dai et al. [28] used interviews and thematic analysis to explore youth landscape preferences. However, few studies have addressed embodied perception in youth-oriented mountainous parks, particularly regarding how multisensory spatial experiences shape perception, behaviour, and environmental satisfaction.
Chen et al. [2] examined spatial elements of mountain city parks and their relationship to audiovisual perception, identifying features such as viewshed areas, vegetation richness, and architectural forms as key influencers of visitors’ sensory responses and related physiological and psychological effects. Recent digital innovations—such as 3D laser scanning, 3D modelling, and virtual reality (VR)—have advanced terrain mapping, spatial simulation, and immersive evaluation [29]. Despite their value, these tools remain underutilised in youth-centred, site-specific park design in mountainous contexts. Concurrently, machine learning techniques—particularly random forest (RF) models—have been increasingly applied in urban research. The random forest model is an ensemble learning-based machine learning algorithm that enhances model robustness by constructing multiple decision trees and aggregating their prediction results. It effectively captures the relationships between key predictor variables and the response variable. For example, Miao et al. [30] used RF to address multicollinearity and assess environmental impacts on negative ion concentrations, while Badshah et al. [31] applied it to classify land use and predict urban growth. As urban renewal emphasises “quality enhancement” and “human-centred health,” the concept of “youth-friendly” environments has gained significance in mountainous urban development. Within this framework, embodied perception evaluation offers a critical method for guiding spatial strategies at key gathering nodes, addressing the specific and evolving needs of young users [32].
As urban regeneration increasingly prioritises inclusivity and quality, the notion of “youth-friendliness” has emerged as a critical benchmark for sustainable mountainous urban development [32]. Gathering spaces—informally established through user interaction with terrain, interests, and physical abilities—represent focal areas of social activity in mountainous parks, characterised by visual and auditory heterogeneity and complex spatial dynamics [33,34,35]. Based on the above review, existing studies have begun to focus on the audiovisual quality evaluation of parks in flatland cities [22,27] and users’ needs and preferences for mountainous parks [35]. However, there are still some research gaps: (1) Few studies have investigated the perceptual evaluation of mountain city parks, especially those addressing the relationship between spatial type and perception. (2) Few studies have explored the audiovisual perception preferences of the youth in mountain city parks, particularly those that integrate spatial elements with perception preferences. The relationship between the perceptual evaluation of mountainous parks and environmental satisfaction and the relationship between youth perception evaluations and spatial elements in different gathering spaces requires further exploration. To address these gaps, this study conducts an audiovisual walking survey with youth participants in mountain city parks. We employed principal component analysis (PCA) and constructed a random forest model to investigate the relationship between audiovisual perception and environmental satisfaction among youth in different types of gathering spaces, as well as the connection between environmental satisfaction and spatial elements. This research aims to elucidate the mechanisms underlying the “space–perception” relationship. The findings are intended to inform context-sensitive, youth-friendly landscape strategies that promote psychological restoration, social engagement, and health equity in mountainous urban environments.

2. Materials and Methods

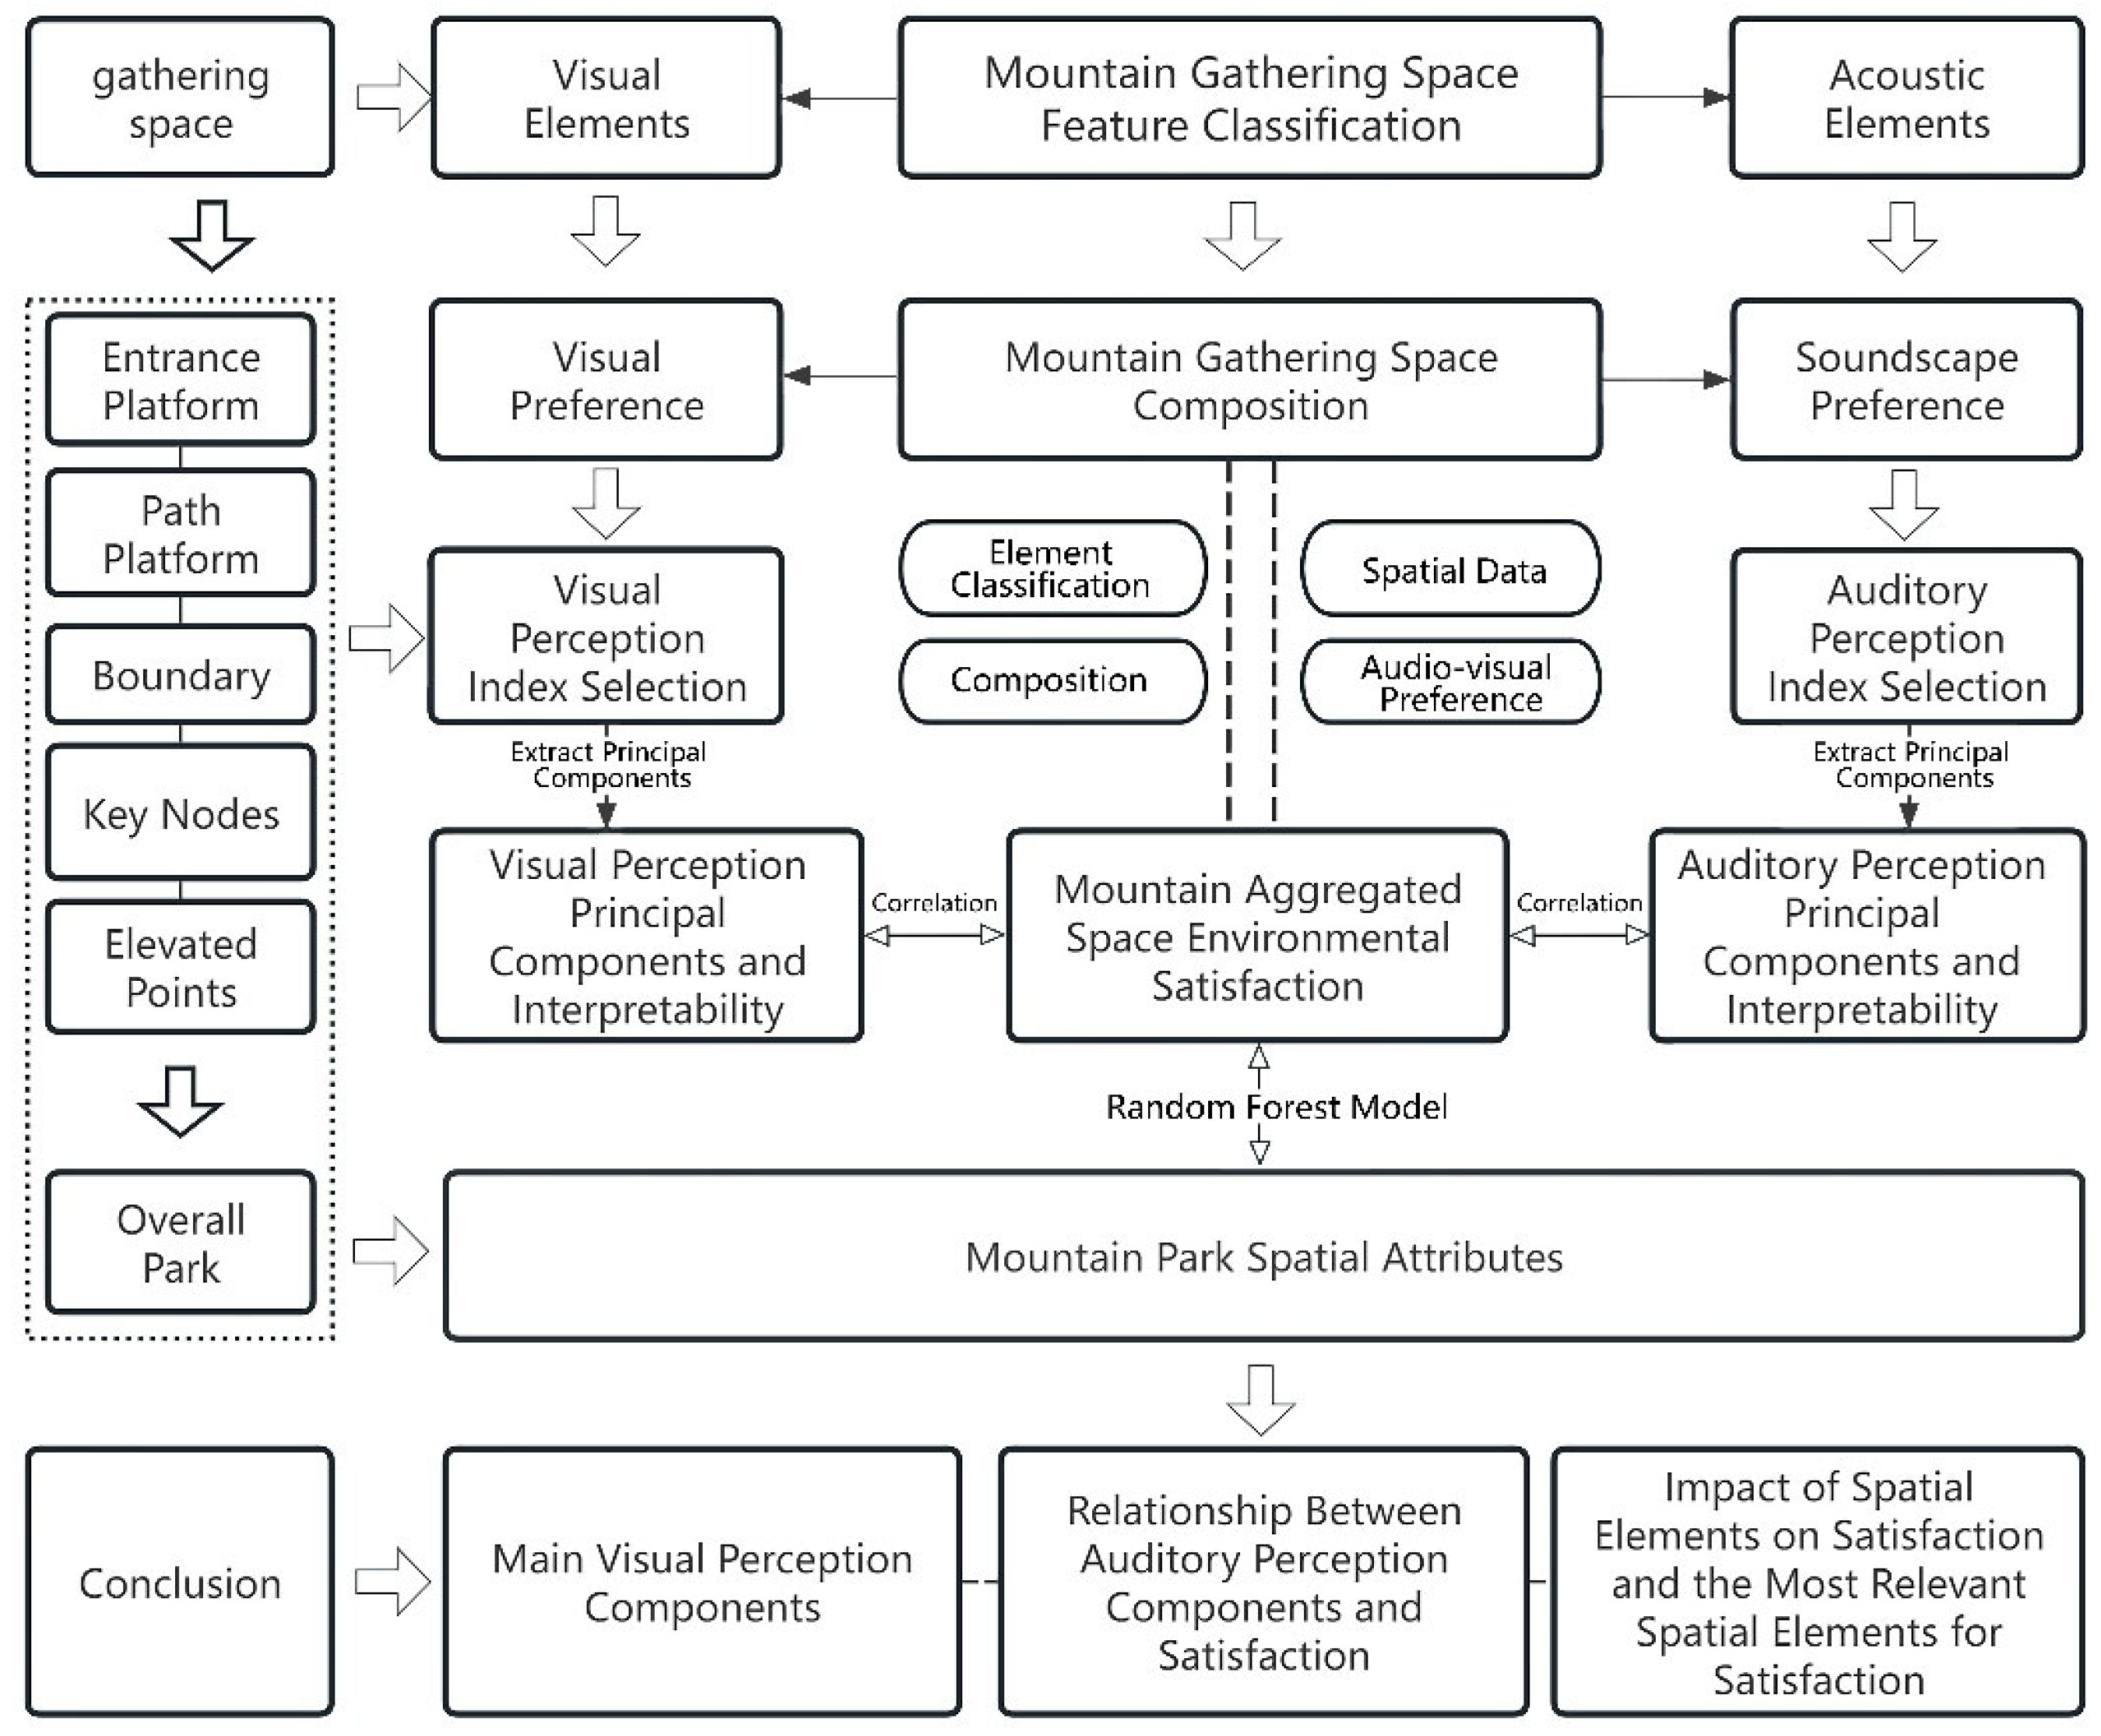
2.1. Research Content
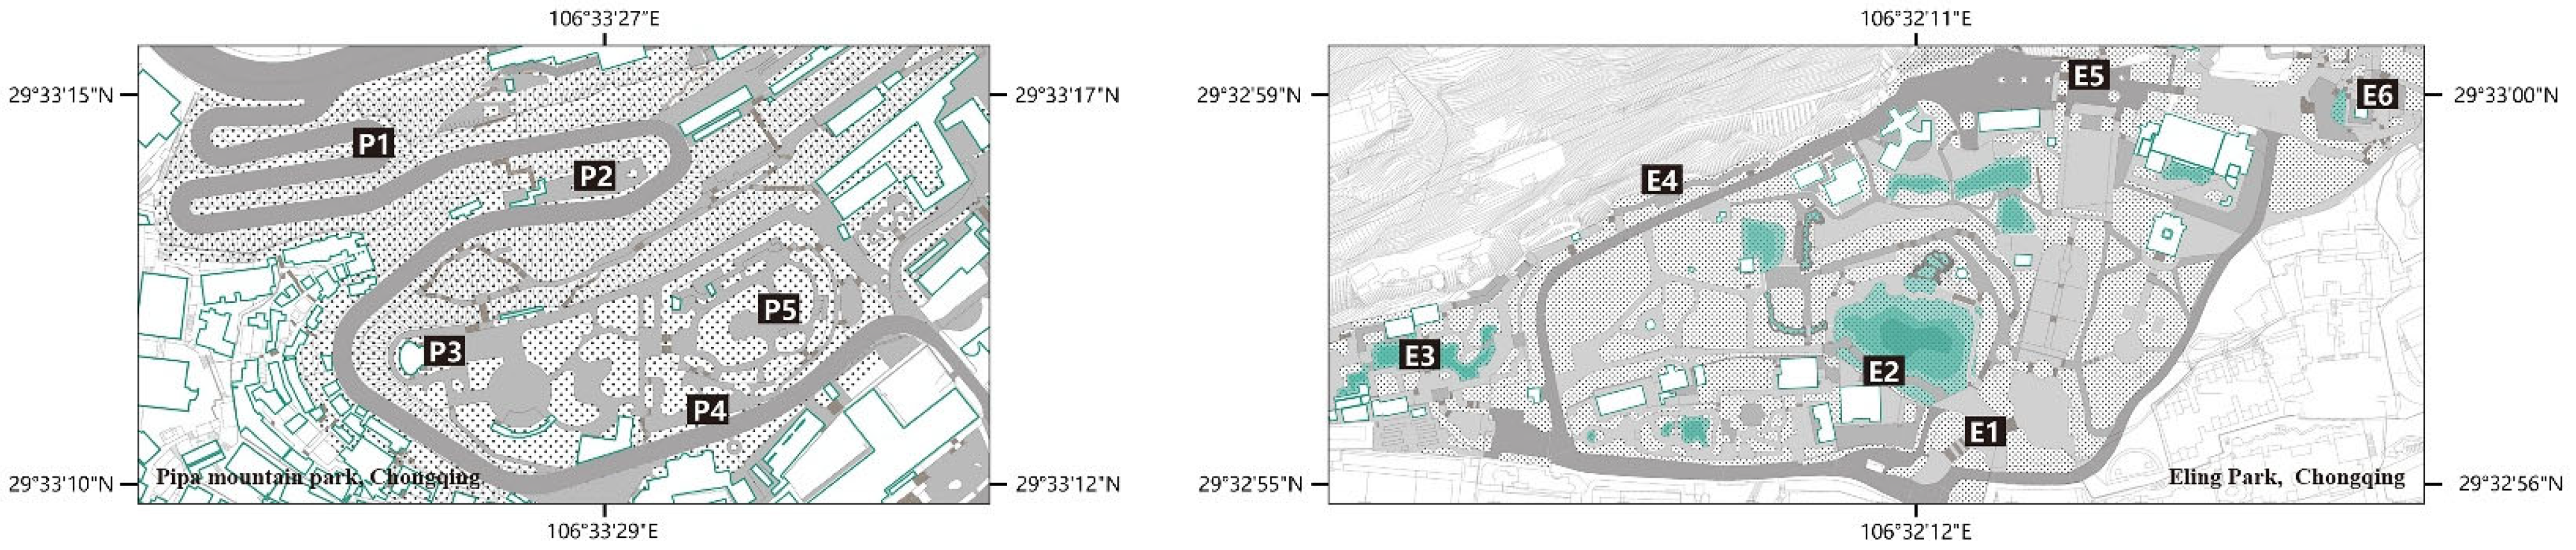
To address the abovementioned issues, this study advances the methodology of ascribing causal connections between the characteristics of mountainous gathering spaces and audiovisual perception. A within-subject field experimental design was employed to explore the relationships among audiovisual preferences, environmental satisfaction, audiovisual perception components, and spatial elements in different gathering spaces within mountain city parks (Figure 1). Through these research steps, this study aims to answer the following questions:
What are the main components of audiovisual perception in different gathering spaces in mountain city parks?
What is the relationship between audiovisual perception components and environmental satisfaction in different gathering spaces in mountain city parks?
To what extent do spatial elements influence environmental satisfaction in the overall environment and different gathering spaces of mountain city parks, and which spatial elements are closely related to environmental satisfaction?

2.2. Study Area

The study was conducted at Pipa Mountain Park and Eling Park in the Yuzhong District, Chongqing. These parks exhibit multi-layered and multidimensional urban spatial patterns that embody the characteristic integration of mountains, water, and cities in mountainous urban environments. Both historic hilltop parks in Yuzhong District have significant ecological and cultural service values as mountain city green spaces encompassing historical landmarks, recreational and leisure facilities, and community activity spaces. Pipa Mountain Park, established in 1920, and Eling Park, established in 1909, have undergone functional spatial transitions from private gardens to institutional recreational parks, commercial scenic parks, and urban parks [36,37]. This study selected five representative gathering spaces in Pipa Mountain Park and six in Eling Park for audiovisual walking surveys.
Based on preliminary investigations, five gathering spaces were chosen as research objects, considering the spatial characteristics of these community parks, visitors’ recreational habits, and the layout of the landscape nodes: entrance platforms, path platforms, key nodes, viewing boundaries, and vantage points. Eleven gathering spaces were selected as perception experiment testing points and sequentially labelled as follows: Eling Park (E1–E6) and Pipa Mountain Park (P1–P5) (Figure 2).

2.3. Participants and Study Design

The selection of study participants aimed to guide university students—a population currently experiencing high levels of stress and depression prevalence—to transition from confined indoor environments to nearby urban parks, thereby exploring the potential therapeutic value of mountain city parks. This study recruited 46 university students aged 19–25 years, including 20 males and 26 females. None of the participants had a history of cardiovascular, mental, or neurological disorders, were not long-term users of prescription medications, had uncorrected or corrected visual acuity below 1.0, or possessed good sensory abilities (primarily vision and hearing). In addition, they demonstrated the ability to correctly understand the relevant indicators in the audiovisual perception evaluation system used in this study. Audiovisual walking surveys were conducted during two periods of high activity: weekday evenings from 17:30 to 20:00 and weekend mornings from 07:30 to 10:30, under suitable temperature and humidity conditions. To ensure the accuracy of the experimental results, all participants were instructed to avoid consuming any stimulants and to get adequate sleep on the day before the experiment to participate in their optimal state. On the day of the experiment, the participants conducted random audiovisual walking surveys at 11 testing points across the two parks, covering five types of gathering spaces, as indicated on the map in Figure 2. Participants engaged in a 5 min perception experience of the soundscape and visual landscape at each testing point, recorded a 1 min audio sample, and completed an on-site questionnaire. The experiment collected 46 questionnaires and 46 audio recordings at each testing point, resulting in 506 questionnaires and 506 audio samples across the 11 testing points in the two parks. After sorting and reviewing the data, the research team finalised 495 valid questionnaires and 495 valid audio samples for analysis.

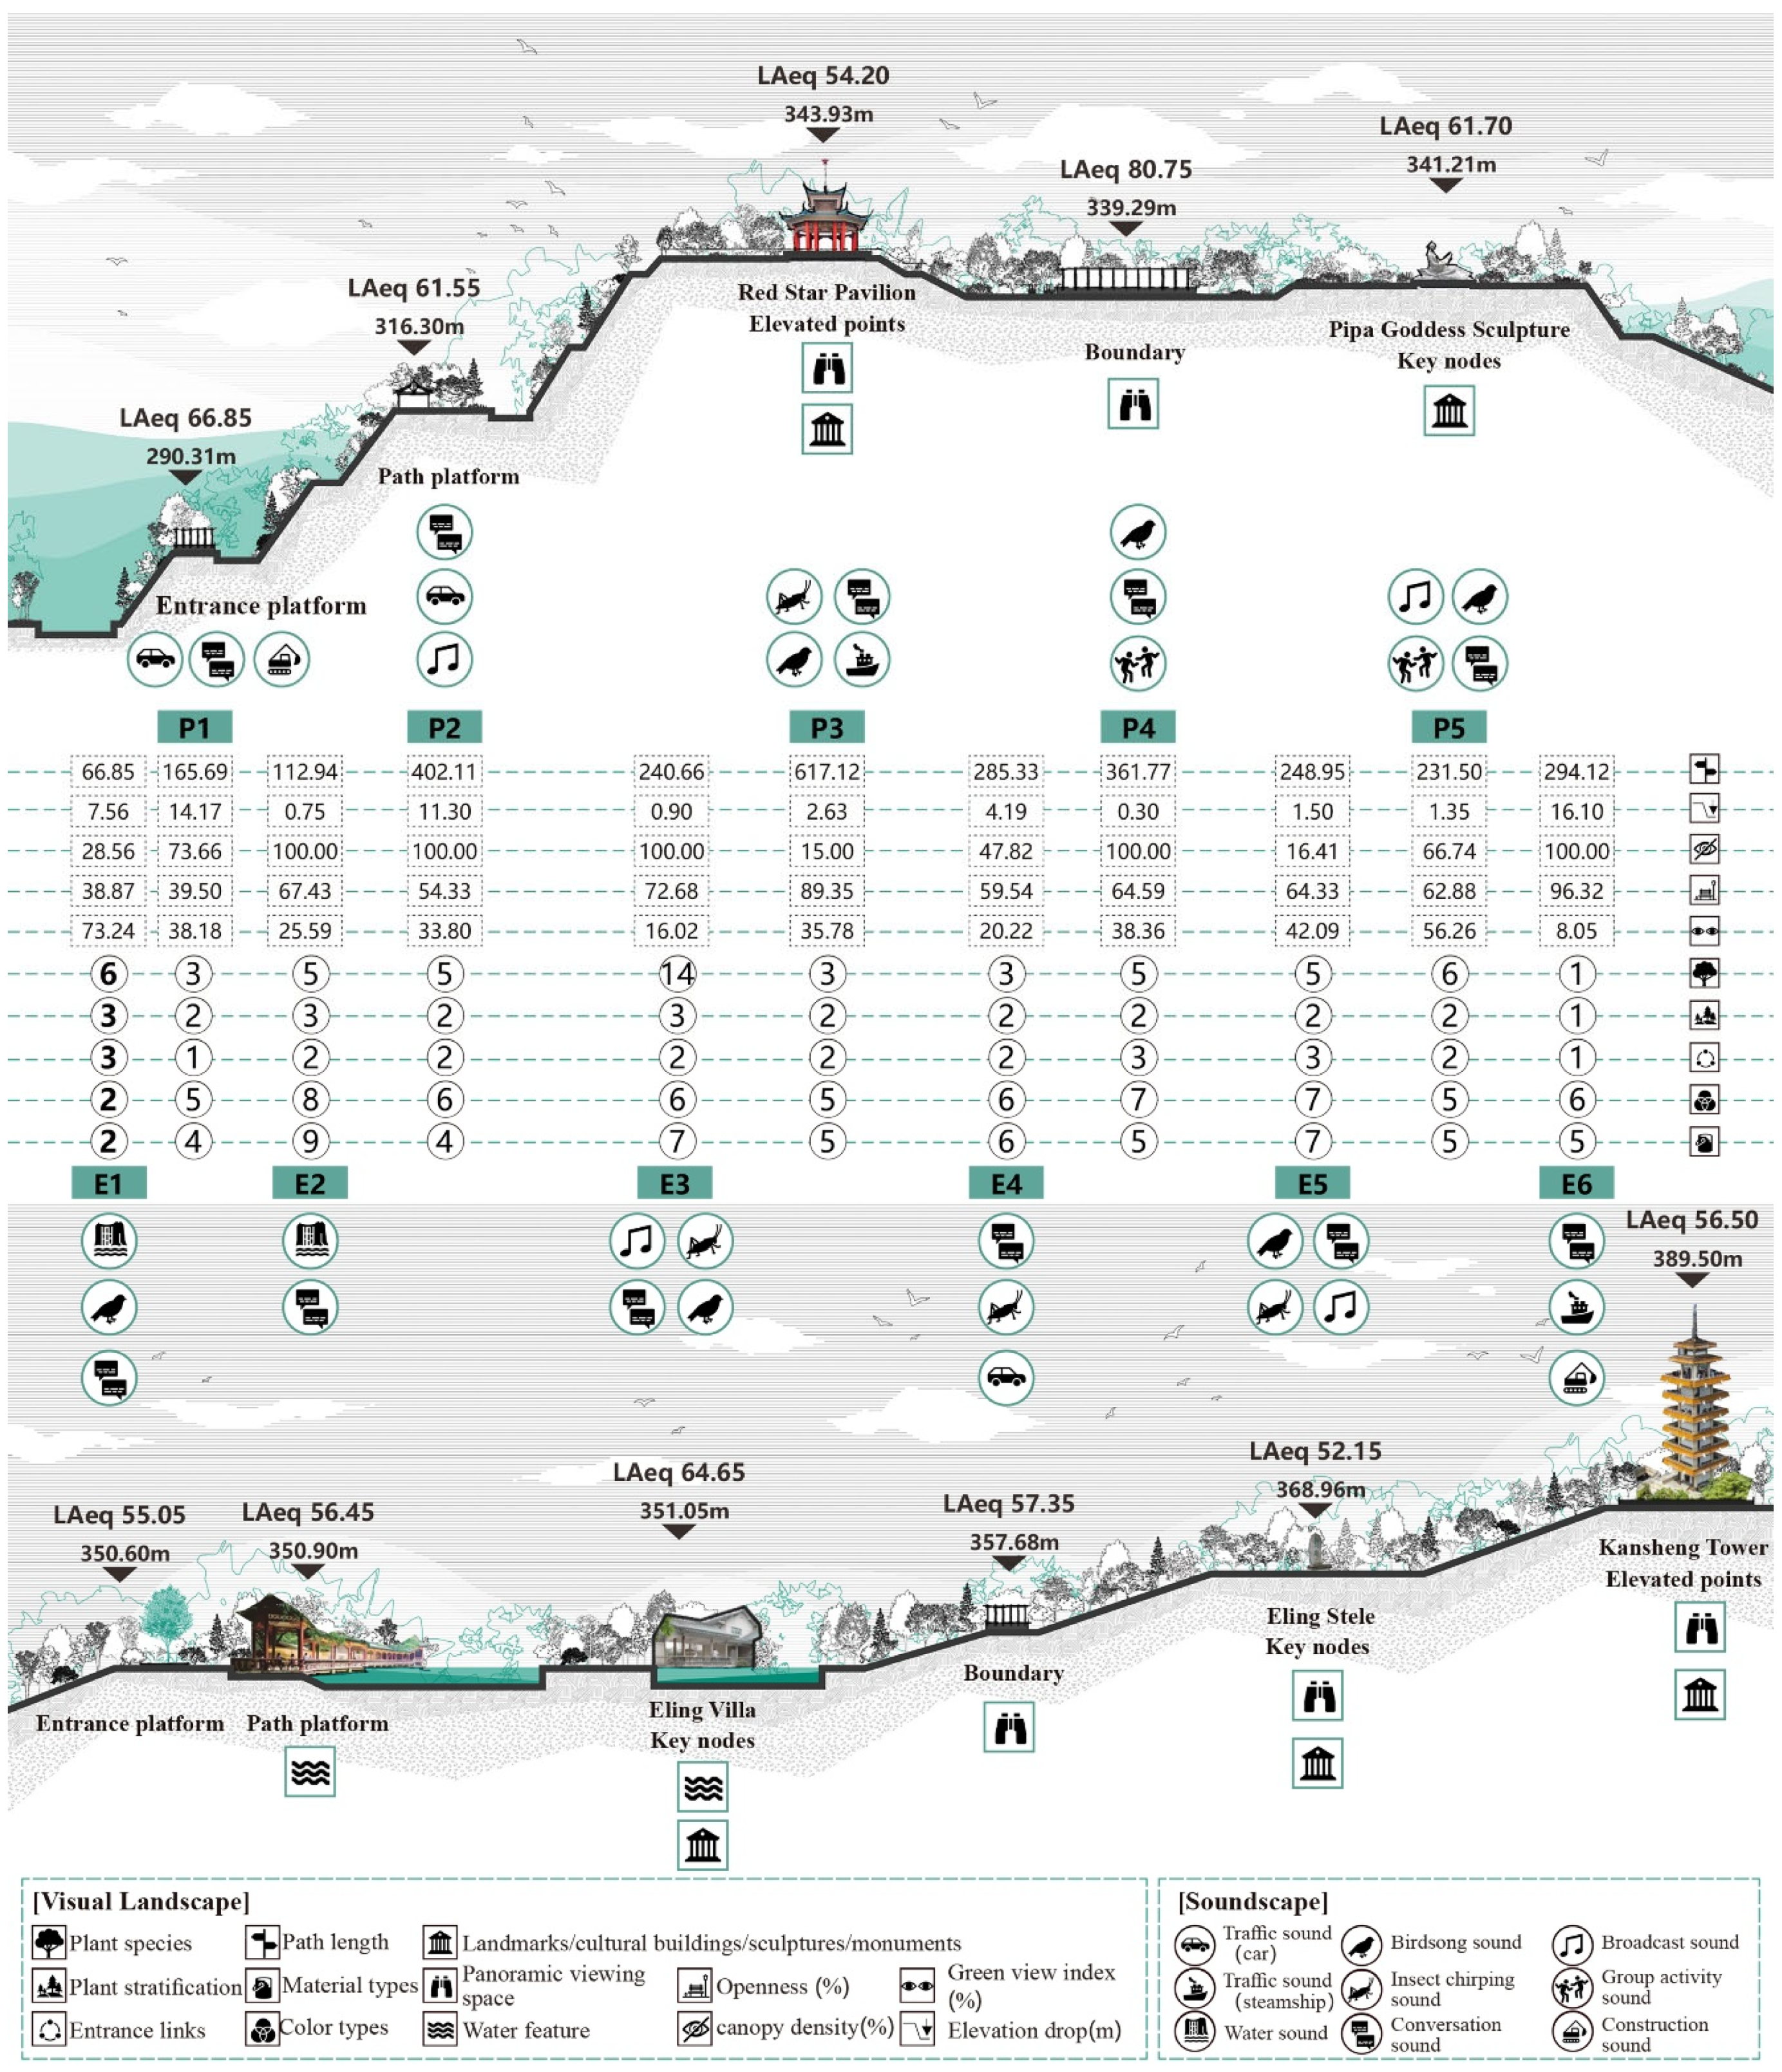
2.4. Spatial Measures

This study explored the principal components of visual and auditory perception in five gathering spaces in mountain city parks and their relationships with spatial elements to apply these findings to spatial perception evaluation and environmental quality improvement in different mountain city parks. This study selected spatial indicators that affect people’s perceptions of mountain city parks, combined with the unique soundscape sources of these parks, to collect data on visual and soundscape spatial elements. The data assignment methods for these elements were categorised into measurement, calculation, and judgment types. The measurement indicators were obtained through instrumentation, judgment-type spatial indicators were based on the presence or absence of such factors in the on-site scene, and calculation-type visual spatial element data were obtained using MATLAB R2020a software to calculate the proportion of spatial elements in the images. For soundscape spatial elements, data were analysed using Adobe Audition 2022 software to calculate the proportion of recording time occupied by the relevant soundscape elements. Based on this, 16 visual spatial element indicators, such as the green view index, openness, and shading rate, were obtained, along with nine soundscape spatial element indicators, such as water sounds and traffic noise. The definitions and calculation methods for these elements are listed in Table 1. Relevant visual spatial element data were collected by photographing images from six directional nodes (sky, ground, east, west, south, and north) and were measured and calculated before the experiment. A PCM-D100 high-fidelity recorder was used for audio acquisition, and normalisation was performed using an Adobe Audition digital audio workstation. During the experiments, weather conditions, such as temperature (18–25 °C), humidity (60–80%), and light levels (100–1500 lx) were controlled. The basic descriptions of the various gathering space features measured according to the spatial data are as follows (Figure 3):
Entrance platform (E1, P1): This was the entry space for the walking path, with internal and external spatial attributes regarding visual and auditory landscapes. As shown in Figure 1, E1 had a high green-view index (73.24%), abundant plant species, and natural sound sources. P1 featured a rich colour scheme with more traffic and mechanical noise.
Path platforms (E2, P2): These were important gathering spaces for mountain walking, serving dual functions: quick passage and stopping. The E2 water corridor node had abundant material and colour attributes, high openness (67.43%), and a high proportion of natural environmental elements. P2, with a historical corridor node, featured a rich colour scheme and conversations as the main sound source.
Key nodes (E3, E5, and P5): These were representative spaces of historical sites with functions that attracted tourists and guided residents’ social interactions. All three locations had rich colours, material schemes, and high openness. E3 at the Goose Mountain Villa contained diverse artificial landscapes and natural sounds. E5 had abundant crowd activity and diverse sound environments at Goose Ridge Monument Plaza. P5 at the Fu Garden node had a high green view index (56.26%) and the most varied types of crowd activities.
Boundary (E4, P4): These were the characteristic spaces representing regional features that attracted tourists and residents to distant locations. Both locations were highly open, with rich visual elements in colour and material.
Elevated points (E6, P3): These were the most significant local mountain walking gathering spaces, offering elevated views and historical and cultural values. Both locations had the highest openness, with rich visual elements in colour and materials and expansive soundscapes. At E6, sounds of ferryboats on the river and rumbling cars on the riverside road were heard.

2.5. Perception Measures

In mountain city park research, spatial perception can be analysed through the presentation of visual and auditory perceptions, with mountainous features also having a certain impact on these perceptions [38]. Therefore, it is essential to focus on the correlation between visual and auditory perceptions and environmental satisfaction in mountain landscapes while also considering the combined effects of visual and auditory perceptions and spatial elements on overall environmental satisfaction. Consequently, spatial perception indicators in the two dimensions of vision and hearing were selected for description.
Over the past 30 years, numerous studies have established paradigms for the visual perception of landscapes. Grahn and Stigsdotter [39,40], through a survey of residents’ landscape preferences, identified eight perceptual indicators that have been widely applied in landscape evaluation and design in Europe [41]: tranquillity, naturalness, openness, diversity, refuge (enclosure and safety), prospect, social, and cultural. In this study, indicators were selected and integrated by combining the environmental characteristics of mountain community parks with semi-structured interviews with residents to form a visual perception framework for mountain park environments. Visual perception indicators included naturalness, openness (prospect and openness), diversity, refuge, social, and cultural, with naturalness, openness, and diversity representing the unique dimensions of the mountain landscape environment. By incorporating factors such as aesthetics [42], comfort [11], and orderliness [39] into visual perception, this study also considered accessibility indicators, including the number of perceptible intersections, entrance/exit distances, and elevation differences [43]. Furthermore, the recognition of Eling Park and Pipa Mountain Park as historical landmarks in the mountain city context [37,44], along with the functionality of these spaces to meet the specific needs of different user groups and generate tangible value over time [37], together formed the 12 dimensions of visual perception in this research.
Research on soundscape perception evaluation includes factors that influence soundscape perception [45], the impact of social interactions on soundscape perception [21,46], and the influence of demographic background factors on soundscape perception [19,45]. The international standard for soundscape research adopted the auditory perception model established by Axelsson et al. [47], which integrated numerous perceptual attributes and principal component analysis results [47,48]. This standard defined eight dimensions of auditory perception: pleasantness, vibration, eventfulness, chaotic, annoying, monotonous, uneventful, and calm. This study adopted these eight dimensions from the standard and incorporated two additional dimensions unique to the multi-elevation environments of mountain community parks: naturalness [49] and diversity [39]. Together, these formed the 10 dimensions of auditory perception used in this study (Table 2). Based on the aforementioned selection of visual and auditory evaluation indicators, this study developed a subjective assessment scale comprising 12 visual indicators and 10 auditory indicators. The scale primarily consists of four sections: (1) personal information, (2) visual perception evaluation, (3) auditory perception evaluation, and (4) overall perception.

2.6. Statistical Analyses

After conducting on-site surveys and data collection, the research team performed a completeness check on the 506 questionnaires, organised the data, and inputted it into the “Wenjuanxing” platform. A total of 495 valid responses were selected. The main analyses and visualisations were conducted using R 4.4.1 and Origin 2021 for the data analysis. The specific data analysis steps were as follows: (1) Reliability and validity tests were performed on the questionnaire responses. (2) Principal component analysis (PCA) was applied to reduce the dimensions of the 12 visual and 10 auditory perception factors. This study aimed to identify the key factors influencing overall environmental satisfaction in five gathering spaces and analyse the relationship between these factors and environmental satisfaction in each gathering space. (3) An RF model was employed to construct a regression between the participants’ subjective evaluations and objective spatial characteristics. The model parameters were optimised to achieve the best performance, and the importance of the spatial variables in the model was ranked. Further analysis using Shapley Additive Explanations (SHAP) was conducted to explore the specific impacts of the key spatial variables on the evaluations.

3. Results

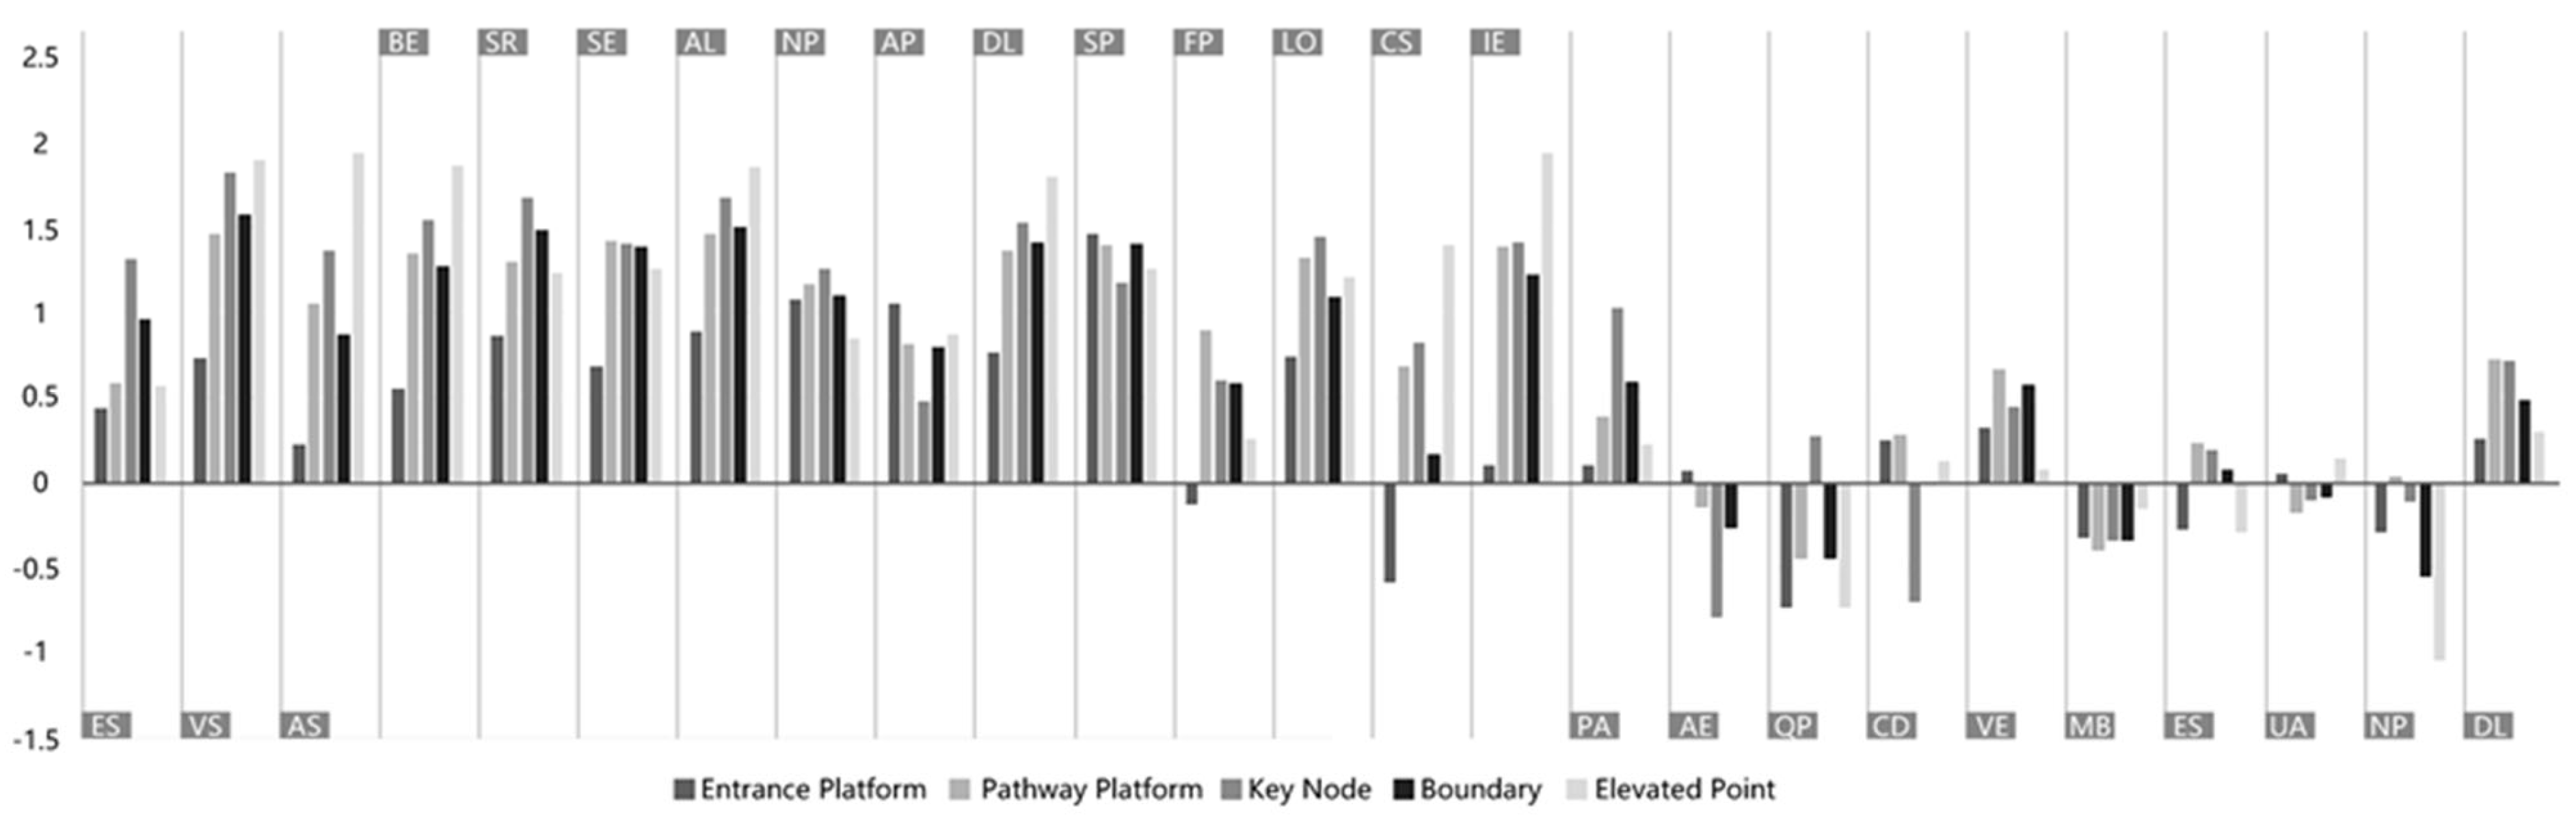
3.1. Subjective Evaluation Statistics of Five Types of Gathering Spaces and Principal Component Analysis of Visual and Acoustic Perception Factors

Reliability and validity tests were conducted on 506 questionnaires (KMO value = 0.722, >0.6; Bartlett’s test of sphericity, p < 0.001), indicating that the data were valid for subsequent analysis. Statistical analysis of the visual and auditory preferences of the young participants revealed that artificial landscapes and service facilities were the most preferred visual types. Regarding auditory preferences, birdsongs, rustling leaves, water, and insect chirping were the most favoured soundscape types. In contrast, artificial sounds, such as conversations, singing, square dancing, and children’s play, were the least preferred. Visual, auditory, and environmental satisfaction data from the five gathering spaces were statistically analysed using Origin 2021, with results presented as bar charts. The results (Figure 4) showed that the elevated points had the highest environmental satisfaction, and participants rated visual and auditory satisfaction as higher at the boundaries, key nodes, and elevated points. Among the visual environment indicators, AL, DL, and IE (recognition) scored the highest, whereas VE (vibrancy) and DL scored the highest among the auditory environment indicators. Furthermore, principal component analysis (PCA) of the subjective evaluations was conducted (Figure 5). The extracted components with a total variance greater than one were the principal components. At the entrance platforms, visual principal component 1 explained 40.25% of the variance, including five factors, with the highest factor loading of 0.83; auditory principal component 1 explained 55.15% of the variance, including five factors, with the highest factor loading of 0.90. On the path platforms, the visual principal component 1 explained 39.14% of the variance, including six factors; the auditory principal component 1 explained 49.17%, including six factors, with the highest factor loading of 0.88. At the boundaries, the visual principal component 1 explained 31.62% of the variance, including four factors, with the highest factor loading of 0.85. In contrast, the auditory principal components 1 and 2 explained 32.17% and 22.16% of the variance, respectively, with all factor loadings of principal component 1 above 0.74. At the key nodes, visual principal component 1 explained 38.63% of the variance, including eight factors, with the highest factor loading of 0.72; auditory principal components 1 and 2 explained 35.23% and 22.34%, respectively, with principal component 1 including five factors, all with factor loadings above 0.69. At the elevated points, visual principal components 1 and 2 explained 32.29% and 14.12% of the variance, respectively, with principal component 1 including six factors; the highest factor loading was 0.79, and auditory principal component 1 explained 40.69% of the variance, including five factors, all with factor loadings above 0.72.

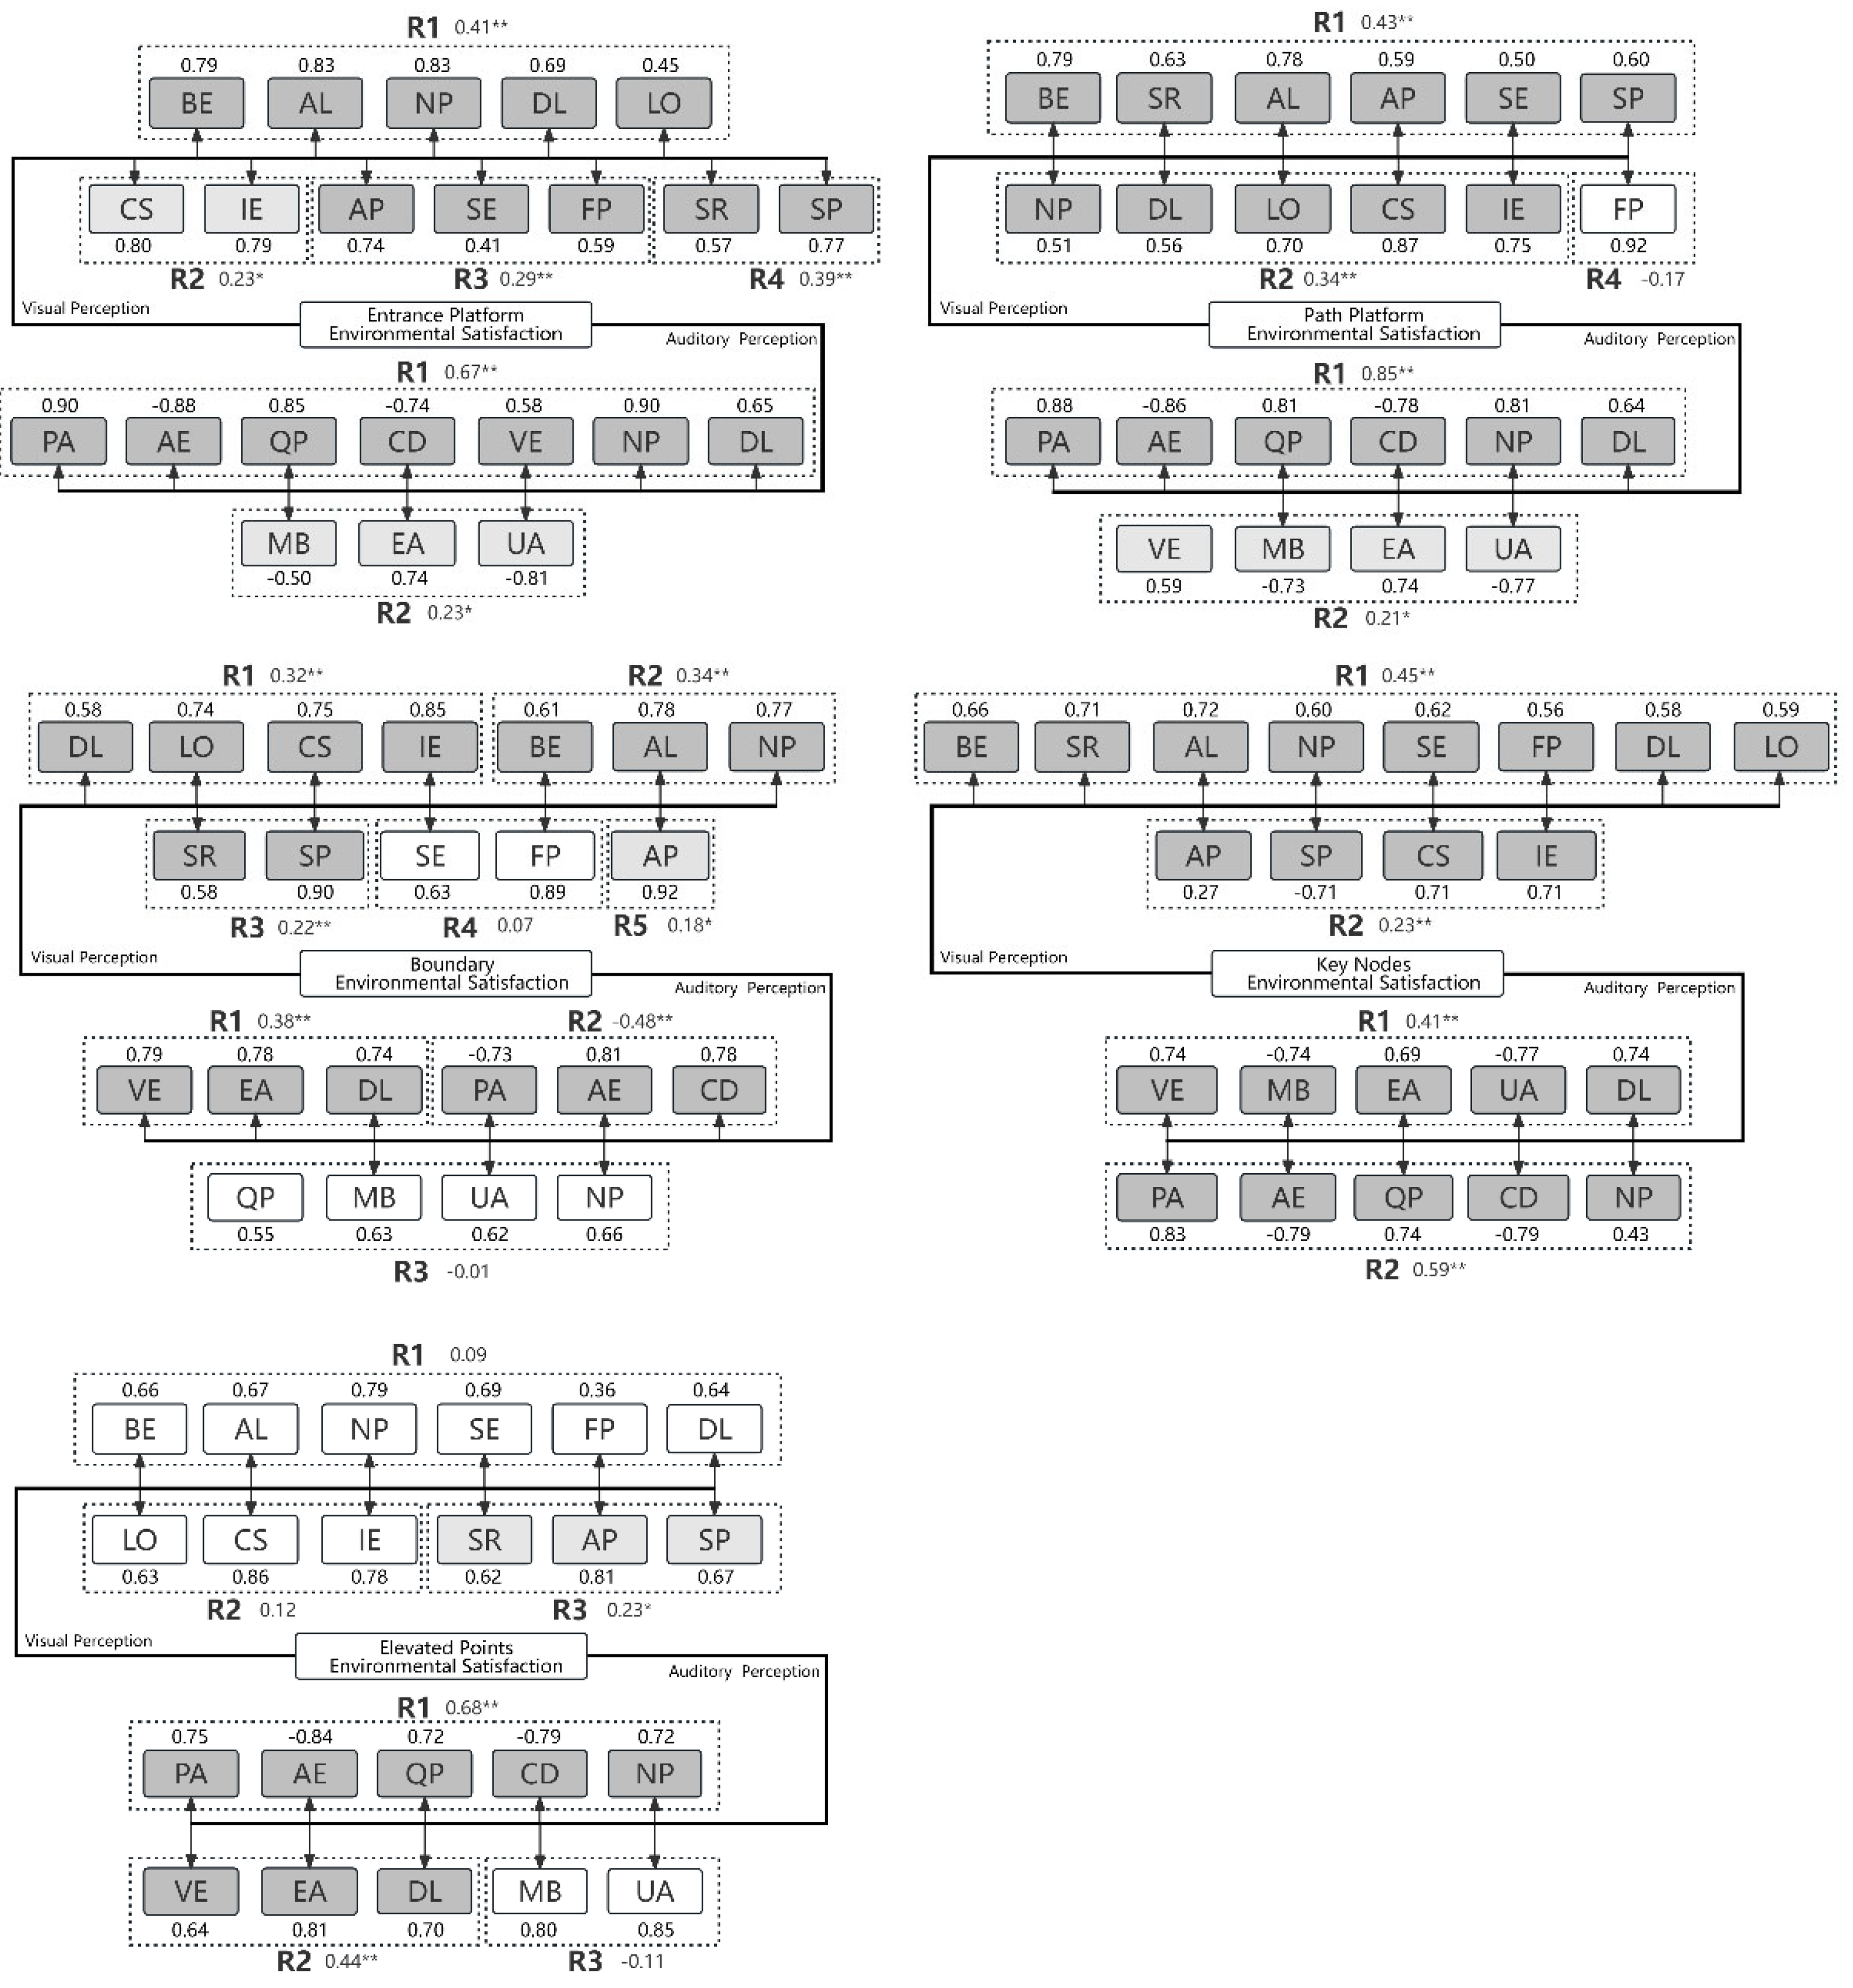
3.2. Construction of Core Influencing Factors of Audiovisual Perception and Their Relationship with Environmental Satisfaction

Principal component analysis of audiovisual perception evaluation data for the five types of gathering spaces and their correlation analysis with environmental satisfaction were performed using R 4.4.1, with results shown in Figure 5. (1) On the entrance platform, the four principal components of visual perception and two principal components of auditory perception were positively correlated with environmental satisfaction (p < 0.05). Factors with high loadings in visual perception included BE, AL, NP, and CS. In auditory perception, the factors PA, NP, AE, QP, and UA had high factor loadings, but both UA and AE had a negative relationship with environmental satisfaction. (2) On the path platform, the first two principal components of visual perception and two principal components of auditory perception were positively correlated with environmental satisfaction (p < 0.05). Visual perception factors BE, CS, AL, and IE and auditory perception factors PA, AE, QP, and NP had high factor loadings. SAE in auditory perception exerted a negative influence on environmental satisfaction. (3) At the boundary, the first three principal components of visual perception and the first two principal components of auditory perception were significantly and positively correlated with environmental satisfaction (p < 0.01). The visual perception factors CS, IE, LO, AL, NP, and SP and auditory perception factors AE, VE, EA, and CD showed high factor loadings. (4) In important nodes, the principal components of both visual and auditory perception were significantly and positively correlated with environmental satisfaction (p < 0.01). Visual perception factors AL, IE, CS, and SP and auditory perception factors PA, UA, AE, and CD had high factor loadings, but SP, AE, and UA negatively impacted environmental satisfaction. (5) At elevated points, the third principal component of visual perception and the first two principal components of auditory perception were positively correlated with environmental satisfaction (p < 0.05). Visual perception factors CS, AP, NP, and IE, and auditory perception factors UA, AE, EA, MB, and CD had high factor loadings. In contrast, AE and CD in auditory perception negatively correlated with environmental satisfaction. From the above analysis, it can be concluded that there are different gathering spaces. However, the specific factor loadings varied; common high-contribution factors frequently appearing in the first principal components included BE, AL, NP, AP, SP, and DL for visual perception and DL, NP, and PA for auditory perception.

3.3. Model Training and Tuning of RF Model for the Five Types of Gathering Spaces

From the principal component analysis, it can be concluded that naturalness, aesthetics, and diversity are the primary factors influencing overall environmental satisfaction, preliminarily confirming that natural elements positively impact the participants’ evaluation of environmental satisfaction. To further analyse which spatial elements significantly influence participants in the comparatively complex environment of mountain city parks and thereby optimise the park’s spatial environment, this study employed a random forest model constructed using R 4.4.1 for investigation. The RF model is a deep learning algorithm based on decision trees that can handle mixed data types and missing data while accurately calculating the importance and influence of variables [53,54]. This study used 17 visual-spatial elements and nine auditory spatial elements as independent variables. Subjective evaluation scores were used as dependent variables to analyse the nonlinear effects of the spatial environment on audiovisual congruence. The 495 samples were divided into training and testing sets at a 4:1 ratio, and Grid SearchCV was used to optimise the model parameters and identify the best parameter combination. A K-fold cross-validation was used to evaluate the reliability of the model. The original dataset was divided into five folds, with one subset selected as the validation set and the remaining four as the training sets for each iteration. This process was repeated five times to mitigate the underfitting or overfitting risks and assess the model’s reliability. The model was trained using the optimal parameters, and its performance was evaluated using metrics such as the coefficient of determination (R2), root mean square error, mean absolute error, and mean bias error (Equations (1)–(3)). The results indicate that the overall model for the park exhibited high accuracy for both the training and testing sets. When exploring the five typical types of gathering spaces in mountain city parks separately (Table 3), the entrance platform, path platform, and elevated points demonstrated high accuracy, effectively analysing the importance and impact of spatial environment characteristics on subjective evaluations. However, the key nodes and boundaries showed lower accuracy than other gathering spaces, suggesting that the spatial environmental characteristics of these spaces had less explanatory power for subjective evaluations. This conclusion was further verified through an analysis of the feature’s importance.
R 2 = 1 i y ^ i y i 2 i y ¯ i y i 2
RSME = i = 1 n y i y ^ i 2 n
MAE = i = 1 n y i y ^ i n

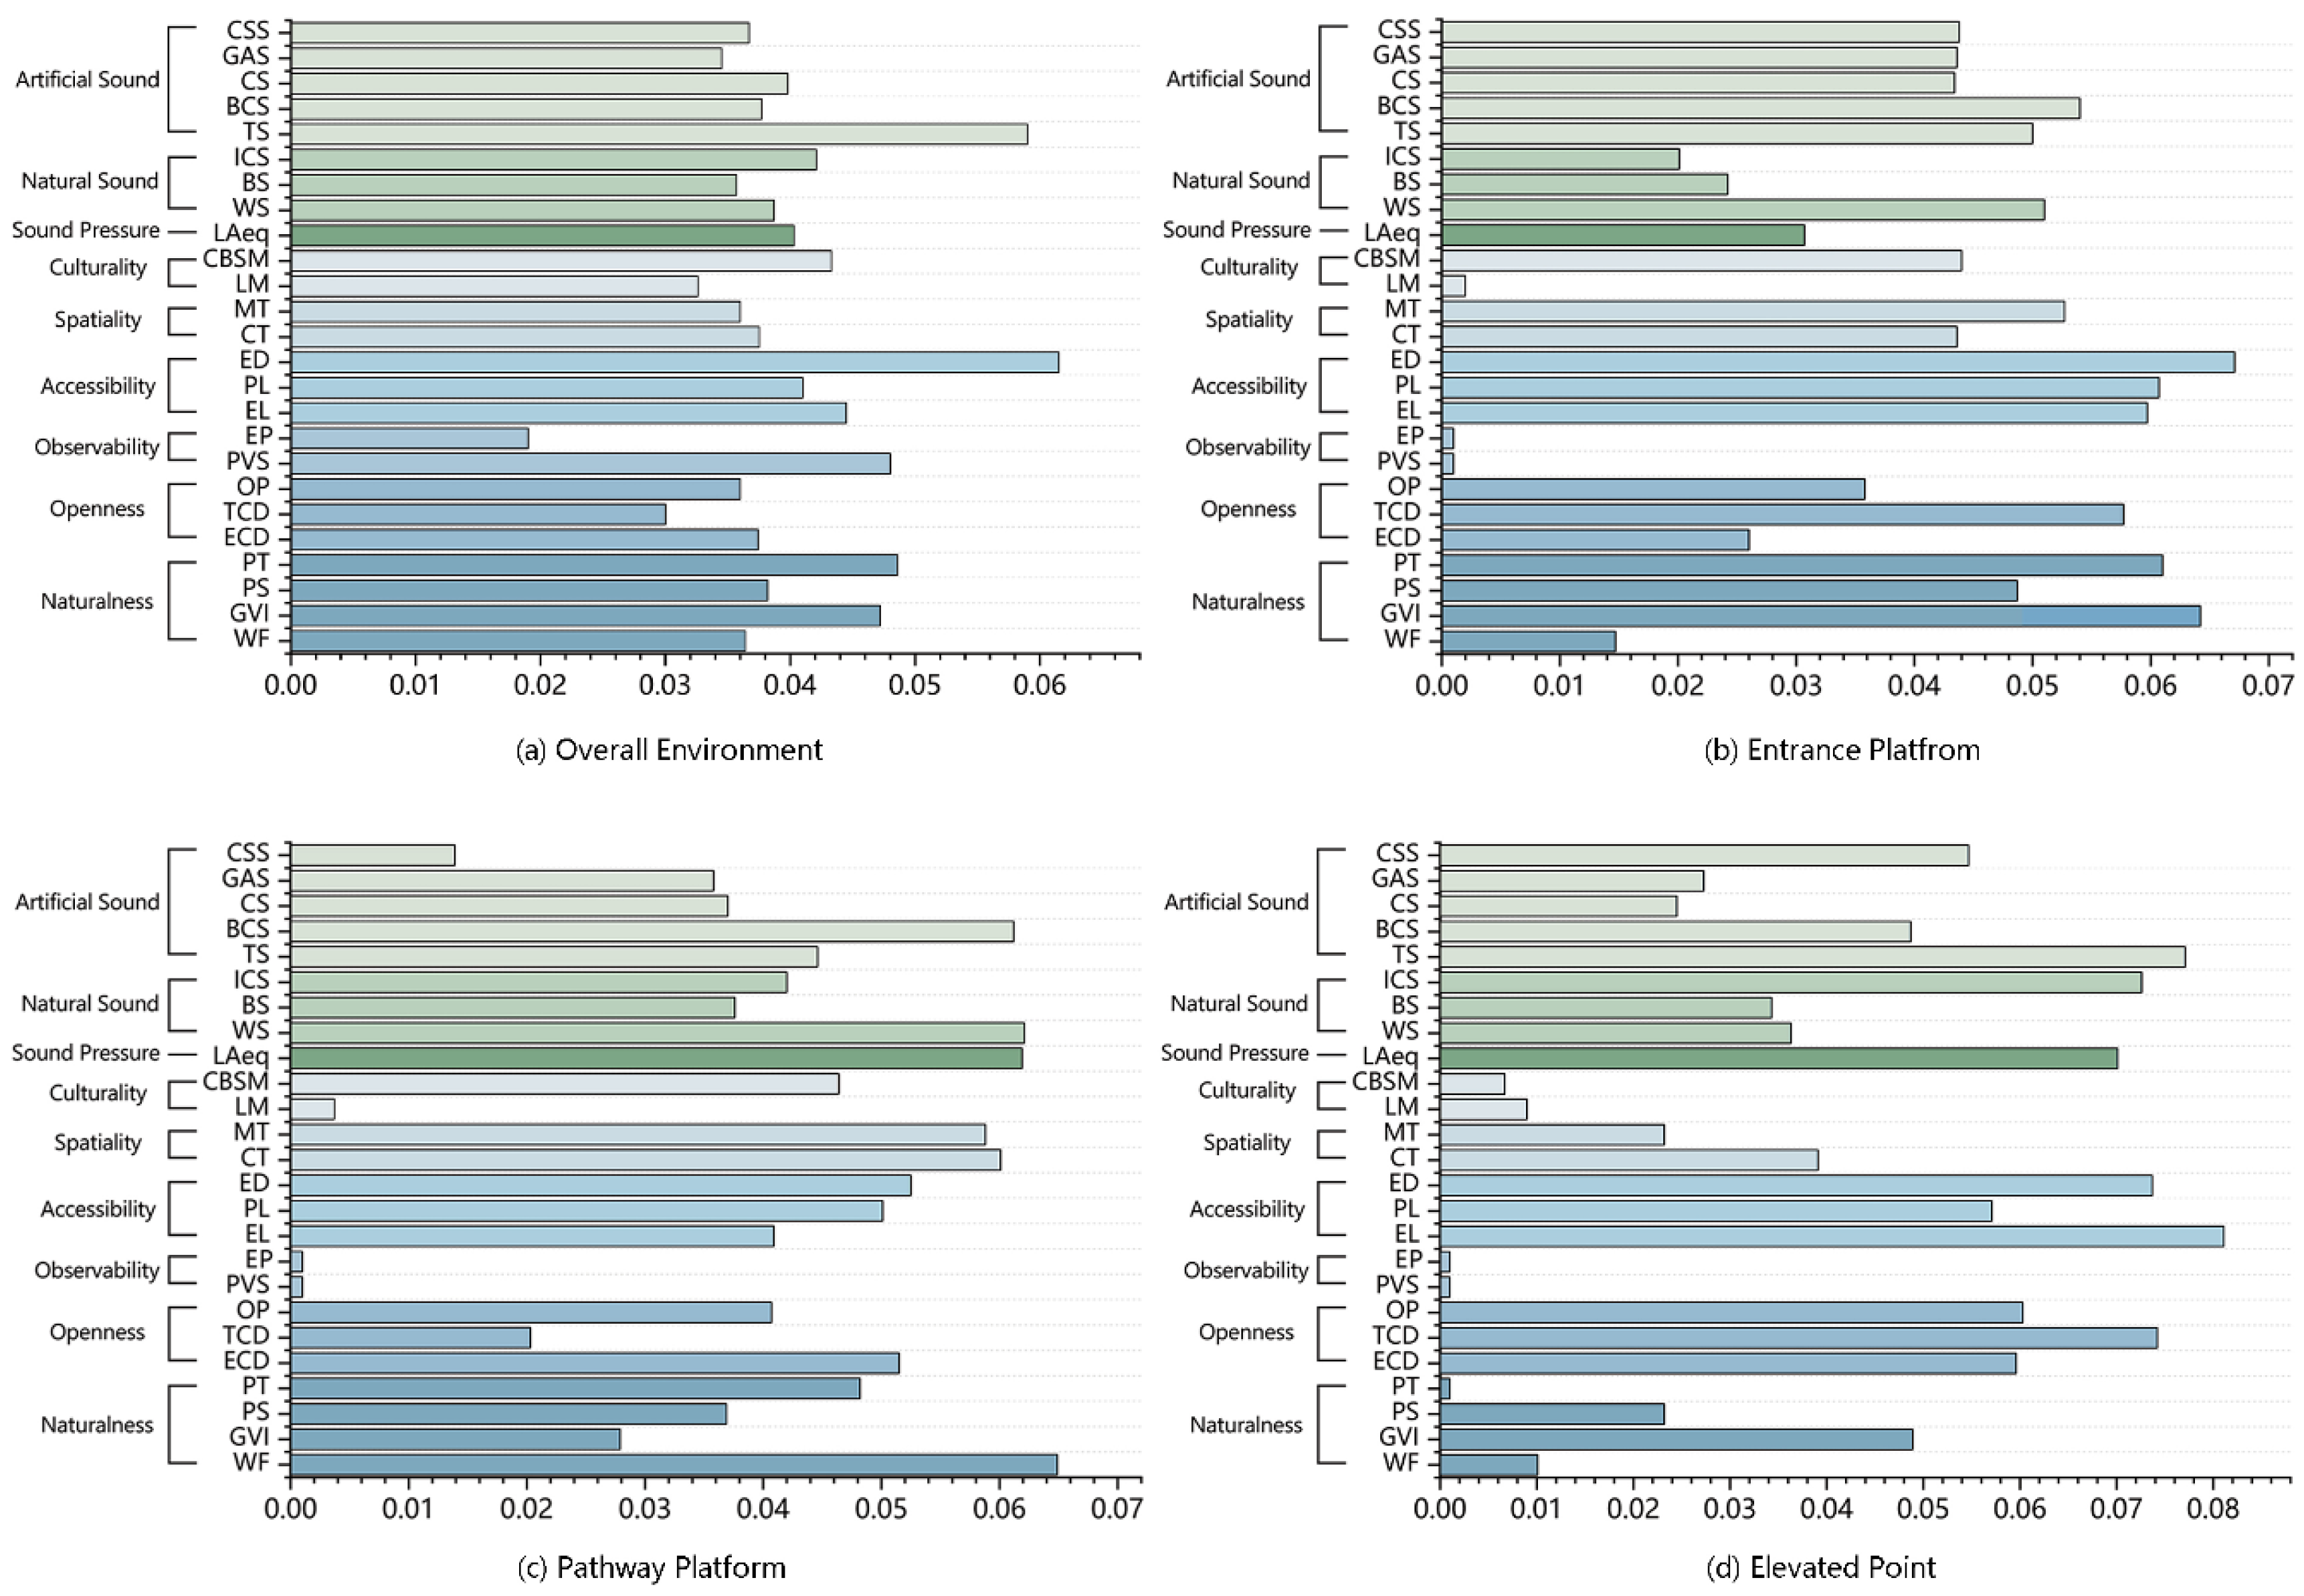
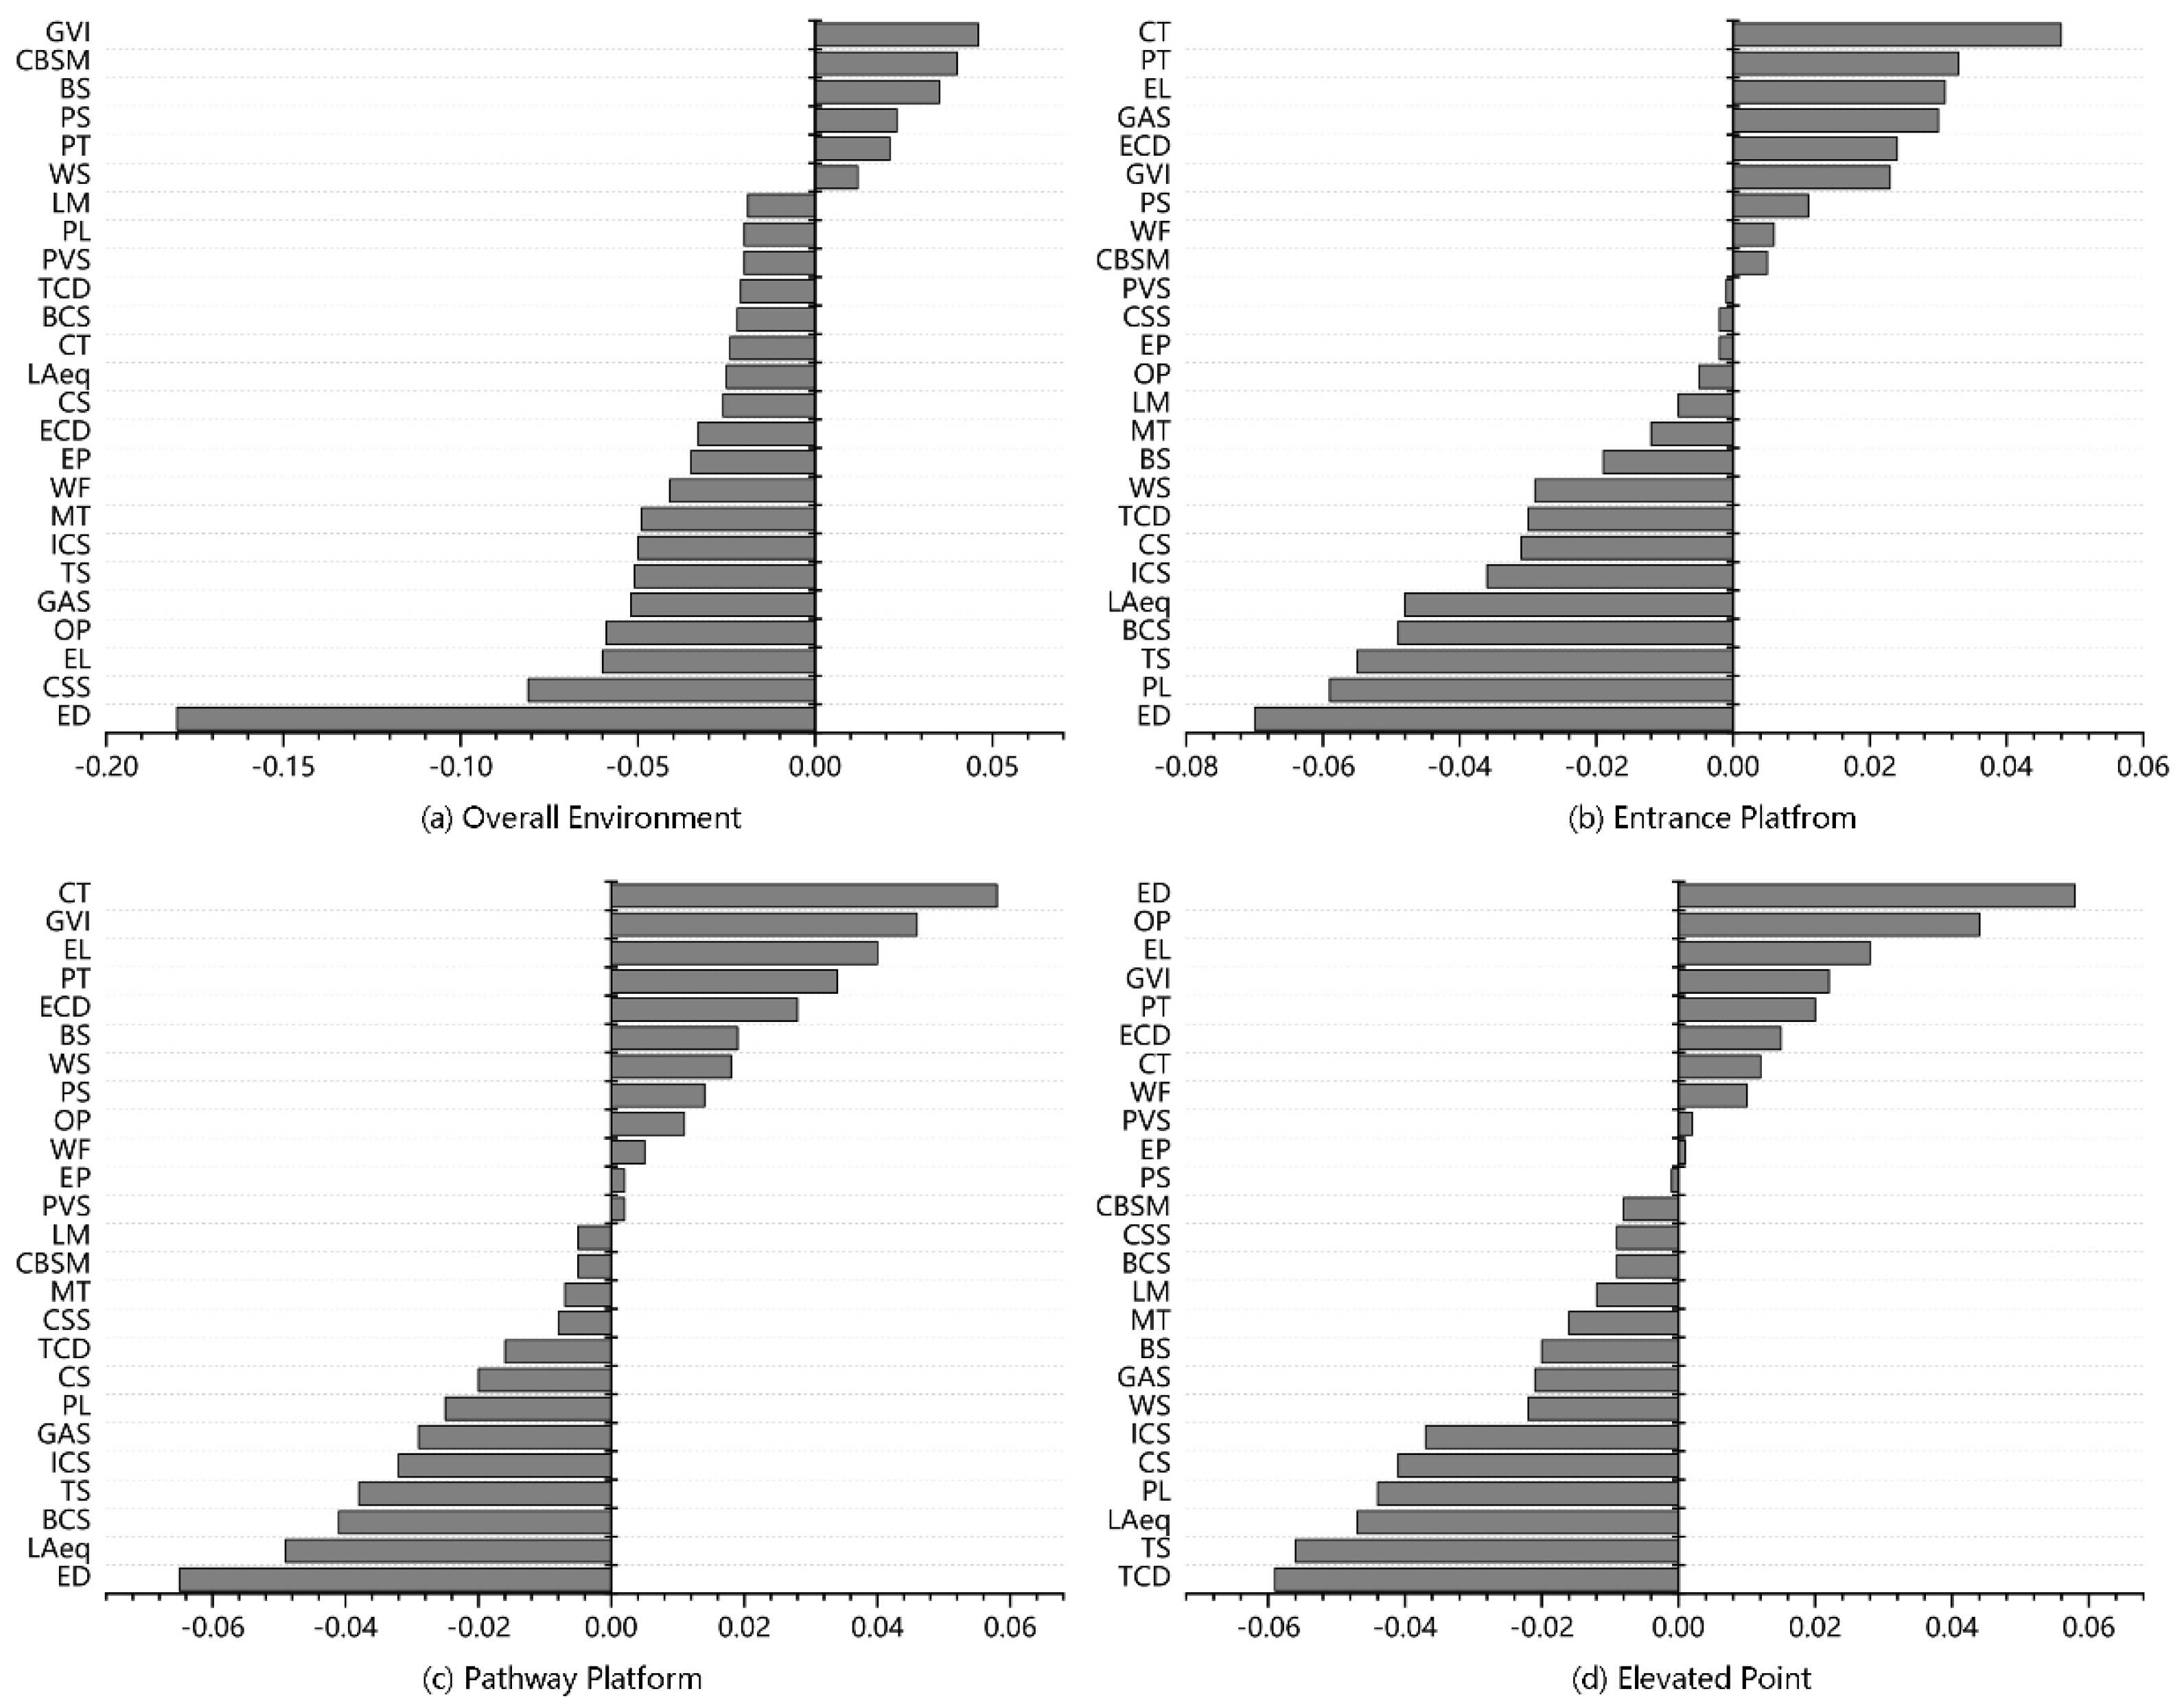
3.4. Variable Importance Ranking and the Relationship Between Spatial Elements and Quality Assessment

Feature importance analysis was conducted for the park and five typical types of gathering spaces. The results indicated that among the visual-spatial elements, elevation drop, plant stratification, openness, green view index, presence of cultural buildings, and number of entrance links were the primary spatial features influencing overall park environmental satisfaction. For auditory spatial elements, natural sounds, such as insect chirping and traffic sounds, were key factors (Figure 6). The analysis results for different gathering spaces revealed that the contribution rates of spatial elements in the key nodes and boundaries were generally low. Combined with the model evaluation results for these two spaces, it can be concluded that their audiovisual spatial elements were not the main factors influencing environmental satisfaction, and other influencing factors may exist. Therefore, further analysis of these two types of spaces was not conducted. The main factors affecting environmental satisfaction were the elevation drop, path length, plant stratification, green-view index, and broadcast sounds. On path platforms, material types, presence of water features, number of colour types, elevation drop, and openness were significant factors influencing participants’ evaluations of environmental satisfaction. At elevated points, the number of entrance links, elevation drop, traffic sounds, and tree canopy density were the primary factors influencing participants’ satisfaction evaluations.
Further SHAP value analysis was implemented using R 4.4.1 (Figure 7). This analysis effectively quantifies the specific impact of each spatial element on environmental satisfaction by assessing both the magnitude of influence through absolute values and the direction of effect through their positive or negative signs. For instance, spatial elements with higher positive SHAP values should be preserved or enhanced in design interventions. The results indicate that the green view index, presence of cultural buildings, plant stratification, and insect chirping sounds positively influenced overall park environmental satisfaction. In contrast, elevation drop, openness, traffic sounds, and number of entrance links had a negative influence. For entrance platforms, the number of entrance links, green view index, and plant stratification significantly positively impacted environmental satisfaction at this node. In contrast, elevation drop and broadcast sound had negative impacts. For path platforms, water features, number of colour types, and material types positively influenced environmental satisfaction, whereas elevation drop and openness had negative effects. For elevated points, the number of entrance links, elevation drop, and openness positively influenced the participants’ environmental satisfaction evaluations, whereas tree canopy density and traffic sounds had the opposite effect.

4. Discussion

4.1. Main Components of Audiovisual Perception

The principal component analysis of audiovisual perception evaluation data from five types of gathering spaces and their correlation with environmental satisfaction revealed the following results. At entrance platforms, NP significantly influenced the environmental satisfaction of young participants. This finding aligns with White et al. [55], who demonstrated that green and blue spaces could significantly improve participants’ emotional responses and mental health. On the path platforms, AL, IE, and NP exhibited high factor loadings. In mountain city parks, significant elevation drops often result in retaining walls that may restrict participants’ views. Good identifiability and naturalness helped participants better understand the overall structure of the mountain paths, thereby enhancing their comfort and psychological sense of safety [56].
Additionally, steep slopes in mountain park paths render factors crucial for comfort, such as platform positioning and material texture, affecting the participants’ environmental satisfaction at these points [57]. At these boundaries, SP and VE had high factor loadings. High openness satisfied participants’ visual needs for distant views, while vibrant sounds like wind and birdsongs enhanced their interaction with the environment in these gathering spaces. IE, CS, AE, and UA significantly influenced environmental satisfaction at the key nodes. Zhang et al. [58] highlighted the positive impacts of landmark landscapes. In mountain city parks, cultural elements enrich the visual experience and act as identifiable landmarks, helping participants establish a clear spatial hierarchy and enhance their overall environmental satisfaction. However, annoying noise and other negative auditory environments significantly diminished the participants’ perceptions. AP and NP were the primary factors influencing environmental satisfaction at the elevated points. Elevated points, often located at mountain peaks, provided high accessibility, which enhanced the participants’ sense of direction and safety. Moreover, the rich natural landscapes at these locations improved participants’ emotional well-being.

4.2. Impact of Spatial Elements on Satisfaction

The above analysis revealed that the spatial elements of key nodes and boundaries in mountain city parks exhibited low explanatory power for environmental satisfaction; this may be attributed to differences in landmarks at key nodes across parks and their roles as multifunctional activity spaces in complex audiovisual environments. Additionally, because of the complex terrain of mountain parks, the accessibility and viewability of boundaries were somewhat constrained, resulting in the spatial elements in these spaces being less effective in explaining variations in participants’ subjective evaluations. Based on the results of the RF model and SHAP analysis of the relationship between spatial elements and subjective evaluations, an overall assessment of mountain city parks indicated that, as confirmed by existing studies, natural elements, such as plant stratification and natural sounds, such as birdsongs, had a positive impact on overall environmental satisfaction. As primary spaces for residents and tourists to rest and recreate, mountain city parks benefit from open views, rich vegetation stratification, and diverse natural sound sources that provide abundant landscape information [59]. Zeng et al. [60] supported this conclusion by suggesting that high vegetation density and natural sound sources promote positive emotions among participants. Accessibility determines the inclusivity and fairness of entrance platforms. As the first stopping point, entrance platforms with excessive elevational differences or poor accessibility impose a cognitive burden, negatively affecting the participants’ overall evaluation of the park’s environmental satisfaction [61]. In mountain parks, significant differences in elevation may lead to the dispersion of gathering spaces, and steep terrain restricts the occurrence of social activities. Path platforms, as traffic network spaces connecting key nodes in mountain city parks, often enhance the visual richness by including water features. These spaces also create natural soundscapes and can leverage materials and colours to shape cultural character and identifiability [50,62]. Elevated points, one of the characteristic spaces of mountainous environments, provide high openness, expansive views, and access to a broader range of environmental elements. Information-rich environments are more likely to stimulate participants’ interest and enjoyment, enhancing their environmental satisfaction evaluations.

4.3. Strategies for Enhancing the Audiovisual Environment in Mountain City Parks

This study found that elevational difference is one of the most influential factors in mountain city parks, affecting the overall environment and various types of gathering spaces to varying degrees. However, when considering individual spaces, differences in elevation can serve as foundational elements for landscape creation in mountain city parks. For example, at elevated points, significant differences in elevation provide an expanded perspective. Elevational differences can be utilised at the entrance and path platforms to create hierarchical spaces and structured spatial sequences with guiding qualities. While previous studies have demonstrated that rich natural elements in the visual and auditory environment and high vegetation density can induce positive emotions [63,64] and alleviate stress in participants [65], this study also revealed that enclosures negatively affect environmental satisfaction on path platforms; this may be because the participants in such spaces focused more on the adequacy of rest facilities during movement and the alleviation of physical fatigue rather than on sightseeing. High enclosure levels may impose a visual burden, negatively influencing participants’ evaluations. Thus, in mountain city parks, tailoring audiovisual environments to the unique spatial features and functional demands of mountainous landscapes is key to enhancing satisfaction. Optimising walking paths and improving the accessibility of entrance platforms are essential at entrances. Incorporating landscape elements to transform elevational differences into spatial highlights could further enhance this experience. Significant elevation differences can be leveraged at key nodes and path platforms to create dynamic natural soundscapes, such as cascading water sounds and layered natural landscapes. Our study revealed that elevational differences were the primary factor influencing subjective evaluations of mountain city parks. In addition, factors such as the number of colours, green view index, and natural sounds also made significant contributions. However, the characteristics of the gathering spaces in mountain city parks vary widely, necessitating a tailored landscape design that aligns with the terrain and topography.

4.4. Limitations and Further Study

This study had several limitations. Primary data were collected from questionnaires completed by park participants. Although the questionnaires were designed based on validated scales, personal emotions, cultural backgrounds, and other factors inevitably influenced the participants’ subjective perceptions. Second, although we selected two representative mountaintop parks, they may not fully represent the environmental characteristics of all mountain city parks. Third, the participants were primarily young individuals and university students, and there may have been psychological perceptions and lifestyle differences across the different age groups. While university students represent a key user group with unique research value (particularly regarding their psychological stress characteristics), the sample’s representativeness remains limited. A single-age demographic may not comprehensively reflect the perceptions and experiences of people from diverse age groups regarding the study subjects. Future research should address these limitations in several ways. First, combining human factor engineering experiments to collect objective measurements, such as physiological or behavioural data, could supplement subjective feedback, provide a more comprehensive understanding of the phenomena studied, and enhance the robustness of the findings. Second, including a broader range of mountain city parks with diverse environmental characteristics would allow comparative studies across various park types, offering deeper insights into how environmental factors influence user perceptions and experiences. Third, future studies should expand the sample population to include a more diverse age range and maintain focus on this specific population while expanding sample diversity (e.g., by including different user groups or stakeholders of urban parks) to enhance the external validity of the findings and provide a stronger basis for advancing the “human-centred health” phases of urban renewal. Fourth, existing research findings could be incorporated into a comprehensive database, enabling the future development of computational models or software for automated optimisation and design of urban parks based on terrain characteristics and optimal audiovisual environmental features.

5. Conclusions

This study combined principal component analysis and RF modelling to comprehensively analyse the relationship between spatial environmental characteristics and subjective evaluations of mountain city parks, providing a theoretical foundation for optimising typical gathering spaces in these parks. This study had some limitations. First, it explored the subjective perceptions of young participants regarding the unique terrain and topography of mountain city parks. Second, the study analysed the influence of spatial environments with mountain-specific characteristics on subjective perceptions, identified the impact of spatial elements on perception, and predicted their influence trends. The study yielded the following conclusions: (1) Visual and auditory priorities: The key visual environmental factors affecting environmental satisfaction were aesthetics, comfort, and naturalness, whereas the key auditory environmental factors were diversity, naturalness, and pleasantness. (2) Quantified terrain impacts: The SHAP analysis further quantified the impact of each environmental factor. In the unique context of mountainous environments, elevation differences and accessibility issues caused by terrain and topography were the primary factors influencing park evaluation quality. Specifically, in the overall environment, elevation drop (SHAP = −0.18) and entrance links (SHAP = −0.06) had negative impacts on environmental satisfaction. Secondary influential factors included naturalness, openness, and cultural elements within the visual environment, as well as natural sounds in the auditory environment. For example, the green view index in path platforms (SHAP = 0.04) and birdsong sounds in the overall environment (SHAP = 0.04) positively affected environmental satisfaction. (3) Spatial trade-offs: Although natural elements significantly improve environmental satisfaction, spatial elements with mountain-specific characteristics also have substantial impacts in complex mountainous environments. Based on the research findings, three practical design recommendations are proposed for policymakers and planners: (1) Terrain mitigation: Municipalities and planners should prioritise gradient-based zoning. Elevation differences should be transformed into spatial hierarchies and visual sequences to create engaging and guiding entry experiences. Policy instruments such as slope-compliance guidelines could standardise this approach. (2) Noise management: Urban renewal projects should allocate budgets for “soundscape corridors” along pathways. Pathways should incorporate water features or dense vegetation to establish natural soundscapes that effectively mask urban noise. Local ordinances could incentivise such designs through green infrastructure tax credits. (3) Function-specific standards: Planning departments should adopt spatial typology guidelines. The degree of enclosure and accessibility should be tailored according to spatial functions—quiet rest spaces benefit from being secluded and enclosed, while social interaction spaces should be open and equipped with supporting amenities. Future research directions should incorporate diverse research methods and analytical techniques, such as physiological data monitoring and the application of artificial neural networks, to enhance the robustness and generalisability of the findings. Ultimately, this approach will contribute to the development of more precise and effective strategies to improve the overall environmental quality of different types of gathering spaces, providing strong support for the human-centred and sustainable design and management of mountain city parks, enhancing public environmental quality in urban renewal, and offering a basis for achieving “human-centred health” “quality enhancement” and sustainable development in the renewal of mountain city parks.

Author Contributions

Conceptualisation, C.G. and C.H.; Data curation, X.Y. and C.H.; Methodology, C.H. and X.Y.; Software, X.Y. and X.G.; Validation, C.G., C.H. and X.Y.; Formal analysis, X.Y. and X.G.; Investigation, C.G., C.H. and X.Y.; Resources, C.G. and C.H.; Writing—original draft preparation, C.G., C.H. and X.Y.; Writing—review and editing, C.G., C.H., X.Y. and X.G.; Visualization, X.Y.; Supervision, C.G., C.H. and X.G.; Project administration, C.G.; Funding acquisition, C.G., C.H. and X.G. All authors have read and agreed to the published version of the manuscript.

Funding

This research was supported by the National Natural Science Foundation of China (grant no. 52308008, 52478006, and 51908078), National Key Research and Development Program of China (2022YFE0208700), Chongqing Youth Research Society (grant No. 2025QN03), and the Fundamental Research Funds for the Central Universities (2024CDJQYJCYJ-001).

Institutional Review Board Statement

Ethical review and approval were waived for this study, according to the Regulations for Ethical Review of Biomedical Research Involving Human Participants (2016) by the National Health Commission of the People’s Republic of China, studies that do not involve medical treatments, clinical trials, or invasive procedures are generally exempt from IRB approval. Additionally, the study complied with the ethical principles of the Declaration of Helsinki.

Informed Consent Statement

Informed consent was obtained from all subjects involved in the study.

Data Availability Statement

The data presented in this study are available on request from the corresponding author. The data are not publicly available due to the information concerning the participants.

Conflicts of Interest

The authors declare no conflicts of interest.

References

  1. Wen, A.; Tang, Q.; Ouyang, C.; Zhu, B.; Wang, Y.; Li, A.; Li, S.; Zhu, W.; Liu, L. Mountain protection and mountain development in China: Review and prospect. Bull. Chin. Acad. Sci. 2023, 38, 376–384. [Google Scholar]
  2. Chen, Z.; Sheng, Y.; Luo, D.; Huang, Y.; Huang, J.; Zhu, Z.; Yao, X.; Fu, W.; Dong, J.; Lan, Y. Landscape characteristics in mountain parks across different urban gradients and their relationship with public response. Forests 2023, 14, 2406. [Google Scholar] [CrossRef]
  3. Gong, C.; Hu, C.J. Community Public Space Planning Based on Multiple Social Functions of Green Infrastructures. J. Chin. Urban For. 2021, 19, 12–18. [Google Scholar]
  4. Hodor, K.; Dai, D. Urban sustainability through innovative open space design: A novel approach to the regeneration of historic open spaces in some Eastern European countries and China. Earth 2021, 2, 405–423. [Google Scholar] [CrossRef]
  5. Cheng, X.; Van Damme, S.; Uyttenhove, P. Assessing the Impact of Park Renovations on Cultural Ecosystem Services. Land 2022, 11, 610. [Google Scholar] [CrossRef]
  6. Xiong, X.; Zhang, Y.; Li, H.; Wang, T. Urban renewal and human-centered development in mountainous historical parks: Balancing heritage conservation and sustainability. J. Urban Plan. Dev. 2023, 149, 04523011. [Google Scholar] [CrossRef]
  7. Ballantyne, R.; Hughes, K.; Moscardo, G. Sustainable tourism development in urban parks: The role of human-centered design in enhancing visitor experiences. Sustainability 2023, 15, 12345. [Google Scholar]
  8. Kabisch, N.; Püffel, C.; Masztalerz, O.; Hemmerling, J.; Kraemer, R. Physiological and psychological effects of visits to different urban green and street environments in older people: A field experiment in a dense inner-city area. Landsc. Urban Plan. 2021, 207, 103998. [Google Scholar] [CrossRef]
  9. Yu, C.; Lee, H.; Luo, X. The effect of virtual reality forest and urban environments on physiological and psychological responses. Urban For. Urban Green. 2022, 35, 106–114. [Google Scholar] [CrossRef]
  10. Alcock, I.; White, M.P.; Wheeler, B.W.; Fleming, L.E.; Depledge, M.H. Longitudinal effects on mental health of moving to greener and less green urban areas. Environ. Sci. Technol. 2014, 48, 1247–1255. [Google Scholar] [CrossRef]
  11. Ulrich, R.S.; Simons, R.F.; Losito, B.D.; Fiorito, E.; Miles, M.A.; Zelson, M. Stress recovery during exposure to natural and urban environments. J. Environ. Psychol. 1991, 11, 201–230. [Google Scholar] [CrossRef]
  12. Twohig-Bennett, C.; Jones, A. The health benefits of the great outdoors: A systematic review and meta-analysis of greenspace exposure and health outcomes. Environ. Res. 2018, 166, 628–637. [Google Scholar] [CrossRef] [PubMed]
  13. Suligowski, D.; Habel, J.; Wetzel, F.T.; Ulrich, W.; Mönkkönen, M. Biodiversity preservation and human well-being: A long-term perspective for sustainable cities. Sustainability 2021, 13, 492. [Google Scholar] [CrossRef]
  14. Ye, L.; Wang, A.; Wang, X.H.; Han, G.; Yang, Z.; Mai, Y. Research Progress on Urban Park Evaluation Tools of North America Based on the Youth-friendly Perspective. Landsc. Archit. Acad. J. 2023, 40, 42–51. [Google Scholar]
  15. Wang, S.; Xu, Y.; Yang, X.; Zhang, Y.; Yan, P.; Jiang, Y.; Wang, K. Urban cultural heritage is mentally restorative: An experimental study based on multiple psychophysiological measures. Front. Psychol. 2023, 14, 1132052. [Google Scholar] [CrossRef]
  16. Fekete, A. Vistas, Views, Prospects. Research and Design. In Proceedings of the Fábos Conference on Landscape and Greenway Planning, Amherst, MA, USA, 28–30 March 2019; Available online: https://scholarworks.umass.edu/fabos/vol6/iss1/53 (accessed on 23 March 2019).
  17. Padial-Ruz, R.; Puga-González, M.E.; Céspedes-Jiménez, Á.; Cabello-Manrique, D. Determining factors in the use of urban parks that influence the practice of physical activity in children: A systematic review. Int. J. Environ. Res. Public Health 2021, 18, 3648. [Google Scholar] [CrossRef]
  18. Schnall, S. Social and contextual constraints on embodied perception. Perspect. Psychol. Sci. 2017, 12, 325–340. [Google Scholar] [CrossRef]
  19. Liu, J.; Wang, Y.; Zimmer, C.; Kang, J.; Yu, T. Factors Associated with Soundscape Experiences in Urban Green Spaces: A Case Study in Rostock, Germany. Urban For. Urban Green. 2019, 37, 135–146. [Google Scholar] [CrossRef]
  20. Xiang, Y.; Hedblom, M.; Wang, S.; Qiu, L.; Gao, T. Indicator selection combining audio and visual perception of urban green spaces. Ecol. Indic. 2022, 137, 108772. [Google Scholar] [CrossRef]
  21. Kang, J.; Aletta, F.; Gjestland, T.T.; Brown, L.A.; Botteldooren, D.; Schulte-Fortkamp, B.; Lercher, P.; van Kamp, I.; Genuit, K.; Fiebig, A.; et al. Ten questions on the soundscapes of the built environment. Build. Environ. 2016, 108, 284–294. [Google Scholar] [CrossRef]
  22. Jeon, J.Y.; Hong, J.Y. Classification of urban park soundscapes through perceptions of the acoustical environments. Landsc. Urban Plan. 2015, 141, 100–111. [Google Scholar] [CrossRef]
  23. Guo, Y.; Wang, K.; Zhang, H.; Jiang, Z. Soundscape Perception Preference in an Urban Forest Park: Evidence from Moon Island Forest Park in Lu’an City. Sustainability 2022, 14, 16132. [Google Scholar] [CrossRef]
  24. Moorthy, A.K.; Wang, Z.; Bovik, A.C. Visual perception and quality assessment. Opt. Digit. Image Process. Fundam. Appl. 2011, 19, 419–439. [Google Scholar]
  25. He, M.H.; Xie, H.; He, Y.; Luo, J. Study on sound environment optimization strategies in historical districts of mountain cities. Noise Vib. Control 2023, 43, 208–215. [Google Scholar]
  26. Jin, T.; Lu, J.; Shao, Y. Exploring the Impact of Visual and Aural Elements in Urban Parks on Human Behavior and Emotional Responses. Land 2024, 13, 1468. [Google Scholar] [CrossRef]
  27. Gan, Y.; Zheng, Y.; Zhang, L. Audio-visual analysis of visitors’ landscape preference for city parks: A case study from Zhangzhou, China. Forests 2022, 13, 1376. [Google Scholar] [CrossRef]
  28. Dai, D.; Bo, M.; Zhou, Y. How do the young perceive urban parks? A study on young adults’ landscape preferences and health benefits in urban parks based on the landscape perception model. Int. J. Environ. Res. Public Health 2022, 19, 14736. [Google Scholar] [CrossRef]
  29. Münzinger, M.; Prechtel, N.; Behnisch, M. Mapping the urban forest in detail: From LiDAR point clouds to 3D tree models. Urban For. Urban Green. 2022, 74, 127637. [Google Scholar] [CrossRef]
  30. Miao, S.; Zhang, X.; Han, Y.; Sun, W.; Liu, C.; Yin, S. Random Forest Algorithm for the Relationship between Negative Air Ions and Environmental Factors in an Urban Park. Atmosphere 2018, 9, 463. [Google Scholar] [CrossRef]
  31. Badshah, M.T.; Hussain, K.; Rehman, A.U.; Mehmood, K.; Muhammad, B.; Wiarta, R.; Silamon, R.F.; Khan, M.A.; Meng, J. The role of random forest and Markov chain models in understanding metropolitan urban growth trajectory. Front. For. Glob. Chang. 2024, 7, 1345047. [Google Scholar] [CrossRef]
  32. Wang, J.; Liu, N.; Zou, J.; Guo, Y.; Chen, H. The health perception of urban green spaces and its emotional impact on young adults: An empirical study from three cities in China. Front. Public Health 2023, 11, 1232216. [Google Scholar] [CrossRef] [PubMed]
  33. Zhang, W.Q.; Du, C.L.; Hu, J.Q. Perceptual interaction: The cultural image activation of park renewal in a mountainous city. Chin. Landsc. Archit. 2021, 37, 63–68. [Google Scholar]
  34. Hu, C.J.; Gong, C.; Long, H.; Yang, X.Y. Coordination and preference: Research on the audio-visual perception of young people of gathering space in mountain city parks. Landsc. Archit. 2024, 31, 20–29. [Google Scholar] [CrossRef]
  35. Paraskevopoulou, A.; Klados, A.; Malesios, C. Historical public parks: Investigating contemporary visitor needs. Sustainability 2020, 12, 9976. [Google Scholar] [CrossRef]
  36. Xiao, J.; Zhang, Q.Q.; Zhang, R.Z.; Cao, K. Multi-scale Analysis and Dual-system Identification about the Heritage Values of Historic Urban Parks from the “City-Park Correlating” Perspective—A Case Study of Eling Park in Chongqing. Chin. Landsc. Archit. 2022, 38, 56–61. [Google Scholar]
  37. Xiao, J.; Zhong, H.J.; Jiang, J.R.; Cao, K. Recognition, Construction and Preservation & Renewal Applications of the “Sites of Memory” of Historic Urban Public Parks: A Case Study of Pipa Mountain Park in Chongqing. Tradit. Chin. Archit. Gard. 2023, 4, 111–117. [Google Scholar]
  38. Ruotolo, F.; Rapuano, M.; Masullo, M.; Maffei, L.; Ruggiero, G.; Iachini, T. Well-being and multisensory urban parks at different ages: The role of interoception and audiovisual perception. J. Environ. Psychol. 2024, 93, 102219. [Google Scholar] [CrossRef]
  39. Grahn, P.; Stigsdotter, U.K. The relation between perceived sensory dimensions of urban green space and stress restoration. Landsc. Urban Plan. 2010, 94, 264–275. [Google Scholar] [CrossRef]
  40. Grahn, P. Landscapes in our minds: People’s choice of recreative places in towns. Landsc. Res. 1991, 16, 11–19. [Google Scholar] [CrossRef]
  41. Kyttä, M.; Kahila, M. The perceived quality factors of the environment and their ecoefficient accessibility. For. Trees Hum. Health Well-Being 2005, 2005, 337–351. [Google Scholar]
  42. Stoltz, J.; Grahn, P. Perceived Sensory Dimensions: An Evidence-based Approach to Greenspace Aesthetics. Urban For. Urban Green. 2021, 59, 126989. [Google Scholar] [CrossRef]
  43. Yang, L.; Yang, P.; Chen, L. Equity quantitative evaluation of urban park green space supply: A case study of the central urban area of Chongqing. Chin. Landsc. Archit. 2020, 36, 108–112. [Google Scholar]
  44. Hu, C.J.; Gong, C.; Wang, R.J. Ecological Benefits of Green Volume in Historical Blocks Based on Dual Contrast Analysis. J. Chin. Urban For. 2023, 21, 103–113. [Google Scholar]
  45. Liu, J.; Kang, J.; Behm, H.; Luo, T. Effects of landscape on soundscape perception: Soundwalks in city parks. Landsc. Urban Plan. 2014, 123, 30–40. [Google Scholar] [CrossRef]
  46. Kang, J. Noise Management: Soundscape Approach. In Encyclopedia of Environmental Health; Elsevier: Amsterdam, The Netherlands, 2011; pp. 174–184. [Google Scholar] [CrossRef]
  47. Axelsson, Ö.; Nilsson, M.E.; Berglund, B. A principal components model of soundscape perception. J. Acoust. Soc. Am. 2010, 128, 2836–2846. [Google Scholar] [CrossRef]
  48. Axelsson, Ö. How to measure soundscape quality. In Proceedings of the Inter-Noise 2015—44th International Congress and Exposition on Noise Control Engineering, Maastricht, The Netherlands, 31 May–3 June 2015; pp. 2825–2829. Available online: https://www.semanticscholar.org/paper/How-to-measure-soundscape-quality-Axelsson/759502a4766fe9ba53443d5c43fb003fd237f2c0 (accessed on 22 August 2018).
  49. Xie, H.; He, Y.; Liu, C. The Renewal Design Strategy of Historical District Integrated with the Soundscape Intervention: A Case Study of Danzishi Historical District in Chongqing. Mod. Urban Res. 2021, 38, 55–62. [Google Scholar]
  50. Li, H.; Xie, H.; Woodward, G. Soundscape components, perceptions, and EEG reactions in typical mountainous urban parks. Urban For. Urban Green. 2021, 64, 127269. [Google Scholar] [CrossRef]
  51. ISO/TS 12913-2:2018; Acoustics—Soundscape—Part 2: Data Collection and Reporting Requirements. BSI Standards Publication: Geneva, Switzerland, 2018. Available online: https://www.iso.org/standard/75267.html (accessed on 9 August 2015).
  52. Xie, H.; Li, H.; Kang, J. Preliminary exploration of soundscapes in traditional historical districts of mountain cities: A case study of Ciqikou Ancient Town, Chongqing. New Archit. 2014, 5, 52–55. [Google Scholar]
  53. Breiman, L. Random Forests. Mach. Learn. 2001, 45, 5–32. [Google Scholar] [CrossRef]
  54. Zhao, J.; Cao, Y. Review of Artificial Intelligence Methods in Landscape Architecture. Chin. Landsc. Archit. 2020, 36, 82–87. [Google Scholar] [CrossRef]
  55. White, M.P.; Elliott, L.R.; Grellier, J.; Economou, T.; Bell, S.; Bratman, G.N.; Cirach, M.; Gascon, M.; Lima, M.L.; Lõhmus, M.; et al. Associations between green/blue spaces and mental health across 18 countries. Sci. Rep. 2021, 11, 8903. [Google Scholar] [CrossRef] [PubMed]
  56. Korpela, K.; Savonen, E.M.; Anttila, S.; Pasanen, T.; Ratcliffe, E. Enhancing wellbeing with psychological tasks along forest trails. Urban For. Urban Green. 2017, 26, 25–30. [Google Scholar] [CrossRef]
  57. Huang, Y.; Lin, X.; Lin, S.; Chen, Z.; Fu, W.; Wang, M.; Dong, J. Pocket Parks: A New Approach to Improving the Psychological and Physical Health of Recreationists. Forests 2023, 14, 1983. [Google Scholar] [CrossRef]
  58. Zhang, F.; Sun, X.; Liu, C.; Qiu, B. Effects of Urban Landmark Landscapes on Residents’ Place Identity: The Moderating Role of Residence Duration. Sustainability 2024, 16, 761. [Google Scholar] [CrossRef]
  59. Li, K.; Zhai, Y.; Dou, L.; Liu, J. A preliminary exploration of landscape preferences based on naturalness and visual openness for college students with different moods. Front. Psychol. 2021, 12, 629650. [Google Scholar] [CrossRef]
  60. Zeng, C.; Lin, W.; Li, N.; Wen, Y.; Wang, Y.; Jiang, W.; Zhang, J.; Zhong, H.; Chen, X.; Luo, W.; et al. Electroencephalography (EEG)-Based Neural Emotional Response to the Vegetation Density and Integrated Sound Environment in a Green Space. Forests 2021, 12, 1380. [Google Scholar] [CrossRef]
  61. Fan, S.; Huang, J.; Gao, C.; Liu, Y.; Zhao, S.; Fang, W.; Ran, C.; Jin, J.; Fu, W. The Characteristics of Visitor Behavior and Driving Factors in Urban Mountain Parks: A Case Study of Fuzhou, China. Forests 2024, 15, 1519. [Google Scholar] [CrossRef]
  62. Zhang, C.; Chen, Y.; Dewancker, B.J.; Shentu, C.; Tian, H.; Liu, Y.; Wan, J.; Zhang, X.; Li, J. Emotional Landscapes in Urban Design: Analyzing Color Emotional Responses of the Elderly to Community Outdoor Spaces in Yi Jie Qu. Buildings 2024, 14, 793. [Google Scholar] [CrossRef]
  63. Liu, L.; Qu, H.; Ma, Y.; Wang, K.; Qu, H. Restorative benefits of urban green space: Physiological, psychological restoration and eye movement analysis. J. Environ. Manag. 2022, 301, 113930. [Google Scholar] [CrossRef]
  64. Bjerke, T.; Østdahl, T.; Thrane, C.; Strumse, E. Vegetation density of urban parks and perceived appropriateness for recreation. Urban For. Urban Green. 2006, 5, 35–44. [Google Scholar] [CrossRef]
  65. Tyrväinen, L.; Ojala, A.; Korpela, K.; Lanki, T.; Tsunetsugu, Y.; Kagawa, T. The influence of urban green environments on stress relief measures: A field experiment. J. Environ. Psychol. 2014, 38, 1–9. [Google Scholar] [CrossRef]
Figure 1. Research framework.
Sustainability 17 05581 g001
Figure 2. Plans of two studied parks and the locations of the gathering spaces.
Sustainability 17 05581 g002
Figure 3. Spatial data and key acoustic landscape related to the Eling and Pipa Mountain Parks.
Sustainability 17 05581 g003
Figure 4. Statistical analysis of environmental satisfaction for each gathering space. Note: ES: comprehensive environmental satisfaction; VS: visual environment satisfaction; AS: acoustic environment satisfaction; BE: aesthetics; SR: refuge; SE: social; AL: comfort; NP: naturalness; AP: accessibility; DL: diversity; SP: openness; FP: serviceability; LO: orderliness; CS: cultural; IE: recognisability; PA: pleasant; AE: annoying; QP: calm; CD: chaotic; VE: vibrant; MB: monotonous; ES: eventful; UA: uneventful; NP: naturalness; DL: diversity.
Sustainability 17 05581 g004
Figure 5. Principal component analysis of audiovisual perception factors. Note: Significance * p < 0.05, ** p < 0.01.
Sustainability 17 05581 g005
Figure 6. Variable importance ranking. Note: WF: water feature; GVI: green view index; PS: plant species; ECD: eaves canopy density; TCD: tree canopy density; OP: openness; PVS: panoramic viewing space; EP: elevated point; EL: entrance links; PL: path length; ED: elevation drop; CT: colour types; MT: material types; LM: landmarks; WS: water sound; BS: birdsong sound; ICS: insect chirping; TS: traffic sound; BCS: broadcast sound; CS: conversation sound; GAS: group activity sound; CSS: construction sound.
Sustainability 17 05581 g006
Figure 7. Impact of spatial elements on satisfaction based on Shapley Additive Explanations (SHAP) analysis.
Sustainability 17 05581 g007
Table 1. Spatial indicators in mountainous historic urban parks.
HierarchyCategoryDescriptionCalculation Method *
Visual
Landscape
Water feature (WF)Presence of water feature N.A.
Green view index (GVI)percentage of greenery pixels ( G r e e n e r y P i x e l ) of the street view image G V I = G r e e n e r y P i x e l P
Plant species (PS)Number of plant species P S = P S i
Plant stratification (PT)Number of plant strata P T = P T i
Eaves canopy density (ECD)Percentage of eaves canopy pixels ( E a v e C P i x e l ) of the street view image E C D = E a v e C P i x e l P
Tree Canopy density (TCD)Percentage of tree canopies pixels ( T r e e C P i x e l ) of the street view image T C D = T r e e C P i x e l P
Openness (OP)Percentage of prospect view pixels ( P V P i x e l ) of the street view image O P = P V P i x e l P
Panoramic viewing space (PVS)Presence of panoramic viewing spaceN.A.
Elevated point (EP)Presence of vantage pointN.A.
Entrance links (EL)Number of primary ( E L p ) and secondary ( E L s ) entrance links E L = E L p + E L s
Path length (PL)The total length of all paths from the entrance P L = i = 1 n L I
Elevation drop (ED)The elevation drop gradient near the adjacent platform. E D = E l e i E l e n i
Colour types (CT)Number of colours C T = C T i
Material types (MT)Number of material types M T = M T i
Landmarks (LM)Presence of landmarksN.A.
Cultural buildings/sculptures/monuments (CBSM)Presence of cultural buildings/sculptures/monumentsN.A.
Soundscape LAeqA-weighted equivalent sound level N.A.
Water sound (WS)Average percentage of water sound ( T w s ) duration in the recorded segment W S = 1 n i = 1 n T w s , i T t o t a l , i
Birdsong sound (BS)Average percentage of birdsong sound duration ( T b s ) in the recorded segment B S = 1 n i = 1 n T b s , i T t o t a l , i
Insect chirping sound (ICS)Average percentage of insect chirping sound duration ( T i c s ) in the recorded segment I C S = 1 n i = 1 n T i c s , i T t o t a l , i
Traffic sound (TS)Average percentage of vehicle/ship/aircraft sound duration ( T t s ) in the recorded segment T S = 1 n i = 1 n T t s , i T t o t a l , i
Broadcast sound (BCS)Average percentage of broadcast sound duration ( T b c s ) in the recorded segment B C S = 1 n i = 1 n T b c s , i T t o t a l , i
Conversation sound (CS)Average percentage of conversation sound duration ( T c s ) in the recorded segment C S = 1 n i = 1 n T c s , i T t o t a l , i
Group activity sound (GAS)Average percentage of group activity sound duration sound ( T g a s ) in the recorded segment G A S = 1 n i = 1 n T g a s , i T t o t a l , i
Construction sound (CSS)Average percentage of construction sound duration ( T c s s ) in the recorded segment C S S = 1 n i = 1 n T c s s , i T t o t a l , i
* P ’ is the total pixels of the street view image; ‘Ttotal ’ is the total number of recorded segments.
Table 2. Evaluation system for audiovisual perception of historic mountainous urban parks.
DimensionsIndicatorDefinition
Visual perception indicatorsAesthetics (BE) [42]The visual environment possesses certain aesthetic qualities.
Refuge (SR) [20,39] *The mountain environment is safe for walking and personal safety.
Social (SE) [20,39]The environment promotes people–environment and people–people socialisation.
Comfort (AL) [11]The visual environment offers a degree of comfort.
Naturalness (NP) [41] * The high proportion of natural elements in multi-elevation visual landscapes
Accessibility (AP) [34,43] *Pathway connections in mountainous areas are numerous and easily identifiable, with proximity to entrances and exits.
Diversity (DL) [39] *The mountainous visual environment is characterised by rich multi-level layering and diverse land use.
Openness (SP) [41] *The mountainous visual environment effectively creates open and panoramic spaces.
Serviceability (FP) [37]The environment provides adequate service facilities.
Orderliness (LO) [39] *The spatial organisation of mountainous streets is orderly and of an appropriate scale.
Cultural (CS) [20,50] *The environment contains historical buildings and structures, historical information, and intangible cultural elements.
Recognisability (IE) [34,37]The space exhibits a certain level of recognisability and memorable features.
Auditory perception indicatorsPleasant (PA) [21,51]The acoustic environment is pleasant.
Annoying (AE) [51]The sound environment is irritating.
Calm (QP) [51]The sound environment is quiet and serene.
Chaotic (CD) [39,51]The sound environment is chaotic.
Vibrant (VE) [47]The sound environment is full of life and vigour.
Monotonous (MB) [51]The sound environment is monotonous and boring.
Eventful (ES) [48,51] *The acoustic environment is characterised by important events (including historical mountain scenes and industry-specific sounds).
Uneventful (UA) [48,51]The sound environment is eventless.
Acoustic naturalness (NP) [40] *The high proportion of natural sounds in multi-elevation environmental soundscapes
Acoustic diversity (DL) [39,52] *The mountain stereo sound environment is diverse and rich, not monotonous or redundant
Overall perception indicatorsVisual environment satisfaction (VES) [20]Overall perception and evaluation of visual elements.
Acoustic environment satisfaction (AES) [20]Overall perception and evaluation of auditory elements.
Comprehensive environmental satisfaction (CES) [34]The overall satisfaction of users with historic environments.
Note: * Indicators for the most distinctive characteristics of the historic district in mountain city.
Table 3. Training set and test set results of random forest model.
Space TypeData SetRSMEMAEMBER2
OverallTraining set0.615 0.463 0.007 0.822
Test set0.790 0.586 −0.020 0.833
Entrance PlatformTraining set1.043 0.801 −0.003 0.592
Test set1.201 0.941 −0.516 0.406
Pathway PlatformTraining set0.904 0.681 −0.011 0.735
Test set1.108 0.825 −0.452 0.647
Key NodeTraining set0.791 0.622 −0.005 0.648
Test set1.053 0.828 −0.118 0.256
BoundaryTraining set0.797 0.641 −0.007 0.724
Test set1.002 0.837 0.424 0.199
Elevated PointTraining set0.992 0.821 0.009 0.666
Test set0.986 0.844 0.437 0.653
Disclaimer/Publisher’s Note: The statements, opinions and data contained in all publications are solely those of the individual author(s) and contributor(s) and not of MDPI and/or the editor(s). MDPI and/or the editor(s) disclaim responsibility for any injury to people or property resulting from any ideas, methods, instructions or products referred to in the content.

