Abstract
This article aims to identify the social groups particularly vulnerable to pandemic-related stress in the urban environment. The research seeks answers to questions regarding the following: (1) the demographic and socio-economic features of vulnerable groups and (2) their location in the city space. The main research tool was a geosurvey in which respondents determined the stress level experienced. The area of investigation covered three Polish cities. The results obtained were devised using statistical analysis methods. They make it possible to state that the features most differentiating stress level were sex, age, occupational activity, and profession practised. Women, persons aged 60+, economically inactive people (pensioners and unemployed people), and those practising certain professions, especially representing the tourism sector, were the groups most vulnerable to stress. The areas concentrating vulnerable groups were mainly centres of compact development. We assume that this knowledge will allow for improving public health conditions in cities, strained by the COVID-19 pandemic, preparing strategies for adaptation to threats such as a pandemic, with regard to planning and city governance, and, thus, increasing city stress resilience and preparing better for further similar risks.
1. Introduction
Cities should build resilience to various threats called stressors to facilitate sustainable development and ensure healthy and safe living conditions for residents. This is all the more important because the urban environment makes city dwellers more exposed to stress [1] and, at the same time, more sensitive to it than rural inhabitants [2]. As their reaction to stress is stronger, they more often suffer from cognitive impairment, anxiety and fear, or depression [2].
Not experienced before on such a large scale, the COVID-19 pandemic was an additional, new stressor, which turned into a world crisis, wreaking havoc among countries, regions, and cities in a short time. As cores of global networks of businesses, tourism, and supply chains, cities badly suffered the consequences of the COVID-19 pandemic [3]. This was because of the fast pace of viral transmission, difficulties in maintaining distance by residents, and often also due to the unfavourable results of preventive measures taken by public authorities [4,5,6]. To limit infections, public places such as schools, universities, parks (even forests), concert halls, theatres, and sports facilities were closed and interim restrictions on mobility were introduced [7,8]. Moreover, many businesses stopped operating (restaurants, hotels, gyms, etc.) and a system of remote working was adopted wherever possible, which was a completely unknown practice for employers and employees in most sectors of the economy. Unprecedented measures related to new education forms, like distance learning, were also implemented [9].
These significant changes in daily routine required individual and social flexibility and quick adaptation. In this context, the pandemic-induced crisis, alongside its related constraints and consequences, led to hopelessness, anxiety, fears, sleeping problems, and concerns about health (physical and mental), as well as economic and social consequences, depression, post-traumatic stress disorders, and the exacerbation of many other diseases [10,11,12,13]. All these symptoms resulted from a higher stress level and were observed more often during the COVID-19 pandemic [9,14]. People under stress, except for the effects already mentioned, also experience a higher blood pressure, shallower breathing, and a faster heart rate, which cause not only mental, but physical problems as well [3,15,16,17]. For this reason, the effects of pandemic stress must be treated as a public health priority, as should measures to reduce them in cities [18].
Owing to the harmfulness of chronic stress for urban dwellers and public health, post-pandemic cities should create conditions conducive to reducing the stress of their inhabitants, thus increasing city resilience to this type of threat [4]. By this term, we mean the ability of the system to face changes, especially sudden, while preserving its functioning [19]. During crises, resilience serves as a buffer against stress related to a given threat [20]. Resilience lowers the intensity of fear and alleviates depression, which are common responses to adversities and crisis situations [21]. It may play a key role in interventions aiming at protecting the mental and physical health of individuals against pandemic-related stress, reducing it [22,23]. This is all the more important because the occurrence of subsequent epidemics, and even pandemics, is just a matter of time [24].
The notion of resilience relates not only to the question of stressors, but also to vulnerability to them [25]. Vulnerability is generally understood as exposure to unpredictable circumstances and stress, and as difficulty in dealing with them [26]. It may result from various types of shocks, including socio-economic ones, the influence of which reduces the coping abilities of certain social groups and increases difficulties in governing and prioritising measures [27]. It turns out that during global pandemics, even groups that are not threat-sensitive may become vulnerable due to improper political reactions [28], which leads to public health crises [3].
Like in all crisis situations, during the COVID-19 pandemic, there existed social groups that were more vulnerable to stress resulting from new threats and the specific reality of the pandemic [29]. In planning stress-resilient, post-pandemic cities, particular attention should be paid to protecting these very groups. Their identification, and then their location in space, may turn out to be helpful in the optimisation of measures for improving the health conditions in a city. Therefore, better investigation into the basic factors of vulnerability to the pandemic is needed to develop the capability of cities to respond by adaptation measures [30,31,32,33].
The Objective and Research Questions
This article aims to identify vulnerable social groups, especially those vulnerable to stress related to the pandemic (both to the virus itself and also to the restrictions and lockdowns introduced to limit its transmission) in the urban environment.
The objective involves seeking answers to the following research questions:
(1) Which demographic and socio-economic features (e.g., sex, age, family situation, education, occupational activity, and profession practised) do social groups that experience particularly strong pandemic stress possess?
(2) Where are vulnerable groups located within the city space?
The research was conducted in three cities of the Poznań agglomeration, and the research material, including basic information on the feeling of stress, was retrieved from a geosurvey.
We assume that the results obtained will meet both cognitive and practical objectives. They will help public authorities to adopt more effective measures for reducing city-dwellers’ stress, thus increasing urban stress resilience. This will make it possible to indicate the social groups most vulnerable to stress and their distribution within a city, thus identifying areas requiring intervention. The research results will be useful in developing urban policies and methods for crisis management (short- and long-term adaptation measures), conducive to improving public health. Thus, the difficult experience of the COVID-19 pandemic will help cities to better prepare in the future for similar threats and deal with their adverse effects quicker, consequently increasing resilience to pandemic-related stress. It will also contribute to the UN’s Sustainable Development Goals, particularly Goal 3, “Ensure healthy lives and promote well-being for all at all ages”, through prevention and treatment and the promotion of mental health and well-being (Task 3.4), and Goal 11, “Make cities and human settlements inclusive, safe, resilient and sustainable”, mainly by focusing attention on vulnerable populations (Task 11.4).
In the literature, it is not an isolated statement that the importance of factors behind the vulnerability of cities to COVID-19 is mostly unknown and professional knowledge in this field is limited [34]. Hence, this study, the results of which will be presented further, is frontier research, and the knowledge acquired will fill the existing gap in this regard. The existing literature mostly concerns the vulnerability of cities and their residents to the virus or the consequences of pandemic stress in arbitrarily adopted social groups (ex ante). The authors of this study are not familiar with ex post research on the identification of social groups vulnerable to pandemic-caused stress based on the feeling of stress (in the context of the virus and the consequences of the countermeasures taken by public authorities) and its related spatial aspects.
2. Theoretical Background
2.1. Vulnerability of Cities to the Pandemic
The vulnerability concept is commonly used in various contexts, especially with respect to extreme occurrences, but also public health crises caused by pandemics.
In terms of urban areas, vulnerability is perceived as a state determined by physical, social, economic, and environmental factors or processes, which increase the vulnerability of urban communities to the effects of threats [34,35]. Vulnerability then depends on the reactions of urban areas to threats [3,36]. Today’s discussions in this field focus mostly on the following two dimensions: social sensitivity (in the context of poverty or safety deprivation) and environmental sensitivity (or climatic, to heat waves, floods, etc.). However, vulnerability to urban pandemics includes the threats posed by infectious diseases and their impact on public health and socio-economic conditions in urban areas [3]. This type of vulnerability may be understood as the degree to which the urban system is sensitive to a pandemic, measured by its influence on social groups, urban space, and institutions [3]. According to Lalonde’s 1974 report, health is not just the absence of objectively identifiable disease (disease) or infirmity (infirmity), but a certain holistic well-being (well-being) that manifests physically, mentally, and socially. In this context, health is a concept that is not only biological, but also psychological and social [37].
The COVID-19 pandemic exposed the shortcomings of public health, which is fundamental to national security. It revealed the weakness of the global system of preparedness for and response to epidemics. Public health should strive to reduce vulnerability to health loss, which has not always been the case during pandemics. Decisions regarding lockdown and social distancing have been cited as one of the most important failures of public health in the UK [38,39].
An optimal reaction to vulnerability to the pandemic in cities may be expressed by reducing exposure, reducing sensitivity, and increasing urban adaptive capacities by short- and long-term measures [3]. Adaptability, on the other hand, is understood as the ability of a system to adapt to a crisis such as the pandemic and cope with its consequences [3]. In order to develop cities’ capacity to react against pandemics with adaptation measures, the basic factors of vulnerability to this type of threat have to be investigated [30]. This knowledge may help public authorities to differentiate between and explain the main problems faced by various social groups and urban spaces, as well as propose more effective mitigating strategies [3]. It will also allow public authorities to implement more effective measures for increasing their adaptive capacity by introducing changes to governance, planning, or spatial development processes compared to, for instance, dealing with the main determinants of exposure, which are more difficult to transform [3].
2.2. Social Groups Vulnerable to Pandemic Stress
The concept of vulnerability to threats is complex, because vulnerability is “caused by structural social, economic and political determinants that disadvantage people” [40], p. 153.
Wirkner and her team [41] proved that a pandemic may be considered a multidimensional stressor for mental health. For this reason, some social groups seem to be more exposed to it than others [9,41]. This vulnerability may be determined based on various basic features of these groups.
The existing literature on the subject mainly covers items in areas such as the following: (1) medicine, where attention is mainly paid to vulnerability to the SARS-CoV-2 virus or stress level about the state of illness in selected social groups, and (2) psychology, including the influence of the pandemic on mental health or the emotions accompanying it in groups recognised as vulnerable. Works on the vulnerability of cities to the pandemic are also available, distinguishing more or less pandemic-sensitive urban areas. Exemplary studies and the arbitrarily adopted social groups therein that are vulnerable to pandemic stress can be found in Table 1.

Table 1.
Social groups vulnerable to pandemic stress based on selected publications.
The analysis in Table 1 shows that ex ante vulnerable groups include almost all age groups and people of various socio-economic statuses. There is no objective ex post research into groups vulnerable to pandemic stress. Given this gap, we conducted studies aiming at filling it.
3. Methodology
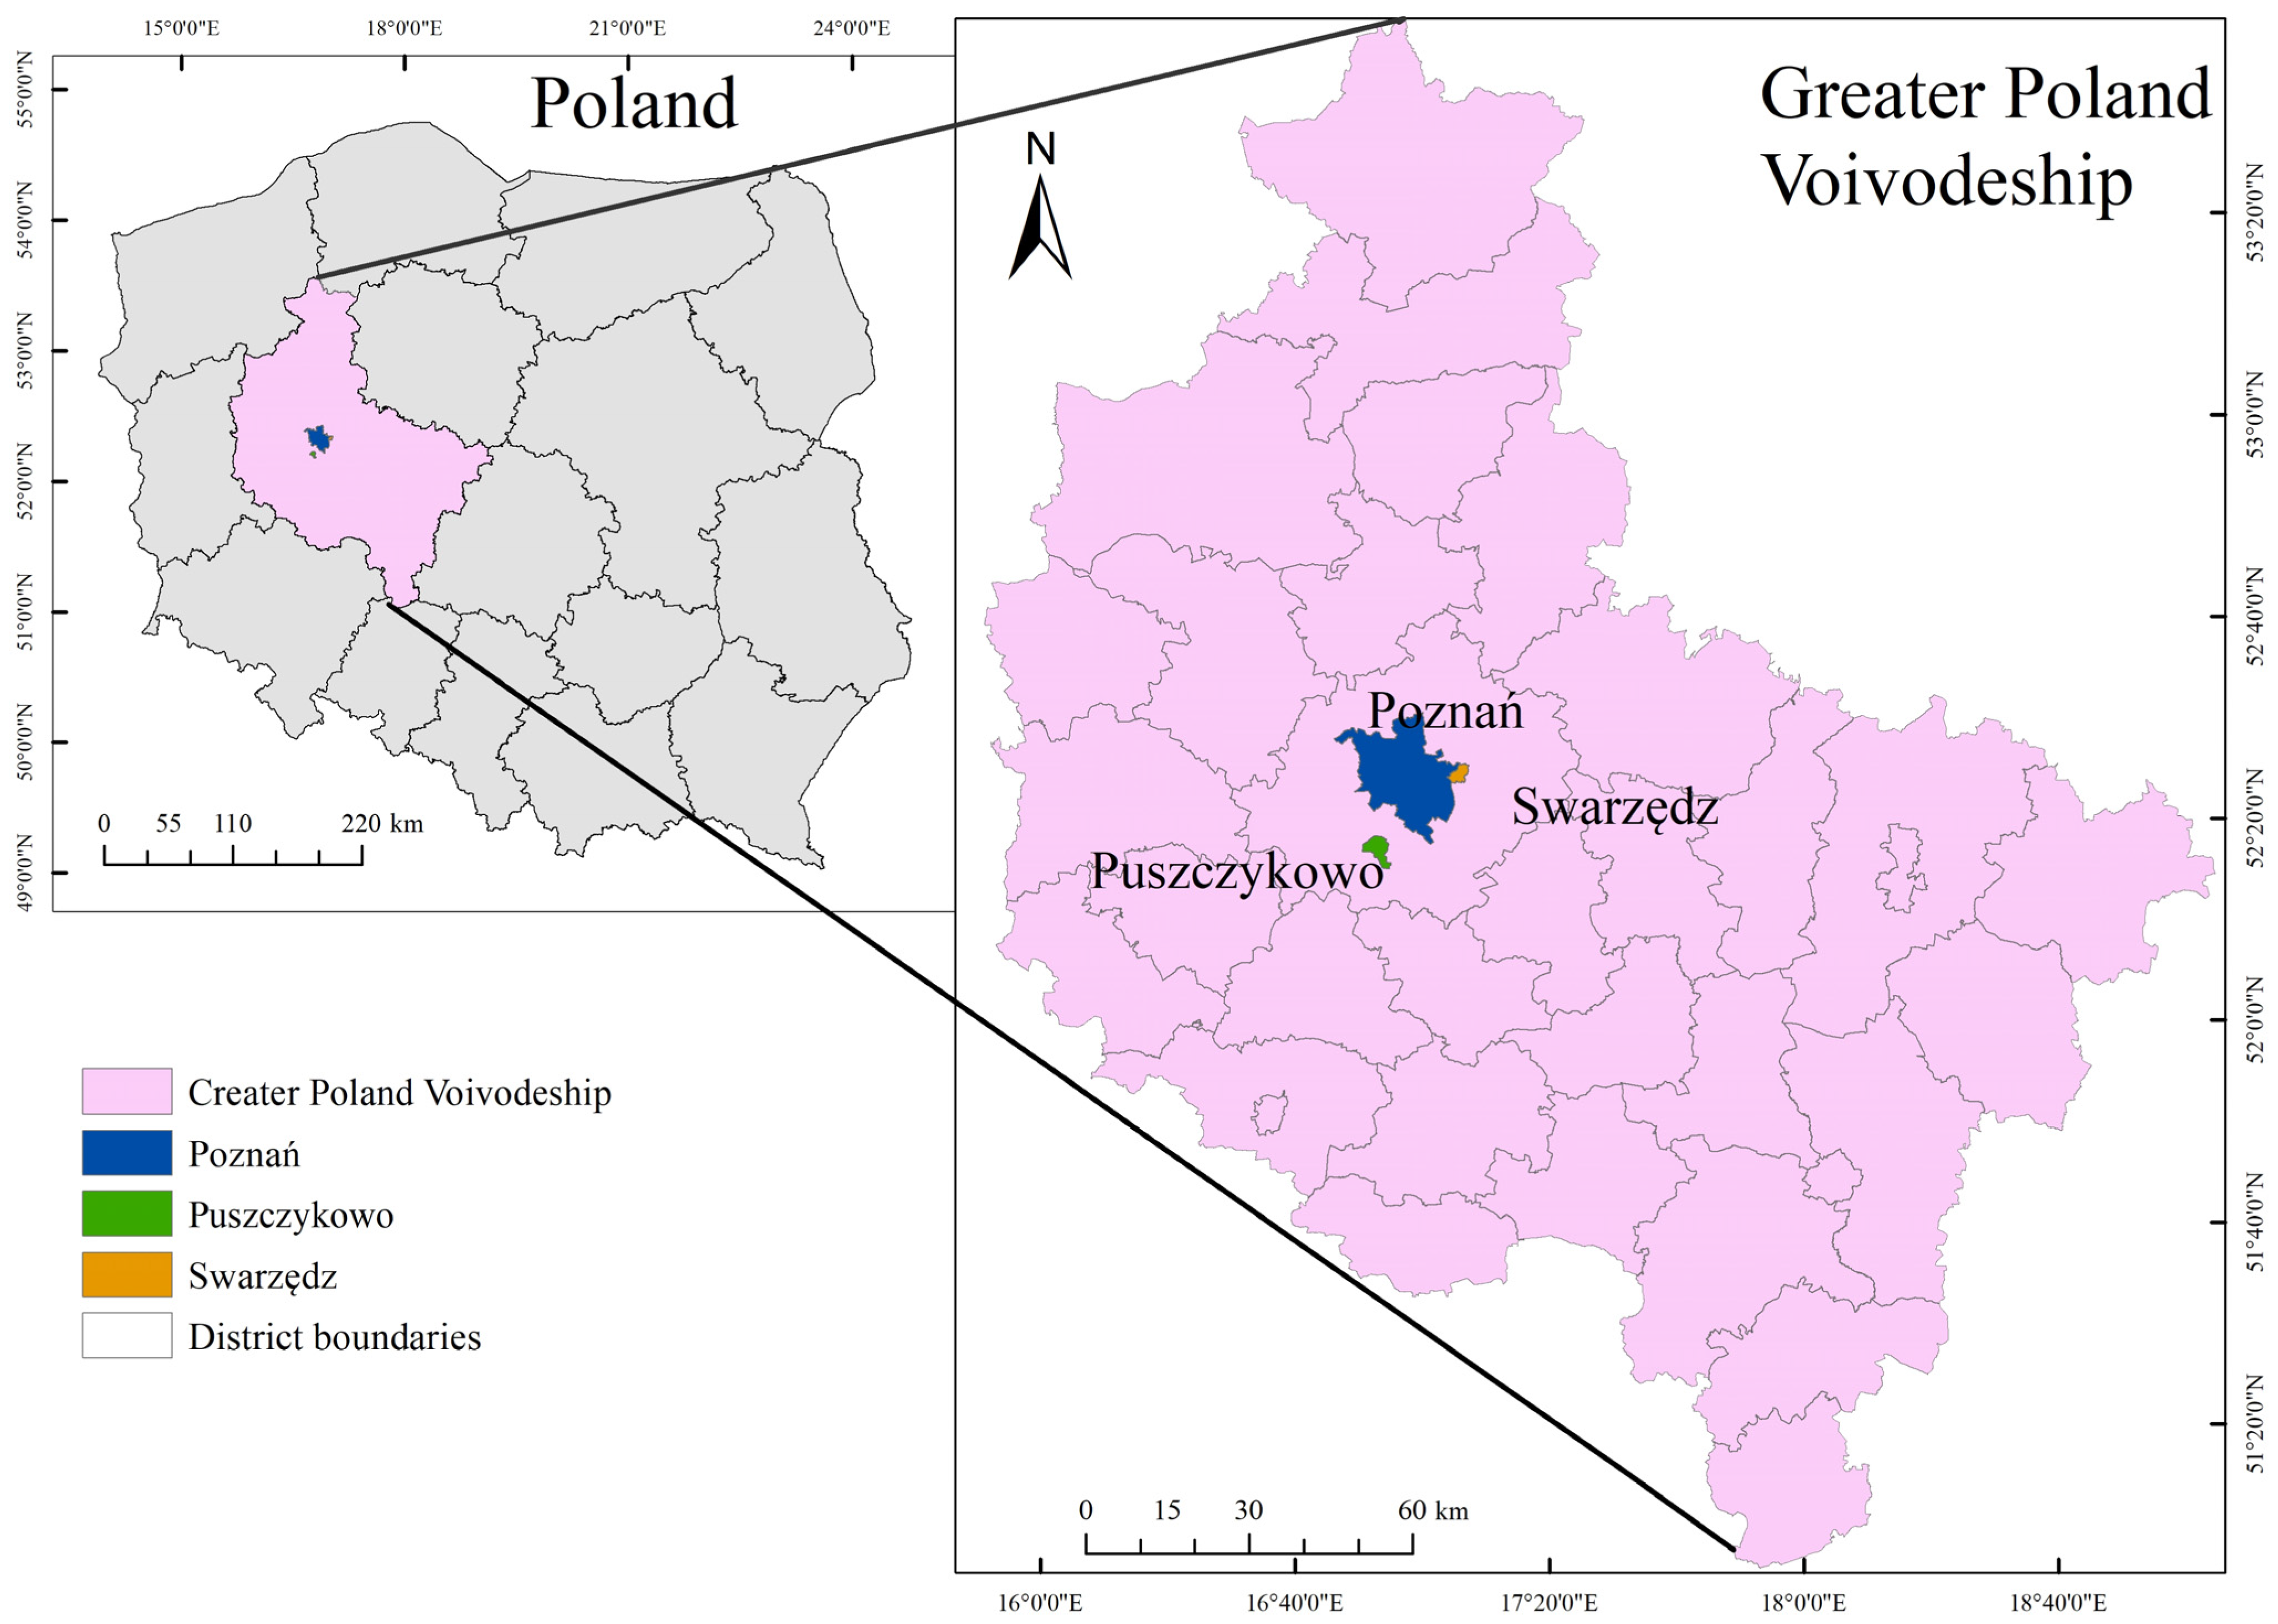
The research was carried out in three cities situated in the Poznań agglomeration in Poland (Poznań—core of the agglomeration, Swarzędz—medium-sized city, and Puszczykowo—small town), taken as a whole (Figure 1). These are cities that differ not only in size, but also in their spatial structure and main functions. Poznań is the primary city in the agglomeration—a multifunctional centre with dense development—and Swarzędz is one of the most densely populated Polish cities, while Puszczykowo, located among forests and dominated by residential buildings, is a recreational city for Poznań residents.
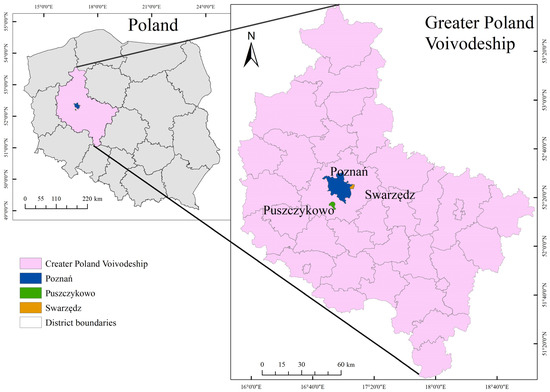
Figure 1.
Location of the investigated cities against the country. Voivodeship of Greater Poland.
The primary data source was the results of an online survey conducted with computer-assisted web interviewing (CAWI). Use was made of a geosurvey, a research tool based on geoinformation systems [47,48]. A geosurvey combines the elements of an online survey and an interactive digital map, making it possible to mark locations and respond to related questions [49]. The data collected were devised using statistical analysis methods (basic measures of descriptive statistics, the Kruskal–Wallis non-parametric analysis of variance, and the decision tree method Exhaustive CHAID) and spatial analysis (cluster and outlier analysis).
3.1. Geosurvey
The geosurvey was carried out from July 2022 to March 2023 among Poznań, Swarzędz, and Puszczykowo inhabitants. The survey link was shared by the official Internet websites of municipal offices, the Faculty of Human Geography and Planning of the Adam Mickiewicz University, and the project website. Additionally, it was promoted on social media (Facebook, X, and Instagram) and by the local press.
The survey was composed of 25 questions, including 3 containing interactive maps. For the purposes of this study, only some of the questions were taken into account. The analysis included both demographic and socio-economic data derived from the survey metrics and also subjective stress level assessments made by the respondents. Stress level was evaluated on a scale from 0 to 10, where 0 was the minimum and 10 was the maximum level of stress experienced. Information on the respondents’ residences allowed for performing a spatial analysis of subjective stress levels.
A total of 1558 respondents participated in the survey and 1198 of them who answered the question about stress levels were entered into the analysis. Incomplete responses were excluded from further study.
Among those who provided valid location data, 737 participants were included in the spatial analysis, as follows: 456 from Poznań, 187 from Swarzędz, and 94 from Puszczykowo. The distribution of responses reflects the relative population sizes of these cities, which, in turn, influences the reliability and interpretability of the spatial statistical analyses.
While preparing for the analysis, at preliminary processing, selected professions were aggregated because of the small sample sizes in some groups (below 1% of the total) and their likeness in terms of reported subjective stress. Paramedics were combined with medical personnel (outpatient clinics and hospitals). Additionally, tourism, hotel, and culture and entertainment industry employees were included in one category, because the stress exposure risk and working conditions in the context of the COVID-19 pandemic were comparable for both professions. The statistics of stress (mean, median, and ranks) for those groups were similar, and statistical tests showed no significant differences between them, which suggests that they belong to the same general population.
3.2. Data Analysis Methods
Data analysis covered both the assessment of the distribution of the variables investigated and the application of descriptive statistics. To characterise the subjective stress level, measures of central tendency (mean and median) were used, as well as measures of variation (standard deviation and quartiles). In addition, the distribution of variables was assessed by the means of graphs and normality tests, which allowed for determining a relevant approach to further statistical analyses.
To assess the influence of demographic features on subjective stress levels, use was made of the Kruskal–Wallis non-parametric analysis of variance, particularly effective when comparing groups of different sizes and distributions. The method is based on data ranking, and then on comparing rank sums in individual groups, which allows for assessing whether they come from the same population. After detecting statistically significant differences, post hoc comparisons of the average ranks were conducted using the multiple comparison test, making it possible to identify differences between individual groups. Additionally, to estimate the strength of the effect, η2 was calculated (eta-squared), determining part of the total variance of the dependent variable explained by the independent variable. The following interpretation criteria was adopted: η2 = 0.01 (small effect), η2 = 0.06 (medium effect), and η2 = 0.14 (large effect) [50].
To identify stress-vulnerable social groups, use was also made of the decision tree method Exhaustive CHAID (chi-squared automatic interaction detection). CHAID is an exploratory data analysis method that detects hierarchical dependencies between independent variables and a dependent variable. This algorithm is based on the iterative division of a data set into more uniform subgroups based on the values of predictive variables. The criterion of the division is the chi-square test for qualitative variables and F-test for quantitative variables. The Exhaustive CHAID version enhances classic CHAID by testing all possible divisions in each node in a more detailed manner, which increases the likelihood of detecting optimal divisions. At each node, the algorithm tests all permissible splits for each predictor variable and selects the one showing the most statistically significant relationship with the dependent variable—i.e., the lowest Bonferroni-adjusted p-value from the chi-square test (for categorical predictors). Additionally, for categorical predictors, Exhaustive CHAID merges categories that are not significantly different from each other with respect to the dependent variable to find the optimal grouping for the split.
The division process lasts until specific final criteria are fulfilled, such as the minimum number of observations in the final node or a lack of statistically significant divisions. In the analysis conducted, the following model settings were applied: minimum number of observations in the parental node: 24; minimum number of observations in the final node (child node): 15; maximum number of decision tree levels: 6; and Bonferroni correction to control the type I error level.
Based on survey data, decision trees are an effective tool for identifying social groups, making it possible to segment the population and analyse complex interactions between variables [51,52]. This study used respondent metrics as variables. A value of 6.8 was adopted as the limit value to determine stress-vulnerable social groups separated by the CHAID analysis. This value was computed as the mean increased by 0.5 of the standard deviation for the variable of ‘subjective stress level’.
In addition to the CHAID analysis, binary logistic regression was applied to identify the factors associated with an increased likelihood of belonging to the stress-vulnerable group (defined as those with a subjective stress level above 6.8). Logistic regression allowed for an estimation of each variable’s effect while adjusting for all others. Model performance was evaluated using the Likelihood Ratio Test and Nagelkerke’s R2, while the significance of individual predictors was assessed with Type 3 Likelihood Ratio Tests. The results were interpreted using odds ratios (ORs), indicating the direction and strength of associations.
To analyse the distribution of the subjective stress level variable, use was made of advanced spatial statistics methods. In the first stage, spatial autocorrelation was assessed by the global indicator Moran’s I, which allows for determining if data reveal a tendency towards spatial dependence, i.e., if the high or low values of the variable are concentrated in specific areas or are distributed randomly [53].
Next, clusters were analysed using the indicator Anselin Local Moran’s I, known also as cluster and outlier analysis. This allows for the identification of local patterns in spatial data such as clusters of high values (High–High), low values (Low–Low), and also outliers (High–Low and Low–High) [54].
3.3. Characteristics of Respondents
The sample group consisted of 1198 individuals, which ensured an adequate representativeness for the analysed cities. Among the respondents, 69.1% were women, 29% were men, and 1.9% defined their gender differently. Most respondents had completed higher (60.2%) or secondary (32.4%) education. In terms of occupational activity, those employed in the private (31.6%) and public (28.1%) sectors predominated. School and university students constituted a significant group, about 10%. The substantial majority (71.4%) were not employed in professions requiring intensive communication with people. Of all the respondents, 10.2% worked as teachers or academic teachers and 3.5% were employed as salespeople in grocery stores or pharmacies. Analysis of the respondents’ household structures showed that, most often, these were units of two to four people. Moreover, in the majority of families (85.4%), there were no residents over 60 years of age. At the same time, 56% of the respondents had children, of which 9.9% were at nursery age, 20.0% at preschool age, and 19.5% at early school age (classes 1–3). Detailed data on age, sex/gender, and other features are presented in Table 2.
Table 2.
Metrics and percent distribution of respondents, n =1198.
4. Results
4.1. Subjective Stress Levels in the Analysed Cities
The mean subjective stress level among all analysed cities equalled 5.51, with a median of 6.0. The interquartile range (IQR) with a value of four indicates that 50% of the results were in the range from three to seven (Table 3).
Table 3.
Descriptive statistics of the subjective stress levels in cities.
4.2. Analysis of Dependence Between Demographic Features of Respondents and Their Stress Level
To accurately assess the influence of the demographic and socio-economic features of respondents on their stress levels, use was made of the Kruskal–Wallis non-parametric analysis of variance, which made it possible to identify differences in stress levels according to such variables as age, sex, occupational activity, and profession practised.
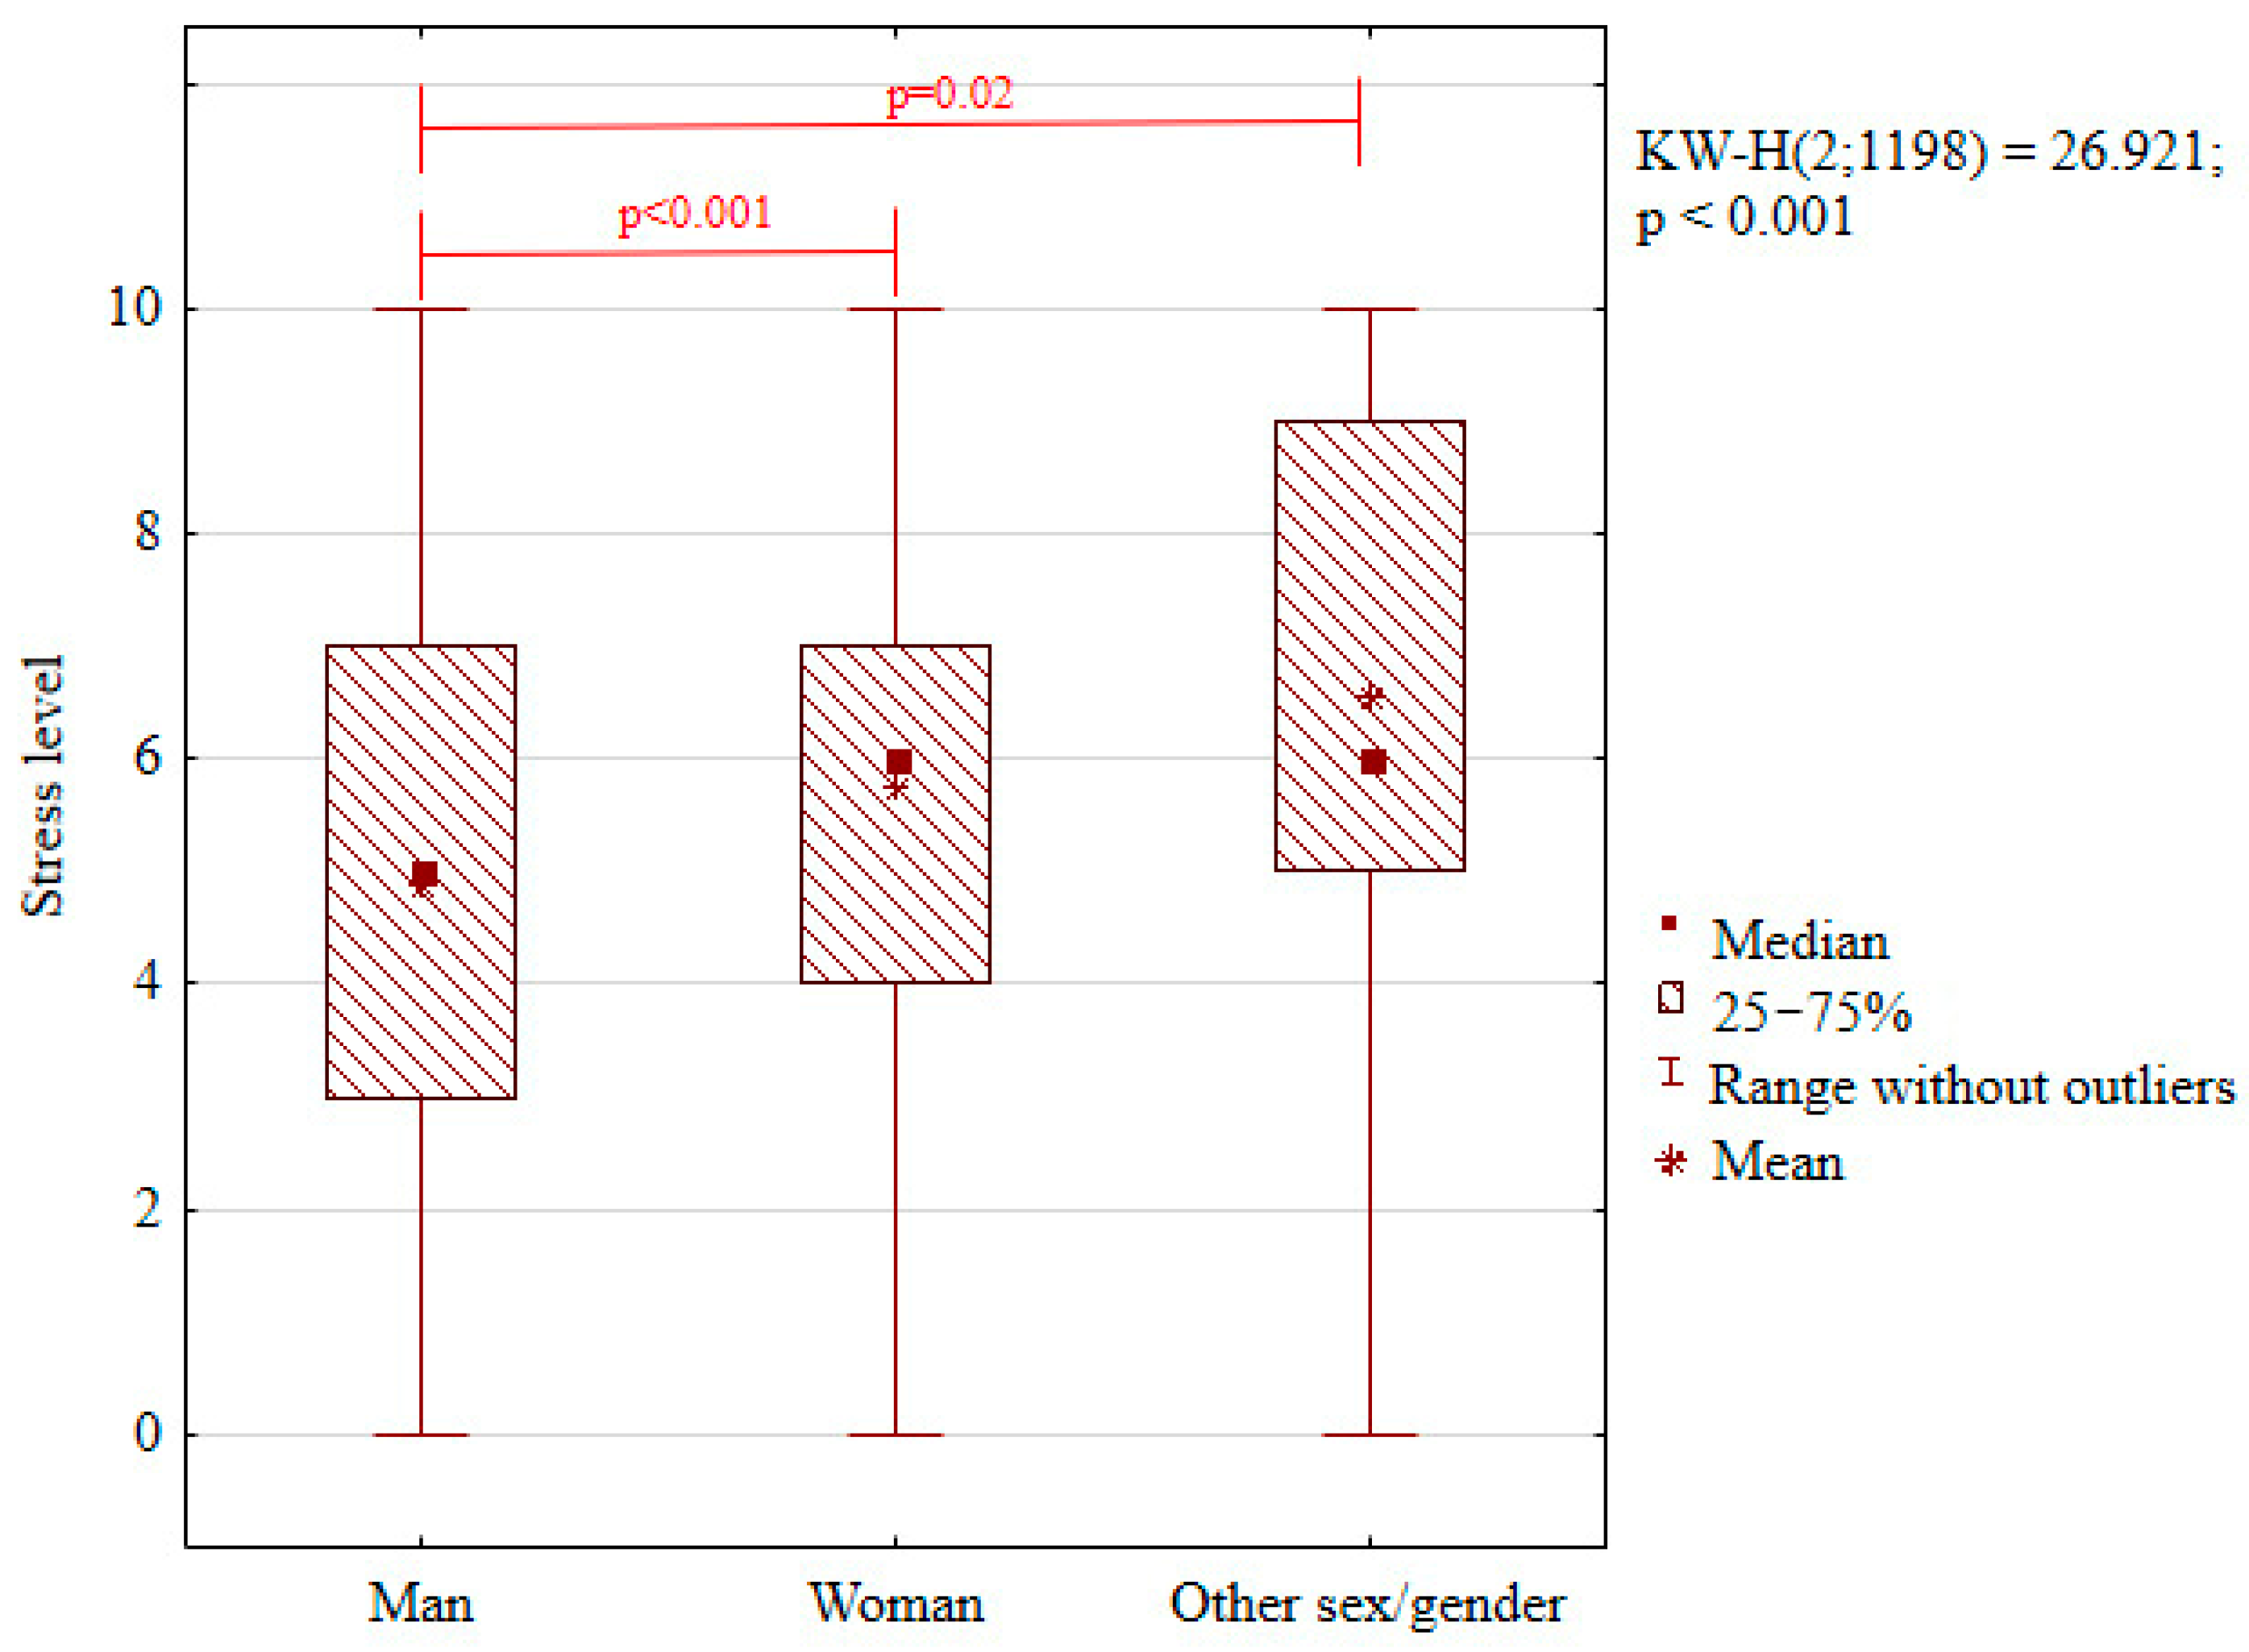
The analysis showed a significant impact of sex/gender on the level of stress experienced by respondents (Table 4). The highest level was noted among those who identified themselves as ‘other gender’; its mean value was 6.57. We also observed a statistically significant difference in the stress level between men and women, as well as persons identifying themselves differently (Figure 2). The value of the mean stress level for men was the lowest and amounted to 4.89. Additionally, the calculated coefficient of effect strength, η2 = 0.02, points to a small sex/gender effect in shaping the stress level of the sample group.
Table 4.
Analysis of the influence of respondents’ features on the stress level: results of the Kruskal–Wallis test.
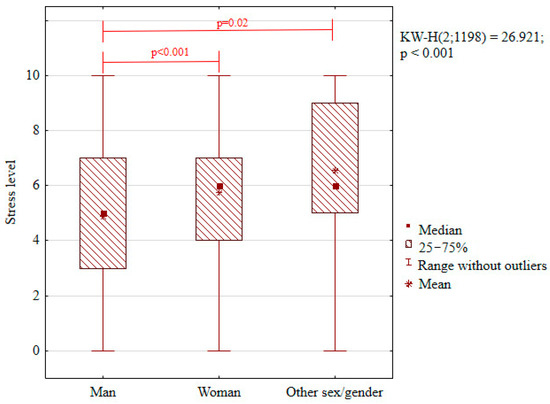
Figure 2.
Distribution of the subjective stress level by respondents’ sex/gender (box plot).
- Red Lines Indicate Statistically Significant Differences Between Groups (Post Hoc Tests Following Kruskal–Wallis Test)
The results of the Kruskal–Wallis non-parametric analysis of variance indicate a potential relationship between age and stress level. Although the p-value at 0.06 is not enough to reject the null hypothesis, the data suggest an upward trend in stress level with age (Table 3). The highest stress level was observed in the age group of 61–70 (6.61), and the lowest among 18–25 year olds (5.24). It should be noticed, however, that the group of respondents over 70 was small (eight persons, i.e., 0.7% of the investigated), which prevents us from obtaining statistically valid results. Consequently, an additional Kruskal–Wallis analysis was conducted after combining the age group of 61–70 with that of over 70. In this case, a statistically significant difference in the subjective stress level was identified between age groups (KW-H (3;1198) = 8.170; p = 0.043). The post hoc analysis revealed a significant difference between the 18–25-year-old respondents and those aged 61 and older (Figure 3).
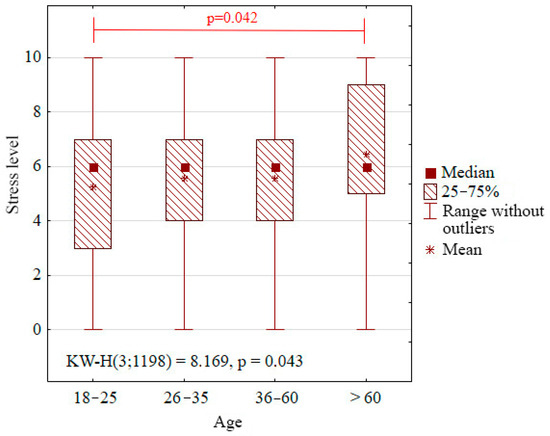
Figure 3.
Distribution of the subjective stress level by age (box plot).
- Red Lines Indicate Statistically Significant Differences Between Groups (Post Hoc Tests Following Kruskal–Wallis Test)
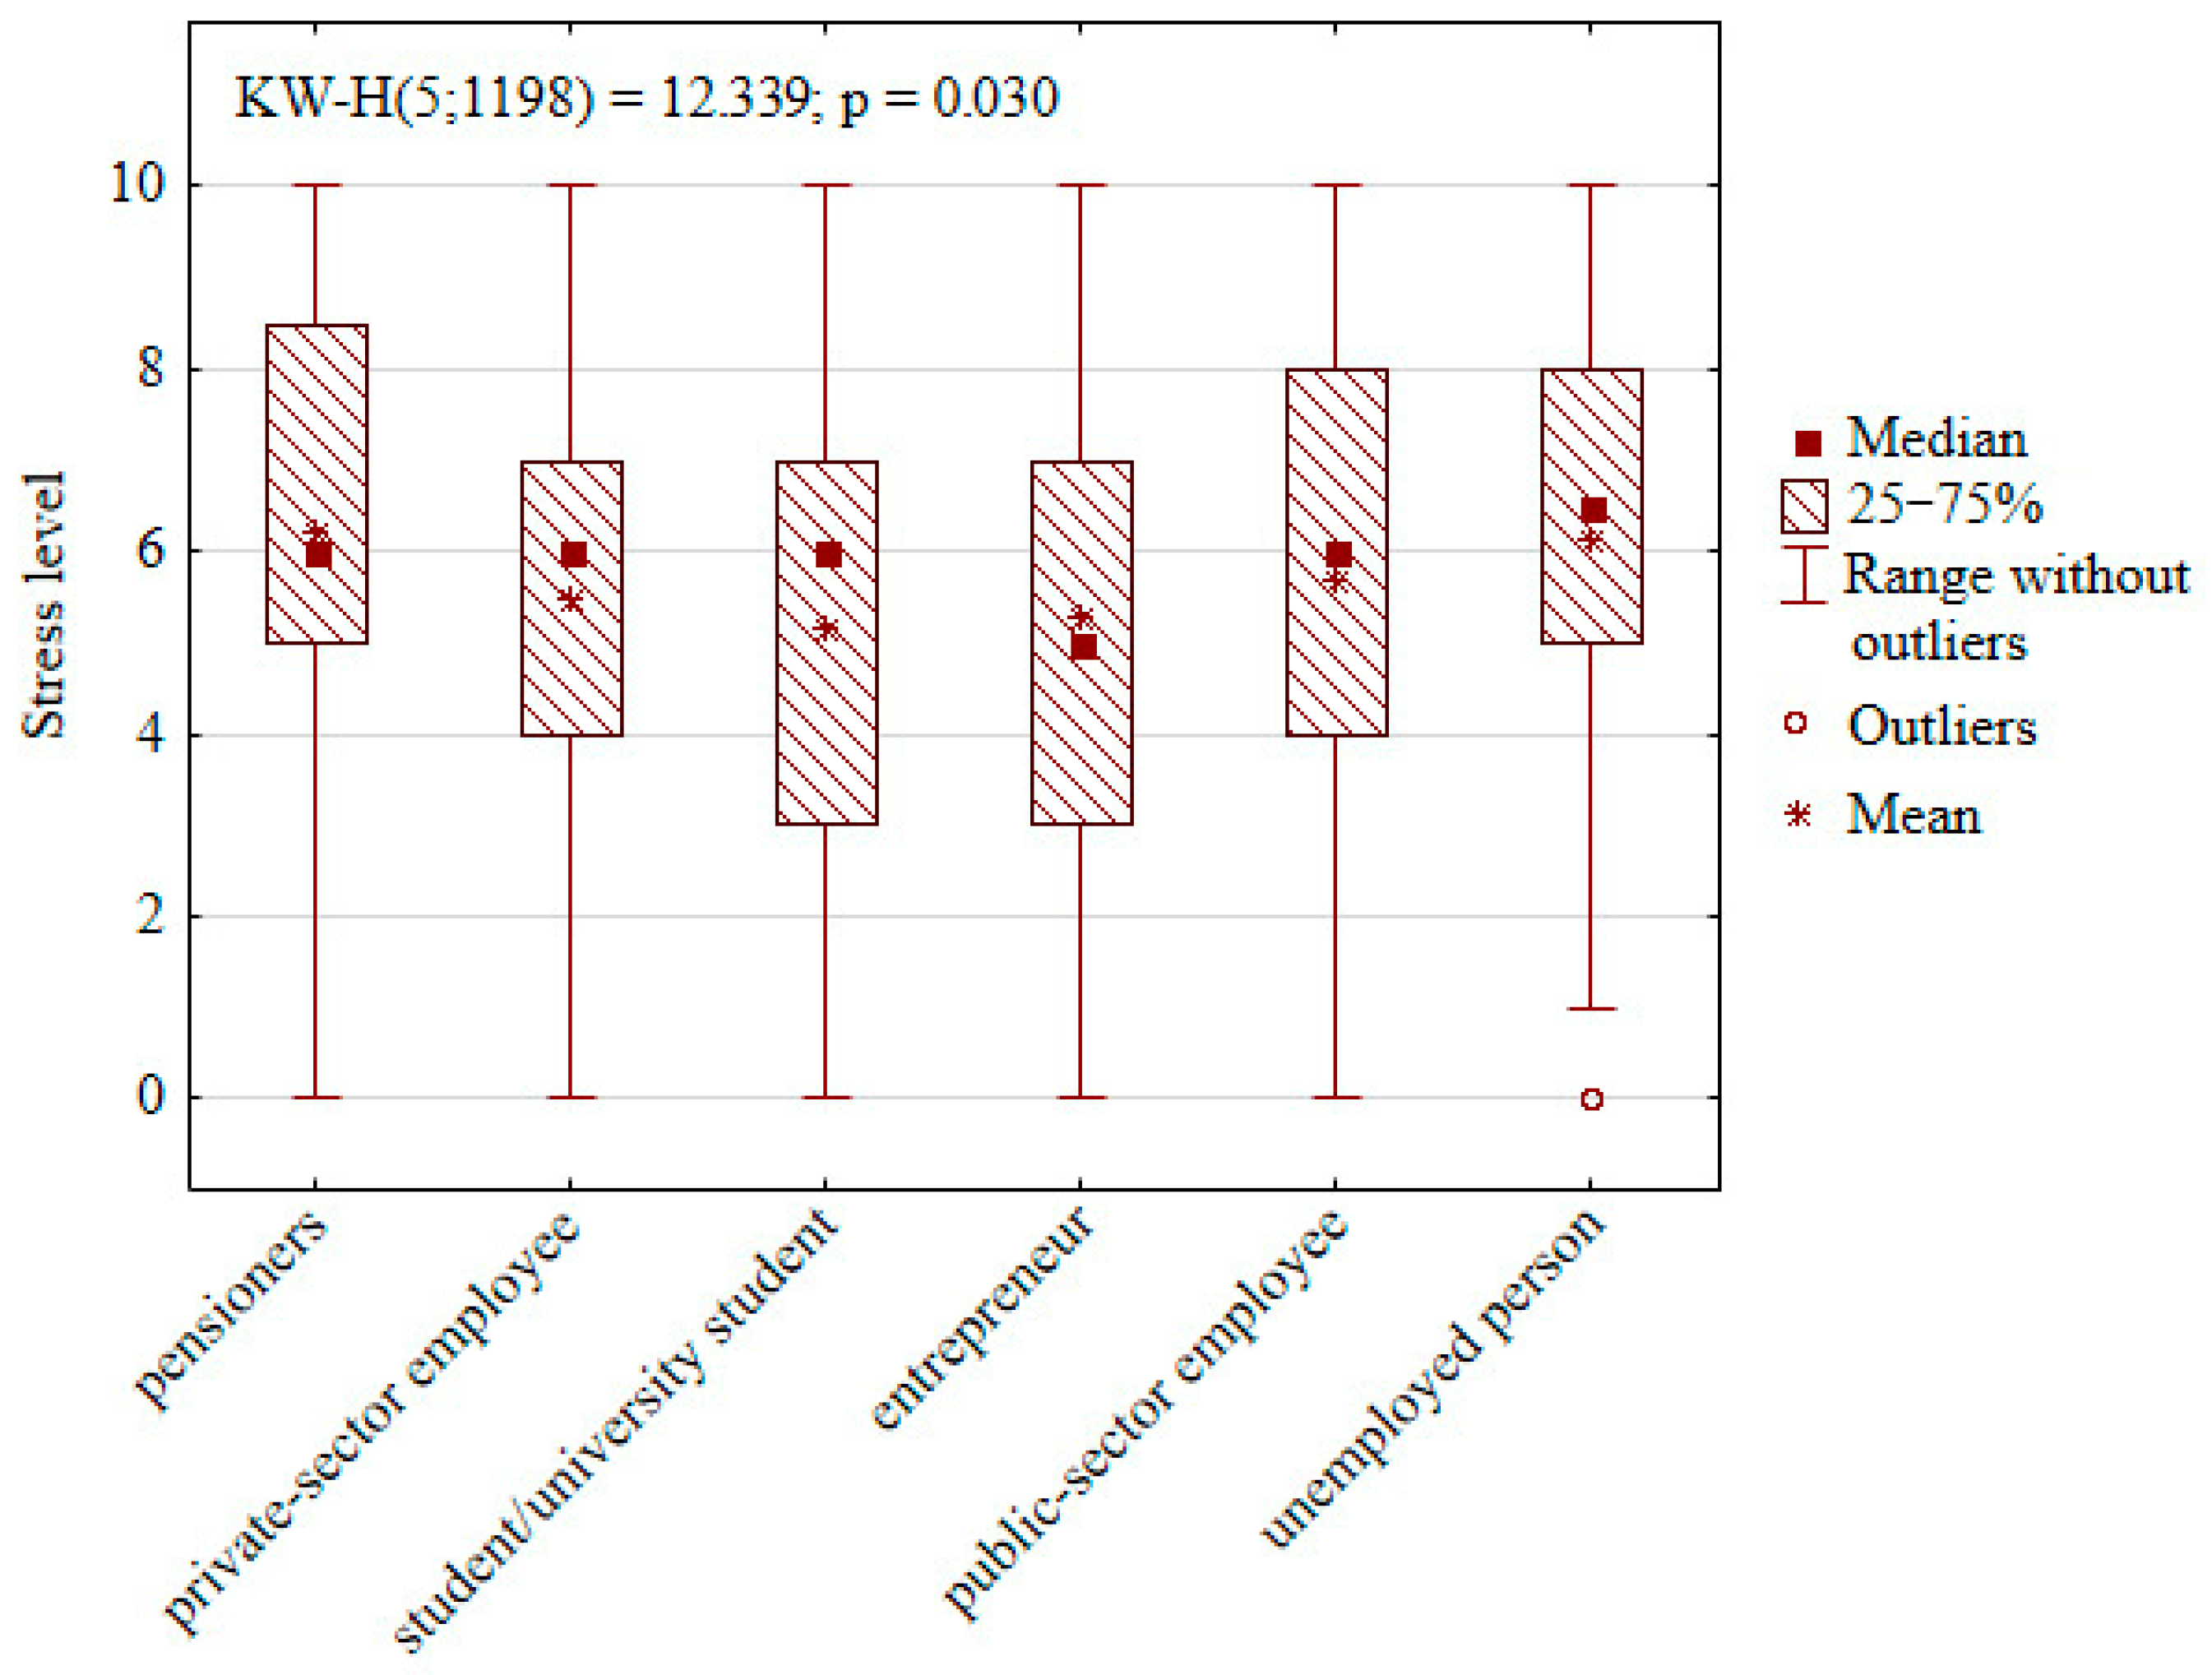
A dependency was also found between occupational activity and stress level (Figure 4). Pensioners and unemployed people were groups distinguished by the highest mean stress levels, amounting, respectively, to 6.23 and 6.13. Conversely, for school and university students, the mean stress level was the lowest, reaching 5.16.
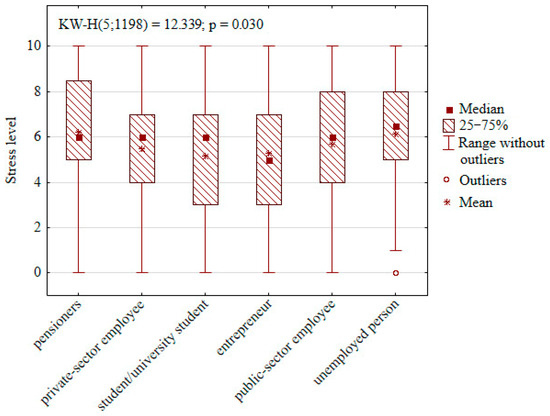
Figure 4.
Distribution of the subjective stress level by occupational activity (box plot).
Another factor affecting subjective stress level was practising profession, especially if this involved exposure to risks related to the COVID-19 pandemic (Table 3). The highest stress level was observed among tourism, hotel, and culture and entertainment employees, reaching 6.61. They were followed by nursery and preschool staff at 6.39. Grocery and pharmacy salespeople had the lowest stress level (5.36).
Dependencies between stress and respondent features such as education, the number of persons in a household, number of elderly people aged 60+ in a household, and the number of children in a household, both in various age groups and in total, were not noted.
4.3. Identification of Stress-Vulnerable Groups by the CHAID Decision Tree
To identify social groups especially vulnerable to pandemic stress, the CHAID decision tree was applied. The analysis allowed for variables typical of the respondents, such as age, sex/gender, education, occupational activity, profession practised, number of persons in a household, number of elderly people aged 60+ in a household, and the number of children in a household. The objective was to determine which social groups were characterised by the highest stress levels.
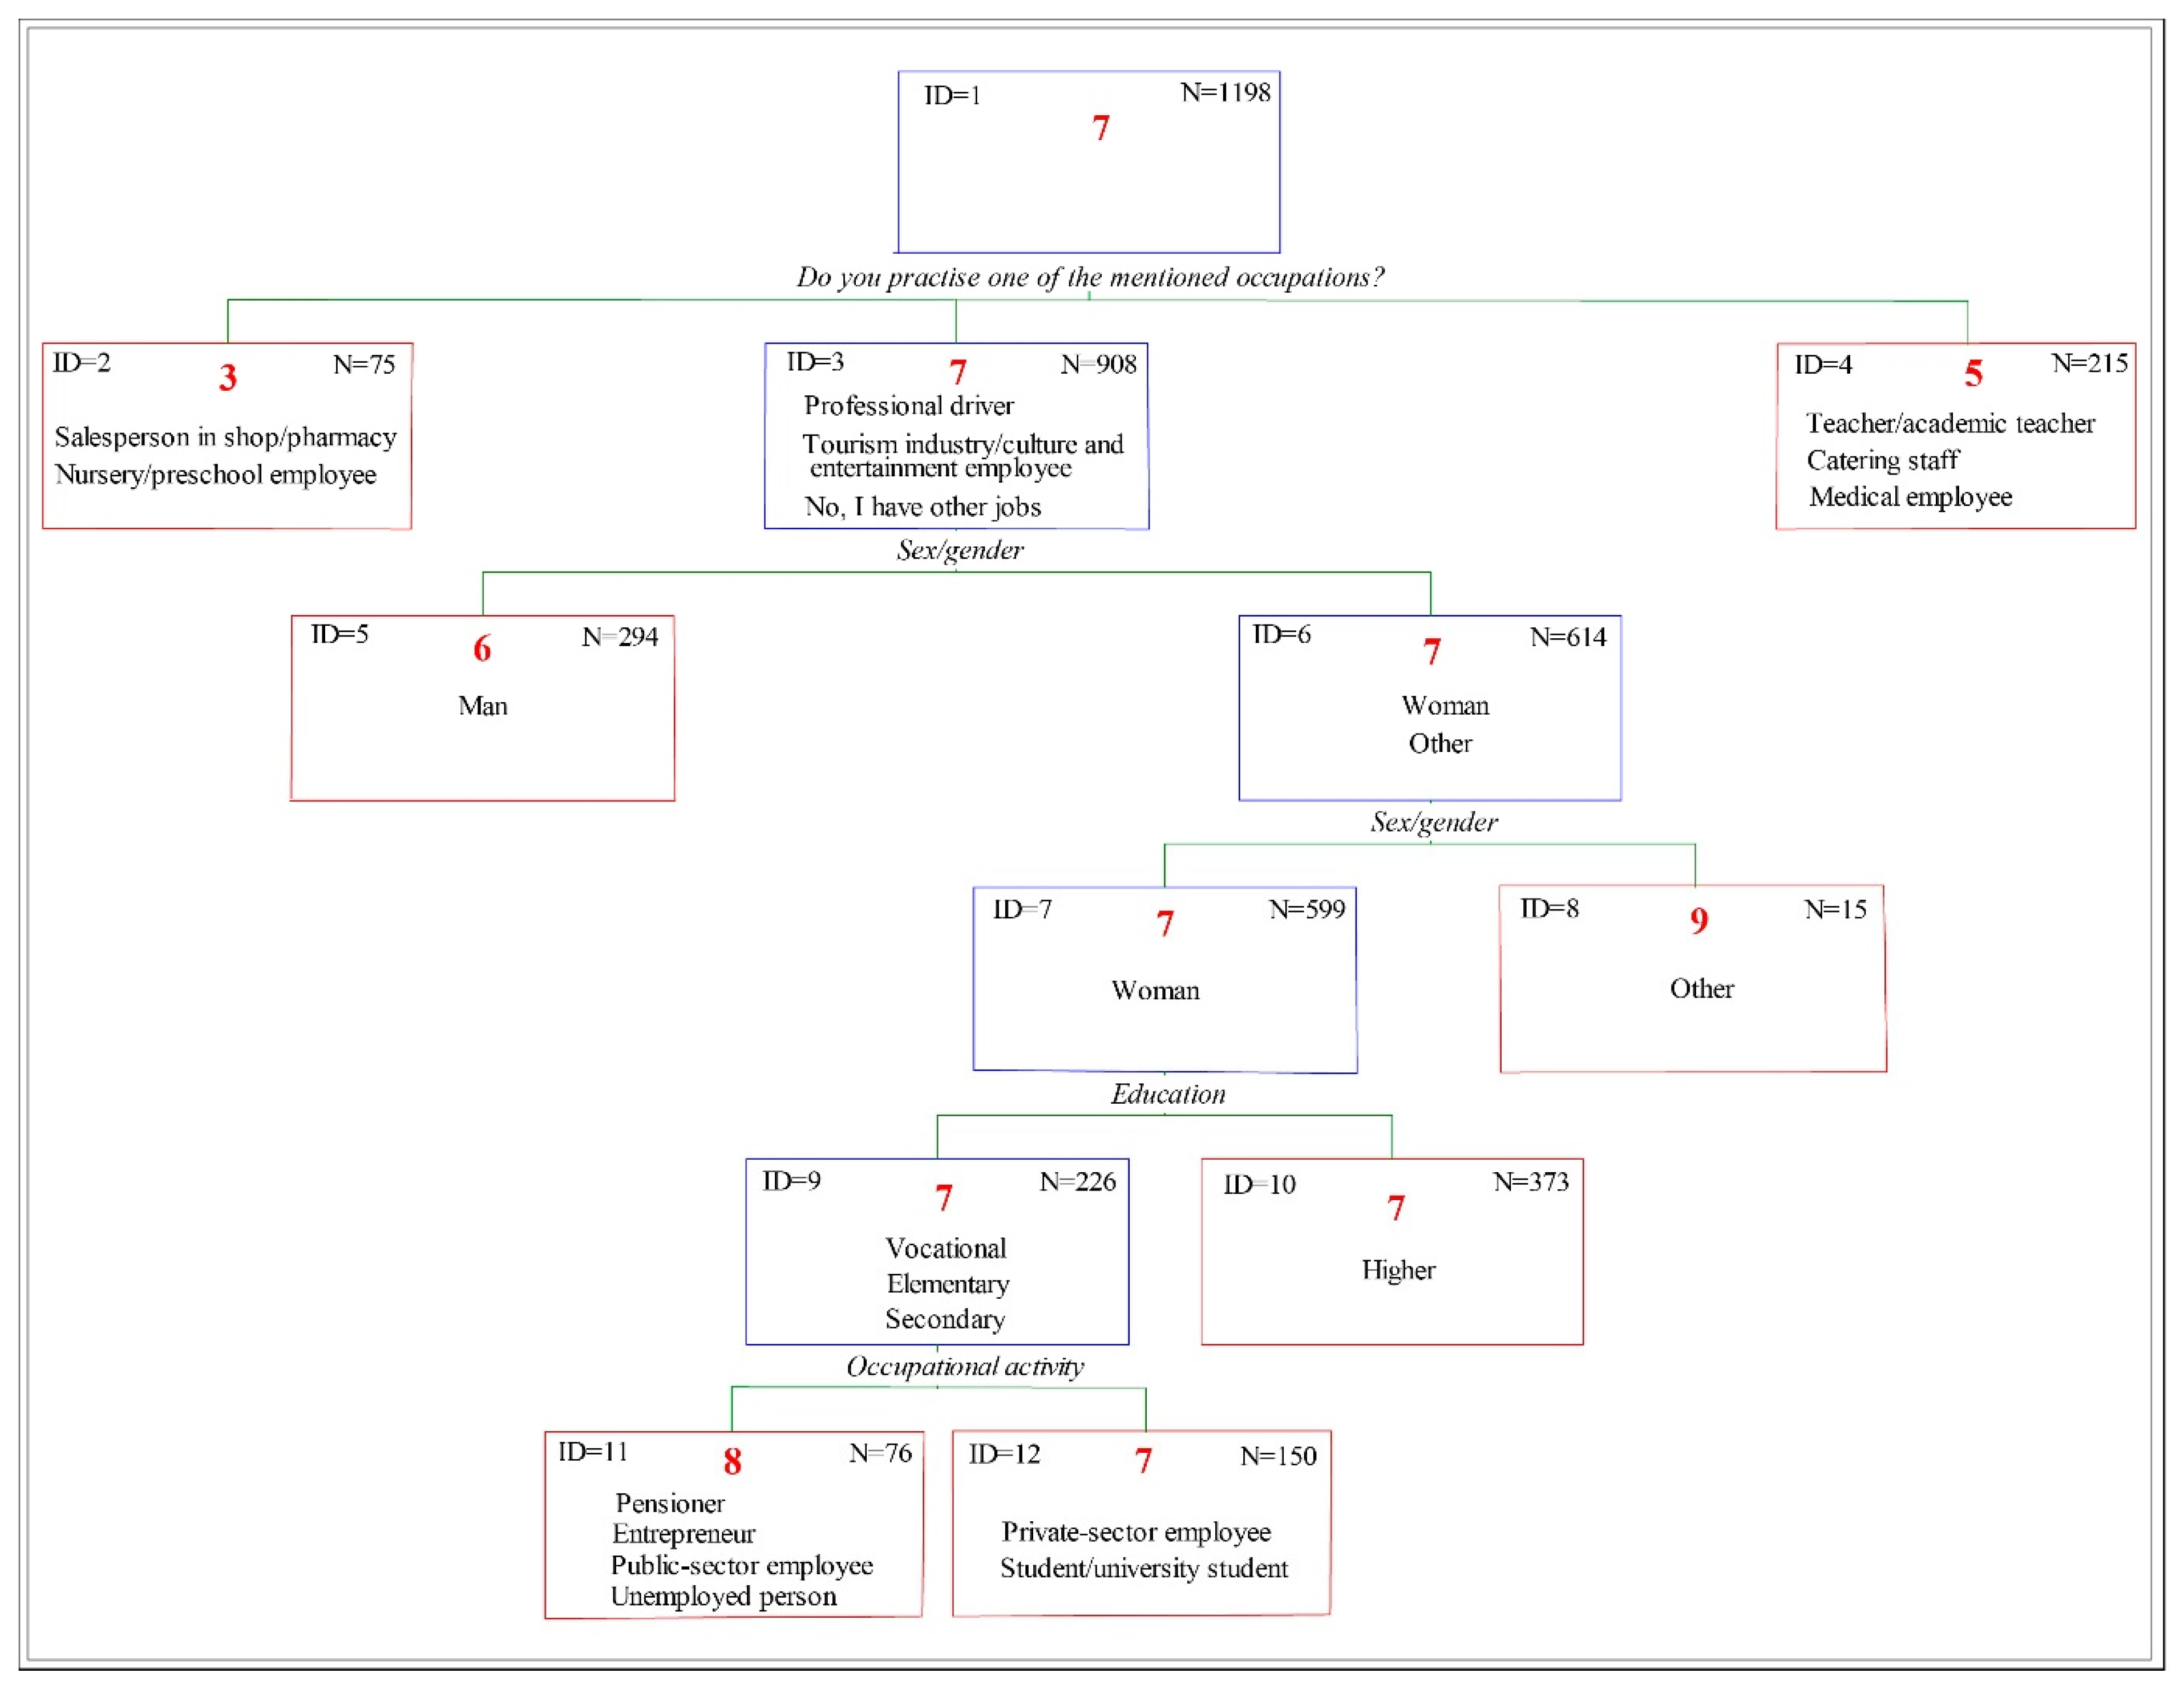
A decision tree, presented in Figure 5, was built to identify seven subgroups based on four variables. In the first stage of the analysis, three main groups were separated in the context of COVID-19-pandemic-related threats, depending on profession practised (Table 5), as follows:
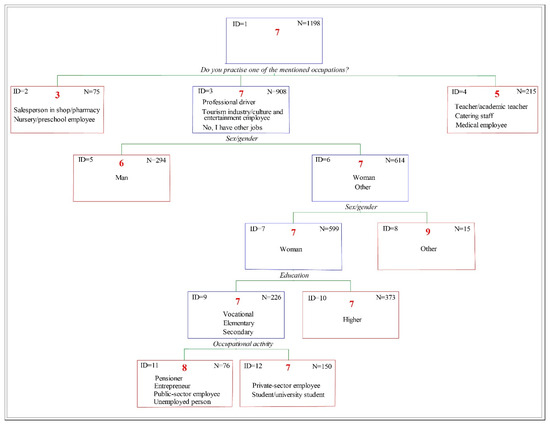
Figure 5.
The decision tree identifying social groups most vulnerable to stress during the COVID-19 pandemic.
Table 5.
Compilation of predictors for Node 1 in the Exhaustive CHAID model.
- First—includes salespeople and nursery and preschool staff (ID = 2, n = 25).
- Second—recognised as the most vulnerable, includes professional drivers, hotel and culture and entertainment employees, and also those practising other professions not mentioned in the geosurvey (ID = 3, n= 908).
- Third—composed of teachers, academic staff, medical personnel, and catering staff (ID = 4, n = 215).
Within the subgroup of professional drivers, hotel workers, and culture and entertainment employees and others (ID = 3, Figure 5), sex/gender was identified as the most significant predictor for the next split. This split divided individuals into the following three categories: women, men, and those identifying differently. The analysis showed that women and persons identifying themselves differently were more vulnerable to stress compared to men. Particular attention was paid to the group of individuals not identifying themselves with a binary sex division (n = 15), in which the highest level of predicted subjective stress was noted (mean value = 9).
The subgroup of women (ID = 7, n = 599) was subsequently split based on education level into the following two groups: persons with vocational, elementary, or secondary education (n = 226) and persons who had completed higher education (n = 373). Among those with a lower education level, further segmentation based on occupational activity made it possible to distinguish the following two groups: private-sector employees, students, and university students (n = 150) and pensioners, entrepreneurs, public-sector employees, and unemployed people (n = 85). The analysis results indicate that the last group had the second-highest level of predicted stress (after persons identifying themselves differently), reaching eight.
The standard error for the model amounted to 0.011, which means that the model was stable and its structure remained consistent and repeatable.
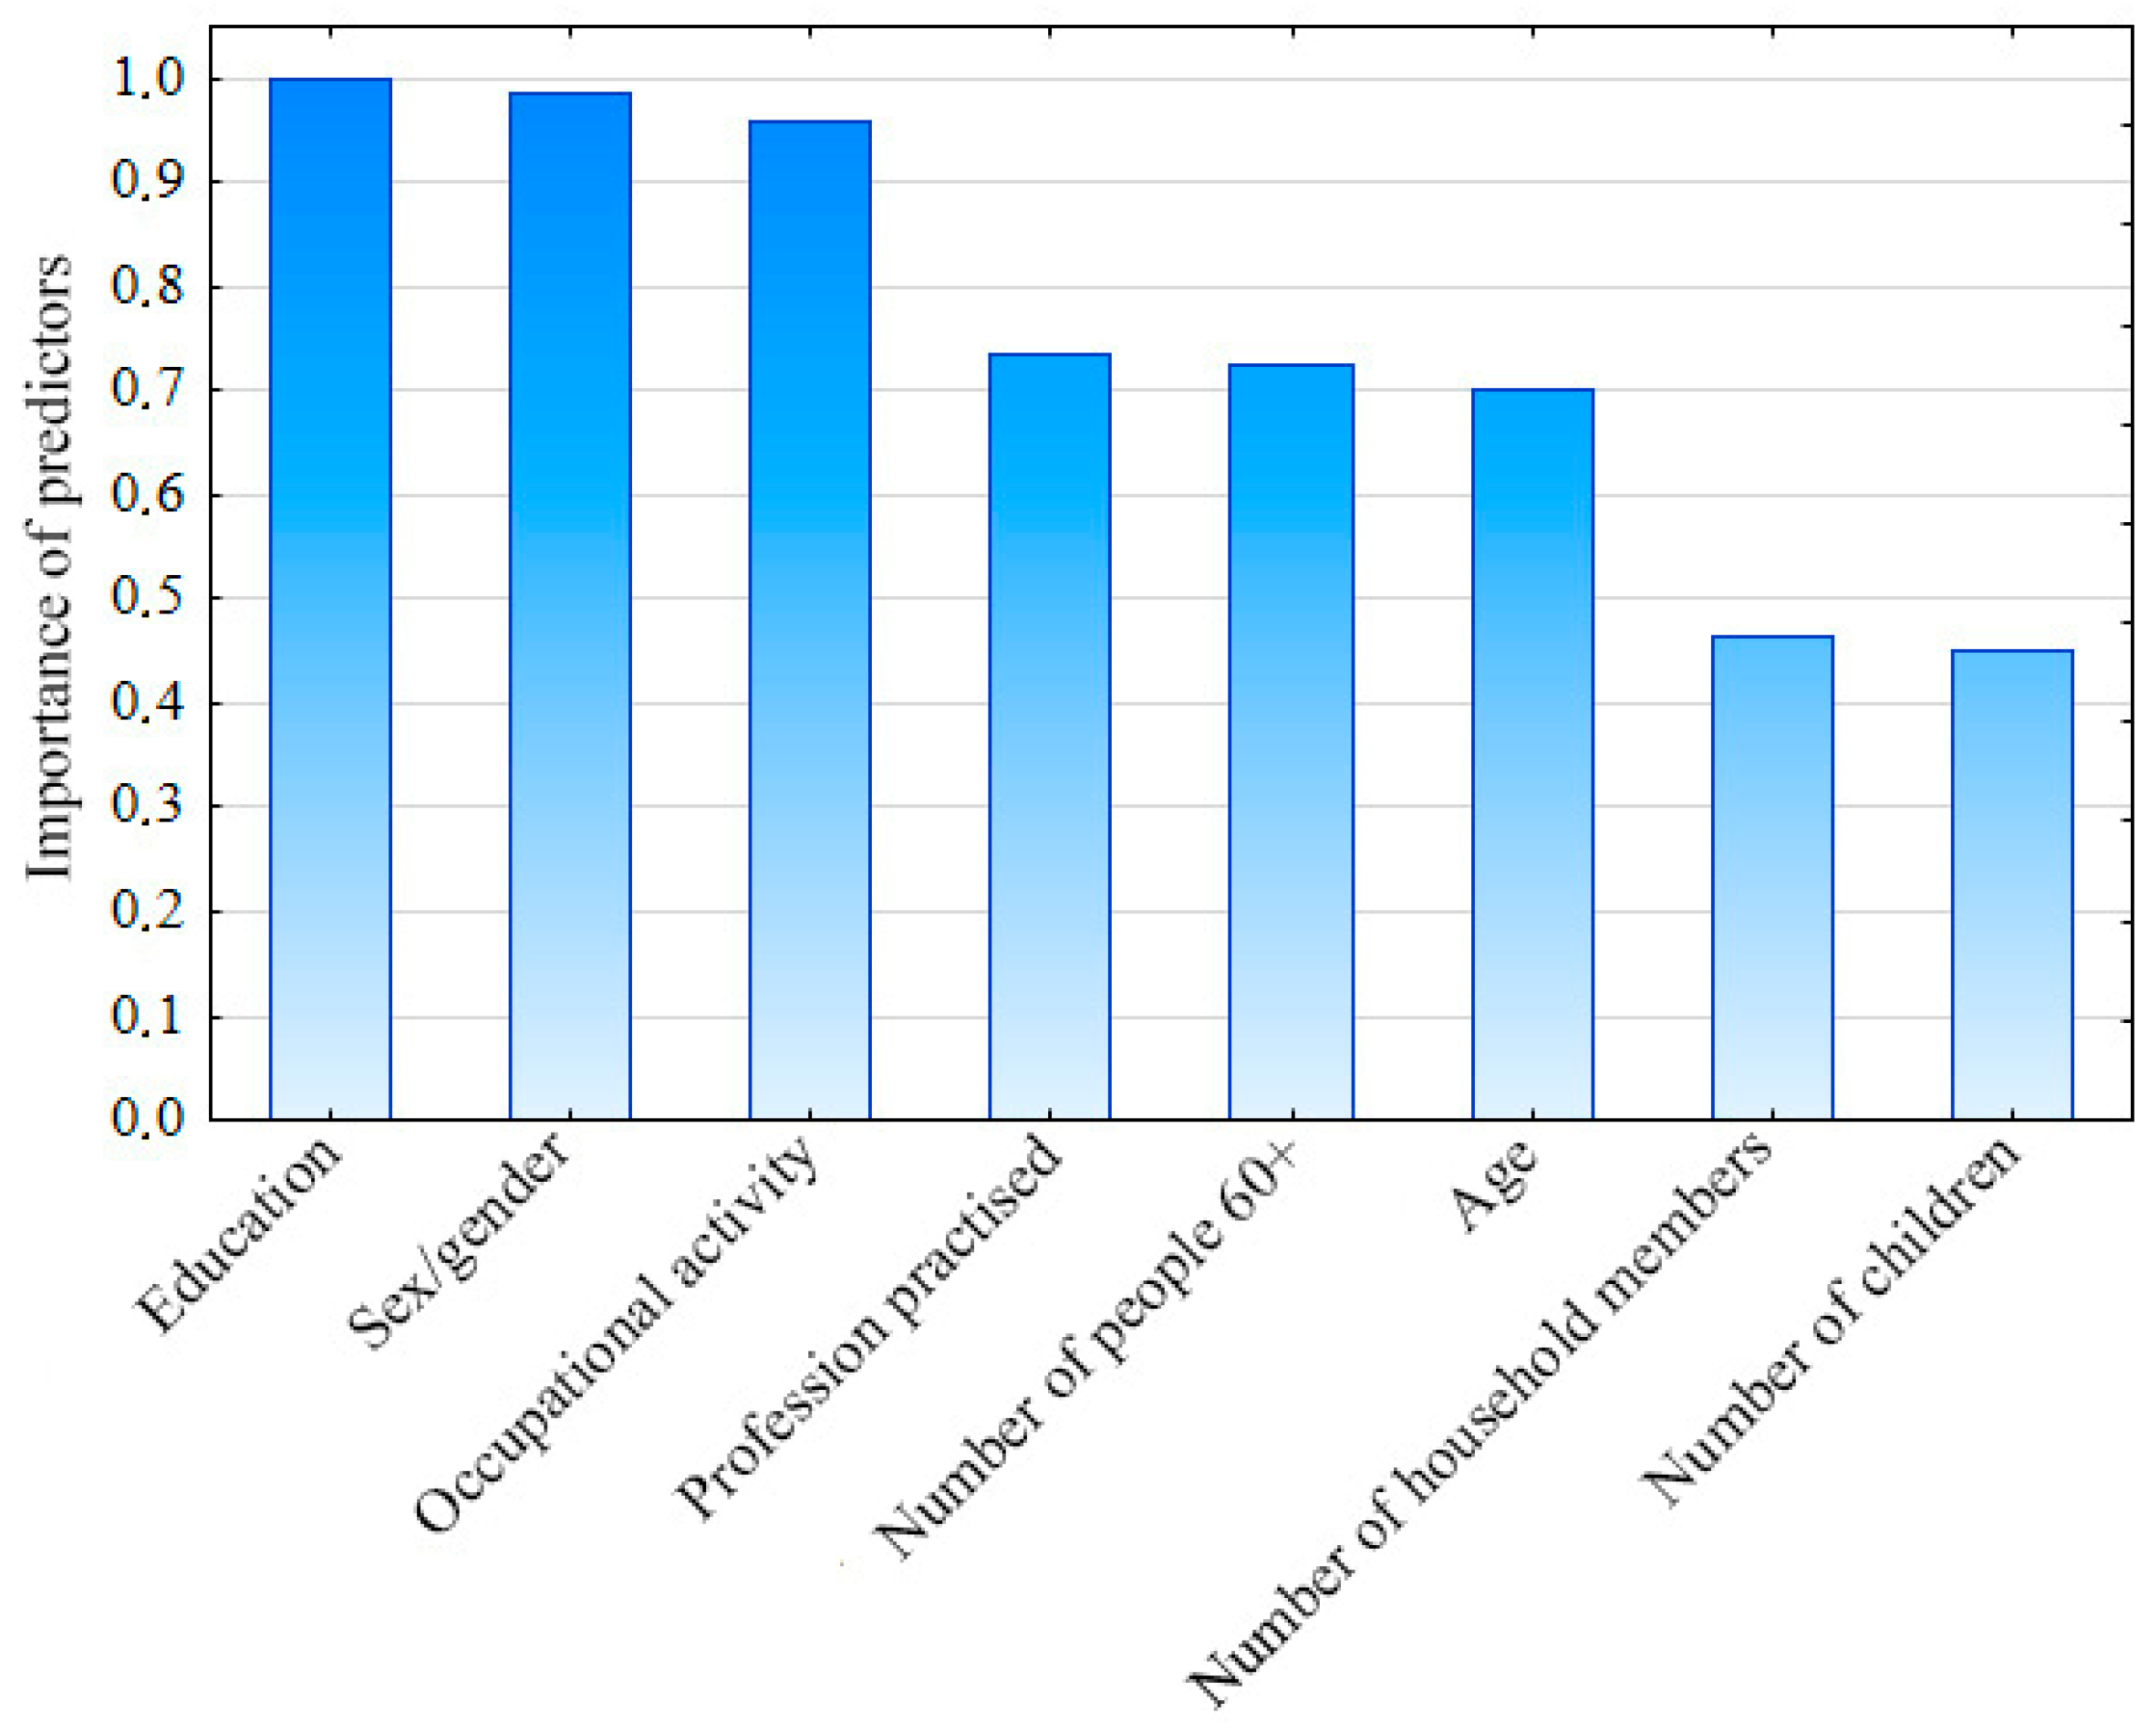
As part of the analysis with the CHAID decision tree, it was also examined which variables had the greatest impact on the level experienced. The results presented in Figure 6 show that the most important predictors of the stress level were education, sex/gender, and occupational activity.
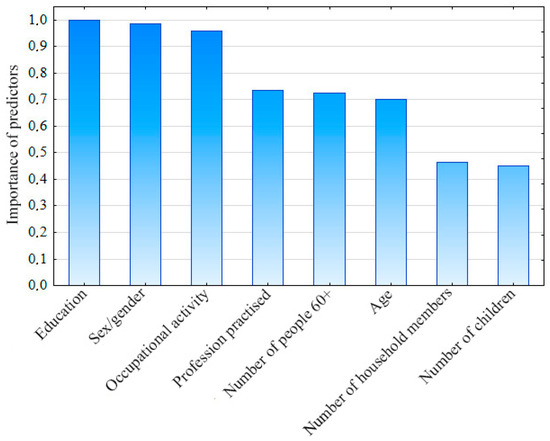
Figure 6.
Significance of explanatory variables in the CHAID model.
4.4. Predicting Vulnerable Group Status: Logistic Regression Results
Logistic regression analysis was conducted to identify the factors predicting membership in the stress-vulnerable group, defined as individuals reporting a subjective stress level of seven or above. The independent variables mirrored those used in the decision tree analysis, as follows: age, sex/gender, education, occupational activity, profession practised, number of persons in a household, number of elderly individuals (60+) in a household, and number of children in a household.
The Likelihood Ratio Test indicated that the overall model was statistically significant, χ2(24, n = 1198) = 44.08, p = 0.007. Although the model explained a relatively small proportion of the variance in the outcome, this was statistically significant (Nagelkerke R2 = 0.049). Among individual predictors, sex/gender was significantly associated with membership in the stress-vulnerable group, χ2 = 16.54, p = 0.0003. The effect of education approached significance, χ2(3) = 6.59, p = 0.087. Other variables, including household size (p = 0.473), number of elderly individuals in a household (p = 0.873), number of children in a household (p = 0.276), age (p = 0.766), occupational activity (p = 0.685), and profession practised (p = 0.137), were not significant predictors (Table 6).
Table 6.
Logistic regression predicting membership in the stress-vulnerable group (subjective stress ≥ 7).
After adjusting for all other variables, the following two predictors remained statistically significant:
- Gender: Males had significantly lower odds of being in the stress-vulnerable group compared to females and individuals of other genders (odds ratio (OR) = 0.51; p = 0.015), suggesting that men were approximately 49% less likely to report high stress levels.
- Profession practised: Those employed in the tourism, culture, and entertainment sectors had higher odds of being in the stress-vulnerable group compared to the reference occupation category (OR = 2.42; p = 0.018), indicating that they were more than twice as likely to report elevated stress.
4.5. Spatial Aspects
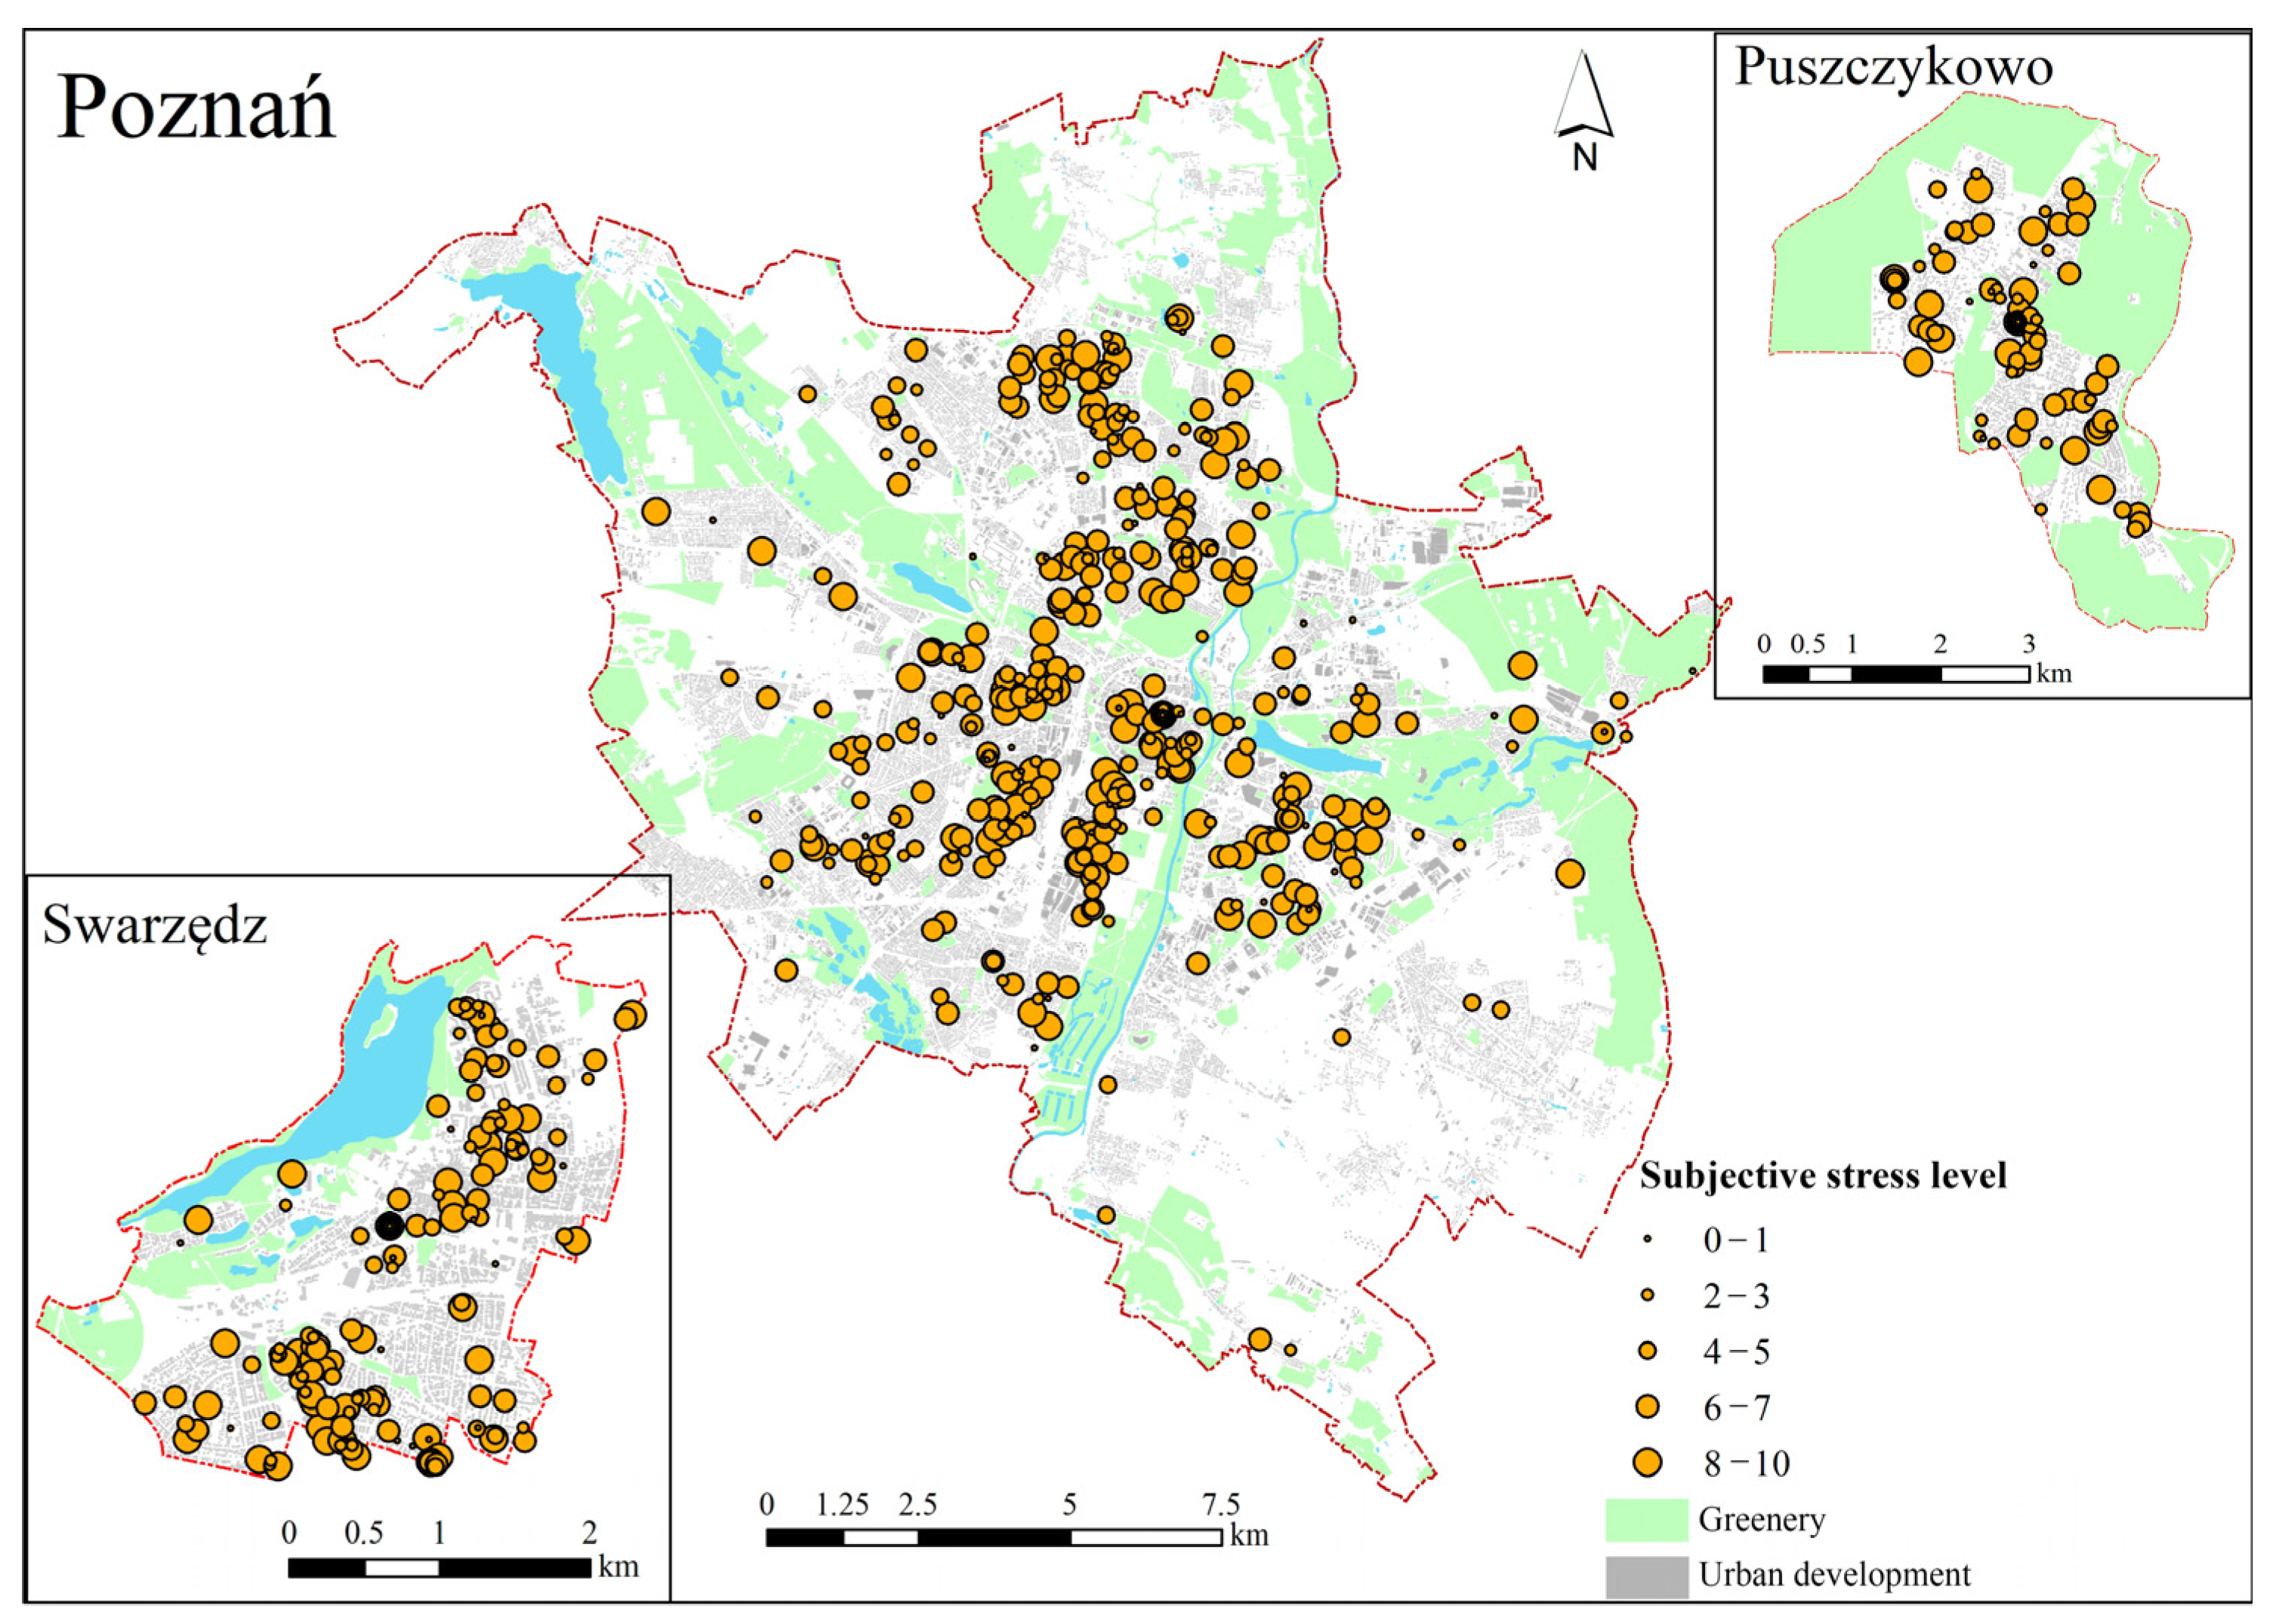
While in the initial stage of the analysis, the spatial distribution of the stress level assigned to respondents’ residences seemed quite chaotic and devoid of a clear pattern (Figure 7), a more rigorous statistical approach revealed underlying structures. To formally assess this, global spatial autocorrelation analysis (Global Moran’s I) was conducted for each city independently. For Poznań, a statistically significant positive spatial autocorrelation was found (Moran’s I = 0.523, z-score = 4.85, p < 0.001), indicating a strong tendency for similar stress level values to cluster together. This suggests that the observed spatial distribution of stress values in Poznań was highly unlikely to be the result of random chance. In contrast, Swarzędz (Moran’s I = –0.001, z-score = 0.104, p = 0.917) and Puszczykowo (Moran’s I = −0.137, z-score = −1.222, p = 0.222) did not exhibit statistically significant global spatial autocorrelation, indicating that the spatial distribution of stress levels in these two smaller towns was more random.
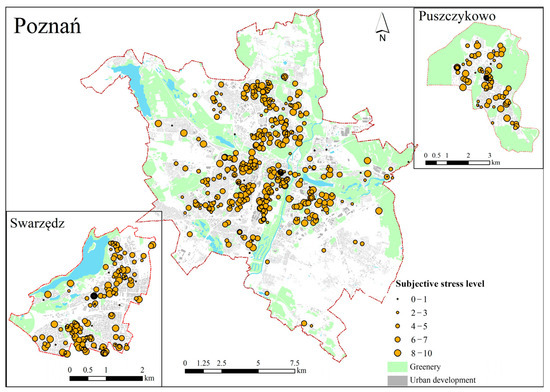
Figure 7.
Spatial distribution of respondents’ pandemic stress levels.
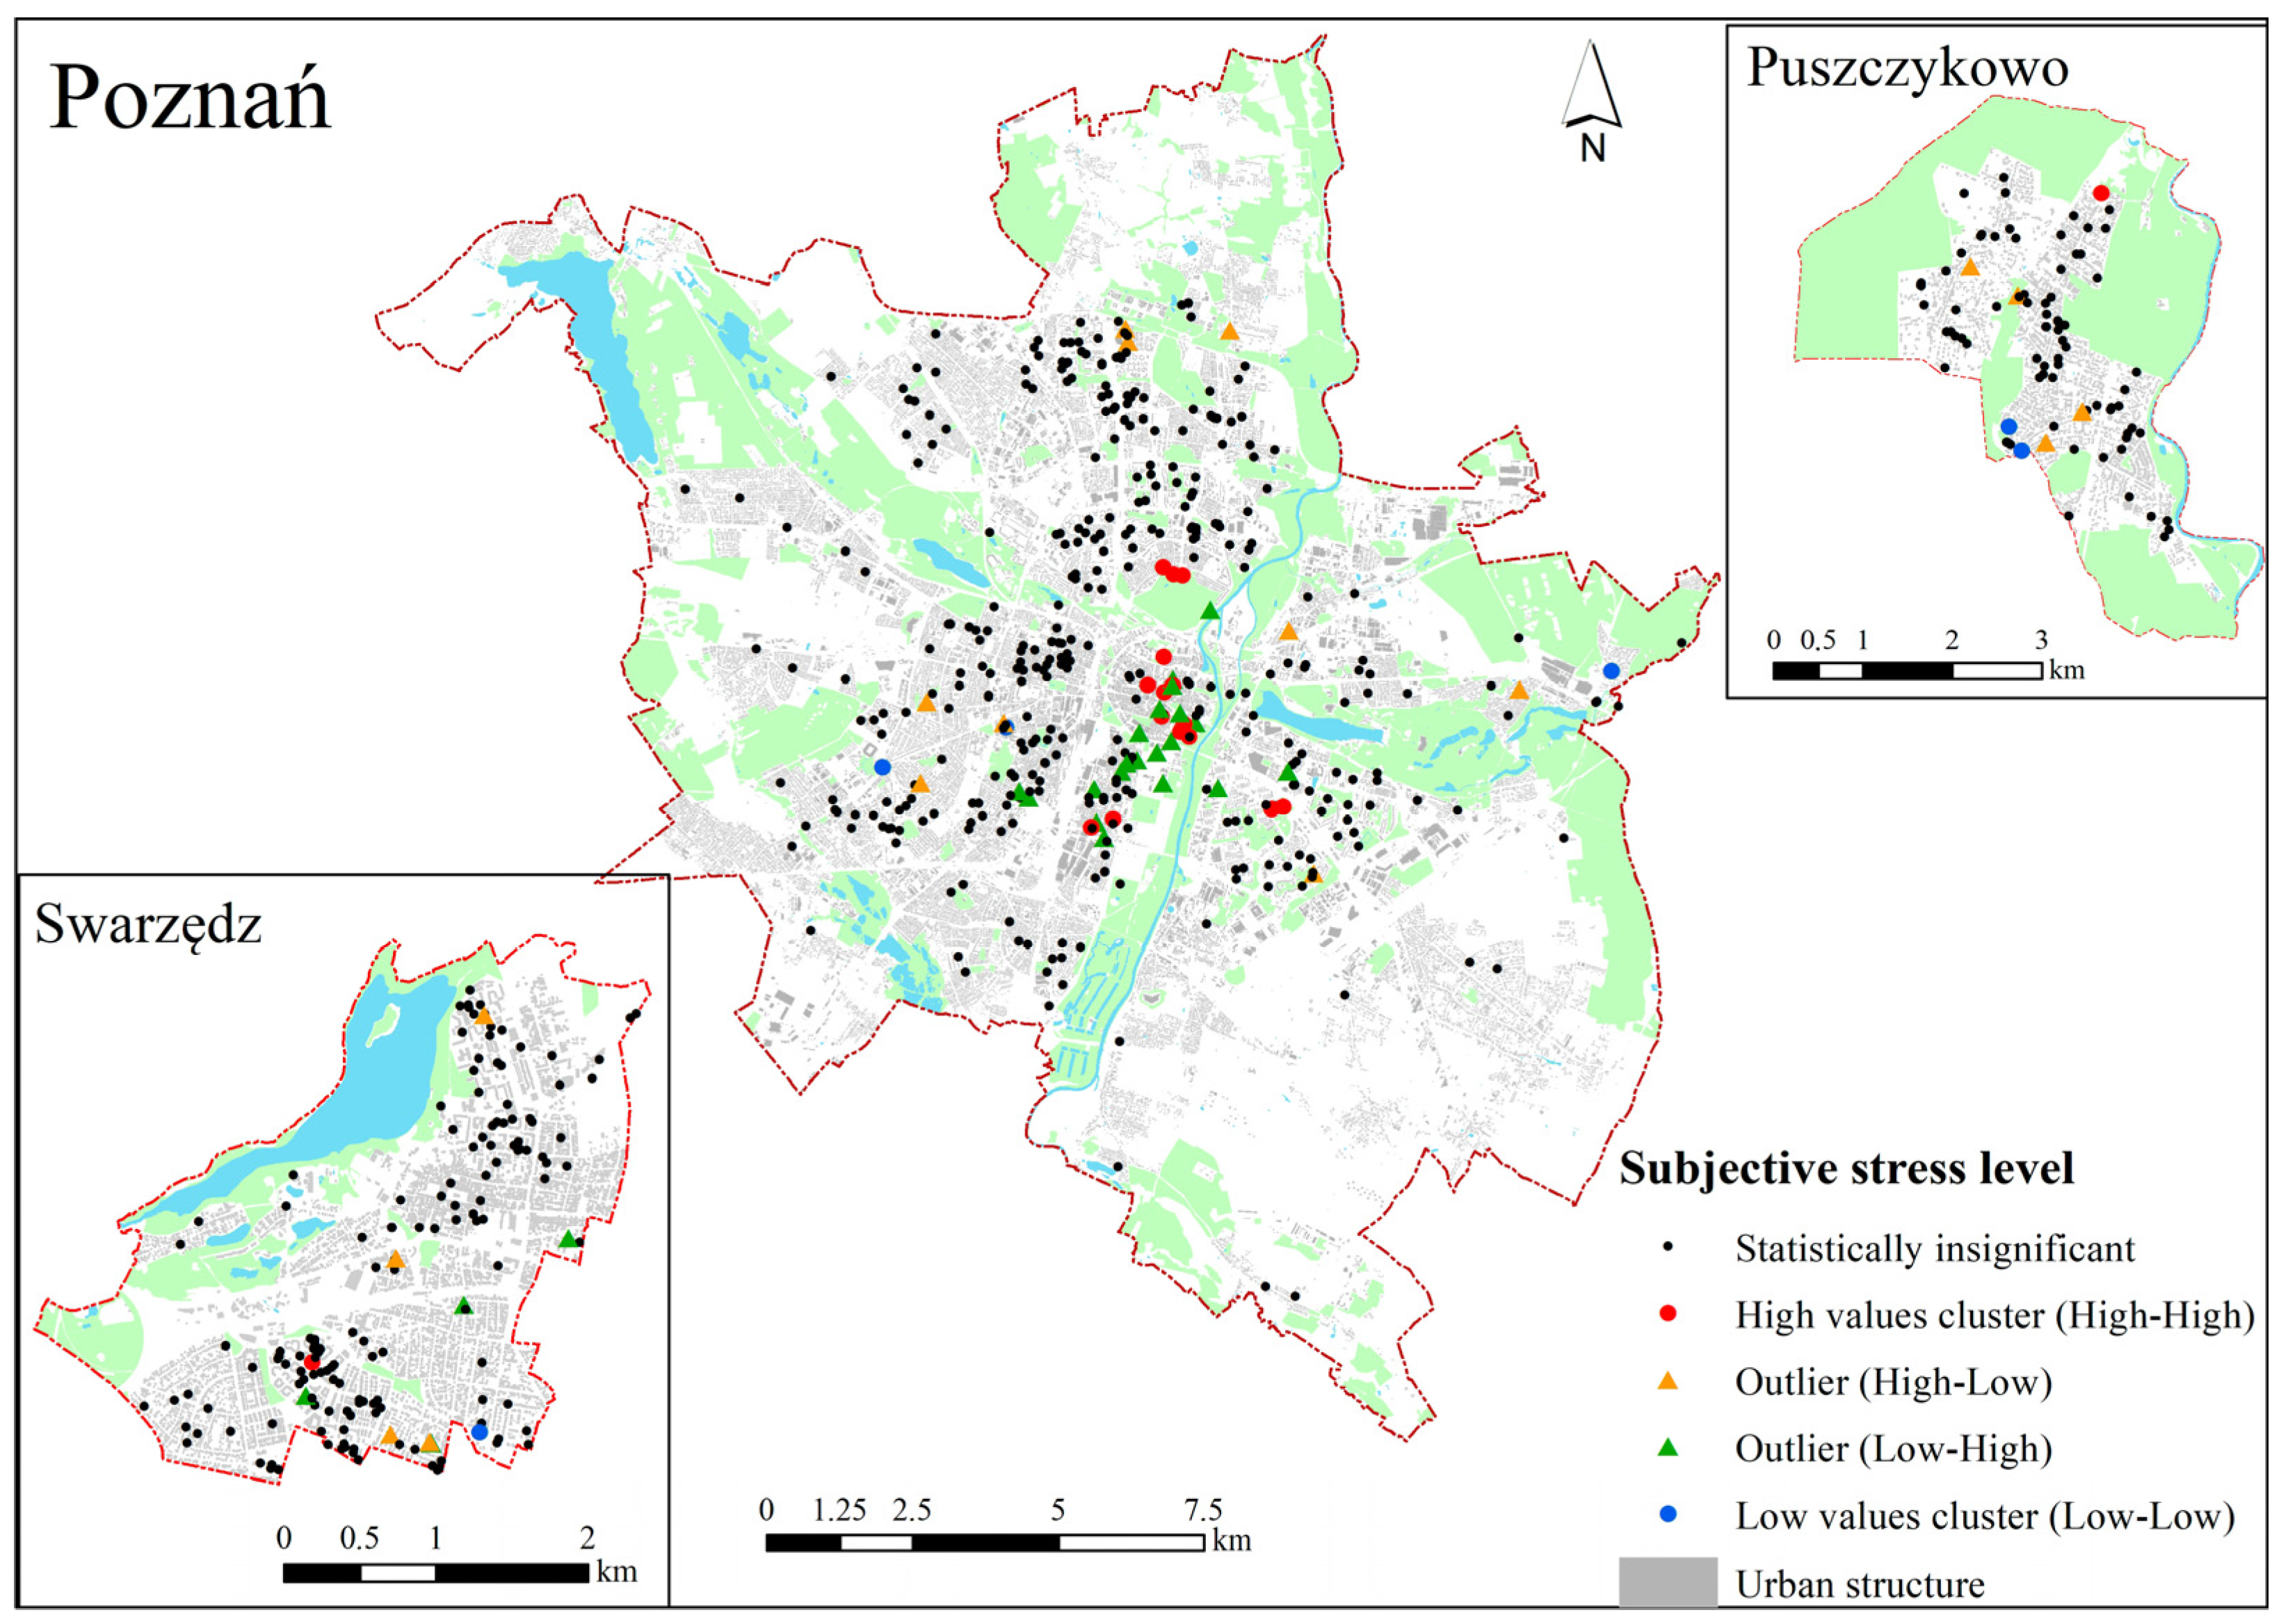
In Poznań, consistent with the significant global Moran’s I, a prominent cluster of high–high (HH) stress values was identified. This HH cluster was predominantly located in the densely built-up city centre, an area characterized by compact, multi-apartment developments (Figure 8). Additionally, a few HH observations were noted near an industrial zone. These HH clusters appeared to be associated with highly urbanized environments. A cluster of low–low (LL) stress values was formed by several observations located on the peripheries of Poznań, areas that typically feature less dense development. Notably, no clear influence of proximity to green spaces was observed in the formation of either high- or low-stress clusters.
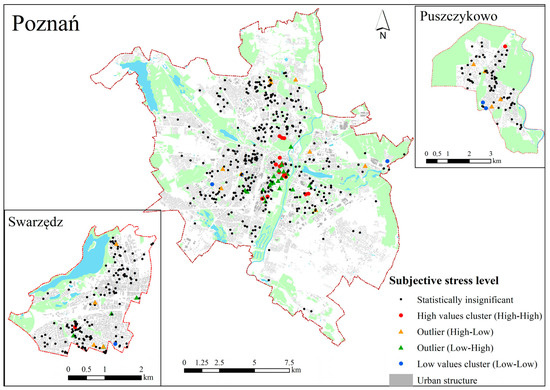
Figure 8.
The respondents’ subjective stress levels—results of cluster and spatial outlier analysis (Anselin Local Moran’s I).
Despite the lack of significant global spatial autocorrelation, the Local Moran’s I analysis revealed a few isolated clusters of both high and low stress values in Swarzędz and Puszczykowo. In Swarzędz, a small high–high (HH) cluster was identified in the southern part of the town, while in Puszczykowo, a similar high-value cluster appeared in the northern area. Additionally, a more extensive low–low (LL) cluster was observed in the southeastern part of Puszczykowo, indicating a localized area of lower stress.
5. Discussion
This research identified the demographic and socio-economic features affecting subjective stress levels in the urban population in terms of the COVID-19 pandemic. The results showed a statistically significant influence of sex/gender, age, occupational activity, and profession practised on the stress levels experienced. A non-parametric analysis of variance and CHAID decision tree analysis indicated that sex/gender was one of the most important factors affecting stress level. In particular, women and persons who identified themselves differently experienced a higher stress level compared to men. These results correspond to earlier research, which also demonstrated differences in experiencing stress depending on sex/gender, with women being the most vulnerable, showing a higher level [45,55,56,57]. For them, this higher level of stress may have been related to social roles and family responsibilities.
The relationship between stress and age showed an upward trend; the highest values were observed among people over 60. There was a statistically significant difference in their stress level compared to younger respondents (18–25 years of age). Similar dependencies were noted in a study by Udeogu et al. [58], which emphasised that older adults, especially those of advanced age, may experience more stress compared to younger people, which may result from their greater sensitivity to health threats and social changes. At the same time, there are studies suggesting the reverse—younger people may be more sensitive to stress [34,46]. However, our research does not support this.
Significant factors affecting stress level were occupational activity and profession practised. Pensioners and unemployed people had higher stress levels compared to those that were economically active, which is confirmed by earlier research showing greater exposure to stress among economically inactive people, especially regarding the COVID-19 pandemic [59].
Moreover, the highest stress level was noted among tourism, hotel, and culture and entertainment industry employees (which may have been the result of uncertainty originating from lockdowns), and also among nursery and preschool staff. The COVID-19 pandemic had a considerable impact on the stress levels of medical personnel, who had to face increased professional demands, fear of infection, and emotional burden, which added to their stress. People employed outside this sector, whose work involved contact with the public, also experienced greater stress because of professional demands and risk of exposure. Their stress level was often comparable to that felt by medical personnel [60,61].
The application of the CHAID decision tree allowed for identifying groups especially vulnerable to stress. Such groups included women and persons identifying differently, those working as professional drivers, those working in the tourism, hotel, and culture and entertainment industry, and others not mentioned in the geosurvey. The predicted value of stress level in this group was seven, which surpasses the critical value adopted in the research.
As part of this group, the following two less numerous subgroups may be additionally distinguished, demonstrating the highest exposure to stress: (1) persons identifying themselves differently, those working as professional drivers, those employed in the tourism, hotel, culture, or entertainment industries, and those in other occupations—their projected stress level value was nine; and (2) women without higher education, those inactive economically (female pensioners or unemployed women), running their own company, or public sector workers—their projected stress level value was eight.
The results of the logistic regression analysis confirmed and extended these findings by showing that, after adjusting for all other variables, gender and profession practised remained significant predictors of being in the high-stress group. Men were found to be approximately 49% less likely to experience high stress levels compared to women and those identifying differently. In contrast, individuals working in the tourism, culture, and entertainment sectors were more than twice as likely (OR = 2.42) to belong to the stress-vulnerable group, suggesting that employment context played a critical role in stress perception during the pandemic.
Social groups vulnerable to pandemic stress are, thus, relatively numerous and quite diverse. So, we can agree with the statement that, during a pandemic, when stressors include not only the presence of the virus itself, but also the restrictions imposed by public authorities [4,5,6], even groups that are not susceptible to the virus can become vulnerable [28]. This is not a favourable situation from a public health perspective.
A novel aspect arising from our research—one that has not been extensively studied before—is the finding that people who define themselves “differently” (than women/men) are particularly sensitive to stress under pandemic conditions. We also identified certain professions that are particularly vulnerable to pandemic stress, extending beyond the commonly studied group of healthcare workers.
After the pandemic, a serious threat to the safety, health, and well-being of people, it has become a natural impulse to consider improving the functioning and effectiveness of health systems in terms of preventing problems, treating diseases, and caring for sick people. Among the directions for rebuilding health systems, the protection of those most vulnerable to health loss is recommended [39], including mental health [62]. Their identification may help city authorities to better choose countermeasures during health crises, such as a pandemic, and adaptation strategies, which will be conducive to building city resilience to stress. The ability to respond to a pandemic is an important adaptive capacity. The issue remains what actions should be taken in this respect.
Some authors point out that relevant investment in elementary healthcare systems is conducive to an effective reaction to a pandemic (including hospital beds, social insurances, and social conditions) [33,63,64].
Others pay attention to the possibility of using intelligent technology for efficiency as a new way of adapting to the main social and economic problems observed during the pandemic by teleworking, online shopping, distance learning, and telemedication. However, this calls for the elimination of digital exclusion [65].
At the same time, emphasis is put on the fact that, during the COVID-19 pandemic, some conflicts between various entities and governance levels, as well as the ineffective use of limited resources, have surfaced [3,30]. This calls for improving the pandemic-related crisis management model, including the cautious introduction of restrictions (especially in vulnerable groups), which became a source of stress for urban dwellers, which may help to build greater city resilience [3,66].
Although few studies have been conducted on green and open areas regarding the spread of COVID-19, there are arguments that cities have to improve access to public spaces to ensure physical distance and better mental health. The provision of such spaces will help to satisfy the needs of outdoor recreational meetings. The reconfiguration of green areas may also improve the urban greenery system, which may contribute to a healthier lifestyle and eventually stronger immunity against other viruses and threats [3,6].
Research Limitations
This research, as any study, has its limitations, which imposes a cautious generalisation of the results obtained. The following are the most important.
The research sample, albeit sufficient for analysis, may not fully represent the general population because of the predominance of women and individuals with higher education among the respondents.
The application of self-descriptive measures of stress may introduce inaccuracies resulting from individual propensities for under- or over-estimating the declared stress level, depending on subjective perception and the influence of social norms.
The analysis does not allow for all potential variables impacting stress level, such as specific life developments, health, or income. This may affect the identification of stress-vulnerable social groups, because it is based on the variables and their interactions considered in the research.
Geographic limitations may influence the results, as the research was carried out in specific cities, which may not correspond to the stress levels or spatial features in other regions.
6. Conclusions
This research conveys information on social groups vulnerable to pandemic stress in cities, confirmed by real-world evidence, and makes it possible to indicate urban areas particularly exposed to pandemic stress. The main determinants of stress appeared to be gender and occupation. Pandemic stress was primarily associated with women, which is probably related to the roles expected of them (work, taking care of children, organizing children’s education, shopping, often taking care of parents, etc.). By occupation, those employed in tourism, culture, and entertainment, i.e., mainly in sectors that were affected by lockdowns, were found to be more sensitive to stress during the pandemic. Concentrations of stress-sensitive groups were found primarily in areas with high density and compact multi-family housing.
The results obtained allow for formulating recommendations for helping city authorities take measures to decrease vulnerability and build the resilience of post-pandemic cities to threats such as epidemics and pandemics.
During a health crisis, the cautious implementation of restrictions and lockdowns should be considered, which can be a serious source of stress for numerous social groups.
The resilience of cities and their inhabitants is also built by adopting specific policies and through the involvement of public means for interventions regarding healthcare (including psychological aspects of pandemic-related stress in various groups), city governance methods (the cautious introduction of restrictions generating an increase in residents’ stress levels, while considering gains and losses), and transformation of the urban structure. What particularly requires adaptation is places where residents’ stress level is higher, which mainly include city centres and densely built-up areas. One of such transformation possibilities is green infrastructure development within a city, reducing the stress of urban dwellers and allowing for fast recovery after stress, increasing, at the same time, city resilience to other risks (e.g., climate change).
Author Contributions
Conceptualisation: L.M.; methodology: L.M. and N.Z.; statistical analysis: N.Z.; formal analysis: N.Z.; investigation: L.M. and N.Z.; resources L.M. and N.Z.; writing manuscript: L.M. and N.Z.; visualisation: N.Z.; supervision: L.M. and N.Z.; project administration: L.M.; funding acquisition: L.M. All authors have read and agreed to the published version of the manuscript.
Funding
This research was funded in whole by the National Science Centre, Poland (no. 2021/41/B/HS4/02471). For the purpose of Open Access, the author has applied a CC-BY public copyright license to any Author Accepted Manuscript (AAM) version arising from this submission.
Institutional Review Board Statement
The conducted geo-survey research was approved by the Ethics Committee for Research Involving Human Participants at the Adam Mickiewicz University in Poznań (Resolution No. 18/2021/2022, 16 May 2022) for scientific research conducted with human participation.
Informed Consent Statement
Informed consent for participation was obtained from all subjects involved in the study.
Data Availability Statement
The raw data supporting the conclusions of this article will be made available by the authors on request.
Conflicts of Interest
The authors declare no conflicts of interest. The funders had no role in the design of the study; in the collection, analyses, or interpretation of data; in the writing of the manuscript; or in the decision to publish the results.
References
- Ellison, C.W.; Maynard, E.S. Stress and Urban Life. In Healing For the City: Counseling in the Urban Setting; WiPF and STOCK Publisher: Eugene, OR, USA, 1992; Chapter I. [Google Scholar]
- Adli, M. Urban Stress and Mental Health. Cities, Health and Well-Being, Hong Kong, 16–17 November 2011. Available online: https://urbanage.lsecities.net/essays/urban-stress-and-mental-health (accessed on 10 April 2025).
- Wang, K.; Manning, R.B., III; Bogart, K.R.; Adler, J.M.; Nario-Redmond, M.R.; Ostrove, J.M.; Lowe, S.R. Predicting depression and anxiety among adults with disabilities during the COVID-19 pandemic. Rehabil. Psychol. 2022, 67, 179. [Google Scholar] [CrossRef] [PubMed]
- Hagger, M.S.; Keech, J.J.; Hamilton, K. Managing Stress During the COVID-19 Pandemic and Beyond: Reappraisal and Mindset Approaches. Stress. Health 2020, 36, 396–401. [Google Scholar] [CrossRef] [PubMed]
- Talarowska, M.; Chodkiewicz, J.; Nawrocka, N.; Miniszewska, J.; Biliński, P. Mental Health and the SARS-CoV-2 Epidemic—Polish Research Study. Int. J. Environ. Res. Public Health 2020, 17, 7015. [Google Scholar] [CrossRef] [PubMed]
- Mierzejewska, L.; Sikorska-Podyma, K.; Szejnfeld, M.; Wdowicka, M.; Modrzewski, B.; Lechowska, E. The Role of Greenery in Stress Reduction among City Residents during the COVID-19 Pandemic. Int. J. Environ. Res. Public Health 2023, 20, 5832. [Google Scholar] [CrossRef]
- Mell, I.; Whitten, M. Access to nature in a post covid-19 world: Opportunities for green infrastructure financing, distribution and equitability in urban planning. Int. J. Environ. Res. Public Health 2021, 18, 1527. [Google Scholar] [CrossRef]
- Misheva, V.; Hristova, A.; Palm, F.; Nacheva, I.; Hopstadius, M.; Blasko, A. Framing the “Exceptions to the Rule” in Analyses of Responses to the First Wave of the COVID-19 Pandemic. In Crisis and the Culture of Fear and Anxiety in Contemporary Europe; Llena, C.Z., Stier, J., Gray, B., Eds.; Routledge: Abingdon, UK; New York, NY, USA, 2023; pp. 203–223. [Google Scholar]
- Bakalova, D.; Nacheva, I.; Panchelieva, T. Psychological Predictors of COVID-19-Related Anxiety in Vulnerable Groups. Eur. J. Investig. Health Psychol. Educ. 2023, 13, 1815–1830. [Google Scholar] [CrossRef]
- Shevlin, M.; McBride, O.; Murphy, J.; Miller, J.G.; Hartman, T.K.; Levita, L.; Mason, L.; Martinez, A.P.; McKay, R.; Stocks, T.V.A.; et al. Anxiety, depression, traumatic stress and COVID-19-related anxiety in the UK general population during the COVID-19 pandemic. BJPsych Open 2020, 6, e125. [Google Scholar] [CrossRef]
- Zhang, Y.; Bao, X.; Yan, J.; Miao, H.; Guo, C. Anxiety and depression in Chinese students during the COVID-19 pandemic: A meta-analysis. Front. Public Health 2021, 9, 697642. [Google Scholar] [CrossRef]
- Carvalho, P.O.; Hülsdünker, T.; Carson, F. The Impact of the COVID-19 Lockdown on European Students’ Negative Emo-tional Symptoms: A Systematic Review and Meta-Analysis. Behav. Sci. 2022, 12, 3. [Google Scholar] [CrossRef]
- Padmanabhanunni, A.; Pretorius, T.B.; Isaacs, S.A. We are Not Islands: The Role of Social Support in the Relationship between Perceived Stress during the COVID-19 Pandemic and Psychological Distress. Int. J. Environ. Res. Public Health 2023, 20, 3179. [Google Scholar] [CrossRef]
- Torales, J.; O’Higgins, M.; Castaldelli-Maia, J.M.; Ventriglio, A. The outbreak of COVID-19 coronavirus and its impact on global mental health. Int. J. Soc. Psychiatry 2020, 4, 317–320. [Google Scholar] [CrossRef] [PubMed]
- Kivimäki, M.; Nyberg, S.T.; Batty, G.D.; Fransson, E.I.; Heikkilä, K.; Alfredsson, L.; Bjorner, J.B.; Borritz, M.; Burr, H.; Casini, A.; et al. Job strain as a risk factor for coronary heart disease: A collaborative meta-analysis of individual participant data. Lancet 2012, 380, 1491–1497. [Google Scholar] [CrossRef] [PubMed]
- Ahola, A.J.; Harjutsalo, V.; Saraheimo, M.; Forsblom, C.; Groop, P.-H.; FinnDiane Study Group. Purchase of antidepressant agents by patients with type 1 diabetes is associated with increased mortality rates in women but not in men. Diabetologia 2011, 55, 73–79. [Google Scholar] [CrossRef]
- Kuo, M. How might contact with nature promote human health? Promising mechanisms and a possible central pathway. Front. Psychol. 2015, 6, 1093. [Google Scholar] [CrossRef] [PubMed]
- Magano, J.; Vidal, D.G.; Sousa, H.F.P.e.; Dinis, M.A.P.; Leite, Â. Psychological Factors Explaining Perceived Impact of COVID-19 on Travel. Eur. J. Investig. Health Psychol. Educ. 2021, 11, 1120–1133. [Google Scholar] [CrossRef]
- Walker, B.H.; Anderies, J.M.; Kinzig, A.P.; Ryan, P. Exploring resilience in social-ecological systems through comparative studies and theory development: Introduction to the special issue. Ecol. Soc. 2006, 11, 12. [Google Scholar] [CrossRef]
- Maunder, R.G.; Leszcz, M.; Savage, D.; Adam, M.A.; Peladeau, N.; Romano, D.; Rose, M.; Schulman, R.B. Applying the lessons of SARS to pandemic influenza: An evidence-based approach to mitigating the stress experienced by healthcare workers. Can. J. Public Health 2008, 99, 486–488. [Google Scholar] [CrossRef]
- Sheerin, C.M.; Lind, M.J.; Brown, E.A.; Gardner, C.O.; Kendler, K.S.; Amstadter, A.B. The impact of resilience and subsequent stressful life events on MDD and GAD. Depress. Anxiety 2018, 35, 140–147. [Google Scholar] [CrossRef]
- Barzilay, R.; Moore, T.M.; Greenberg, D.M.; DiDomenico, G.E.; Brown, L.A.; White, L.K.; Gur, R.C.; Gur, R.E. Resilience, COVID19-related stress, anxiety and depression during the pandemic in a large population enriched for healthcare providers. Transl. Psychiatry 2020, 10, 291. [Google Scholar] [CrossRef]
- Yıldırım, M.; Solmaz, F. COVID-19 burnout, COVID-19 stress and resilience: Initial psychometric properties of COVID-19 Burnout Scale. Death Stud. 2022, 46, 524–532. [Google Scholar] [CrossRef]
- Haileamlak, A. Pandemics Will be More Frequent. Ethiop. J. Health Sci. 2022, 32, 228. [Google Scholar] [CrossRef] [PubMed]
- Keyes, C.L.M. Risk and Resilience in Human Development: An Introduction. Res. Hum. Dev. 2004, 1, 223–227. [Google Scholar] [CrossRef]
- Chambers, R. Editorial Introduction: Vulnerability, Coping and Policy. IDS Bull. 1989, 20, 1–7. [Google Scholar] [CrossRef]
- Moser, O.N. The asset vulnerability framework: Reassessing urban poverty reduction strategies. World Dev. 1998, 26, 1–19. [Google Scholar] [CrossRef]
- Lancet, T. Redefining vulnerability in the era of COVID-19. Lancet 2020, 395, 1089. [Google Scholar] [CrossRef]
- Fiorillo, A.; Gorwood, P. The consequences of the COVID-19 pandemic on mental health and implications for clinical practice. Eur. Psychiatry 2020, 63, E32. [Google Scholar] [CrossRef]
- Connolly, C.; Ali, S.H.; Keil, R. On the relationships between COVID-19 and extended urbanization. Dialog-Hum. Geogr. 2020, 10, 213–216. [Google Scholar] [CrossRef]
- Qiao, M.; Huang, B. Assessment of community vulnerability during the COVID-19 pandemic: Hong Kong as a case study. Int. J. Appl. Earth Obs. Geoinf. 2022, 113, 103007. [Google Scholar] [CrossRef]
- Han, H.; Bai, X.; Costanza, R.; Dong, L. The effects of COVID-19 on the resilience of urban life in China. npj Urban Sustain. 2024, 4, 32. [Google Scholar] [CrossRef]
- Fu, L.; Wang, Z.; Zhu, Y.; Liang, B.; Qian, T.; Ma, H. Assessing the vulnerability of urban public health system based on a hybrid model. Front. Public Health 2025, 13, 1576214. [Google Scholar] [CrossRef]
- Rahman, M.S.; Paul, K.C.; Rahman, M.M.; Samuel, J.; Thill, J.-C.; Hossain, M.A.; Nawaz Ali, G.G.M. Pandemic vulnerability index of US cities: A hybrid knowledge-based and data-driven approach. Sustain. Cities Soc. 2023, 95, 104570. [Google Scholar] [CrossRef] [PubMed]
- UN-ISDR 2004. Living with Risk: A Global Review of Disaster Reduction Initiatives International Strategy for Disaster Reduction. Available online: http://www.unisdr.org/eng/about_isdr/bd-lwr-2004-eng.htm (accessed on 10 April 2025).
- Adger, N.; Brooks, N.; Bentham, G.; Agnew, M.; Eriksen, S. New Indicators of Vulnerability and Adaptive Capacity; Technical Report 7; Tyndall Center for Climate Change Research: Norwich, UK, 2004. [Google Scholar]
- Lalonde, M. A New Perspective on the Health of Canadians: A Working Document; Department of National Health and Welfare, 1974; Ottawa, ON, USA. 1981. Available online: http://www.phac-aspc.gc.ca/ph-sp/pdf/perspect-eng.pdf (accessed on 23 May 2023).
- House of Commons. Health and Social Care and Science and Technology Committees. Coronavirus: Lessons Learned to Date. Sixth Report of the Health and Social Care Committee and Third Report of the Science and Technology Committee of Session 2021–22. 21 September 2021; p. 32. Available online: https://committees.parliament.uk/publications/7496/documents/78687/default/ (accessed on 23 May 2023).
- Cianciara, D.; Szmigiel, A.; Pruszyński, J. Recovery from COVID-19 crisis in public health perspective. J. Educ. Health Sport 2022, 12, 933–949. [Google Scholar] [CrossRef]
- Ten Have, H.; Gordijn, B. Vulnerability in light of the COVID-19 crisis. Med. Health Care Philos. 2021, 24, 153–154. [Google Scholar] [CrossRef] [PubMed]
- Wirkner, J.; Christiansen, H.; Knaevelsrud, C.; Lüken, U.; Wurm, S.; Schneider, S.; Brakemeier, E.L. Mental health in times of the COVID-19 pandemic: Current knowledge and implications from a European perspective. Eur. Psychol. 2021, 26, 310–322. [Google Scholar] [CrossRef]
- Gualano, M.R.; Lo Moro, G.; Voglino, G.; Bert, F.; Siliquini, R. Effects of COVID-19 lockdown on mental health and sleep disturbances in Italy. Int. J. Environ. Res. Public Health 2020, 17, 4779. [Google Scholar] [CrossRef]
- Amerio, A.; Bertuccio, P.; Santi, F.; Bianchi, D.; Brambilla, A.; Morganti, A.; Odone, A.; Costanza, A.; Signorelli, C.; Aguglia, A.; et al. Gender differences in COVID-19 lockdown impact on mental health of undergraduate students. Front. Psychiatry 2022, 12, 813130. [Google Scholar] [CrossRef]
- Blix, I.; Birkeland, M.S.; Thoresen, S. Worry and mental health in the COVID-19 pandemic: Vulnerability factors in the general Norwegian population. BMC Public Health 2021, 21, 928. [Google Scholar] [CrossRef]
- Özdin, S.; Bayrak Özdin, S. Levels and predictors of anxiety, depression and health anxiety during COVID-19 pandemic in Turkish society: The importance of gender. Int. J. Soc. Psychiatry 2020, 66, 504–511. [Google Scholar] [CrossRef]
- Das, A.; Bruckner, T.; Saxena, S.; Alqunaibet, A.; Almudarra, S.; Herbst, C.H.; Alsukait, R.; El-Saharty, S.; Algwaizini, A. COVID-19 and Mental Health in Vulnerable Populations: A Narrative Review; Health, Nutrition and Population Discussion Paper; World Bank: Washington, DC, USA, 2021; Available online: http://hdl.handle.net/10986/35847 (accessed on 10 April 2025).
- Jankowski, P.; Czepkiewicz, M.; Młodkowski, M.; Zwoliński, Z. Geo-questionnaire: A method and tool for public preference elicitation in land use planning. Trans. GIS 2016, 20, 903–924. [Google Scholar] [CrossRef]
- Bąkowska, E.; Kaczmarek, T.; Mikuła, Ł. Wykorzystanie geoankiety jako narzędzia konsultacji społecznych w procesie planowania przestrzennego w aglomeracji poznańskiej. (The use of geo-questionnaire as a public consultation tool in the process or urban planning in Poznań Agglomeration). Rocz. Geomatyki 2017, 15, 147–158. [Google Scholar]
- Jankowski, P.; Kaczmarek, T.; Zwoliński, Z.; Bąkowska-Waldmann, E.; Brudka, C.; Czepkiewicz, M.; Młodkowski, M. Zastosowanie aplikacji geoankiety i geodyskusji w partycypacyjnym planowaniu przestrzennym: Dobre praktyki. (Application of Geosurvey and Geo-Discussion in Participatory Spatial Planning); Bogucki Wydawnictwo Naukowe: Poznań, Poland, 2018. [Google Scholar]
- Conover, W.J. Practical Nonparametric Statistics, 3rd ed.; Wiley: Hoboken, NJ, USA, 1999. [Google Scholar]
- Jaehn, P.; Fügemann, H.; Gödde, K.; Holmberg, C. Using Decision Tree Analysis to Identify Population Groups at Risk of Subjective Unmet Need for Assistance with Activities of Daily Living. BMC Geriatr. 2023, 23, 543. [Google Scholar] [CrossRef] [PubMed]
- Venkatasubramaniam, A.; Wolfson, J.; Mitchell, N.R.; Barnes, T.L.; JaKa, M.M.; French, S.A. Decision Trees in Epidemiological Research. Emerg. Themes Epidemiol. 2017, 14, 11. [Google Scholar] [CrossRef] [PubMed]
- Anselin, L. Local indicators of spatial association—LISA. Geogr. Anal. 1995, 27, 93–115. [Google Scholar] [CrossRef]
- Getis, A.; Ord, J.K. The analysis of spatial association by use of distance statistics. Geogr. Anal. 1992, 24, 189–206. [Google Scholar] [CrossRef]
- Kamenova, I.; Vladimirova, R.; Stoyanova, V. Influence of Socio-Demographic Factors on Perceived Stress in Outpatients with Depression and Anxiety in Remission During the COVID-19 Pandemic. Acta Medica Bulg. 2022, 49, 21–26. [Google Scholar] [CrossRef]
- Pieh, C.; Budimir, S.; Probst, T. The effect of age, gender, income, work, and physical activity on mental health during coronavirus disease (COVID-19) lockdown in Austria. J. Psychosom. Res. 2020, 136, 110186. [Google Scholar] [CrossRef]
- Kumra, E.; Patange, A. Ethnic, Socioeconomic, and Demographic Determinants of Generalized Anxiety Disorder and Fear of COVID-19 among Teenagers in California, United States: A Cross-Sectional Analysis. Front. Educ. 2025, 9, 1496137. [Google Scholar] [CrossRef]
- Udeogu, O.J.; Mimmack, K.J.; Gagliardi, G.; Burling, J.; Gatchel, J.R.; Quiroz, Y.T.; Donovan, N.J.; Amariglio, R.E.; Sperling, R.A.; A Marshall, G.; et al. Impact of Stress, Loneliness and Sociodemographic Factors on Psychological Well-Being During the COVID-19 Pandemic. Alzheimers Dement. 2023, 19, S18. [Google Scholar] [CrossRef]
- McGinty, E.E.; Presskreischer, R.; Anderson, K.E.; Han, H.; Barry, C.L. Psychological Distress and COVID-19–Related Stressors Reported in a Longitudinal Cohort of US Adults in April and July 2020. JAMA 2020, 324, 2555–2557. [Google Scholar] [CrossRef]
- Garfin, D.R.; Djokovic, L.; Silver, R.C.; Holman, E.A. Acute stress, worry, and impairment in health care and non-health care essential workers during the COVID-19 pandemic. Psychol. Trauma Theory Res. Pract. Policy 2022, 14, 1304–1313. [Google Scholar] [CrossRef]
- May, T.; Aughterson, H.; Fancourt, D.; Burton, A. “Stressed, Uncomfortable, Vulnerable, Neglected”: A Qualitative Study of the Psychological and Social Impact of the COVID-19 Pandemic on UK Frontline Keyworkers. BMJ Open 2021, 11, e050945. [Google Scholar] [CrossRef] [PubMed]
- Atlas, L.Y.; Farmer, C.; Shaw, J.S.; Gibbons, A.; Guinee, E.P.; Lossio-Ventura, J.A.; Ballard, E.D.; Ernst, M.; Japee, S.; Pereira, F.; et al. Dynamic effects of psychiatric vulnerability, loneliness and isolation on distress during the first year of the COVID-19 pandemic. Nat. Ment. Health 2025, 3, 199–211. [Google Scholar] [CrossRef] [PubMed]
- Thoi, P.T. Ho Chi Minh City- the front line against COVID-19 in Vietnam. City Soc. 2020, 32, 10–1111. [Google Scholar] [CrossRef] [PubMed]
- Sierra-Ortega, A.; González, A.; Fernández-Batalla, M.; Macario, E.; Diego, B.; Jimenez, M.; Santamaría-García, J. Community Vulnerability: Measuring the Health Situation of a Population After COVID-19 Through Electronic Health Record Indicators. Healthcare 2025, 13, 68. [Google Scholar] [CrossRef]
- Kunzmann, R.K. Smart Cities After COVID-19: Ten Narratives. disP—Plan. Rev. 2020, 56, 20–31. [Google Scholar] [CrossRef]
- Orford, S.; Fan, Y.; Hubbard, P. Urban public health emergencies and the COVID-19 pandemic. Part 1: Social and spatial inequalities in the COVID-city. Urban Stud. 2023, 60, 1329–1345. [Google Scholar] [CrossRef]

Disclaimer/Publisher’s Note: The statements, opinions and data contained in all publications are solely those of the individual author(s) and contributor(s) and not of MDPI and/or the editor(s). MDPI and/or the editor(s) disclaim responsibility for any injury to people or property resulting from any ideas, methods, instructions or products referred to in the content. |
© 2025 by the authors. Licensee MDPI, Basel, Switzerland. This article is an open access article distributed under the terms and conditions of the Creative Commons Attribution (CC BY) license (https://creativecommons.org/licenses/by/4.0/).