1. Introduction
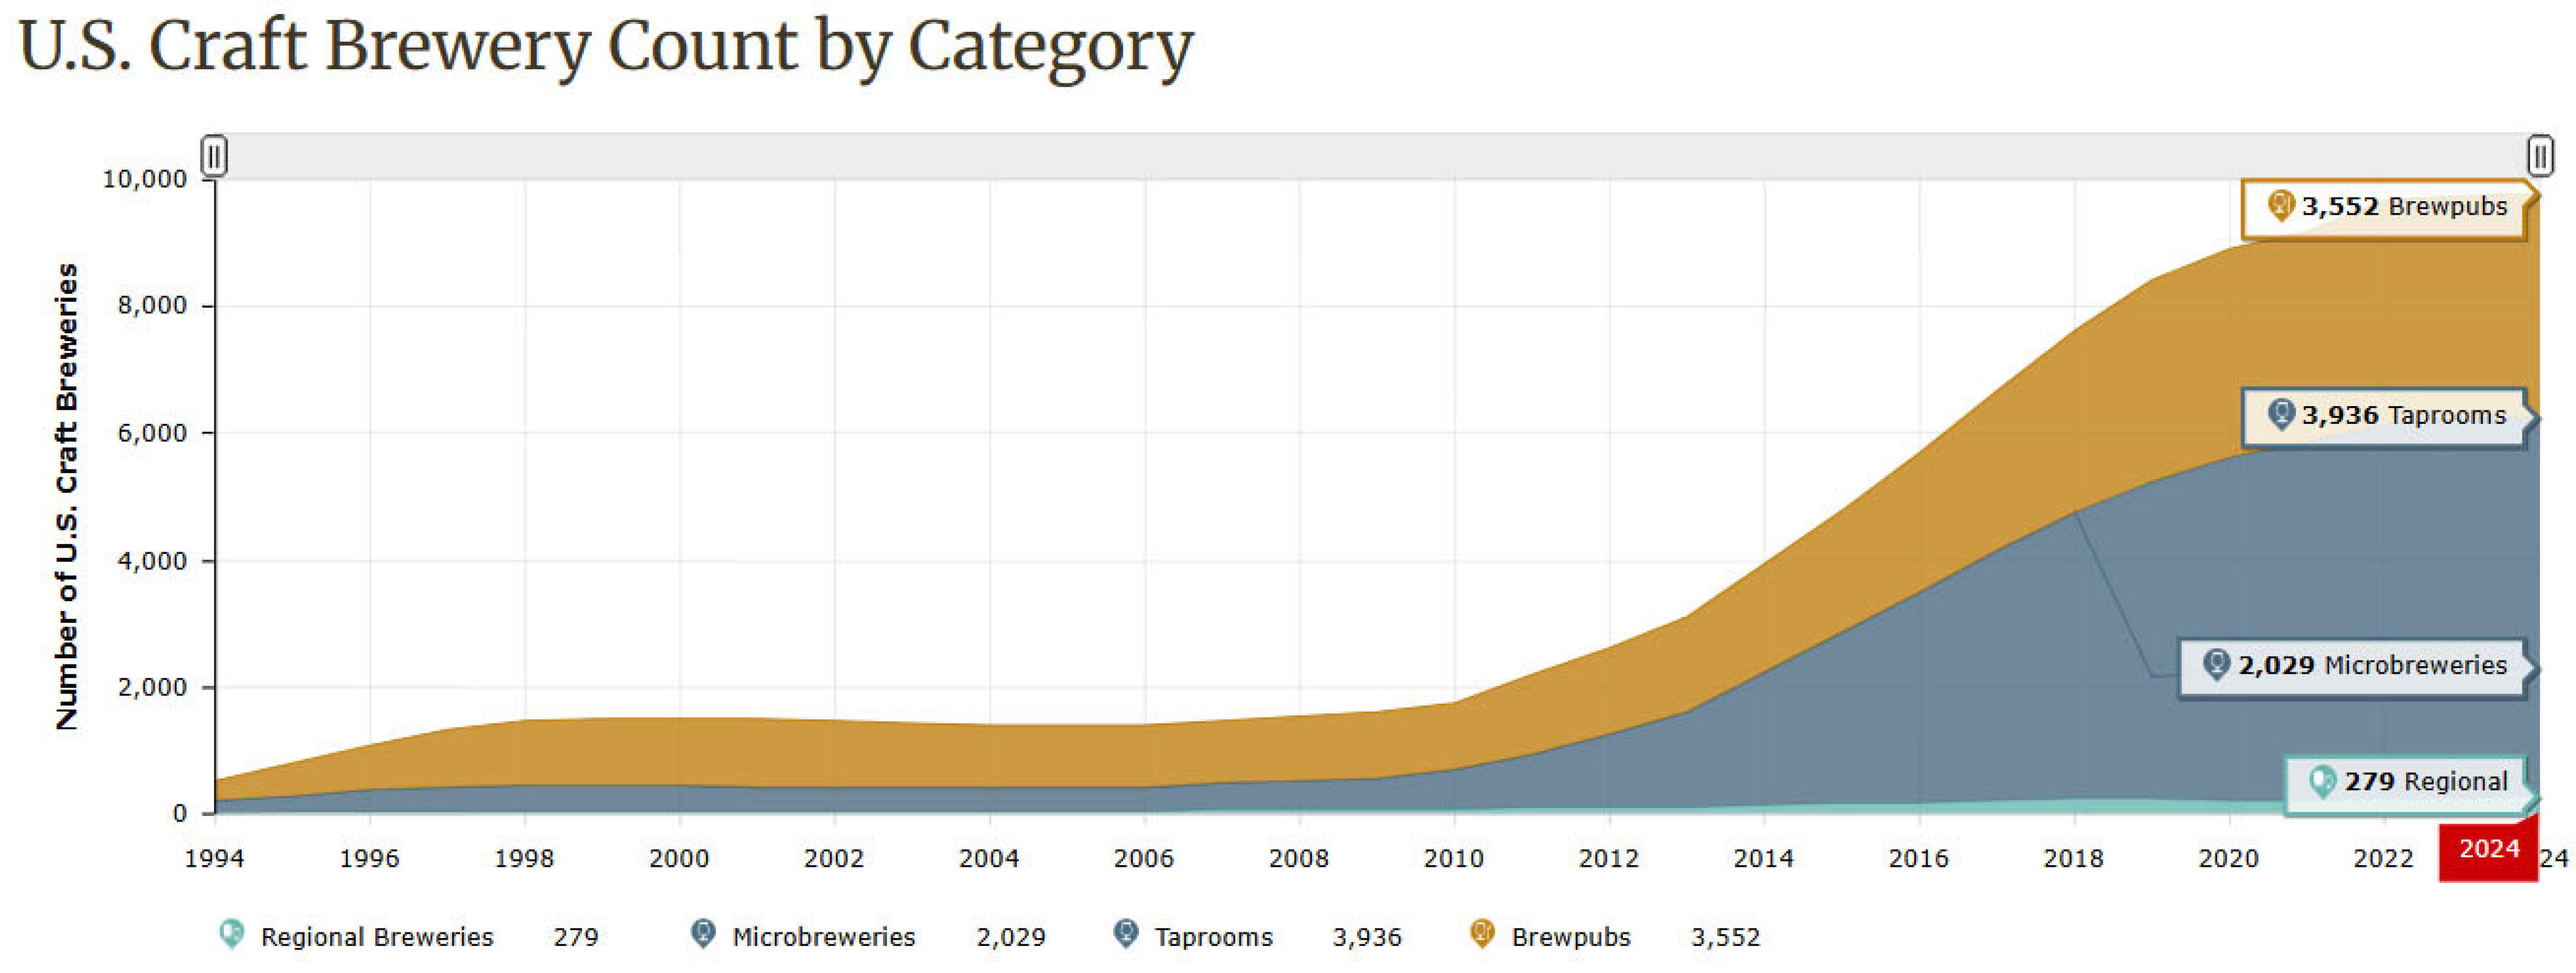
Beer is the most popular alcoholic beverage globally, with craft beer representing a growing segment of the market with significant economic impact. In the U.S. alone there were 9736 craft breweries as of December 2024, which employed 460,000 people and provided USD 77.1 billion to the U.S. economy (not including indirect jobs and revenue) [
1]. The national Brewers Association (BA) defines craft breweries as small businesses (with production of less than 6 million barrels per year) which are independently owned (less than 25% are owned or controlled by another alcohol company that is not focused on craft beer) [
2]. Craft breweries are typically committed to supporting their communities through philanthropy, volunteering, and hosting various events. The industry is very sustainability-minded, as reported in numerous studies [
3,
4,
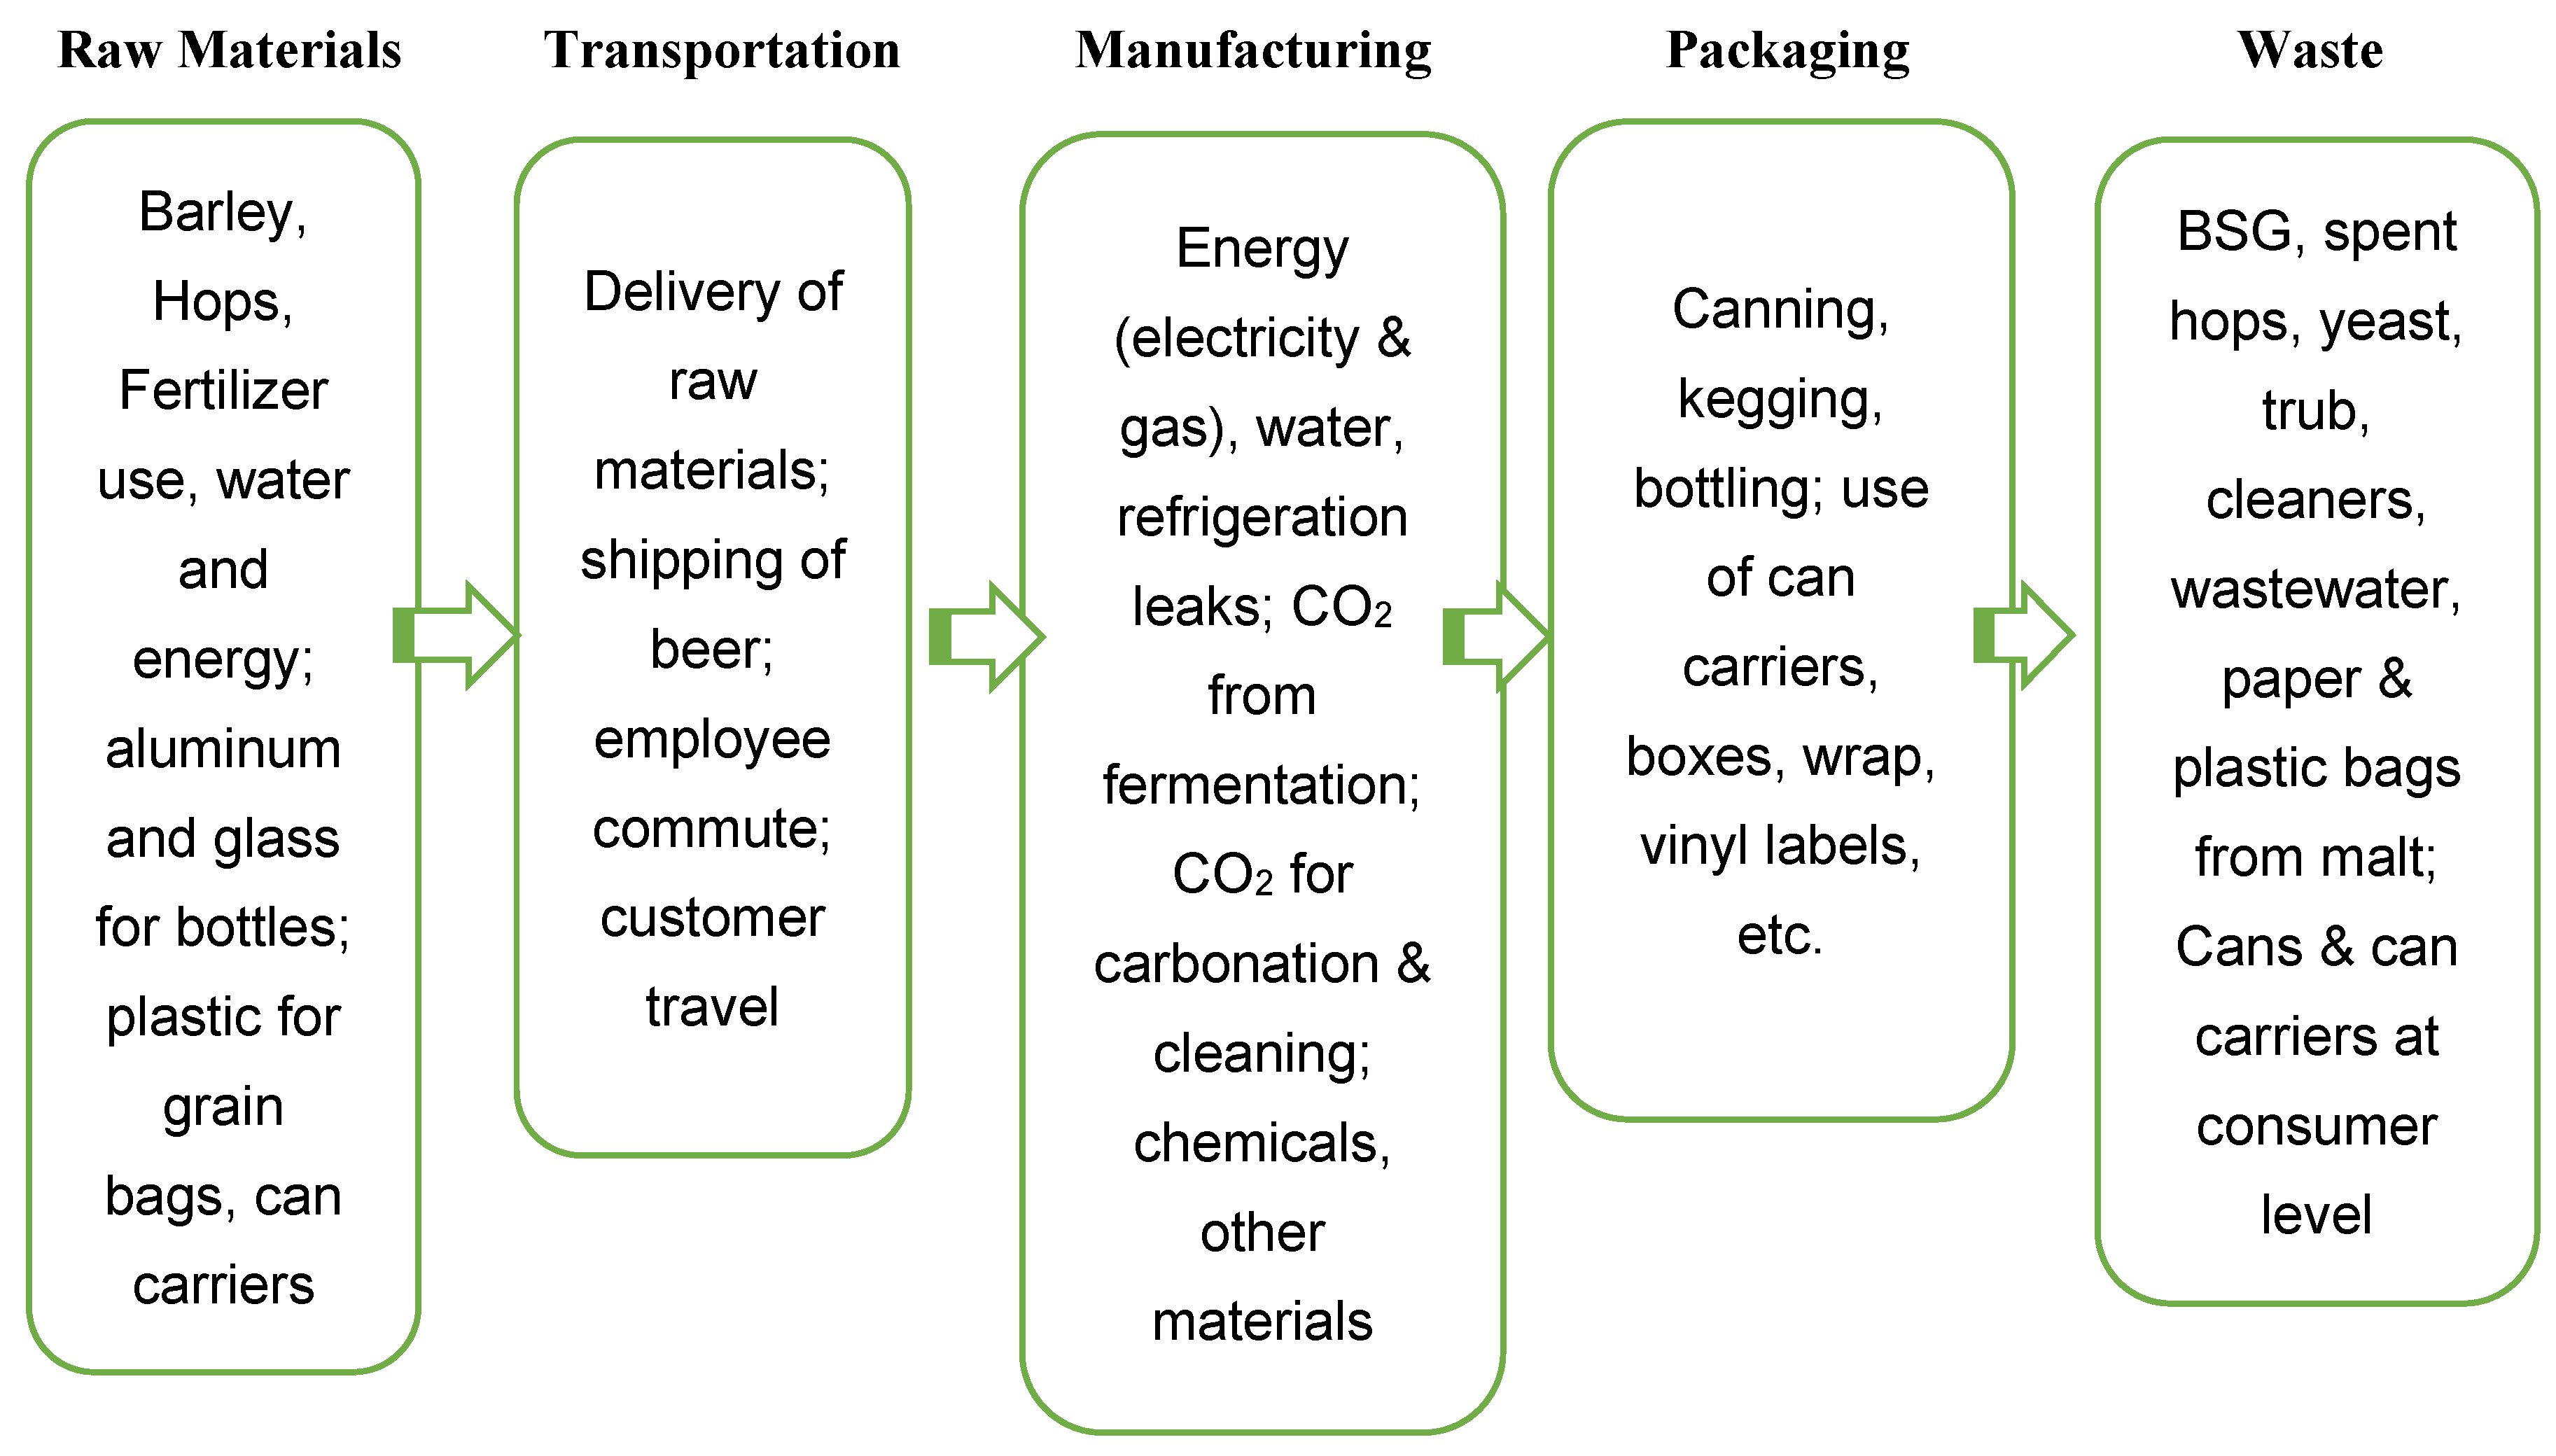
5]. At the same time, beer manufacturing is a water- and energy-intensive process, which generates both liquid and solid waste and uses toxic chemicals for cleaning and sanitizing. Smaller craft breweries with production of less than 1000 barrels per year (known as ‘microbreweries’) are significantly less efficient than larger breweries [
5,
6]. While their environmental impacts may seem small compared to large corporations, research has reported that small- and medium-size enterprises (SMEs) are responsible for about 60% of the carbon dioxide emissions and 70% of pollution globally [
7]. Craft breweries and SMEs in general have significant interest in improving their operational efficiency. Reducing the use of energy, water, chemicals, and waste can directly cut costs and improve profitability. However, they often lack time, resources, and knowledge about available opportunities [
5,
8].
Traditionally, SMEs have received less attention in sustainability technical assistance and funding, but this has begun to change in recent years. Since the COVID-19 pandemic, governments around the world have begun to enact major policies to support the financing of more sustainable economic development, including subsidies for renewable energy, electric vehicle (EV) deployment, and infrastructure upgrades. In the U.S. the Bipartisan Infrastructure Bill and the Inflation Reduction Act, for example, enabled the Environmental Protection Agency (EPA) to provide technical assistance to entire industries, including craft beer [
9]. Since 2022, several New England states, including Massachusetts, have received EPA funding to provide free pollution prevention (P2) technical assistance to craft breweries. The work has involved many stakeholders to support the industry’s sustainability transition, including state and federal policy makers, the national Brewers Association, state brewers’ guilds, universities, and other partners along the value chain. This collaboration led to the launch of BetterBev in March 2024, a new technical assistance and recognition program for craft beverage manufacturers to promote the greater adoption of environmental sustainability practices [
10]. While research and academic studies about the industry have been growing, there is still a gap in measuring the specific
outcomes and
impacts (environmental and business) of P2 technical assistance and recognition programs [
7,
11,
12,
13]. Measuring these, however, is critically important for communicating success, scaling up best practices and devising effective policies for industry sustainability transformation.
The main goal of this paper is to examine the effectiveness of the new BetterBev technical assistance and recognition program in helping overcome key barriers and promoting P2 and environmental sustainability practices among craft breweries. The authors explore the following questions: How do technical assistance and recognition help overcome key barriers and influence P2/sustainability adoption? What specific P2/sustainability practices are most and least likely to be adopted by craft breweries receiving technical assistance, and why? What are the outcomes and impacts (environmental and business) of the implemented P2 practices? This study is based on 29 craft breweries in Massachusetts, U.S. Data was collected between November 2022 and March 2025 and included site visits; interviews with owners, founders, and head brewers; online research; and assessments of eight impact categories. Each participating brewery was provided with a detailed assessment and P2 recommendations. Approximately a year after the initial assessment, the research team followed up with each participant to determine which P2 recommendations were adopted and which were not, and measured the resulting impacts.
This paper’s main contribution is providing empirical data about the effectiveness of technical assistance and recognition programs in promoting the adoption of P2 and sustainability by SMEs in a single sector (craft beer). In addition, it contributes to the literature about the factors driving craft breweries’ decisions of whether or not to adopt different P2/sustainability practices. The paper is organized as follows: It begins with a literature review, followed by a description of the study design and methods for conducting the research. Next, the key findings from the study are presented, followed by a discussion and a presentation of the implications for future research, policy, and practice. The paper concludes by highlighting the research limitations, main contributions, and future prospects.
3. Study Design and Methods
This study examines the impact of the new BetterBev technical assistance and recognition program on advancing the adoption of P2/environmental sustainability practices by Massachusetts craft breweries. In Fall 2022 the research team recruited 29 craft breweries to participate in the project. All participants were offered free P2/sustainability technical assistance by the project team, which included a project manager with industry experience, three graduate assistants, and several other organizations providing free environmental assistance to SMEs in Massachusetts. The latter included the Center for EcoTechnology (CET), the Toxics Use Reduction Institute (TURI), and the Massachusetts Industrial Assessment Center (IAC) [
44]. The TA included onsite consultations and assessments, training through webinars and industry presentations (e.g., at the New England Brew Summit, MBG meetings, and the BA annual conference), help with sustainability benchmarking utilizing the BA tools, estimating the Return on Investment (ROI) on various technologies, developing best practices guides, and helping with grant applications and research on local, state, and federal environmental incentives.
Participants demonstrating strong environmental commitments and practices were also eligible to be recognized as a ‘green’ brewery by a newly launched BetterBev recognition program [
10]. Ten of the twenty-nine participating breweries (34%) were microbreweries with production of less than 1000 bbl/year, three breweries had production over 10,000 barrels/year, and the rest produced between 1000 and 10,000 bbl/year. The project included site visits, interviews with founders and master brewers, online research, and the assessment of their P2/sustainability performance in eight categories of impacts: raw materials, water use, wastewater reduction, energy and emissions, cleaning and sanitizing, solid waste, packaging and materials, and environmental culture. The team used an assessment checklist developed after extensive research of craft beer publications and recognition programs, consultation with two craft brewery founders, and several environmental experts.
Table 2 presents the main categories of the assessment and some specific P2 measures that were evaluated within each category. Eight facilities received assistance in benchmarking their environmental performance using the BA sustainability tool (the breweries provided their utility bills and graduate students involved in the project received training from the BA and performed the benchmarking). Eight breweries were provided with a detailed assessment and the ROI for installing solar panels, one brewery was provided with the ROI for ordering pre-printed cans, and another one was provided with the ROI for switching from grain bags to super sacks to reduce environmental impacts and costs.
Data for each brewery was collected between November 2022 and March 2025. After the site visit and assessment, each participating brewery was provided with a detailed report highlighting its strengths and weaknesses and offering concrete P2/sustainability recommendations. Approximately a year after the initial assessment, the research team began to follow up with each participating brewery to find out which P2 recommendations were adopted, which were not adopted and why, and to measure the resulting outcomes and impacts. All follow-up data and information were recorded using a standardized debrief form. Environmental reductions were estimated using an EPA facility reporting spreadsheet, GHG equivalency calculators [
45], and other available online calculators for waste, wastewater, and packaging. The qualitative data was managed through cross-case analyses using the methodology described in [
46]. All collected data and information were aggregated and summarized in a table format to enable further analysis. To protect any confidential information, the names of the participating breweries were removed from the final tables with the results. To ensure validity and reliability of the data, the results were independently verified by both authors and triangulated with secondary data from breweries’ websites, social media sites, and BA data.
4. Results
Table 3 summarizes the TA and recognition program results as of March 2025 (or about two years after the initial assessments and recommendations provided to participants). The energy category was divided into two sub-categories for the analysis: (a) energy efficiency and CO
2 reduction in operations, and (b) renewable energy. Twenty-three of the twenty-nine participating facilities had implemented 60 P2/sustainability practices as of March 2025. Participants also expressed interest in adopting an additional 25 practices over the next few years (included in parentheses in the table). Seven participating breweries had closed, merged with another brewery, or were acquired as of March 2025 (as noted in
Table 3). Five of the six breweries that did not adopt any P2/sustainability practices had closed their facility during the study period.
Results in
Table 3 reveal that Massachusetts craft breweries implemented most of their P2 actions in the category of ‘energy and emissions’ (14 in total, of which 4 related to clean energy adoption), followed by preventing packaging waste (13) and local sourcing and environmental culture (9 each). Reducing water use, wastewater prevention, and the adoption of safer chemicals were the impact categories with the lowest number of reported P2 actions (1, 3, and 4, respectively). When asked about their plans, Massachusetts craft breweries were most interested in adopting renewable energy practices (reported by 12 participants), followed by energy efficiency and CO
2 reduction, and safer chemicals (4 each).
4.1. Energy and Emissions
Excluding labor, energy is typically the most expensive input for Massachusetts craft breweries, as the state has the second-highest electricity rate in the nation—31.22 cents/kWh in December 2024 [
47]. In addition, craft breweries use significant amounts of energy for boiling, cleaning, packaging, and cooling. Energy efficiency practices typically have a short payback period, and numerous state and federal incentives are available to businesses. The shortages of CO
2 during the COVID-19 pandemic and the increasing cost are also factors behind breweries’ interest in seeking alternatives, such as using nitrogen for cleaning instead of CO
2, or capturing CO
2 from fermentation to utilize it in beer carbonation (through spunding valves or CO
2 recovery systems).
Ten participating breweries adopted various P2 actions to reduce energy use and purchased CO2 for cleaning and carbonation. As part of the TA, several participating facilities were provided with free energy audits by partner organizations such as the Center for EcoTechnology and RISE Engineering (paid by local utility companies Eversource Energy and National Grid). The audits identified P2 opportunities for improving insulation, installing LED lights, and refrigerator curtains. Following up on recommendations from the conducted energy audit, facility #19 installed destratification ceiling fans and removed space heaters to improve energy efficiency. This P2 action led to a 68% decline in their electricity use, which was estimated to save the facility about USD 1180 annually and prevent 2.7 MTCO2e in the first year alone. In some cases, upfront costs prevented breweries from implementing efficiency initiatives. As one participant shared, “We would consider improving insulation as time, personnel, and financial resources allow.”
The process of fermentation when making craft beer releases CO
2. While the amounts can vary depending on how long the process is, the alcohol rating, and the ingredients used, research has reported that each barrel of wort can produce, on average, 10 pounds of CO
2 [
48]. At the same time, craft breweries purchase CO
2 to carbonate their beer. A P2 practice adopted by several participants included installing spunding valves on fermentation barrels that capture and return the CO
2 for follow-up fermentation. Such a practice is low-cost and can lead not only to cost savings (by reducing the amount of CO
2 to purchase) and reduced GHG emissions but also reduces business risks from supply chain disruptions, such as during the COVID-19 pandemic. The facility #8 operations manager shared the following: “
We have started utilizing spunding valves on lagers, and on some of our ales, to retain as much natural carbonation as possible. I estimate it has decreased our purchased CO2 use by about 3% on all beers we’ve used them on, which represent about 30% of our total production.” Using an average cost of 55 cents per pound of CO
2, the research team estimated that the brewery saved USD 343 and prevented 0.283 MTCO
2e during the first year after adoption.
Another P2/sustainability strategy to reduce CO2 use and costs is switching to nitrogen for pushing beer and cleaning. Two participants adopted such a strategy after the provided TA. Facility #27 shared that their CO2 usage has been reduced after they installed a nitrogen tank and began using nitrogen gas in place of CO2 for cleaning and purging kegs and fermentation tanks. Facility #11 also switched to using nitrogen for cleaning, although no data was available as of April 2025 to estimate the savings. The brewery co-founder shared, “We are using now nitrogen for canning and pushing beer, so I estimate a 10% to 15% decrease in CO2 but wanted to give it a few more months to calculate the reduction. Not a huge increase in savings and decrease in CO2 usage but every bit helps.”
Thanks to declining costs and generous incentives from the 2022 Inflation Reduction Act and the 2021 Bipartisan Infrastructure and Jobs Act [
9], the case for adopting renewable energy has become especially strong in the last few years. (This, however, could change as result of the Trump Administration’s rollback of numerous environmental initiatives.) As one of the leading states for energy efficiency and renewable energy policies, Massachusetts has offered additional incentives for businesses to reduce GHG emissions and costs, such as rebates, tax credits, net metering credits, and low-cost financing. Nearly all breweries that owned their facilities were interested in installing solar panels. Brewery #26 leveraged the TA provided by MA Industrial Assessment Center (IAC), a partner in the project, to apply for and secure a Department of Energy (DOE) matching grant of USD 100,000 to install a 150 kWh solar array on the roof of its manufacturing facility. As a result, the brewery was expected to save over USD 28,000 annually on electricity costs and prevent about 66 MTCO
2e. In early 2025, it began working with the Connecticut IAC, aiming to secure another DOE grant to increase its PV array to 500 kWh, which would cover 50% of its electricity use. During the follow-up meetings another participating brewery (facility #24) shared, “
We are definitely interested in solar array now that we own the building and if we can make the finances work with incentives, grants, etc.”
Massachusetts breweries that do not own their buildings can utilize community solar or municipal aggregation offerings to source renewable energy, reducing costs and GHG emissions. In 2024, Massachusetts customers, including craft breweries, were able to save between 10% and 20% on average by switching to community solar [
49,
50]. Furthermore, municipalities can often offer lower rates to local businesses and homes based on 100 percent renewable energy. As a result of the provided TA, brewery #20 realized that its town was offering 100% renewable energy at 8 cents/kWh less than what they were paying through the end of 2024. They were also able to deduct 3.7 cents/kWh for RECs (Renewable Energy Credits, federally tax-deductible). Without having to change their utility company or open a new account, the brewery was able to source all its electricity from renewables and save about USD 748 annually. (These savings may change in the future as municipal rates are typically re-negotiated every year. In addition, the federal REC deduction could be eliminated by the Trump Administration.)
4.2. Packaging
Packaging of beer is associated with a significant amount of waste and related GHG emissions (e.g., from canning and the use of can carriers, labels, cardboard boxes for shipping, and transportation). Since the majority of study participants were small breweries, most of their beer was sold as draft which is the most environmentally preferred P2 practice as it eliminates the need for packaging [
51]. Many breweries sold beer in refillable kegs and nearly all sold their beer locally (which reduces GHG emissions from long-distance transportation). All packaged beer was sold in aluminum cans, a more sustainable packaging option than single-use glass bottles [
4,
22,
23,
51].
The most popular P2/sustainability action to prevent packaging waste as result of the TA was the adoption of can carrier take-back programs. As of March 2025, 13 of the 29 participating breweries had such a program in place, where consumers could return can carriers for reuse. This sustainability strategy was easy to implement, did not include any upfront costs, and generated both environmental and business benefits. For example, facility #28 avoided purchasing over 25,000 can carriers during the first year after implementing the P2 action, which was estimated to have prevented the use of 800 pounds #2 HDPE plastic and the generation of 0.57 MTCO2e emissions. It also saved the brewery around USD 4200 annually and helped engage customers and demonstrate their sustainability commitments. The implementation of this P2 practice required approximately 3 h of weekly labor for taproom workers, but no initial cost or additional wages to be paid. Since all collected can carriers were washed in the dishwasher, there was some increase in the water and electricity use, which were not reflected in the estimated financial and environmental savings.
Another practice to prevent plastic packaging waste is switching to biodegradable can carriers. Facility #21 had implemented E6PR biodegradable can carriers [
52] prior to participating in the program. Made of fiber byproducts and other compostable materials, biodegradable can carriers are often seen as more sustainable alternative to traditional, hard-to-recycle plastic can carriers. However, a couple of participants in the program raised concerns about the potential contamination of such can carriers with PFAS, a major problem in the U.S. in recent years due to their toxic environmental and health impacts and growing water and soil contamination [
53]. Moreover, to reduce waste and GHG emissions, such can carriers must be composted. If disposed of in the trash, they could generate methane, a gas 25 times more potent than CO
2 (though methane has much shorter life-span of 7–12 years, compared to CO
2 which can last for centuries (for more details about how to compare the climate impacts of CO
2 and methane, please see:
https://climate.mit.edu/ask-mit/why-do-we-compare-methane-carbon-dioxide-over-100-year-timeframe-are-we-underrating, accessed on 13 May 2025).
4.3. Local Sourcing
Local sourcing of grain (malted or unmalted), hops, and yeast can reduce the environmental impacts of transportation, especially GHG emissions and hazardous air pollutants from diesel trucks. Such sourcing also helps support local farmers [
11] and reduce supply chain risks. On the other hand, local ingredients may be more expensive, or of insufficient quantities for larger craft breweries’ needs. In addition, some research has found that local barley and hops producers may be less efficient in their operations, thus having a larger carbon footprint per ton of raw materials than larger producers [
54]. The quality of imported raw ingredients, especially hops from Germany, tends to be superior, which is of paramount importance to many craft breweries.
Nine of the twenty-nine participants sourced at least some local malt or grain, with the majority offering a special beer with local ingredients. Three more participants planned to source more local ingredients in the future. While some have found the quality to be good, others resist local sourcing due to concerns about quality and cost. “
We can’t afford any price increases”, shared one brewery; “
we would love to order locally but it is pricey”, shared another participant. A third one pointed out a bad experience with local hops ten years earlier. For some breweries, “
the convenience of ordering from one vendor” prevents them from sourcing locally. On the other hand, the quality of local ingredients is improving, and prices are declining due to initiatives such as The Northeast Grainshed Alliance [
55]. As one of the participants shared, “
I’ve actually been increasingly impressed with local malts and hops. So much so that I am currently planning an entire new line of beers using 100% New England grown/produced ingredients!” While the prices of local or regional suppliers of hops and malt are typically higher, many Massachusetts craft breweries are committed to supporting local producers such as Four Star Farms (the largest supplier of hops in Massachusetts) and local farmers and maltsters. As facility #28 shared in the follow-up assessment, “
In 2023 we brewed a few batches with 100% Valley Malt. Tentatively we will brew something similar in spring 2024, highlighting local malt, and roll out the brand to include a pop up from our farmer who receives 100% of our spent grain.”
4.4. Solid Waste Prevention
The largest source of waste for craft breweries is brewers’ spent grain (BSG), representing about 85% of all waste by weight [
56]. Discarded BSG can pollute water, soil, and air (in the case of waste incineration) and thus negatively impact the environment and human health. Disposal of BSG also represents a significant cost for brewers. In Massachusetts, where the disposal of organic waste is banned [
57], breweries typically have three main options to manage BSG: (a) send it for composting, where they typically pay by weight; (b) send it to local farms for animal feed (a zero-cost or revenue-generating option where farmers pick up the BSG from the property and may even pay for it); and (c) provide it to startups for upcycling into higher value products such as flour, dog biscuits, and energy bars for human consumption [
5,
28,
58,
59]. The study found that the most common method to manage BSG by the participating breweries was to provide it to local animal farms for feed, with just a few sending for composting, anaerobic digestion, or upcycling.
While this is not a P2 action, it still prevents pollution and GHG emissions (when transported locally for animal consumption).
Other sources of solid waste in a brewery include single-use cups and cutlery for serving water and food, single-use stretch wrap, grain bags and paper towels in the bathrooms, among others. Seven participating breweries adopted some waste prevention practices after the provided TA. As one participant shared, “
We have replaced several single-use food service items with reusables and plan to do more in that realm. In all, we avoided 310 pounds of plastic use.” With the help of a USD 3000 Reduce, Reuse and Repair Micro-Grant from the Massachusetts Department of Environmental Protection [
57], recommended by the TA team, facility #28 decided to pilot reusable stretch wrap for securing canned or kegged pallets of beer for distribution. After a brief trial and error period for learning how to properly apply it, the brewery found that for internal moves, a reusable wrap worked as well as or better than disposable stretch wrap, required no additional time or labor, and proved to be suitably durable and bring cost savings. Before making the switch, the brewery spent USD 212 annually on disposable stretch wrap. By investing USD 170 for one full size and one half size Re-USA-Wrap [
60], the investment paid for itself in under a year, or approximately 60 uses. (A typical box of reusable wrap purchased by facility #28 contained 1500 feet of stretch wrap, weighed 10 pounds, and cost USD 20 in 2024. Each use required 110 feet of stretch wrap (wrapping a pallet of canned or kegged beer).) This sustainability initiative also prevented the use of 16,000 feet, or 106 pounds, of stretch wrap which cannot be recycled and typically ends up in the trash. Distribution use appears more challenging due to the complexity of third-party delivery logistics but could prove beneficial for distribution companies willing to pilot the strategy.
4.5. Reducing Water Use
Water represents 90% of the weight of beer and is used in large quantities in the brewing process for boiling, cooling, and cleaning. It is also expensive in Massachusetts, where the 2025 rates for 1000 gallons of water ranged between USD 9.12 and USD 12.4 (with sewer costs representing an additional USD 8.85 to USD 16.7 per 1000 gallons) [
61]. Improvements in breweries’ efficiency through water reuse or closed loop systems for cleaning, the installation of high-pressure low-flow spray nozzles, the use of low-flow aerators, and other strategies can reduce the environmental impacts and brewery costs. Many Massachusetts breweries had already implemented such low-cost strategies prior to the TA. A more expensive P2 option is to switch to using ionized air rinsing systems for can cleaning, which further helps reduce water use and costs [
11]. This sustainability practice, however, increases energy use and requires space and upfront investment. As one participating brewery shared, “
Ionized air rinsing would require capital expenditure that we don’t have.” One reported new practice for reducing water use after the TA involved installing low-flow, high-pressure nozzles and aerators in facility #28. As their head brewer and sustainability lead shared, “All of our spray nozzles are now high-pressure, and all sinks have aerators. Our water-to-beer ratio improved from 4.2 to 1 to 3.5 to 1. That’s an annual savings of 60,760 gallons (364,560 in 2022 versus 303,800 in 2023
).”
4.6. Wastewater Reduction
Craft beer manufacturing releases significant amounts of wastewater. Research has estimated that 3–10 L of waste effluent are discharged for every liter of beer produced (or 3–10 gal of effluent for each gallon of beer) [
11,
62]. Some strategies to reduce wastewater include side streaming yeast, hops, and trub for off-site disposal (e.g., by sending to an anaerobic digester or composting); installing wastewater pre-treatment on-site; or reusing wastewater. Three participating breweries adopted sustainability practices to reduce wastewater as result of the provided TA. In all three cases, the breweries began side streaming hops, yeast, and trub from their wastewater and sending it for composting. While this practice increased their costs, they believed it was important to protect local water quality. The majority of participating breweries, however, were not considering adopting wastewater reduction practices in the future due to the lack of mandates. “
We are not required by the Massachusetts Water Resource Authority (MWRA) or the municipality to treat wastewater and such practice would require additional infrastructure/storage tanks as well as hauling cost”, shared one brewery. “
This isn’t required by our wastewater treatment facility and would be a heavy lift”, explained another study participant. Larger breweries in regions with less advanced wastewater treatment may be under more pressure to reduce wastewater and thus more likely to adopt such sustainability practices.
4.7. Switching to Safer Chemicals for Cleaning and Sanitizing
The cleaning and sanitizing processes at craft breweries typically use chemicals such as Powdered Brewers Wash (PBW), Veracity Caustic Cleaner (Veracity), Liquid Metal Safe (LMS), and Star San, which can create risks to workers and air and water quality [
63]. These chemicals also increase a beer’s carbon footprint as result of their manufacturing, transportation, packaging, and treatment (when discharged with the wastewater). They can expose brewery employees to health and safety hazards if not following safety procedures. To reduce the negative impacts on sewer pipes and meet state mandates for pH levels, many breweries dilute the chemicals before disposing, which increases their water use and costs. The Toxics Use Reduction Institute (TURI) in Massachusetts has been supporting the industry through the testing of safer alternatives which meet industry quality standards and help reduce breweries’ environmental impacts and improve worker safety [
63]. As part of the TA, TURI conducted three quick reviews and two onsite assessments at participating facilities and provided recommendations for safer alternatives. In March 2025, as part of the provided TA, the research team, including a TURI representative, conducted bench testing at facility #20 of a new safer cleaner—Virdivis
TM [
64]. A 2024 survey of New England breweries found that two out of three craft breweries (67%) were interested in using safer/greener chemicals for cleaning and sanitizing [
5]. Yet, just four of the study participants adopted a safer cleaner or sanitizer after the TA, with four more reporting interest in such a practice in the future. The majority of participants appeared hesitant to make the switch due to concerns about effectiveness, cost, and process disruptions (see
Table 4).
4.8. Environmental Culture
While not directly considered an ‘impact category’, having a strong environmental culture is important for educating employees, customers, and other stakeholders, supporting sustainability initiatives and promoting continuous improvement. Many participating breweries had established collaborations with environmental groups for various events; one was recognized as B-Corp (B-Corp is a third-party sustainability certification, which evaluates a company’s positive impact on the environment, employees, and the society; for more information, see
https://www.bcorporation.net/en-us/certification/, accessed on May 13, 2025) (facility #21) and two were employee-owned (facilities #10 and #21). With assistance from the TA team, eight breweries used the BA sustainability benchmarking tool to assess their performance and compare themselves to peers. One brewery (facility #20) began publishing its annual sustainability report. This study found that few breweries were including environmental sustainability information about their initiatives or BetterBev recognition on their websites or social media sites. Previous research has reported similar communication gaps [
5,
65], although it is unclear whether it is due to the lack of time and resources, concerns of being accused of ‘greenwashing’, or something else.
5. Discussion
The current study aimed to examine the effectiveness of a TA and recognition program in promoting P2/sustainability practices among craft breweries in Massachusetts. It also sought to understand the factors behind craft brewers’ decision of whether or not to adopt specific P2/sustainability strategies. The research found that the provided TA was
highly effective in encouraging participants to adopt new P2/sustainability practices (a total of 60 new P2/sustainability practices were adopted by the 29 participants over a two-year period). Participants also planned to implement an additional 25 recommended P2/sustainability practices over the next few years. The provided TA helped overcome the main barriers to adopting P2/sustainability by craft breweries reported in the literature—the lack of resources, time, and knowledge about available opportunities [
3,
4,
5,
23,
66]. While many craft breweries have implemented some environmental actions, most lack an environmental plan or a strategy, a finding reported by Rosburg & Grebitus [
3]. Technical assistance can help craft breweries (and SMEs in general) identify their strengths and opportunities, and thus develop an environmental plan of action. This finding aligns with insights from a study of Iowa breweries, where the authors identified the lack of time as a major impediment to conducting sustainability benchmarking and environmental improvements [
3]. As one participating brewery shared, “
Working with the BetterBev Green Beverage Recognition program gave us insight into what we were already doing well and directed us down a path towards being even better stewards of the planet. The UMass Boston team helped us make a few easy, low-cost changes to decrease our environmental impact and identified some bigger changes that we are looking to implement in the future” [
10]. Another participant shared, “
The BetterBev initiative has enabled our brewery to continue and expand our focus on all aspects of sustainability in our operations. We are proud to have been recognized for our successes to date and understand that there is still work to do to improve. We embrace the sustainability challenge.” And a third brewery commented, “
Sustainability and environmental responsibility have always been integral to our brewery. Since the beginning we have been striving to implement best practices that have helped us conserve water, energy and CO2. Partnering with the BetterBev Green Beverage Recognition program has helped us reach efficiency goals, implement new best practices, and be a part of like-minded breweries working to minimize our environmental footprint in various ways” [
10].
Onsite visits and assessments were of the greatest value to participants, as these provided direct assistance in conducting benchmarking, energy audits, identifying state and federal incentives, and helping uncover facility-specific opportunities as well as estimating the ROI for a green technology. Such an onsite TA, however, is costly and difficult to scale up.
Industry presentations, webinars, and online resources can also be effective strategies for delivering TA. For instance, a research team member gave presentation to a group of craft breweries at the Kentucky Brewers Guild annual educational conference in February 2025. After the presentation, several breweries shared that they will begin to implement can carrier take-back programs, and one brewery reached out to the inventors of a new safer cleaner (Virdivis
TM) to obtain samples to test at their facilities (Virdivis
TM was recommended during the presentation as a safer cleaner which also helps reduce water use). This finding aligns with previous research which found that “targeted efforts by national and state entities to foster sustainable brewing are positively correlated with basic measures of sustainability adoption” (p. 2967, [
3]).
Craft brewers often collaborate and learn from each other. State brewers’ guilds and the national Brewers Association provide sustainability resources for the industry and are a trusted and relied-upon source of information for craft breweries. For more than a decade, the Brewers Association has provided free sustainability benchmarking tools, reports, and other publications for members. The MBG has an online resource center for craft breweries and was a key partner in the project by helping recruit participants, co-host P2/sustainability webinars, and promote developed best practices guides on its website. Developing
partnerships with such industry groups is crucial for raising awareness about available P2/sustainability opportunities and scaling up the program, a finding which confirms previous research by Embry [
37] and Rosburg & Grebitus [
3]. In fact, Embry [
3] concludes that “establishing a standard practice in the industry is a key way to advance a sustainable practice that does not require changes in equipment or behavior”.
The area where MA breweries adopted
the most P2 practices was
energy and CO2 (including renewable energy), which confirms the findings of a previous study of New England craft breweries where 88% of participants in a survey identified energy as the top area of interest [
5]. A study of Iowa craft breweries’ environmental practices also found widespread initiatives to improve energy efficiency [
3]. The authors concluded that this may be the result of educational campaigns and/or financial incentives. Other studies of craft breweries’ priorities have also highlighted energy and climate as being among the industry’s top sustainability priorities [
4,
28]. This finding is not surprising given the high cost of energy in Massachusetts and the short payback period of such initiatives as a result of numerous state and federal incentives. Excluding labor, energy is also the most expensive input for most craft breweries. Interest in utilizing renewable energy was also strong, with 12 participants considering its implementation in the future, if available incentives can reduce upfront costs. For states with lower energy costs, however, other areas may be of greater interest, such as water efficiency or waste prevention, two areas highlighted as a high priority for breweries in a study by Ness [
28]. Patterson et al. [
67] and Rosburg & Grebitus [
3] also reported a low level of implementation of water quality/conservation measures and concluded that this may be a potential area of improvement for all U.S. craft breweries.
Packaging was the second area where Massachusetts craft breweries implemented many P2/sustainability practices. Participants were aware of the negative environmental impacts of plastic and were looking for ways to prevent plastic waste that was not possible to reuse or recycle. In all cases, adopted practices were easy and cost-effective and in some cases helped engage customers (e.g., can carrier take-back programs, reusable growlers, or cups/cutlery). This finding confirms previous research by Patterson et al. [
67] who found that 86% of surveyed breweries were either implementing or planning to utilize recyclable or reusable packaging. Veleva et al. [
5] also found that 83% of New England craft breweries were interested in free assessments and recommendations for reusing or recycling plastics such as can carriers, stretch wrap, and grain bags.
Local sourcing was the third impact area where Massachusetts breweries implemented the most P2/sustainability practices, even though these increased their costs. This finding confirms previous research that cost is not the top consideration for craft breweries and highlights
the importance of social drivers of P2/sustainability, such as founders/managers’ sustainability values and commitments to support their communities [
5,
7,
12,
34,
36,
68]. A recent survey of New England craft breweries reported that ‘being an environmental steward’ was the top driver for implementing P2/sustainability initiatives (selected by 81% of respondents), followed by ‘saving money’ (67%) and ‘reputation with the community we serve’ (63%) [
5].
This study further confirmed the findings of previous research that sending BSG to nearby farms for animal feed is the most prevalent sustainability practice adopted by craft breweries for waste reduction, due its financial and environmental benefits. A study of 90 craft breweries in England found that “the primary method for recycling spent grain was its use as animal feed by local farmers by both rural and urban breweries” [
69]. In a recent survey of New England craft breweries, 95% of participants rated their sustainability performance in regard to BSG as ‘excellent’ or ‘very good’, the highest score for any environmental impact category [
5]. An earlier study of Iowa breweries also reported that almost all participants rated their diversion of spent grain as ‘excellent’ and the authors concluded that it may be time to move beyond questions about BSG and identify new areas for waste reduction and sustainability [
3].
The present study also confirmed the
role of environmental information as a powerful driver for adopting P2/sustainability strategies, as most participants were unaware of the various opportunities they had. Onsite technical assistance, industry presentations, webinars, and best practices guides can lead to the increased adoption of P2/sustainability actions. This finding was previously highlighted by Corsini et al. [
29] who recommended sharing best practices among industry entrepreneurs to “raise awareness and consequently positively shape environmental performance.” Similarly, Sozen et al. [
12] concluded that sharing best practices and having better consultation programs and government incentives can promote the adoption of environmental practices by craft breweries. Sustainability benchmarking can be an important tool for comparing performance to peers and best-in-class and identifying areas for improvement. However, using the BA sustainability benchmarking tool appears challenging for most craft breweries as it requires gathering all utility bills and learning a new online platform to enter the data and conduct the benchmarking, a finding also reported by Rosling & Grebitus [
3]. By utilizing graduate students at the University of Massachusetts Boston, the research team helped eight breweries overcome this challenge. The BA tool is also only available to BA members. Future sustainability benchmarking tools should be simpler to use and available for free to craft breweries to promote their greater use. Many breweries in this study shared that they did not know which vendors were credible/reliable (e.g., among the numerous solar panel installers). TA can provide such information by developing and sharing resources about vendors as well as examples of breweries which have used their products/services.
While on average, study participants implemented two P2/sustainability practices over the two-year period,
four facilities implemented four or more such actions (facilities #9, #18, #20, and #28). In all of these cases, the breweries had a
founder/owner or head brewer with sustainability training or significant environmental knowledge. This confirms previous research by Embry [
37] of the importance of owner’s enthusiasm and values. Madrid-Guijarro and Durendez [
8]’s research also reported that management commitments (values, skills, and attitudes) are an important driver of adopting more sustainable business models in SMEs to reduce environmental impacts and promote the development of more sustainable products and facilities. Sustainability leaders can also influence other breweries to adopt various P2/sustainability actions, especially in areas such as switching to safer chemicals for cleaning and sanitizing, where the main barrier for adoption is quality concerns. This finding confirms previous research about the importance of ‘networks of influence’ and ‘harnessing peer influence’ in advancing sustainability practices by craft breweries and SMEs [
3,
4,
37].
While participants were interested in many recommended P2/sustainability actions, the lack of access to resources (funding and staff) was a major barrier to adoption. As a result, the most often adopted practices were
low-cost or no-cost initiatives which were easy to implement and had a quick payback period (e.g., efficiency improvements, can carrier take-back program, reusable stretch wrap, reusable cups and ramekins). P2 practices with more significant upfront costs such as carbon capture and ionized air rinsing were only attractive for larger breweries with greater resources. This finding aligns with previous research which found that company size and resources determined the extent of its environmental proactivity [
4,
70].
Previous studies have found that larger firms are more influenced by regulatory pressures while SMEs are influenced by business opportunities [
71]. The current study, however, illustrated that
regulation is an important driver for small businesses like craft breweries. The lack of any mandate regarding wastewater reduction by small craft beverage manufacturers in Massachusetts was cited as the primary reason for not considering P2/sustainability initiatives in this impact area. Just three breweries adopted side streaming, despite the associated cost, as part of their commitment to protect the local water quality. Another example of the impact of regulatory pressures is the Massachusetts Organics Ban [
72] which restricted the disposal of food and other organic waste in the trash. This state regulation has been a powerful driver for craft breweries to seek innovative solutions to their greatest waste stream—BSG—from composting to animal feed, to upcycling into various products for human consumption.
Due to the short time since the launch of the
BetterBev recognition program and the low awareness about it among craft breweries and other stakeholders, it was not possible to assess its impact as a driver for adopting P2/sustainability practices. As of April 2025, only a few participants had mentioned their BetterBev recognition on their website or social media sites. Previous research has highlighted consumer willingness to pay for more sustainable beer [
73] and craft breweries’ expectations that they can pass some cost increases to their customers when pursuing a third-party sustainability certification [
3]. Future research should examine the overall value of sustainability recognition for craft breweries seeking to differentiate from competitors and avoid being accused of ‘greenwashing’.
6. Conclusions
The main contribution of the present study is providing empirical research about the effectiveness of a new TA and recognition program in helping address key barriers and encouraging craft breweries to reduce their environmental impacts. In addition, it contributes to the literature about the factors driving craft breweries’ decisions of whether or not to adopt different P2/sustainability practices, and the most (and least) prevalent environmental actions. The work can be considered from a Knowledge–Attitude–Behavior (KAB) framework [
74], in that despite having been operational for a limited time, the program has led to improvement (behavior change) in 23 of 29 breweries. The most progress was made in the category of energy and GHG emissions. The provided technical assistance increased participants’ knowledge and thus opened a discussion of opportunities for improvement by the breweries. It is important to benchmark and regularly check for improvements to ensure the breweries do not backslide into their prior higher impact behavior. However, to scale this program to more breweries and other craft beverage manufacturers, the attitude of the KAB framework needs to be encouraged through a train-the-trainer model. In this case, those operations that have had success in implementing environmentally friendly practices will encourage and teach other breweries how to adopt such initiatives. By increasing the knowledge of sustainability practices and the attitude to be willing to adopt them, behavioral change can help the craft beer industry to reduce its environmental impacts. These behaviors can demonstrate that actions can simultaneously lessen environmental impact, lower costs, and make the craft beverage industry more sustainable.
This study has several limitations. First, the research included breweries in a single state (Massachusetts) with high awareness and policy support for environmental sustainability. The results could be different for craft breweries based in a different state or country with a lower level of awareness and support. In addition, craft breweries in a different location may have different priorities when adopting P2/sustainability actions. Second, due to the short timeframe, it was not possible to assess the impact of the BetterBev recognition as driver for adopting P2/sustainability actions. Future research could include a survey of craft breweries and/or consumers to evaluate the importance of third-party sustainability recognition programs for the sector. Third, there is a possibility of selection bias—breweries which were more interested in adopting P2/sustainability practices were more likely to participate in the program. Future research could compare the adoption of P2/sustainability actions among a comparison group of breweries which did not receive technical assistance and recognition.
The main contribution of this paper is the provision of empirical data about the effectiveness of technical assistance and recognition programs in promoting the adoption of P2/sustainability by SMEs in a single sector (craft beer). It illustrates that effective interventions should incorporate educational and technical support through workshops, webinars, onsite assessments, and train-the-trainer initiatives. Leveraging university resources, increasing access to grants and other incentives, as well as enacting environmental policies are key for shifting an entire industry towards more sustainable production and consumption.


