Abstract
Land use and land cover (LULC) changes play a crucial role in regional carbon dynamics and climate regulation. This study assesses the impact of LULC changes on carbon stocks in Hunan Province, China, from 2000 to 2035 using a MOP-PLUS–InVEST–OPGD integrated modeling framework. Results show that carbon stock declined by 45.96 million tons from 2000 to 2020 due to rapid urban expansion and conversion of forest and grassland to construction land. Scenario simulations reveal that by 2035, carbon stock will increase by 4.82% under the ecological protection scenario (EP) but decrease by 3.26% under the natural trend scenario (NT). Economic development scenario (ED) and sustainable development scenario (SD) produce intermediate outcomes. Spatially, high-carbon regions are concentrated in high-altitude forested areas, while urbanized lowlands exhibit the lowest carbon density. The optimal parameters-based geographical detector (OPGD) model identifies land use intensity, elevation, and net primary productivity as the dominant drivers of carbon stock variation, with significant interactions between natural and socioeconomic factors. These findings underscore the need for integrated land-use planning and ecological conservation policies that align with carbon neutrality goals. This study provides a replicable spatial framework and policy-oriented insights for managing carbon stocks in rapidly developing regions.
1. Introduction
Climate change issues have become increasingly prominent, including global warming and ecosystem function degradation [1]. Meanwhile, carbon stock refers to the balance between carbon dioxide the ecosystem’s uptake, and emissions into the atmosphere, with a vital role in the global carbon cycle and climate regulation [2,3]. Increasing the carbon stocks within terrestrial ecosystems has attracted the attention of governments and researchers globally. Land use/land cover (LULC) changes critically impact carbon stock and land use structure, function, and processes [4] in terrestrial ecosystems [5,6,7,8] and the overall global carbon balance [9,10,11]. Therefore, conducting regional multi-scenario carbon stock predictions and analyzing the factors influencing land use are significant for promoting low-carbon development in regional socioeconomic systems, optimizing land use structure, and contributing to climate change mitigation [12,13].
Methods used to estimate carbon stocks include plot measurement [14], statistical models [15], satellite imagery or remote sensing technology inversion [16], and ecological model simulation [17,18]. The simulation of carbon stocks in ecological models is grounded in ecosystem dynamics. Specifically, by building mathematical models of ecosystem carbon input, output, and transformation processes and inputting climate, soil, vegetation, and other data, carbon stock change can be simulated at different time scales [19]. Zhou and Shi [20] investigated how land use changes affect soil organic carbon stock in China using the Carnegie–Ames–Stanford Approach model. Meanwhile, Gao et al. (2015) [21] evaluated carbon exchange among vegetation, soil, and the atmosphere. Additionally, the CEVSA model was applied to investigate the effects of urban expansion on soil organic carbon stock in China’s agro-pastoral ecotone between 1981 and 2000. Using remote sensing inversion and terrestrial carbon cycle modeling, Piao et al. (2018b) [7] discovered that reducing global land use carbon emissions during 1998–2012 could enhance the expansion of terrestrial carbon sinks. Moreover, the Integrated Valuation of Ecosystem Services and Trade-offs (InVEST) model [22] rapidly reflects the regional carbon stock with relatively minimal data while examining the spatial distribution and dynamic variations in carbon stock through mapping. It can also estimate carbon stock by utilizing carbon density data from various land use types and the association between land use change and carbon stock.
It has been reported that a strong correlation exists linking LULC changes to carbon stocks. For instance, Gong et al. [23] assessed the effect of LULC changes on carbon stock dynamics in the Nandu River Basin through coupled trajectory analysis using the InVEST model. Meanwhile, Deepakshi Babbar et al. [22] applied the Markov chain and InVEST models to evaluate and predict carbon sequestration in the Sariska Wildlife Sanctuary in India. Moreover, by employing the InVEST model, Ke et al. [24] studied the carbon stock of terrestrial ecosystems in Hubei Province. They concluded that urban construction land expansion and cropland protection were the primary factors contributing to its decline. Coupled model frameworks have also been constructed to conduct dynamic prediction analyses of regional carbon stocks, including coupled models like InVEST and land use simulation frameworks such as Dyna-CLUE (Dynamic Conversion of Land Use and its Effects) [25], FLUS (Future Land Use Simulation Model Software) [26], and CA-Markov [27] models.
Although others have reported that patterns and transitions in land use affect carbon stock in ecosystems, the mechanisms by which natural environments and human disturbances affect changes in carbon stock across spatiotemporal scales also remain unclear. In carbon stock research, GeoDetector (GD) [28], as a statistical tool, has been extensively utilized to evaluate spatial heterogeneity and its influencing factors. Traditional GD has been effectively employed to analyze the relationships between spatial variables and assess the contribution of each driving factor through the q-value. However, GD is limited in handling multi-factor, multi-scale, and non-linear complex relationships. For example, its relatively simple model parameter selection and factor interaction analysis impede its ability to fully capture complex geographical processes. This model, based on grid cells [28], also has limitations when discretizing continuous variables, as it requires manual settings that introduce subjectivity and may lead to inadequate discretization. The optimal parameter-based geographical detector model (OPGD) has been introduced to overcome these limitations [29]. Compared to traditional models, OPGD more flexibly handles complex spatial data and more accurately quantifies the influence of driving factors. Additionally, the OPGD model enhances the ability to detect interactions among factors, revealing non-linear enhancements and synergies, resulting in a deeper understanding of the spatial heterogeneity of regional carbon stock and its driving mechanisms.
Most studies have predominantly examined the past and present impacts of natural and socio-economic factors on carbon stock, often linking these changes to land use dynamics. However, whether these impacts and their underlying mechanisms will persist in the future remains unclear. This study emphasizes the integration of land use change as a key mediator in understanding how natural and socio-economic factors influence carbon stock. By simulating future development scenarios, this study explores the spatiotemporal evolution of land use and its critical role in shaping carbon stock changes, providing a comprehensive framework for future-oriented carbon management strategies. This study has considered multiple future development goals, such as economic, ecological, and social benefits. This involves future land use emulation, transformation of land use and its impacts at the regional level conversion of land use, and the patch-generating land use simulation (PLUS) Model [30]. The PLUS model can determine the driving factors of land use change and land use change mechanisms. The influence of the driving factors on different forms of land use expansion reflects the spatiotemporal patterns and features of land use change. Meanwhile, the mathematical MOP model can optimize the allocation and forecasting of land use according to development trends under a series of subjective and objective constraints [31]. This model comprises decision variables, objective functions, and constraints [32] and can focus on the decision to seek the maximum (or minimum) value of one or more goals under different constraints. Hence, the integrated MOP–PLUS–InVEST model is capable of simulating land use and the evolution and expansion of different land use patches to determine the drivers and mechanisms of land use change [33,34]. It can also evaluate the carbon stocks of different land use types across various scenarios, enhance the strategic utilization of land assets and sustainable growth, and contribute to the global carbon cycle and climate regulation. Compared with previous studies focusing solely on carbon stock prediction or land use simulation, this study integrates spatiotemporal modeling (PLUS-InVEST) with optimal parameter geographical detectors (OPGD) to simultaneously assess carbon stock changes and their underlying drivers, providing an improved framework for regional low-carbon land management.
With rich forest resources and representative forest wetland ecosystems, central and southern China are important ecological barriers and carbon sink areas. Forests can act as significant carbon reservoirs and sequesters, contributing to the national goal of net-zero carbon emissions. China’s 14th Five-Year Plan states that by 2035, national land space will be developed and protected under a spatial pattern [35]. In this context, the ecological functions of national land space and its economic and social functions should be defined. Indeed, after peaking, this is a key period for China to achieve a stable decline in carbon emissions, representing an important milestone for China to move toward carbon neutrality. As a representative region of central and southern China, Hunan Province is an ecological area of global importance with high levels of biodiversity and ecosystem service functions. However, rapid urbanization has severely impacted the ecological environment, resulting in notable changes in land use and significant fluctuations in carbon stock and ecosystem function.
In this context, this study takes the Central-Southern Hills and Mountain Region of Hunan as a case study to simulate LULC trajectories and carbon stock changes under different scenarios and to identify their key drivers and interactions. Building upon these advancements, this study offers several significant contributions to the understanding of LULC–carbon dynamics and sustainable land management. Firstly, it pioneers the integration of a multi-objective optimization model (MOP) with a sophisticated land use simulation model (PLUS), an ecosystem service assessment tool (InVEST), and an advanced spatial heterogeneity detector (OPGD). This comprehensive framework provides a novel and robust methodology for simulating future LULC changes, assessing their carbon stock implications, and uncovering their underlying driving mechanisms simultaneously. Secondly, while previous studies often focus on historical or present impacts, our research uniquely extends to the future by projecting spatiotemporal carbon stock changes and their drivers under diverse development scenarios, thereby addressing critical uncertainties about future ecological impacts. Finally, by applying the OPGD model, this study provides a more nuanced understanding of carbon stock spatial heterogeneity, not only by identifying the dominant natural and socioeconomic drivers but also by explicitly quantifying their synergistic interactions. These contributions are particularly relevant for informing adaptive land management strategies in rapidly developing regions like Hunan Province, supporting national carbon neutrality goals.
Therefore, the main objectives of this study are to: (1) model LULC changes under different future scenarios using a multi-model approach; (2) analyze the spatiotemporal trends of land use and carbon stock; (3) utilize the OPGD model to examine the driving mechanisms and spatial heterogeneity of carbon stock changes under current and future conditions.
2. Study Area and Methods
2.1. Overview of the Study Area
Hunan Province is located in central-southern China (108°47′–114°15′ E, 24°38′–30°08′ N), covering an area of approximately 211,800 km2 (Figure 1). The province is characterized by a complex topography, mainly composed of hills and low mountains, interspersed with basins and plains. It has a subtropical monsoon climate with an annual average temperature of 16–18 °C and precipitation ranging from 1200 to 1700 mm, providing favorable conditions for vegetation growth and biodiversity conservation. Hunan is known for its high forest coverage rate—over 59% in recent years—making it one of China’s most important carbon sink regions.
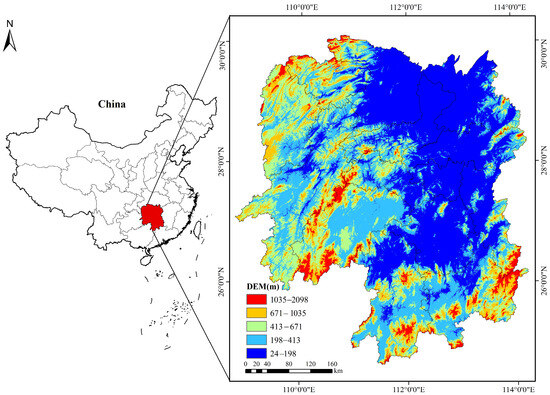
Figure 1.
Geographical location of the study area.
Demographically, Hunan has a population of over 66 million (as of 2023), with a growing urbanization rate that reached approximately 58%. Rapid urban expansion, infrastructure development, and industrial transformation have significantly altered land use patterns over the past two decades. Agricultural land, forest, and grassland areas have declined, while construction land and unused land have increased notably. Socio-economic drivers such as GDP growth, population density, and policy-led land development have become critical forces influencing LULC and associated carbon stock dynamics. These characteristics make Hunan a representative case for exploring the interactions between natural ecosystems and anthropogenic land transformation under multiple development scenarios.
2.2. Data Sources
- (1)
- Land Use/Cover (LULC) data
The land use data was sourced from the Data Center for Resources and Environmental Sciences, Chinese Academy of Sciences (https://www.resdc.cn), accessed on 2 August 2024. With a 30 m × 30 m data precision, the land use data were sorted into six groups: cropland, woodland, grassland, water bodies, construction land, and unused land. Raster maps of land use for five phases were collected for the years 2000, 2005, 2010, 2015, and 2020.
- (2)
- Driving factors for LULC change simulation
To capture the complex influences on LULC dynamics, particularly the impact of historical demographic and socio-economic changes, a comprehensive set of driving factors was selected and categorized as natural and social factors (Table 1). These factors directly informed the land use suitability calculations within the PLUS model (version 1.4).

Table 1.
Data sources of land use drivers.
Natural factors included a Digital Elevation Model (DEM), slope, aspect of slope, mean annual precipitation, annual mean temperature, soil type, and soil erosion. These provide the biophysical context for land use.
Social factors, crucial for reflecting human activities and development, comprised: Population density (sourced from statistical yearbooks and spatialized through interpolation/disaggregation). Gross Domestic Product (GDP) (also from statistical yearbooks, spatialized accordingly), and distances to various infrastructures including expressways, first-, second-, and third-class roads, railways, railway stations, water areas, and government institutions. These distance variables served as proxies for accessibility, development potential, and the spatial pull of human activities.
These variables were collected or estimated at multi-year intervals (2000, 2005, 2010, 2015, 2020) and all driving factor data were uniformly processed and resampled to a 30 m × 30 m resolution using ArcGIS 10.5 to ensure consistency with the LULC datasets. These historical social factors were used by the PLUS model’s Land Expansion Analysis Strategy (LEAS) to learn the conversion rules based on past socioeconomic pressures, which then informed future land use simulations under different scenarios.
While land use change and carbon stock are closely related, their driving mechanisms involve both shared and distinct factors. To ensure accurate modeling and analysis for each component, we constructed two separate factor systems. Table 1 presents the specific natural and socioeconomic factors that influence land use change and were used as inputs for the PLUS model. In contrast, Table 2 lists a distinct set of natural, social, and locational variables that were used to analyze the spatial distribution and driving mechanisms of carbon stock dynamics through the OPGD model. This distinction allowed for a targeted analysis of each process while acknowledging their interconnections.
Table 2.
Driving factors of carbon stock and data sources.
- (3)
- Selection of carbon stock influencing factors. The thoughtful selection of influencing factors plays a critical role in elucidating the mechanisms underlying carbon stock changes. Based on the specific conditions of Hunan Province, 17 driving factors were selected from natural environmental, socioeconomic, and locational conditions (Table 2). All influencing factors were rasterized in ArcGIS, and the coordinate system was unified. The comprehensive index of land use intensity was derived from current land use data.
- (4)
- Soil and vegetation serve as fundamental carbon reservoirs within terrestrial ecosystems, with their capacity to sequester carbon varying significantly across different land use types. To establish a comprehensive baseline, we systematically compiled carbon density values for each major land use type across China from extensive national-level literature reviews conducted by various prominent researchers [36,37,38,39,40]. These baseline values, encompassing plant biomass, belowground biomass, soil organic carbon, and dead organic carbon, are presented in Table 3.
Table 3. Collection of regional carbon density values in China (t/ha).
2.3. Research Methods
Figure 2 presents the research approach applied in this study. We utilized a multi-model approach, integrating several established geographical and ecological models to achieve our research objectives. By integrating land use with natural and socioeconomic data, the Multi-Objective Optimization Problem (MOP) [42] and Patch-generating Land Use Simulation (PLUS) model [30] simulated land use in 2035 across different development scenarios. Using the InVEST model [43,44], the carbon stock of Hunan Province was evaluated and predicted under various scenarios from 2000 to 2020 and in 2035.
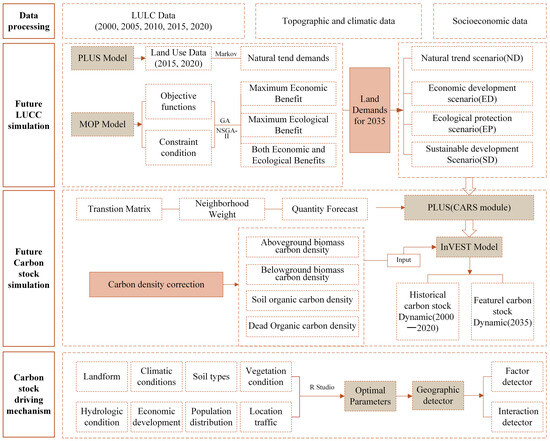
Figure 2.
Research technology route.
2.3.1. MOP–PLUS Model-Based Land Use Simulation
The Multi-Objective Programming (MOP) model was utilized to optimize future LULC structures under different scenarios, balancing competing demands such as economic development and ecological protection. Crucially, the MOP model determines the optimal area targets for each land use type in 2035 by maximizing or minimizing specific economic and ecological objectives. These objectives (e.g., maximizing total economic output from land uses, maximizing total carbon sequestration potential, or balancing both) are derived from the carbon density of different land use types and their economic benefits, thereby implicitly incorporating socioeconomic considerations through the valuation and trade-offs of land use functions.
A land use simulation model was applied; in line with the General Plan of National Space (2021–2035) of Hunan Province, this study adhered to ecological priority, green and low carbon, strictly observing the bottom line of cropland protection and food security. We developed four future LULC scenarios for 2035 to explore different pathways of land use change, each inherently reflecting distinct policy priorities and socioeconomic development choices:
Natural trend scenario (NT): This scenario assumed a continuation of historical LULC change rates observed between 2000–2020. While not directly predicting future population or GDP, this scenario reflects the implicit socioeconomic pressures that drove past land conversion processes in Hunan. The MOP model, under this scenario, would aim to project area demands based on these historical rates.
Economic development scenario (ED): This scenario prioritized rapid economic growth and urbanization. The MOP model was set to optimize for maximum economic benefits derived from land use, leading to increased demand for construction land and potentially agricultural land conversion. This directly reflects a socioeconomic objective of maximizing economic output.
Ecological protection scenario (EP): This scenario emphasizes environmental conservation and ecological restoration. The MOP model in this scenario is optimized for maximum ecological benefits, such as carbon sequestration, which would lead to increased woodland and grassland areas and strict control over the conversion of natural land. This represents a socioeconomic choice to prioritize environmental sustainability.
Sustainable development scenario (SD): This scenario aimed for a balanced approach between ED and EP. The MOP model here sought to optimize for a trade-off between economic and ecological benefits, representing a complex socioeconomic decision to pursue both growth and environmental quality.
The resulting optimal area targets for each land use type from the MOP model under these scenarios were then used as quantitative constraints for the PLUS model’s spatial allocation, ensuring that the simulated LULC patterns reflect these macro-level socioeconomic and ecological objectives [45].
MOP Model and Genetic Algorithm
The MOP model was employed to forecast the land use demand for different target scenarios in Hunan Province in 2035 [46]. This was conducted through the conditional constraints of land use for different development targets to achieve the maximum corresponding target value. The associated calculation is represented by Equations (1) and (2):
where F1(x) and F2(x) represent the economic and ecological benefits, respectively; xj denotes the area (ha) for the land use type j, corresponding to the six land use type variables; n represents the number of variables; j denotes the land use types (n = 6) and j = 1, 2, 3, 4, 5, and 6 for cropland, woodland, grassland, water, construction land, and unused land, respectively; aj and bj denote the economic and ecological benefit coefficients associated with land use type j, respectively.
where s.t is the land use constraint; Cij represents the coefficient corresponding to the j-th variable in the i-th constraint; m is the number of constraints; and di is the value of constraint i.
- (1)
- Objective function
To calculate the economic benefits, the following function was used as represented by Equation (3):
where f1(x) represents the total economic benefit of all land use types, with xi being the area of the i-th land use type; index i indicates the land use type (n = 6), i.e., cropland, woodland, grassland, water, construction land, and unused land, and is the economic benefit per unit area of the first land use type. In this study, the economic benefits of cropland, woodland, grassland, water, and construction land were calculated as 5.69, 0.33, 39.51, 5.83, and 651.30, respectively (unit: 104 CNY/ha), according to a previously defined method [30,47]. The formula for the maximizing economic value is represented by Equation (4):
Measuring ecological benefits based on the ecosystem service value (ESV) was achieved using Equation (5):
where f2(x) is the overall ecological value of the land system, with ESV indicating the i-th land use type. The ESV per unit area was determined for cropland, woodland, grassland, water, and unused land in Hunan Province [48] based on the equivalent value of ecosystem services per unit area reported by Xie et al. (2008) [49] combined with the functional value method to account for the ES value [50] (Zhang and Hu et al., 2023) [48]. The values were 1.07, 5.28, 3.30, 31.97, and 0.20 (unit: 104 CNY/ha), respectively. Equation (6) was obtained to maximize the ecological benefits:
Sustainable development benefits emphasize the equal importance of ED and EP, encourage high-quality economic development while ensuring a high level of ecological protection, optimizing both ecological and economic benefits, and maximize ecological and economic benefits, calculated using Equation (7):
- (2)
- Constraints
The constraints in the MOP model serve as regulatory limitations, designed from a macro-policy perspective and considering the existing land resource conditions in the study area. These constraints ensure that the simulated land use structures align with the specific needs and objectives of the future ED and EP, as well as reflecting the NT. By combining the actual situation in Hunan Province with reference to relevant national and regional policies and literature, structural optimization constraints were meticulously set to reflect the actual economic and ecological needs for 2035 (Table 4).
Table 4.
Land use constraints.
- (3)
- Multi-objective genetic algorithm (NSGA-II)
The allocation of land resources was optimized under different scenarios using the genetic algorithm (GA) and non-dominated sorting genetic algorithm (NSGA-II). The GA is a heuristic algorithm that seeks the extreme value of a target problem by mimicking the biological evolutionary mechanism [55]. The algorithm can identify the global optimal solution in a large search space without relying on derivatives or other auxiliary information. This method can handle complex, nonlinear, and multi-peaked issues. Hence, the ED and EP are single-objective optimization problems solved using the GA.
NSGA-II is an optimization algorithm based on a natural evolutionary process that considers several objective functions simultaneously and seeks numerous non-dominated solutions to form a uniformly distributed Pareto frontier. This is identified as the Pareto optimal solution [56]. A collection of Pareto optimal solutions was obtained through a parallel computational process by setting up the objectives and constraints after using NSGA-II.
This study used the PyCharm Community Edition 2023.2.2 software to solve the ED, EP, and SD land use structures in Hunan Province in 2035 using self-coded code. The analysis was conducted with a population size of 20,000, iteration number of 15,000, 100 generations, and 2021 random seeds for each land use type.
PLUS Model and Simulation Process
Using the LEAS modules based on CARS in the PLUS model [30], the factors influencing land expansion and changes in the landscape were assessed. The simulation was used to predict future landscape patterns. Additionally, the driving factors of LULC changes were identified. Guided by the principles of comprehensiveness, data availability, and quantification, a total of 17 driving factors were identified from two groups (i.e., natural and social factors) through the synthesis of earlier studies [57,58] and the changes in LULC patterns over time and space in Hunan Province. The LEAS module was utilized to generate the development probability map for each land use type. With the constraints of the development probability generated by the LEAS module, the total land use was designed to meet the future development scenario demand through the constraints of domain weights (Table 5) and transformation matrixes (Table 6) [59].
Table 5.
Neighborhood weighting parameters for 2035.
Table 6.
2035 Matrix of land use changes for the study area based on various development scenarios.
The transition matrix determined whether different land types could be interchanged with one another. NT sets the transfer matrix according to the rule that construction land and water bodies are not converted. The ED allows any conversion between land types. EP protects land types while restricting the spread of construction land. SD protects the quantity of cropland and woodland and limits cropland conversion to other land.
- (4)
- Model accuracy validation
The simulation results were validated using the Kappa Coefficient in the PLUS model to ensure that both the model and its parameters were suitable for the study area. If Kappa was ≥0.75, the two land use simulation results had high consistency, small differences, accurate simulation, and high credibility. When Kappa ranged from 0 to 1, a value closer to 1 indicated higher simulation accuracy; when Kappa exceeded 0.75, the simulation accuracy was relatively high. The model was trained using data from 2015 on land use. In 2020, predictions were made regarding the land use type, and the model’s accuracy underwent rigorous testing. The findings revealed that the model achieved an impressive comprehensive accuracy rate of 92%, and a Kappa coefficient reaching 86.25%. This demonstrated a strong alignment between the model’s predicted and actual values. Thus, the model and related parameters could be used to predict land use by 2035. The NT used the 2015 and 2020 land use data of Hunan Province as historical data, and the area and spatial distribution map for each land use type in 2035 were calculated using the Markov chain.
2.3.2. Carbon Density Correction and InVEST Model Calculations
Carbon Density Correction
While these national baseline values provide a broad reference, local climatic factors, particularly temperature and precipitation, significantly influence actual carbon accumulation and storage. Empirical studies consistently show a strong positive correlation between ecosystem carbon stocks and both air temperature and precipitation [60,61,62,63,64,65]. To enhance the representativeness of our carbon density estimates for Hunan Province’s specific subtropical monsoon climate, we applied climate-based correction factors. We adopted regression models developed by Tang et al. [66], which are widely recognized for assessing and refining carbon density estimates across diverse climatic zones. These models are particularly applicable to China’s climatic classification, as they are built upon key thresholds such as a mean annual precipitation (MAP) of 400 mm (the arid climate threshold) and a mean annual temperature (MAT) of 10 °C (the warm temperate climate threshold). These formulas account for variations in annual precipitation and mean annual temperature, as represented in Equations (8)–(11):
Precipitation-inclusive regression model (MAT > 10 °C):
Temperature-inclusive regression model (MAP > 400 mm):
where CSP and CST denote soil organic carbon density influenced by annual precipitation and mean annual temperature; CBP and CBT depict biomass carbon density in relation to annual precipitation and annual mean temperature; MAP refers to mean annual precipitation (mm), while MAT denotes mean annual temperature (°C), respectively.
To derive adjustment factors specific to Hunan Province, we utilized its average annual precipitation (1430.73 mm) and mean annual temperature (18.02 °C) from 2000 to 2020. Similarly, we applied the average annual precipitation (644.61 mm) and mean annual temperature (9.97 °C) for China (as reflected in the baseline data in Table 3) as a broader reference for the adjustment factor calculation. These provincial and national averages were entered into the relevant equations (Equations (8)–(11)). The ratio of the Hunan-specific climate-adjusted values to the China-average climate-adjusted values then represented the carbon density adjustment factor for each carbon pool. Multiplying the initial baseline carbon density data from Table 5 with these correction factors yielded the refined carbon density data specifically for Hunan Province, as presented in Table 6. The formulas for calculating these correction factors are represented by Equations (12) and (13):
where KBP and KBT denote the correction factors for biomass carbon density, accounting for precipitation and temperature, respectively. KSP and KST denote the adjustment factors for soil organic carbon density, accounting for precipitation and air temperature, respectively; KB represents the adjustment factor for biomass carbon density; KS represents the adjustment factor for soil organic carbon density; and represent the vegetation biomass carbon density data for Hunan Province and China considering precipitation, respectively; and are the soil organic carbon density data of Hunan Province and China, respectively, considering precipitation; and are the vegetation biomass carbon density data of Hunan Province and China, considering temperature, respectively; and represent the soil organic carbon density data of Hunan Province and China, considering temperature, respectively.
Special consideration was given to the carbon density of construction land, as the primary carbon pools within built-up areas in standard ecological models like InVEST are typically biological. Our calculated “construction land carbon density” (as presented in Table 3 for baseline and Table 7 for corrected values) refers exclusively to the biological carbon stored in urban green spaces (e.g., trees, lawns, shrubs) and urban soils. We explicitly confirm that non-biological carbon pools, such as carbon within artificial structures (concrete, steel) or solid waste, were not included in our carbon stock estimations. This approach aligns with common practices in ecological carbon modeling, focusing on biologically active carbon components within the urban ecosystem.
Table 7.
Mean Carbon Density Values for Land Use/Land Cover Types in Hunan Province (2000–2020) (t/ha).
Based on the findings of Huang et al. [62] Li et al. [67] and the IPCC Guidelines for National Greenhouse Gas Inventories [68] the ratios of subsurface biomass to aboveground biomass were applied as follows: 0.19 for cropland, 0.36 for woodland, 5.2 for grassland, and 5.5 for unused land. To generate the final mean carbon density values for Hunan Province (Table 7), we first calculated the corrected carbon density for the years 2000, 2005, 2010, 2015, and 2020. The values presented in Table 7 represent the average of these five-year corrected carbon density values, ensuring a representative input for the study period.
InVEST Model Operation
The carbon module of the InVEST model was utilized to assess the carbon stock in the study area [44]. The corrected and averaged carbon density data (Table 6) were input into the model, encompassing carbon density in aboveground biomass, belowground biomass, soil organic carbon, and dead organic carbon. The results of the calculations provided spatial distribution maps for the total carbon stock in the study area.
The formula for estimating the total carbon stock in the study region is represented by Equation (14):
where Ci denotes the carbon density associated with the i species; Ci_above is the carbon density of the aboveground biomass of type i; Ci_soil is the carbon density of the underground biomass of type i; S is the carbon density of the soil organic matter of i; and Ci_dead is the carbon pool of dead organic matter of type i.
The carbon density and land use data of each class were used to calculate the ecosystem carbon stock as shown in Equation (15):
where Ci_total refers to the total carbon stock of the i species, and Ai denotes the area of class i.
Carbon Density Sensitivity Analysis
To verify the robustness and accuracy of the corrected carbon density values, we conducted a sensitivity analysis to assess how changes in the carbon density of individual land use types affect the estimated total carbon stock of the study area. This approach helps quantify the reliability of our carbon stock estimations against potential uncertainties in the input parameters [69].
The method involved adjusting the carbon density values (specifically, the sum of aboveground biomass, belowground biomass, soil organic carbon, and dead organic carbon for each LULC type as presented in Table 7) for a single land use type upwards and downwards by ±10% while keeping all other land use types’ carbon densities constant. These adjustment percentages reflect a reasonable range of uncertainty that might exist in literature-derived and climate-corrected carbon density data. The sensitivity of the total carbon stock to changes in each land use type’s carbon density was then calculated using the following formula (Equation (16)):
where SC represents the sensitivity index of the total carbon stock to changes in a specific land use type’s carbon density. CT2 is the total carbon stock of the study area after adjusting the carbon density of a single land use type. CT1 is the baseline total carbon stock of the study area using the original, unadjusted carbon density values from Table 7. CD2 adjusted is the adjusted carbon density value for a specific land use type. CD1 baseline is the baseline carbon density value for that same land use type (from Table 7).
A SC value of less than 1 indicates that the total carbon stock estimation is inelastic to changes in that specific land use type’s carbon density. A smaller SC value implies that the accuracy of the carbon density coefficient for that land use type has a weaker influence on the overall total carbon stock assessment, suggesting the chosen carbon density value is more reasonable or that the total carbon stock is less sensitive to variations in that specific type. Conversely, an SC value greater than 1 would indicate a higher sensitivity, where a small change in the input carbon density leads to a proportionally larger change in the total carbon stock.
2.3.3. Optimal Parameter-Based Geographical Detector Model
This study employed the Optimal Parameter-Based Geographical Detector (OPGD) model [29], which seeks the optimal parameter settings to accurately and effectively detect the relationships between geographical variables and the driving forces behind geographical phenomena. It selects the most effective combination of spatial discretization and optimization parameters for spatial scale concerning the factors, accurately revealing the relationships between dependent and independent variables. This study utilized the GD package in R, applying four discretization methods: qual breaks, natural breaks, quantile breaks, and geometric breaks; the number of classes was set between 4 and 14. The q-values for each driving factor were calculated using the OPGD model under different discretization methods and class numbers, identifying the combination that produces the maximum q-value for each driving factor. Based on this, the study employed the “Factor Detection” and “Interaction Detection” functions within GD to analyze the influence of multiple driving factors and their combinations on carbon stock levels in Hunan Province. The formula for spatial heterogeneity factor detection is represented by Equation (17):
where h represents the strata of the dependent variable Y or independent variable X; Nh and N correspond to the total number of units in stratum h and across the entire region, respectively; and represent the variances of the Y values within stratum h and across the entire region, respectively; SSW and SST denote the sums of squares within the strata and the total sums of squares for the entire area, respectively. The q-value spans from [0 to 1], where an increased q-value suggests more significant spatial heterogeneity in Y; when the independent variable X generates the stratification, a larger q-value indicates that X exerts a stronger influence on the attribute Y, and the opposite holds as well. A q-value of 1, in exceptional cases, shows that factor X entirely governs the spatial distribution of Y, while a q-value of 0 reveals no relationship between X and Y, indicating that factor X explains all the variation in Y.
The method of interaction detection was utilized to reveal the relationships between different risk factors CX, assessing whether the joint effect of C1 and C2 enhances or diminishes the explanatory power for the dependent variable Y. The method involves pairwise comparison between factors. Initially, the q-values for factors X1 and X2 concerning the dependent variable Y were computed independently, referred to as q(X1) and q(C2), respectively. Then, the q-value for the interaction between C1 and C2 was calculated, denoted as q(C1∩C2). By comparing q(C1), q(C2), and q(C1∩C2), Using the criteria specified in Table 6, it is possible to ascertain the type of interaction between the two independent variables X and the dependent variable Y.
3. Results
3.1. Changes in LULC Dynamics in Hunan Province, 2000–2035
3.1.1. Spatial-Temporal Evolution of Land Use from 2000 to 2020
Table 8 and Figure 3a show that the regional land use types changed significantly over the past two decades. Woodland was the dominant land cover type in Hunan Province, followed by more than 35% of cropland, water, and grassland combined. Construction land and unused land occupied the least land area among all land use types. Overall, the cropland, woodland, and grassland reduced gradually, whereas the construction land, water bodies, and unused land areas increased significantly. Taking 2000 as the base year of change, the area of construction land expanded by 294,120.36 ha, representing an increase of 104.20%. The area of water bodies increased by 32,813.64 ha, reflecting an increase of 4.17%. The area of unused land increased by 677.52 ha, with an increase of 30.95%. Conversely, the cropland area shrank by 200,189.61 ha, with a decline rate of −3.27%. The grassland area shrank by 68,421.69 ha, with a −9.03% decline rate. The woodland area declined overall, with a reduction of 59,000.22 ha. The ecological environment in the region has been negatively affected by the changes in the land use structure caused by economic development and climate change.
Table 8.
The area of LULC types in the study area from 2000 to 2020 (km2).
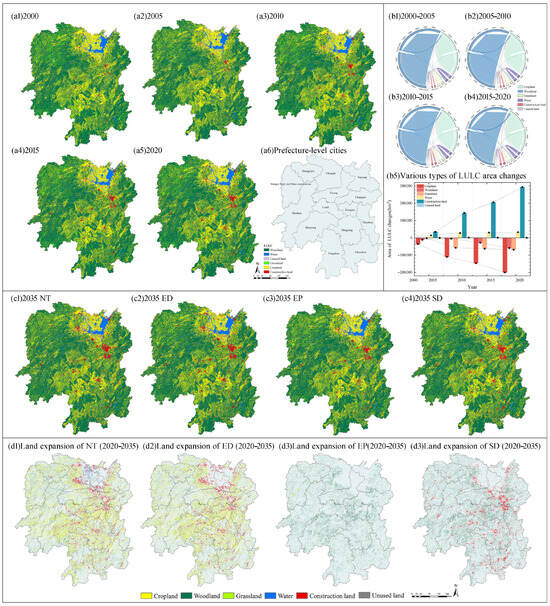
Figure 3.
Spatio-temporal evolution and changes of land use from 2000 to 2035.
In terms of inflow and outflow (Figure 3b), cropland, woodland, and grassland were all net outflow types. Cropland was the main contributor to the changes in all LULC types, that is, they reduced more in the area in 2020 than in 2000. Cropland had the largest net outflow, amounting to 1013,144.92 ha, accounting for 16.57% of its total area in 2000. With an outflow area of 924,262.06 ha, woodland followed, accounting for 6.99% of its total area in 2000. Grassland also had a net outflow area of 169,771.24 ha, accounting for 22.42%. This indicates that all three ecological land use types have been subjected to greater pressure, likely because of urbanization, industrialization, or other human factors. Construction land was mainly occupied by cropland (55.75%) and woodland (39.96%), with a total inflow of 3,633,286,195.98 ha. Water was mainly transported by cropland (62.90%) and woodland (29.27%), with a total inflow of 15,123,256,080.5 ha. Unused land was mainly woodland (69.16%) and croplands (17.60%), with a total inflow of 18,646,5608.5 ha. Croplands were mainly transformed into woodland, construction land, and water bodies. The main land types that woodland changed into were construction land, cropland, and grassland. Grassland mainly turned into forest land and cropland. Water bodies mainly turned into cropland, woodland, and construction land. Construction land, water bodies, and unused land mainly turned into cropland and woodland.
The changes in LULC in Hunan Province were characterized by the influence of population, economy, and policies on the demand and mode of land use (Figure 3). The main distribution of the construction land increase was in the Changsha–Zhuzhou–Xiangtan City Group in the east of Hunan Province, Loudi and Hengyang in the central part, Chenzhou in the south, and Yueyang in the north. The demand for land in the fields of urbanization, industrialization, and infrastructure construction led to an increase in the construction land. The water area increase was mainly located in the northern area of Dongting Lake. The increase was related to the construction of water conservancy projects and the water environment management projects implemented in Hunan Province. This includes the Three Gorges Project, the governance of the mainstream of the Xiangjiang River, and the construction of the Dongting Lake Ecological and Economic Zone. These projects have increased the land use area for artificial waters and water conservancy facilities. The increase in unused land is related to land degradation and ecological environment deterioration. The quality of some woodland, cropland, and other land has declined, losing its original function and becoming unused. The central and northern regions of Hunan Province were the main areas where land use changed.
3.1.2. Spatial-Temporal Evolution of Land Use from 2020 to 2035
Based on the prediction results from the MOP and PLUS models (Table 9), data on land use distribution in 2035 under four scenarios were obtained, that is, NT, ED, EP, and sustainable development (Figure 3c).
Table 9.
Area of land use types under various development scenarios in 2035 (ha).
Compared with the LULC area in 2020, under the NT, construction land (30.57%) and water (0.96%) area in Hunan Province was projected to grow in 2035. Cropland (−1.48%), woodland (−0.62%), grassland (−2.15%), and unused land (−26.26%) were expected to shrink in area. The projection showed the largest increase in the construction land area, reaching 176,227.29 ha. According to the projection, the area of water would rise by 7875.36 ha and the area of cropland would fall the most, reaching 87,253.74 ha. Woodland was projected to decrease to 81,256.14 ha and grassland was projected to decrease to 14,839.92 ha. Unused land was projected to decrease to 752.85 ha. Under the ED, cropland, woodland, construction land, and unused land were projected to be the same as in the NT. Used land was consistent with the changes in the NT. The water area was consistent with that of 2020 and the decrease in grassland was less than under the ED (−1.01%). Under the EP, the woodland area was shown to increase significantly (0.72%), with the increase reaching 94,971.13 ha. The NT showed consistent changes in cropland, grassland, water, and unused land areas, and no change in construction land from 2020. Under the SD, the areas of construction land (30.19%) and water (0.19%) in Hunan Province were projected to increase. The areas of cropland (−1.45%), woodland (−0.61%), grassland (−1.35%), and unused land (−25.72%) were shown to decrease. Construction land was estimated to increase by 174,030.99 ha. Water area was shown to increase by 1583.77 ha and cropland decreased by 85,664.07 ha. Woodland was projected to decrease by 79,943.22 ha, grassland would decrease by 9270.22 ha, and unused land would decrease by 737.26 ha. It was estimated that under the NT and ED, the province would experience more significant increases in construction land and water areas and more significant decreases in cropland, woodland, and grassland areas. Under the EP, woodland would be fully developed. Under the SD, the increasing trend in the construction land and water areas and the decreasing trend in the cropland, woodland, and grassland areas would gradually slow down.
The NT and ED showed the most significant expansion of construction land (Figure 3d), with new construction land mostly focused on the Changsha-Zhuzhou-Xiangtan City Group and Hengyang in the central-eastern part of Hunan Province, Yueyang in the northeastern part of the province, Changde in the northern part, and Yiyang in the north-central part of the province. Woodland expanded the most under the EP, mainly at the edges of croplands in the central and western parts of the province and in the cropland margins inside the forest. The expansion was greater, mainly in the east-central and southern parts of Hunan Province.
3.2. Dynamic Changes in Carbon Stock in Hunan Province from 2000 to 2035
3.2.1. Carbon Stock Dynamics from 2000 to 2020
To quantify the robustness of our total carbon stock estimations, we conducted a sensitivity analysis by perturbing the carbon density values of each land use type by ±10%. The calculated sensitivity indices (SC) for 2000, 2005, 2010, 2015, and 2020 are presented in Table 10. The results consistently show that for all land use types, the SC values are less than 1.0. This indicates that the total carbon stock estimation is generally inelastic to a ±10% variation in the carbon density of individual land use types. Specifically, water bodies consistently show an SC value of 1.0000, indicating a direct, proportional relationship between their carbon density and total carbon stock. Conversely, land use types such as woodland, construction land, and unused land consistently exhibit lower SC values (typically below 0.3 or 0.7 depending on the year), suggesting that the overall carbon stock is less sensitive to potential inaccuracies in their respective carbon density inputs. These findings underscore the relative stability of our carbon stock estimations despite inherent uncertainties in the input carbon density parameters.
Table 10.
Sensitivity Indices of Total Carbon Stock to Carbon Density Changes by Land Use Type (2000–2020).
The InVEST model was applied to estimate the carbon stock dynamics of the study area from 2000 to 2020. The overall changes in the spatial pattern of carbon stocks were relatively small. A spatial distribution pattern that is low in the north and south and high in the surrounding areas was shown by the carbon stock (Figure 4). The high values were mainly concentrated in the east, west, and south, which are largely composed of woodland with a strong carbon sequestration capacity. The average carbon density is higher than 265 t/ha. The low-value regions were largely distributed in the Dongting Lake area in northern Hunan and the cropland and waters in southwestern Hunan, where the cropland is mainly planted with crops. Its vegetation biocarbon content was relatively low. The production and farming methods may have led to the loss of soil organic carbon and erosion, thus reducing the carbon stock.

Figure 4.
Spatial distribution and change of carbon stocks from 2000 to 2035.
The total carbon stock of Hunan Province was 57.07 × 10⁸ t, 57.00 × 10⁸ t, 56.87 × 10⁸ t, 56.76 × 10⁸ t, and 56.61 × 10⁸ t in 2000, 2005, 2010, 2015, and 2020, respectively (Table 11). Carbon stocks in Hunan Province have displayed a gradual decline in the past two decades. There has been an overall decrease of 45.96 × 10⁶ t, representing a decrease of 0.81%. This might be influenced by factors such as alterations in forest resources, shifts in land use, and climate change. The carbon density in Hunan Province remained stable from 2000 to 2020, with fluctuations ranging from 0.3 to 0.7 tC/ha. This indicated that there was no significant change in the fixation efficiency of terrestrial ecosystems in Hunan Province for atmospheric CO2. From the carbon stock changes for the four carbon pool types, the trends for the four carbon pool types and the total carbon stock in Hunan Province during the 20-year period were more consistent. All of them exhibited a gradual decline, with the soil organic carbon stock suffering the most loss.
Table 11.
Carbon stock changes in Hunan Province during 2000–2020 (108 tC).
As shown in Figure 4a, the LULC types influenced the carbon stocks of cropland, woodland, and grassland in Hunan Province, which displayed fluctuations or reductions. There were obvious increasing trends in the carbon stock of water, construction land, and unused land. This illustrates the significant land use changes in Hunan Province during 2000–2020, mainly because of the accelerated urbanization process. This caused the decline of cropland, woodlands, and grasslands and the expansion of urban land use This land use change influences the carbon cycle and climate change strongly because carbon uptake and release capacities differ among different land use types. Woodlands and grasslands are carbon sinks that reduce the concentration of carbon dioxide in the atmosphere, whereas urban land is a carbon source that increases carbon dioxide emissions.
However, different time scales showed significant differences in the carbon stocks of each land type. The carbon stock of woodland increased from 2005 to 2010 but decreased from 2010 to 2020 among them. Meanwhile, the carbon stock of grassland also showed a decreasing trend during the 13th Five-Year Plan period for Hunan Province. As a result of speedy economic and social growth, the need for woodland and grassland resources is growing. The phenomenon of overexploitation of forest resources still exists, coupled with the degradation and loss of woodland from natural factors such as climate change, forest fires, and pests. The carbon stock and change rate of urban land increased significantly from 2000 to 2020. It increased from 17.76 × 10⁸ t to 36.27 × 10⁸ t, representing an increase of 104.20%. This is substantially higher than that of other land types. This may be because of the presence of many carbon stock carriers in urban land, such as artificial structures, landscaping, and solid waste. However, urban land has a relatively low carbon stock capacity and generates large amounts of greenhouse gas emissions. Therefore, it cannot fully offset the adverse impacts of urbanization on the carbon cycle and climate change.
The spatial distribution pattern of carbon stocks in Hunan Province exhibited significant spatial heterogeneity (Figure 4a). The regions with higher carbon stock were primarily located in the west, south, and east of Hunan in the study area, which had relatively high elevation, larger woodland area, and greater vegetation cover. The highest value for carbon density was 36.94 t/ha. The regions with lower carbon stock mainly occurred in the north of the Dongting Lake area, and Loudi, Shaoyang, Yongzhou, and Hengyang in the central Hunan area. Construction land and water areas were the dominant land use types, which had a large impact on human activities. The carbon stock stayed at a low level. As shown in Figure 4(a6), the regions with higher carbon stocks mainly occurred east of Chenzhou with grassland to woodland changes, north of Yueyang with water to cropland changes, south of Huaihua with cropland to woodland changes, and north of Huaihua with grassland to woodland changes during the 20-year period. The increased areas were mainly converted to woodland, which had a higher carbon density. The areas with decreasing carbon stocks were clustered in the Changsha–Zhuzhou–Xiangtan City Group including woodland and cropland changing to construction land, central Hengyang, and eastern Loudi. Meanwhile, other areas had different degrees of decreasing carbon stocks. The primary reason for this is the transformation of cropland and woodland into construction land. This indicates that urban expansion has severely encroached on more ecological land, resulting in a decrease in regional carbon stock.
Hunan Province experienced substantial land use changes during 2000–2020. The main features are the fast growth of urban land and the relative decline of other land types which will result in the reduction of carbon sinks or the rise of carbon sources. Different human activities will cause carbon from vegetation and soil to go into the atmosphere, thus reducing carbon stocks. Such land use changes have an important impact on carbon stock capacity and emission reduction efficiency and require considerable attention and focus.
3.2.2. Assessment of Carbon Stocks in 2035 Under Different Scenarios
Using the carbon module of the InVEST model, they simulated the carbon stocks in Hunan Province in 2035 for the four scenarios of NT, ED, EP, and SD. As illustrated in Figure 5, The carbon stock and density changes for the four scenarios were relatively minor. Except for the EP, the carbon stocks in the other three scenarios decreased compared to those in 2020.
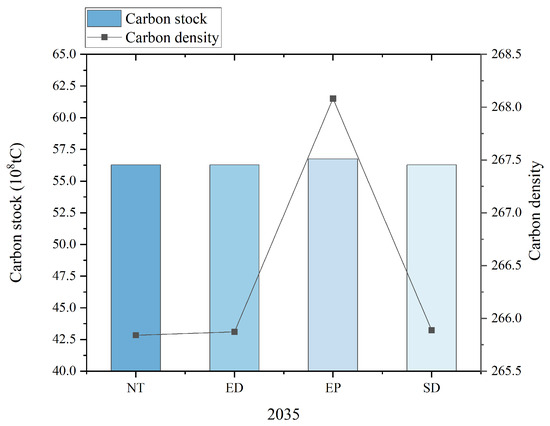
Figure 5.
Carbon stock and carbon density changes in 2035 for different scenarios.
The NT resulted in a total carbon stock of 56.27 × 10⁸ t, for Hunan Province in 2035, and the carbon density was 265.84 t/ha, which was 0.34 × 10⁸ t less than that in 2020. The carbon density decreased by 1.59 t/ha and the capacity of the regional carbon stock was severely reduced. Under the ED, the total carbon stock in Hunan Province in 2035 was 56.28 × 10⁸ t, and the carbon density was 265.87 t/ha, representing an overall decrease of 0.33 × 10⁸ t compared with 2020. Under the EP, the total carbon stock in 2035 was 56.75 × 10⁸ t and the carbon density was 268.08 t/ha, representing an increase of 0.14 t relative to 2020. Under the SD, the carbon stock in Hunan Province was 56.28 × 10⁸ t and the carbon density was 265.89 t/ha.
According to the carbon stock changes of different land use types (Figure 6), there were some differences in carbon stock changes under the four scenarios. Under the NT, ED, and SD, the carbon stock in water and construction land was projected to increase, and the carbon stock in other land types was projected to decrease. Meanwhile, under the EP, the carbon stock would grow in woodland and water, while it would shrink in other land use types.
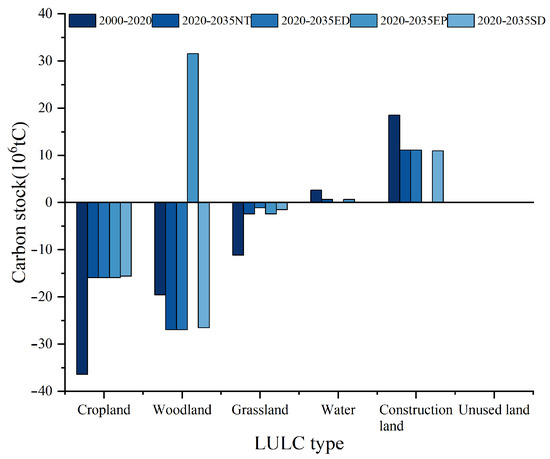
Figure 6.
Changes in carbon stock by land use type in 2035 compared with 2020 under four scenarios.
Relative to 2020, the NT would see the largest increase in carbon stock in construction land (11.08 × 10⁶ t), followed by water (0.63 × 10⁶ t), and the largest loss of carbon stock in woodland (−26.97 × 10⁸ t), followed by cropland (−15.90 × 10⁸ t). Under the ED, only the carbon stock in construction land would increase (11.08 × 10⁶ t), while water would remain unchanged. This was followed by woodland (−26.97 × 10⁸ t), cropland (−15.90 × 10⁸ t), grassland (−1.14 × 10⁸ t), and unused land (−0.05 × 10⁸ t) in the order of decreasing area. Under the EP, woodland had the highest increase in carbon stock (31.54 × 10⁸ t), followed by water (0.63 × 10⁸ t), cropland, grassland, and unused land, which decreased by 15.90 × 10⁸ t, 2.42 × 10⁸ t, and 0.05 × 10⁸ t, respectively. The changes in carbon stock for each land use type under the SD were consistent with the NT trend, but the magnitude of carbon stock change slowed down. Construction land and water were projected to increase by 10.95 × 10⁸ t, 0.12 × 10⁸ t. Woodland, cropland, and grassland decreased by 26.53 × 10⁸ t, 15.62 × 10⁸ t, and 1.51 × 10⁸ t, respectively.
Based on the spatial depiction of carbon stock (Figure 7), the distribution across the four scenarios in 2035 exhibits minimal variance compared to the 2020 conditions. In Hunan Province, high-value carbon stock regions are primarily concentrated in the forested mountainous areas of the west and south, notably including Xiangxi Prefecture, Zhangjiajie, Huaihua, Chenzhou, and Yongzhou. Conversely, the central and eastern plains and hilly areas manifest low-value carbon stock, predominantly occupied by construction land, water bodies, and farmland. The expansion areas are dispersed throughout the study region, witnessing farmland-to-forest conversions, while reductions primarily occur in the central and northern parts, transitioning farmland to construction land. Under the EP, carbon stock undergoes a notable increase, particularly transitioning from farmland edges to forests across most regions. Spatially, the EP exhibits the widest high-value carbon stock area, whereas the NT exhibits the widest low-value carbon stock area, with the ED and SD interposed. The variations among the scenarios suggest that the NT induces the most significant changes in carbon stock distribution, followed by the ED and SD, and lastly, the EP. This underscores the contribution of Hunan Province’s land use structure, particularly under ecological protection and development, to carbon sequestration, thereby facilitating the attainment of China’s carbon peak target.
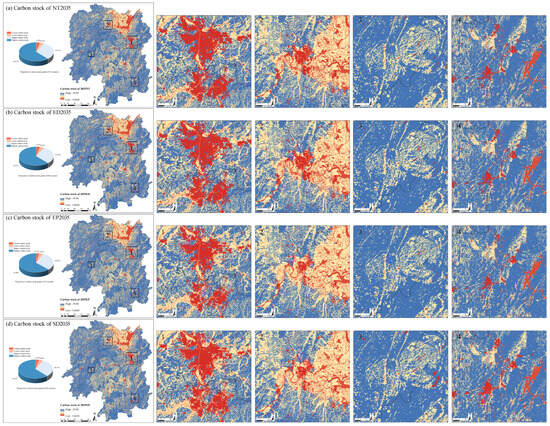
Figure 7.
Carbon stock spatial distribution for different scenarios in Hunan Province in 2035. (Numbers 1–4 denote typical representative areas selected within the study region).
Spatial heterogeneity characterized the carbon stocks for all four scenarios, and high-value areas were mainly located in high-altitude regions with more woodland and grassland. Low-value areas were mainly located in low-altitude regions with more construction land. Among them, the EP had the highest carbon stock, and the NT had the lowest. This revealed that carbon stock was significantly influenced by LULC changes, and policy intervention was an important tool for managing carbon stock. Therefore, to achieve low carbon development in the study area, a strategic land planning policy should be formulated to balance the relationship between ED and EP, sustainably increase the proportion of high-density land use, reduce the proportion of low-carbon density land use, and improve the carbon sink capacity.
The rates of carbon loss across the 14 prefectures and states in Hunan Province exhibited significant spatial variation under different development scenarios (Figure 8). The carbon stock loss rates in the study area in 2035 under the NT, ED, and SD were 2.24 × 10⁶ tC/a, 2.22 × 10⁶ tC/a, and 2.18 × 10⁶ tC/a, respectively. Meanwhile, under the EP, they increased at a rate of 0.92 × 10⁶ tC/a. Changsha and Xiangtan in the central part of the country had the highest rates of carbon stock loss, and Xiangxi had the lowest. The NT and ED resulted in the most significant carbon stock loss for Xiangtan and Changsha, exceeding 1%. Under the SD, Xiangtan and Changsha experienced the greatest loss of carbon stock, exceeding 1%. The SD had a growth rate of 0.92 × 10⁶ tC/a, with Changsha, Xiangtan, and Hengyang having the highest carbon stock loss. The EP generally had a more balanced carbon stock loss, with Chenzhou having the highest loss but at half the rate of the losses in the other scenarios.
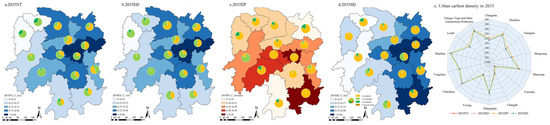
Figure 8.
Loss of urban carbon stock under different scenarios in 2020–2035. (Explanation: The pie chart illustrates the distribution of carbon stock across different land use types. Each color represents a specific category: woodland, cropland, grassland, and unused land. The size of each segment reflects its contribution to the total carbon stock).
In the NT and ED, the main drivers of carbon loss were the decreases in woodland and cropland, whereas the decreased cropland in the EP and SD led to the greatest carbon stock loss. The differences in carbon stock density (Figure 8e) among cities were also large, with relatively low urban carbon density in the Dongting Lake area and high carbon density in western and southern Hunan. EP contributes substantially to the increase in carbon stocks. Conversion of ecological land with high carbon to other land use types decreases vegetation and soil carbon stocks. Meanwhile, converting other land types to ecological land increased vegetation and soil carbon stocks [70] The simulation results provided a deeper understanding of how changes in land use influence regional carbon stocks, stressing the significant implications for future land planning and management in pursuing low-carbon development [71].
3.3. Spatial Differentiation and Driving Mechanisms of Carbon Stock
3.3.1. Identification of Optimal Parameters
The spatial resolution and discretization strategy play a critical role in the explanatory power of geographical detectors. In this study, a spatial scale of 5 km was adopted for the OPGD analysis. This choice was informed by previous studies that emphasize the need to balance spatial detail and statistical robustness when analyzing spatial heterogeneity at the provincial scale. For instance, Chen [72] and Zhang et al. [73] suggested that overly fine resolutions may introduce noise and reduce statistical reliability, while overly coarse grids may obscure local spatial variations. Considering the complex terrain of Hunan Province, the spatial resolution of available datasets, and the computational cost of multi-factor analysis, the 5 km scale was deemed appropriate for capturing spatial differentiation while maintaining analytical efficiency and data consistency. This resolution is also consistent with scales commonly used in regional OPGD applications, ensuring comparability and methodological alignment with existing studies.
Beyond the choice of spatial resolution, the ** discretization method and number of classes for each factor also significantly affect the q-values, which determine their explanatory strength (Figure 9). Considering the study area contains 14 types of soil, the number of classification intervals was set between 4 and 14. The optimal combination of classification method and class number was selected based on the highest q-value for each factor.
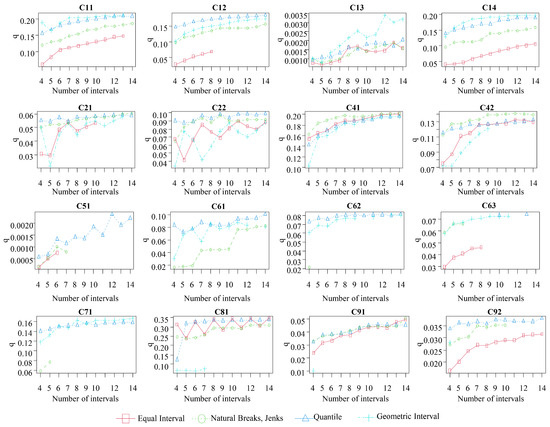
Figure 9.
Optimal spatial intervals of driving factors.
For slope (C12), mean annual temperature (C22), GDP (C61), per capita GDP (C62), and distance to roads (C92), the q-value was maximized when using the quantile method with 14 classes; thus, these five factors were assigned to 14 classes. For distance to water bodies (C51) and total nighttime light (C63), the q-value was maximized when the number of classes was set to 12 and 13, respectively. Similarly, using the geometric interval method, elevation (C11) and terrain roughness (C14) were assigned to 13 classes, while aspect (C13) and population distribution (C71) were divided into 12 and 14 classes, respectively. Annual precipitation (C21) was classified using the natural breaks method, net primary productivity (NPP) (C41), and distance to administrative centers (C91) into 14 classes and NDVI (C42) into 12 classes. The equal interval method was used to classify the comprehensive index of land use intensity (C81) into 14 classes.
These optimized parameter settings ensured that each factor was discretized in a way that maximized its explanatory contribution to the spatial heterogeneity of carbon stock, thereby improving the robustness of the OPGD results.
3.3.2. Detection of Dominant Factors
Using the OPGD model, 15 out of 17 driving factors, excluding aspect (C13) and distance to water bodies (C51), had p-values < 0.05, indicating significance in explaining the spatial distribution of carbon stocks in Hunan Province. The results of single-factor analysis (Figure 10) show that various factors had different levels of influence on regional carbon stock, ranked from greatest to least influence: comprehensive index of land use intensity (C81), elevation (C11), NPP (C41), terrain roughness (C14), slope (C12), population distribution (C71), NDVI (C42), GDP (C61), mean annual temperature (C22), soil type (C31), per capita GDP (C62), total nighttime light (C63), annual precipitation (C21), distance to administrative centers (C91), and distance to roads (C92). Among these, the comprehensive index of land use intensity (C81) exhibited a dominant influence on the carbon stock, showing an explanatory power of 0.345. This was followed by elevation (C11) and NPP (C41), showing explanatory powers of 0.2101 and 0.2008, respectively. These findings indicate that human disturbance levels have a significant effect on carbon stock levels. Additionally, regions with low land development intensity, high elevation, and strong ecosystem productivity tend to have higher carbon stock levels.
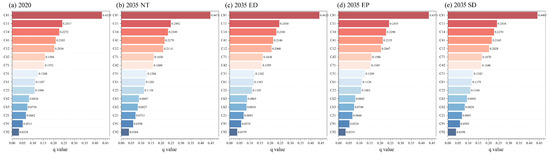
Figure 10.
Single factor detection results.
3.3.3. Analysis of Bi-Variable Interaction Mechanisms
The interaction detector results (Figure 11) indicated that various driving factors affect the carbon stock, in Hunan Province exhibited nonlinear and bi-variable enhancement trends. Specifically, there were 37 cases of nonlinear enhancement and 99 cases of bi-variable enhancement, indicating a significant synergistic effect between various factors in accounting for the spatial distribution of carbon stock. Of all the factors, the interaction between the comprehensive land use index (C81) and elevation (C11) demonstrated the highest level of bi-variable enhancement, with a q-value of 0.4758. The interaction of the comprehensive land use index (C81) with topographic relief (C14) was the second most significant, showing a q-value of 0.4741. Additionally, the interactions among the comprehensive land use index (C81) and NPP (C41), slope (C12), NDVI (C42), soil type (C31), and population distribution (C71) all had q-values > 0.4. Meanwhile, the interactions involving the comprehensive land use index (C81) with other factors all recorded q-values exceeding 0.35. Furthermore, when elevation (C11), topographic relief (C14), and NPP (C41) were individually tested in combination with other factors, the q-values consistently exceeded 0.2. Hence, The interaction of socioeconomic and natural factors, along with locational conditions, plays a crucial role in influencing carbon stock levels. Therefore, when analyzing the spatial distribution of carbon stock, the combined influences of multiple factors must be considered rather than focusing solely on individual factors.
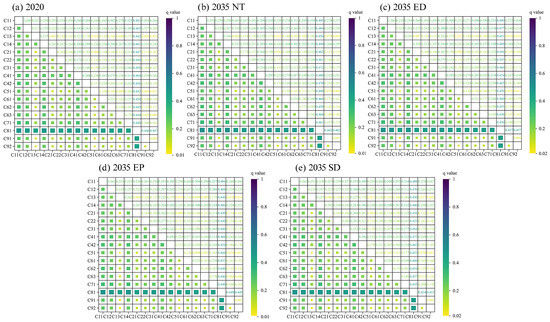
Figure 11.
Interactive detection results of factors.
4. Discussion
4.1. Advancing Understanding of Spatial Drivers of Carbon Stocks: Insights from OPGD Modeling
In the analysis of the factors driving carbon stock changes in Hunan Province, the results from the OPGD model analysis revealed the dominant roles of the land use intensity index (C81) from the socioeconomic factors and elevation (C11) and NPP (C41) from the natural factors. These findings align with the previous studies [74], yet our study goes a step further by uncovering how these drivers operate in a region-specific and synergistic manner. The land use intensity index (C81) demonstrated the highest explanatory power in the single-factor analysis, indicating that anthropogenic activities are the primary force shaping regional carbon stock. In Hunan’s context, rapid urbanization, driven by its large and growing population (over 66 million) and substantial economic development (with GDP growth and industrial transformation), has led to high-intensity land use, particularly around its major cities and plains. This transformation often results in the conversion of carbon-rich ecosystems (e.g., forests and wetlands) into built-up land, directly impacting the regional carbon stock.
The significant explanatory power of elevation (C11) and NPP (C41) highlights the spatial stratification of carbon distribution influenced by natural topographic and climatic gradients. For example, in mountainous regions of western and southern Hunan, where elevation is higher and human intervention is limited, carbon stock levels are markedly higher due to more stable, mature vegetative communities [75]. However, our findings reveal that this is not simply a passive effect of topography: elevation’s interaction with land use intensity shows a synergistic enhancement, suggesting that natural terrain modifies the degree to which anthropogenic land use impacts carbon stock, especially in transitional zones where development meets ecologically sensitive areas. Consequently, in the context of ecological protection and carbon management in Hunan Province, attention should be focused on high-altitude areas and regions with high ecosystem productivity to maintain and enhance carbon stock in these areas.
Furthermore, the interaction detection results showed that nonlinear-enhance and bi-variable enhance effects were significant, particularly the 99 pairs of bi-variable enhance interactions, indicating widespread synergistic effects among the driving factors, considerably increasing the explanatory strength regarding the spatial distribution of carbon stock. The interaction of the land use intensity index (C81) with elevation (C11) displayed the highest explanatory strength, consistent with previous studies [76,77]. This confirms that in Hunan’s diverse terrain, carbon stock cannot be fully explained by isolated variables. Instead, the results emphasize a more nuanced structure where, for instance, urban development in ecologically productive zones (e.g., peri-urban forest fringes) triggers amplified carbon loss, while development in less productive or steep-slope areas results in relatively moderate impacts due to inherent biophysical constraints.
These complex interplays suggest that land use acts not only as a driver but also as a key mediator, linking human-induced socioeconomic changes with underlying natural constraints. For instance, in low-altitude regions with intense construction activity, carbon stock declines sharply despite favorable climatic conditions, indicating that land use change overrides the natural carbon potential of such regions. Conversely, in high-altitude woodlands, where human activity is constrained, land use change serves as a stabilizing mediator, reinforcing the natural carbon storage capacity.
Therefore, our findings extend the conventional understanding of carbon-stock drivers by emphasizing the mediating role of land use patterns, which shape how both anthropogenic and ecological processes jointly influence carbon dynamics. This offers new insights into carbon management strategies tailored to region-specific socio-ecological contexts, particularly for mountainous, ecologically rich provinces like Hunan.
The results also reflect the substantial impact of demographic and socio-economic changes on LULC dynamics. In Hunan, continuous population growth, urban expansion, and infrastructure development have intensified land use, particularly in lowland and peri-urban areas. These human-driven changes have not only accelerated the conversion of ecological land to construction land but also amplified regional differences in carbon stock distribution. The inclusion of variables such as population density and GDP in our model helped capture these socio-economic influences and revealed their significant role in shaping both spatial and temporal patterns of land use and carbon stock.
4.2. The Role of Woodlands in Regional Carbon Dynamics
This study predicted the LULC changes and carbon stock in 2035 under four scenarios. Comparing the simulation results showed that in the future ep, Hunan Province’s carbon stock is projected to rise due to the expansion of ecological land. Meanwhile, it would decrease owing to the larger urban expansion under the NT, ED, and SD. Such results corroborate the conclusions drawn by earlier studies [78,79], highlighting the reliability of the findings. The spatial distribution of carbon stock revealed lower levels in the northern (e.g., Dongting Lake Plain, a major agricultural and developed area) and southern regions (characterized by more dispersed development and specific agricultural land uses), with higher concentrations in the surrounding areas. This can be attributed to the substantial quantity of woodland and grassland in high-altitude and construction land in low-altitude regions [80]. Hence, the alteration in carbon stock caused by land use changes was contingent upon the carbon density of various land use categories. Meanwhile, various factors, including the climate, soil, vegetation, and terrain, influence the carbon density. The main determinants of terrestrial vegetation productivity and community composition are climate and topography [81], which affect vegetation growth and soil carbon sequestration potential [82].
In Hunan Province, the integration of LULC coupling models has shed light on the dynamics of regional carbon stocks, underscoring the substantial contribution of woodlands to carbon sequestration. Given Hunan’s impressive forest coverage rate (over 59%), woodlands serve as essential natural carbon sinks, playing a crucial role in capturing atmospheric carbon dioxide and alleviating climate change effects within this rapidly developing region [83]. Trees capture carbon dioxide through photosynthesis, storing it in their biomass and soil, which enhances the overall carbon stock. The potential of woodlands to sequester carbon varies based on species, age, and geographical location, with new native woodlands supporting biodiversity and sequestering carbon effectively [84]. In the current study, woodlands primarily underwent transitions between woodland, cropland, and construction land. The observed loss of cropland and woodland areas, paired with a considerable increase in construction land, is particularly challenging for Hunan, given its high population density and ongoing urbanization pressures. However, Woodlands remains the primary carbon sink in the region.
The transfer matrix method was employed to examine land use changes between 2000 and 2020, along with the MOP–PLUS–InVEST model was essential for assessing and forecasting the dynamics of carbon stocks related to land use. The findings indicate that under the EP, carbon stocks in Hunan Province exhibit an increasing trend, with the sharpest decrease occurring in the NT. This complex influence of LULC changes on carbon stock under different scenarios highlights the necessity for strategic land management and policy interventions. By optimizing land use structures and promoting low-carbon development, particularly through the protection and expansion of its extensive forest resources, regions like Hunan can significantly contribute to climate change mitigation and achieving broader national carbon neutrality goals. Hence, this study’s findings present an essential insight for policymakers to encourage land management changes that favor woodland conservation and expansion within Hunan’s specific development trajectory.
In conclusion, the integrated modeling approach adopted in this study delivers a thorough analysis of how land use dynamics affect carbon stock fluctuations. It further emphasizes the indispensable role of woodlands in carbon neutrality pathways, serving as a scientific foundation for sound decisions in sustainable land use and environmental governance. As the world strives for carbon neutrality, the experiences of Hunan Province’s woodlands can serve as a valuable reference for other regions seeking to balance ecological protection with sustainable development.
4.3. Practical Implications for Carbon Management and Land Use Planning
This study provides several practical implications for carbon management and land-use planning, particularly relevant to Hunan Province and other rapidly urbanizing regions facing ecological and developmental trade-offs.
First, the identification of high-altitude woodlands and areas with high net primary productivity (NPP) as major carbon stock zones highlights the importance of prioritizing these regions in ecological conservation policies. In Hunan, mountainous areas with rich woodland cover serve as key ecological buffers. Policymakers should consider incorporating such zones into ecological redlines or protected areas to safeguard their long-term carbon sequestration capacity.
Second, the significant interaction between land use intensity and natural factors such as elevation and NPP suggests that carbon-oriented planning should adopt an integrated, multi-factor approach. For regions like Hunan—where rapid urbanization intersects with ecologically sensitive zones—land development projects should be evaluated not only for economic benefits but also for their potential impact on regional carbon stocks. This calls for zoning regulations that account for both development intensity and ecological value, helping to balance growth with environmental sustainability.
Third, scenario-based simulations show that ecological protection-oriented pathways are most effective in maintaining or enhancing carbon stocks. In Hunan, projected declines under business-as-usual or development-driven scenarios emphasize the need for stronger ecological safeguards. Local governments can use these projections to support low-carbon spatial planning, including the promotion of compact urban forms, reforestation of degraded lands, and the restriction of urban expansion into high-carbon-value ecosystems.
Finally, the integrated modeling framework used in this study—combining MOP-PLUS, InVEST, and spatial regression analysis—offers a replicable tool for land-use optimization in support of climate goals. This approach can be adapted by regional planners in other contexts to simulate land-use impacts on carbon storage, evaluate policy alternatives, and inform climate-resilient territorial development strategies.
In summary, the results contribute to a deeper understanding of land-use–carbon dynamics and provide actionable insights to guide climate-informed land governance. As China and other countries advance toward carbon neutrality, the experience of Hunan Province can serve as a reference for aligning ecological protection with sustainable spatial planning.
4.4. Limitations and Perspectives
This study simulated the impact of LULC changes on carbon stock by coupling MOP-PLUS with the InVEST model and successfully revealed the driving mechanisms of carbon stock changes through the OPGD model. This provides a more comprehensive explanation of spatial differentiation mechanisms, reveals complex spatial differentiation patterns, and improves the robustness of the results. There remain several limitations in the current research field of land spatial optimization under low-carbon targets.
First, land use change simulations predominantly rely on historical data and static expert assessments, which often overlook nonlinear impacts from policy shifts, technological advancements, and socio-economic disruptions [85]. This is a common limitation across the field, as the inability to anticipate sudden changes reduces the predictive power and policy relevance of the models. Future research should focus on incorporating dynamic policy feedback mechanisms and integrating advanced technologies [86], such as big data and artificial intelligence, to build more responsive simulation frameworks that can account for unforeseen events and rapid shifts. Second, the accuracy of carbon stock estimation remains a significant challenge, primarily due to the reliance on pre-existing carbon density data. The absence of real-time, comprehensive field survey data limits the precision of carbon stock predictions, especially when accounting for spatial heterogeneity and temporal dynamics. In terms of future scenario simulations, research should adopt more comprehensive predictive approaches to enhance the adaptability and accuracy of models. Beyond conventional scenario analysis, incorporating complex models such as system dynamics models could provide a more holistic understanding of LULC and carbon stock changes under different scenarios. System dynamics models can account for dynamic feedback loops and nonlinear relationships between variables, enabling more precise control of variables in terms of quantity and spatial distribution. This would result in more accurate simulations of carbon stock variations under future scenarios. Additionally, integrating other predictive methodologies, such as machine learning algorithms or game theory models, could further optimize scenario analysis, improving both the robustness and flexibility of future predictions [87,88]. In conclusion, while this study makes valuable progress in land-use optimization and carbon stock management, future research must focus on advancing model precision, data integration, and scenario analysis to better support low-carbon development and sustainable land-use planning.
5. Conclusions
Enhancing carbon stock is critical for promoting low-carbon development and addressing global climate change. Under the dual-carbon target, integrating LULC simulation with carbon stock assessment provides valuable scientific insights. However, the driving mechanisms of carbon stock spatial variation remain insufficiently understood. Based on LULC changes and scenario simulations, this study systematically explored the spatial distribution patterns of carbon stock in the central-southern hilly mountain region, predicted the spatiotemporal distribution of carbon stock over the next 15 years, and comprehensively identified the main influencing factors and their interactions using the OPGD model. These findings offer essential references for balancing low-carbon goals with economic development and achieving sustainable development.
The main findings are as follows: (1) Over the past 20 years, Hunan Province has experienced significant land-use transformation characterized by rapid urban expansion accompanied by reductions in cropland, forestland, and grassland areas. This transformation resulted in a decline in carbon sequestration capacity, with carbon stock decreasing from 5.707 billion tons in 2000 to 5.661 billion tons in 2020, representing a net loss of 45.96 million tons. This trend highlights the negative impact of land-use transitions on maintaining carbon stocks and implementing emission reduction strategies, necessitating targeted measures. (2) Carbon stock exhibited significant spatial heterogeneity, and different LULC scenarios significantly influenced its distribution. Under the EP, areas with high carbon stock were the most widespread, whereas the NT demonstrated the most pronounced low-carbon stock regions. The ED and SD produced results between these two extremes. Generally, high-carbon stock areas were concentrated in high-altitude regions with dense forests and grasslands, while low-carbon stock areas were mainly located in urbanized, low-altitude regions characterized by rapid development. (3) The OPGD model revealed that the spatial distribution of carbon stock was primarily driven by natural topographic factors such as slope and topographic relief, as well as human activity factors such as population distribution and land-use intensity. Among these, the Land Use Comprehensive Index (C81), elevation (C11), and net primary productivity (NPP, C41) emerged as dominant factors influencing carbon stock spatial variation. Interaction analysis further emphasized the crucial role of the synergistic effects between natural and socioeconomic factors. For instance, the interaction between the Land Use Comprehensive Index and elevation significantly enhanced carbon stock levels, underscoring the importance of coordinated land-use planning and ecological conservation strategies.
In conclusion, this study demonstrates that carbon stock formation is driven by the combined effects of multiple natural and anthropogenic factors, displaying significant spatial heterogeneity and scenario-based differences. Under the NT, natural topographic factors exert stronger influences, whereas the ED reveals intensified negative impacts of human activities on carbon stock. The EP effectively amplifies the positive effects of natural factors, while the SD strikes a balance between ecological conservation and economic development.
Author Contributions
Conceptualization, Y.Z.; methodology, Y.Z. and J.T.; software, Y.Z.; validation, Y.Z., J.T., and Z.L.; formal analysis, Q.L. (Qian Li) and X.H.; investigation, J.T.; resources, Y.Z.; data curation, Y.Z.; writing—original draft preparation, Y.Z.; writing—review and editing, Y.Z. and Q.L. (Qizhen Li), X.H. and C.C.; visualization, Z.L.; supervision, X.H. and C.C.; funding acquisition, Q.L. (Qizhen Li), X.H. and C.C. All authors have read and agreed to the published version of the manuscript.
Funding
This research was funded by the Key Disciplines of State Forestry Administration of China, grant number 21 of Forest Ren Fa, 2016; Hunan Province “Double First-Class” Cultivation discipline of China, grant number 469 of Xiang Jiao Tong, 2018; Hunan Provincial Graduate Scientific Research and Innovation Project, grant number CX20240713; The Scientific research project of the Hunan Provincial Department of Education, P.R. China (Project No. 23A0199); Teaching reform research project of Central South University of Forestry Technology, P.R. China (No. 61 [2023]ZNLF).
Institutional Review Board Statement
Not applicable.
Informed Consent Statement
Not applicable.
Data Availability Statement
Data are contained within the article.
Acknowledgments
The authors would like to thank the editor and reviewers of the manuscript for their thoughtful and helpful comments. Supported by the Scientific Innovation Fund for Post-graduates of Central South University of Forestry and Technology.
Conflicts of Interest
The authors declare no conflicts of interest.
References
- Zaehle, S.; Bondeau, A.; Carter, T.R.; Cramer, W.; Erhard, M.; Prentice, I.C.; Reginster, I.; Rounsevell, M.D.A.; Sitch, S.; Smith, B.; et al. Projected Changes in Terrestrial Carbon Storage in Europe under Climate and Land-use Change, 1990–2100. Ecosystems 2007, 10, 380–401. [Google Scholar] [CrossRef]
- Kato, T.; Tang, Y.; Gu, S.; Cui, X.; Hirota, M.; Du, M.; Li, Y.; Zhao, X.; Oikawa, T. Carbon dioxide exchange between the atmosphere and an alpine meadow ecosystem on the Qinghai–Tibetan Plateau, China. Agric. For. Meteorol. 2004, 124, 121–134. [Google Scholar] [CrossRef]
- Foteinis, S.; Andresen, J.; Campo, F.; Caserini, S.; Renforth, P. Life cycle assessment of ocean liming for carbon dioxide removal from the atmosphere. J. Clean. Prod. 2022, 370, 133309. [Google Scholar] [CrossRef]
- Baumann, M.; Gasparri, I.; Piquer Rodríguez, M.; Gavier Pizarro, G.; Griffiths, P.; Hostert, P.; Kuemmerle, T. Carbon emissions from agricultural expansion and intensification in the Chaco. Glob. Change Biol. 2017, 23, 1902–1916. [Google Scholar] [CrossRef] [PubMed]
- Han, X.; Gao, G.; Chang, R.; Li, Z.; Ma, Y.; Wang, S.; Wang, C.; Lü, Y.; Fu, B. Changes in soil organic and inorganic carbon stocks in deep profiles following cropland abandonment along a precipitation gradient across the Loess Plateau of China. Agric. Ecosyst. Environ. 2018, 258, 1–13. [Google Scholar] [CrossRef]
- Dondini, M.; Martin, M.; De Camillis, C.; Uwizeye, A.; Soussana, J.; Robinson, T.; Steinfeld, H. Global Assessment of Soil Carbon in Grasslands: From Current Stock Estimates to Sequestration Potential; FAO Animal Production and Health Paper, 187; FAO: Rome, Italy, 2023. [Google Scholar]
- Piao, S.; Huang, M.; Liu, Z.; Wang, X.; Ciais, P.; Canadell, J.G.; Wang, K.; Bastos, A.; Friedlingstein, P.; Houghton, R.A. Lower land-use emissions responsible for increased net land carbon sink during the slow warming period. Nat. Geosci. 2018, 11, 739–743. [Google Scholar] [CrossRef]
- Li, Y.; Geng, H. Spatiotemporal trends in ecosystem carbon stock evolution and quantitative attribution in a karst watershed in southwest China. Ecol. Indic. 2023, 153, 110429. [Google Scholar] [CrossRef]
- Di Matteo, G.; Luzzi, G.; Basile, A.; Sposato, A.; Bertini, G.; Neri, U.; Pennelli, B.; Napoli, R.; Nardi, P. Carbon concentrations and carbon storage capacity of three old-growth forests in the Sila National Park, Southern Italy. J. For. Res. 2023, 34, 233–242. [Google Scholar] [CrossRef]
- Ren, S.; Wang, T.; Guenet, B.; Liu, D.; Cao, Y.; Ding, J.; Smith, P.; Piao, S. Projected soil carbon loss with warming in constrained Earth system models. Nat. Commun. 2024, 15, 102. [Google Scholar] [CrossRef]
- Ewing, P.M.; Tu, X.; Runck, B.C.; Nord, A.; Chikowo, R.; Snapp, S.S. Smallholder farms have and can store more carbon than previously estimated. Glob. Change Biol. 2023, 29, 1471–1483. [Google Scholar] [CrossRef]
- Andriamananjara, A.; Hewson, J.; Razakamanarivo, H.; Andrisoa, R.H.; Ranaivoson, N.; Ramboatiana, N.; Razafindrakoto, M.; Ramifehiarivo, N.; Razafimanantsoa, M.; Rabeharisoa, L. Land cover impacts on aboveground and soil carbon stocks in Malagasy rainforest. Agric. Ecosyst. Environ. 2016, 233, 1–15. [Google Scholar] [CrossRef]
- Liu, X.; Wang, S.; Wu, P.; Feng, K.; Hubacek, K.; Li, X.; Sun, L. Impacts of urban expansion on terrestrial carbon storage in China. Environ. Sci. Technol. 2019, 53, 6834–6844. [Google Scholar] [CrossRef] [PubMed]
- Liu, B.; Zhang, L.; Lu, F.; Deng, L.; Zhao, H.; Luo, Y.; Liu, X.; Zhang, K.; Wang, X.; Liu, W. Methodology for accounting the net mitigation of China’s ecological restoration projects (CANM-EP). Methodsx 2019, 6, 1753–1773. [Google Scholar] [CrossRef] [PubMed]
- Houghton, R.A. The annual net flux of carbon to the atmosphere from changes in land use 1850–1990. Tellus B 1999, 51, 298–313. [Google Scholar] [CrossRef]
- Tong, X.; Wang, K.; Yue, Y.; Brandt, M.; Liu, B.; Zhang, C.; Liao, C.; Fensholt, R. Quantifying the effectiveness of ecological restoration projects on long-term vegetation dynamics in the karst regions of Southwest China. Int. J. Appl. Earth Obs. 2017, 54, 105–113. [Google Scholar] [CrossRef]
- Zhao, M.; He, Z.; Du, J.; Chen, L.; Lin, P.; Fang, S. Assessing the effects of ecological engineering on carbon storage by linking the CA-Markov and InVEST models. Ecol. Indic. 2019, 98, 29–38. [Google Scholar] [CrossRef]
- Sitch, S.; Smith, B.; Prentice, I.C.; Arneth, A.; Bondeau, A.; Cramer, W.; Kaplan, J.O.; Levis, S.; Lucht, W.; Sykes, M.T. Evaluation of ecosystem dynamics, plant geography and terrestrial carbon cycling in the LPJ dynamic global vegetation model. Glob. Change Biol. 2003, 9, 161–185. [Google Scholar] [CrossRef]
- Ni, J. Carbon storage in Chinese terrestrial ecosystems: Approaching a more accurate estimate. Clim. Change 2013, 119, 905–917. [Google Scholar] [CrossRef]
- Zhou, T.; Shi, P. Indirect Impacts of Land Use Change on Soil Organic Carbon Change in China. Adv. Earth Sci. 2006, 21, 138. [Google Scholar]
- Gao, Z.; Liu, J.; Cao, M.; Li, K.; Tao, B. Impacts of land-use and climate changes on ecosystem productivity and carbon cycle in the cropping-grazing transitional zone in China. Sci. China Ser. D Earth Sci. 2005, 48, 1479–1491. [Google Scholar] [CrossRef]
- Babbar, D.; Areendran, G.; Sahana, M.; Sarma, K.; Raj, K.; Sivadas, A. Assessment and prediction of carbon sequestration using Markov chain and InVEST model in Sariska Tiger Reserve, India. J. Clean. Prod. 2021, 278, 123333. [Google Scholar] [CrossRef]
- Gong, W.; Duan, X.; Mao, M.; Hu, J.; Sun, Y.; Wu, G.; Zhang, Y.; Xie, Y.; Qiu, X.; Rao, X. Assessing the impact of land use and changes in land cover related to carbon storage by linking trajectory analysis and InVEST models in the Nandu River Basin on Hainan Island in China. Front. Environ. Sci. 2022, 10, 1038752. [Google Scholar] [CrossRef]
- Ke, X.; Tang, L. Impact of cascading processes of urban expansion and cropland reclamation on the ecosystem of a carbon storage service in Hubei Province, China. Acta Ecol. Sin. 2019, 39, 672–683. [Google Scholar]
- He, X.; Xu, Y.; Fan, X.; Geng, Q.; Tian, Z. Temporal and spatial variation and prediction of regional carbon storage in Zhongyuan Urban Agglomeration. China Environ. Sci. 2022, 42, 2965–2976. [Google Scholar]
- Qing, M.; Zhao, J.; Feng, C.; Huang, Z.H.; Wen, Y.Y.; Zhang, W.J. Response of ecosystem carbon storage service to land-use change in Shiyang River Basin from 1980 to 2030. Acta Ecol. Sin. 2022, 42, 9525–9536. [Google Scholar]
- Liu, Y.; Zhang, J.; Zhou, D.M.; Ma, J.; Dang, R.; Ma, J.J.; Zhu, X.Y. Temporal and spatial variation of carbon storage in the Shule River Basin based on InVEST model. Acta Ecol. Sin. 2021, 41, 4052–4065. [Google Scholar]
- Wang, J.F.; Li, X.H.; Christakos, G.; Liao, Y.L.; Zhang, T.; Gu, X.; Zheng, X.Y. Geographical detectors-based health risk assessment and its application in the neural tube defects study of the Heshun Region, China. Int. J. Geogr. Inf. Sci. 2010, 24, 107–127. [Google Scholar] [CrossRef]
- Song, Y.Z.; Wang, J.F.; Ge, Y.; Xu, C.D. An optimal parameters-based geographical detector model enhances geographic characteristics of explanatory variables for spatial heterogeneity analysis: Cases with different types of spatial data. GISci Remote Sens. 2020, 57, 593–610. [Google Scholar] [CrossRef]
- Liang, X.; Guan, Q.; Clarke, K.C.; Liu, S.; Wang, B.; Yao, Y. Understanding the drivers of sustainable land expansion using a patch-generating land use simulation (PLUS) model: A case study in Wuhan, China. Comput. Environ. Urban Syst. 2021, 85, 101569. [Google Scholar] [CrossRef]
- Cao, S.; Jin, X.; Yang, X.; Sun, R.; Liu, J.; Han, B.; Xu, W.; Zhou, Y. Coupled MOP and GeoSOS-FLUS models research on optimization of land use structure and layout in Jintan district. J. Nat. Resour. 2019, 34, 1171. [Google Scholar] [CrossRef]
- Chen, Y.; Zhang, L.; He, L.; Men, M. Multi-scenario simulation of land-use structure based on dual combined model. Acta Ecol. Sin. 2016, 36, 5391–5400. [Google Scholar]
- Li, Y.; Yao, S.; Jiang, H.; Wang, H.; Ran, Q.; Gao, X.; Ding, X.; Ge, D. Spatial-Temporal Evolution and Prediction of Carbon Storage: An Integrated Framework Based on the MOP–PLUS–InVEST Model and an Applied Case Study in Hangzhou, East China. Land 2022, 11, 2213. [Google Scholar] [CrossRef]
- Li, P.; Chen, J.; Li, Y.; Wu, W. Using the InVEST-PLUS model to predict and analyze the pattern of ecosystem carbon storage in Liaoning Province, China. Remote Sens. 2023, 15, 4050. [Google Scholar] [CrossRef]
- State Council of the People’s Republic of China. The Fourteenth Five-Year Plan for the National Economic and Social Development of the People’s Republic of China and the Outline of the Long-Range Goals to 2035; State Council: Beijing, China, 2021. Available online: http://www.gov.cn/xinwen/2021-03/13/content_5592681.htm (accessed on 6 July 2024).
- Zhou, Y.; Yu, Z.; Zhao, S. Carbon storage and budget of major Chinese forest types. Chin. J. Plant Ecol. 2000, 24, 518. [Google Scholar]
- Lijun, C.; Gaohuan, L.; Xianfeng, F. Estimation of net primary productivity of terrestrial vegetation in China by remote sensing. J. Integr. Plant Biol. 2001, 43, 1191. [Google Scholar]
- Li, K.R.; Wang, S.; Mingkui, C. Vegetation and soil carbon stocks in China. Sci. Sin. Terrae (Ser. D) 2003, 33, 72–80. [Google Scholar]
- Chuai, X.; Huang, X.; Lai, L.; Wang, W.; Peng, J.; Zhao, R. Land use structure optimization based on carbon storage in several regional terrestrial ecosystems across China. Environ. Sci. Policy 2013, 25, 50–61. [Google Scholar] [CrossRef]
- Xiao-Huan, X.; Min, L.I.; Xiu-Zhi, Z.; Yan-Beng, Z.; De-Cun, Z.; Jian-Xin, Z.; Lei, D.; Yi, Y. Research on soil organic carbon distribution and change trend in middle east plain and its vicinity in China. Earth Sci. Front. 2013, 20, 154. [Google Scholar]
- Xianli, X.; Bo, S.; Huizhen, Z.; Zhongpei, L.; Anbo, L. Organic carbon density and storage in soils of China and spatial analysis. Acta Pedol. Sin. 2004, 41, 35–43. [Google Scholar]
- Newland, C.P.; Maier, H.R.; Zecchin, A.C.; Newman, J.P.; van Delden, H. Multi-objective optimisation framework for calibration of Cellular Automata land-use models. Environ. Modell. Softw. 2018, 100, 175–200. [Google Scholar] [CrossRef]
- Hamel, P.; Chaplin-Kramer, R.; Sim, S.; Mueller, C. A new approach to modeling the sediment retention service (InVEST 3.0): Case study of the Cape Fear catchment, North Carolina, USA. Sci. Total Environ. 2015, 524, 166–177. [Google Scholar] [CrossRef] [PubMed]
- Natural Capital Project. InVEST 3.16.0a1. Stanford University, University of Minnesota, Chinese Academy of Sciences, The Nature Conservancy, World Wildlife Fund, Stockholm Resilience Centre and the Royal Swedish Academy of Sciences. 2025. Available online: https://natcap.github.io/invest.release-metadata/3.16.0.html (accessed on 4 June 2025).
- Guo, P.; Wang, H.; Qin, F.; Miao, C.; Zhang, F. Coupled MOP and PLUS-SA Model Research on Land Use Scenario Simulations in Zhengzhou Metropolitan Area, Central China. Remote Sens. 2023, 15, 3762. [Google Scholar] [CrossRef]
- Yang, Y.; Wang, H.; Li, X.; Huang, X.; Lyu, X.; Tian, H.; Qu, T. How will ecosystem carbon sequestration contribute to the reduction of regional carbon emissions in the future? analysis based on the MOP-PLUS model framework. Ecol. Indic. 2023, 156, 111156. [Google Scholar] [CrossRef]
- Wang, Y.; Li, X.; Zhang, Q.; Li, J.; Zhou, X. Projections of future land use changes: Multiple scenarios-based impacts analysis on ecosystem services for Wuhan city, China. Ecol. Indic. 2018, 94, 430–445. [Google Scholar] [CrossRef]
- Zhang, Y.; Hu, X.; Wei, B.; Zhang, X.; Tang, L.; Chen, C.; Wang, Y.; Yang, X. Spatiotemporal exploration of ecosystem service value, landscape ecological risk, and their interactive relationship in Hunan Province, Central-South China, over the past 30 years. Ecol. Indic. 2023, 156, 111066. [Google Scholar] [CrossRef]
- Xie, G.D.; Zhen, L.; Lu, C.X.; Cao, S.Y.; Xiao, Y. Supply, consumption and valuation of ecosystem services in China. Resour. Sci. 2008, 30, 93–99. [Google Scholar]
- Costanza, R.; De Groot, R.; Sutton, P.; Van der Ploeg, S.; Anderson, S.J.; Kubiszewski, I.; Farber, S.; Turner, R.K. Changes in the global value of ecosystem services. Glob. Environ. Change 2014, 26, 152–158. [Google Scholar] [CrossRef]
- He, K.; Song, H.Y. China’s food security under the constraints of resources and environment: Connotation, challenges and policy orientation. J. Nanjing Agric. Univ. (Soc. Sci. Ed.) 2021, 21, 45–57. [Google Scholar]
- Zhang, J.; Ding, H.; Xu, J.; Zheng, B. A Simulation-Based Prediction of Land Use Change Impacts on Carbon Storage from a Regional Imbalance Perspective: A Case Study of Hunan Province, China. Land 2024, 13, 1721. [Google Scholar] [CrossRef]
- Yu, R.; Cheng, H.; Ye, Y.; Wang, Q.; Fan, S.; Li, T.; Wang, C.; Su, Y.; Zhang, X. Optimization of the Territorial Spatial Patterns Based on MOP and PLUS Models: A Case Study from Hefei City, China. Int. J. Environ. Res. Public Health 2023, 20, 1804. [Google Scholar] [CrossRef]
- Xiaojie, G.; Handong, G.; Chen, Z. Restoration of ecosystem and water resources conservation in forests and wetlands in Hunan Province. Hunan For. Sci. Technol. 2003, 1, 9–12. [Google Scholar]
- Wang, H.Y.; Gao, P.C.; Xie, Y.R.; Song, C.; Cheng, C.; Ye, S. Multi-objective optimization of land use in Xining City based on improve NSGA-Ⅱ. Geogr. Geo-Inf. Sci. 2020, 36, 84–89. [Google Scholar]
- Deb, K.; Pratap, A.; Agarwal, S.; Meyarivan, T. A fast and elitist multiobjective genetic algorithm: NSGA-II. IEEE T Evol. Comput. 2002, 6, 182–197. [Google Scholar] [CrossRef]
- Du, M.; Liu, C.; Wang, W.; Yang, H. Simulation of Ecological Risk in Beijing Using Mop-Plus Model. Int. Arch. Photogramm. Remote Sens. Spat. Inf. Sci. 2022, 48, 15–22. [Google Scholar] [CrossRef]
- Wang, R.; Zhao, J.; Lin, Y.; Chen, G.; Cao, Q.; Feng, Y. Land Change Simulation and Forest Carbon Storage of Central Yunnan Urban Agglomeration, China Based on SSP-RCP Scenarios. Forests 2022, 13, 2030. [Google Scholar] [CrossRef]
- Shuqi, L.; Xiaomeng, H.U.; Yuan, S.; Cai, Y.; Xin, Z. Multi-scenario land use change and its impact on carbon storage based on coupled Plus-Invest model. Chin. J. Eco-Agric. 2023, 31, 300–314. [Google Scholar]
- Jobbágy, E.G.; Jackson, R.B. The vertical distribution of soil organic carbon and its relation to climate and vegetation. Ecol. Appl. 2000, 10, 423–436. [Google Scholar] [CrossRef]
- Giardina, C.P.; Coleman, M.D.; Hancock, J.E.; King, J.S.; Lilleskov, E.A.; Loya, W.M.; Pregitzer, K.S.; Ryan, M.G.; Trettin, C.C. The Response of Belowground Carbon Allocation in Forests to Global Change; Springer: Berlin/Heidelberg, Germany, 2005; pp. 119–154. [Google Scholar]
- Huang, M.; Ji, J.J.; Cao, M.K.; Li, K.R. Modeling study of vegetation shoot and root biomass in China. Acta Ecol. Sin. 2006, 26, 4156–4163. [Google Scholar]
- Chen, G.S.; Yang, Y.S.; Xie, J.S.; Du, Z.; Zhang, J. Total belowground carbon allocation in China’s forests. Acta Ecol. Sin. 2007, 27, 5148–5157. [Google Scholar]
- Chen, G.; Yang, Y.; Liu, L.; Li, X.; Zhao, Y.; Yuan, Y. Research review on total belowground carbon allocation in forest ecosystems. J. Subtrop. Resour. Environ. 2007, 2, 34–42. [Google Scholar]
- Alam, S.A.; Starr, M.; Clark, B.J. Tree biomass and soil organic carbon densities across the Sudanese woodland savannah: A regional carbon sequestration study. J. Arid. Environ. 2013, 89, 67–76. [Google Scholar] [CrossRef]
- Tang, X.; Zhao, X.; Bai, Y.; Tang, Z.; Wang, W.; Zhao, Y.; Wan, H.; Xie, Z.; Shi, X.; Wu, B. Carbon pools in China’s terrestrial ecosystems: New estimates based on an intensive field survey. Proc. Natl. Acad. Sci. USA 2018, 115, 4021–4026. [Google Scholar] [CrossRef] [PubMed]
- Li, J.P.; Xia, S.X.; Yu, X.B.; Li, S.X.; Xu, C.; Zhao, N.; Wang, S.T. Evaluation of carbon storage on terrestrial ecosystem in Hebei province based on InVEST model. J. Ecol. Rural Environ. 2020, 36, 854–861. [Google Scholar]
- Eggleston, H.S.; Buendia, L.; Miwa, K.; Ngara, T.; Tanabe, K. (Eds.) IPCC Guidelines for National Greenhouse Gas Inventories; The National Greenhouse Gas Inventories Programme: Iges, Japan, 2006. [Google Scholar]
- Zhu, C.; Yuan, S.; Yang, L. Spatial optimization of land use pattern and trade-off analysis in Hangzhou City by coupling MOP and FLUS model. Trans. Chin. Soc. Agric. Eng. (Trans. Csae) 2023, 39, 235–244. [Google Scholar]
- Chuai, X.W.; Huang, X.J.; Zheng, Z.Q.; Zhang, M.; Liao, Q.; Lai, L.; Lu, J. Land use change and its influence on carbon storage of terrestrial ecosystems in Jiangsu Province. Resour. Sci. 2011, 33, 1932–1939. [Google Scholar]
- Walker, W.S.; Gorelik, S.R.; Cook-Patton, S.C.; Baccini, A.; Farina, M.K.; Solvik, K.K.; Ellis, P.W.; Sanderman, J.; Houghton, R.A.; Leavitt, S.M. The global potential for increased storage of carbon on land. Proc. Natl. Acad. Sci. USA 2022, 119, e2111312119. [Google Scholar] [CrossRef]
- Chen, G.; Peng, Q.; Fan, Q.; Lin, W.; Su, K. Spatial-Temporal Variation and Driving Forces of Carbon Storage at the County Scale in China Based on a Gray Multi-Objective Optimization-Patch-Level Land Use Simulation-Integrated Valuation of Ecosystem Services and Tradeoffs-Optimal Parameter-Based Geographical Detector Model: Taking the Daiyun Mountain’s Rim as an Example. Land 2025, 14, 14. [Google Scholar]
- Zhang, H.; Li, X.; Luo, Y.; Chen, L.; Wang, M. Spatial heterogeneity and driving mechanisms of carbon storage in the urban agglomeration within complex terrain: Multi-scale analyses under localized SSP-RCP narratives. Sustain. Cities Soc. 2024, 109, 105520. [Google Scholar] [CrossRef]
- Mengni, D.; Zhen, H.; Jun, H. Analysis of Influencing Factors of Carbon Storage Change in Pudong New Area of Shanghai; The Administration and Technique of Environmental Monitoring: Nanjing, China, 2024. [Google Scholar]
- Cornejo, N.S.; Becker, J.N.; Hemp, A.; Hertel, D. Effects of land-use change and disturbance on the fine root biomass, dynamics, morphology, and related C and N fluxes to the soil of forest ecosystems at different elevations at Mt. Kilimanjaro (Tanzania). Oecologia 2023, 201, 1089–1107. [Google Scholar] [CrossRef]
- Xinhui, J.; Yongqiang, C.; Jiaqi, Y.; Haoran, Z.; Jun, F. Land use and ecosystem carbon storage change and prediction in the Haihe River basin. South-North Water Transf. Water Sci. Technol. 2023, 5, 985–995. [Google Scholar]
- Mao, Y.F.; Zhou, Q.G.; Wang, T.; Luo, H.R.; Wu, L.J. Spatial-temporal Variation of Carbon Storage and Its Quantitative Attribution in the Three Gorges Reservoir Area Coupled With PLUS-InVEST Geodector Model. Resour. Environ. Yangtze Basin 2023, 32, 1042–1057. [Google Scholar]
- Zhu, L.; Song, R.; Sun, S.; Li, Y.; Hu, K. Land use/land cover change and its impact on ecosystem carbon storage in coastal areas of China from 1980 to 2050. Ecol. Indic. 2022, 142, 109178. [Google Scholar] [CrossRef]
- Tang, L.; Ke, X.; Zhou, T.; Zheng, W.; Wang, L. Impacts of cropland expansion on carbon storage: A case study in Hubei, China. J. Environ. Manag. 2020, 265, 110515. [Google Scholar] [CrossRef]
- Li, J.; Wang, J.; Li, L.; Zhou, C.; Niu, Q.; Zhang, C. Impact of land use change on carbon storage in the Dongting Lake eco-economic Zone. Chin. J. Ecol. 2022, 41, 1156–1165. [Google Scholar]
- Wang, C.Y.; He, N.P.; Lyu, Y.L. Latitudinal patterns and factors affecting different soil organic carbon fractions in the eastern forests of China. Acta Ecol. Sin. 2016, 36, 3176–3188. [Google Scholar]
- Li, M.; Shangguan, Z.; Deng, L. Spatial distribution of carbon storages in the terrestrial ecosystems and its influencing factors on the Loess Plateau. Acta Ecol. Sin. 2021, 41, 6786–6799. [Google Scholar]
- Manning, W.J.; Tiedemann, A.V. Climate change: Potential effects of increased atmospheric Carbon dioxide (CO2), ozone (O3), and ultraviolet-B (UV-B) radiation on plant diseases. Environ. Pollut. 1995, 88, 219–245. [Google Scholar] [CrossRef]
- Hernández-Alonso, H.; Madrigal-González, J.; Tornos-Estupiña, L.; Santiago-Rodríguez, A.; Alonso-Rojo, P.; Morera-Beita, A.; Silla, F. Tree-size heterogeneity modulates the forest age-dependent carbon density in biomass and top soil stocks on Mediterranean woodlands. Plant Soil. 2023, 486, 361–373. [Google Scholar] [CrossRef]
- Zhong, Y.; Zhang, X.; Yang, Y.; Xue, M. Optimization and Simulation of Mountain City Land Use Based on MOP-PLUS Model: A Case Study of Caijia Cluster, Chongqing. Isprs Int. J. Geo-Inf. 2023, 12, 451. [Google Scholar] [CrossRef]
- Zhu, W.; Zhang, J.; Cui, Y.; Zheng, H.; Zhu, L. Assessment of territorial ecosystem carbon storage based on land use change scenario: A case study in Qihe River Basin. Acta Geogr. Sin. 2019, 74, 446–459. [Google Scholar]
- Zou, W.T.; He, Y.J.; Ye, B.; Zhao, X.D.; Xu, D.Y.; Xiao, R.G.; Duan, Y.X. Study on carbon storage of ecosystem in Qianjiangyuan national park based on InVEST model. J. Cent. South. Univ. Technol. 2021, 41, 120–128. [Google Scholar]
- Chang, X.; Xing, Y.; Wang, J.; Yang, H.; Gong, W. Effects of land use and cover change (LUCC) on terrestrial carbon stocks in China between 2000 and 2018. Resour. Conserv. Recycl. 2022, 182, 106333. [Google Scholar] [CrossRef]

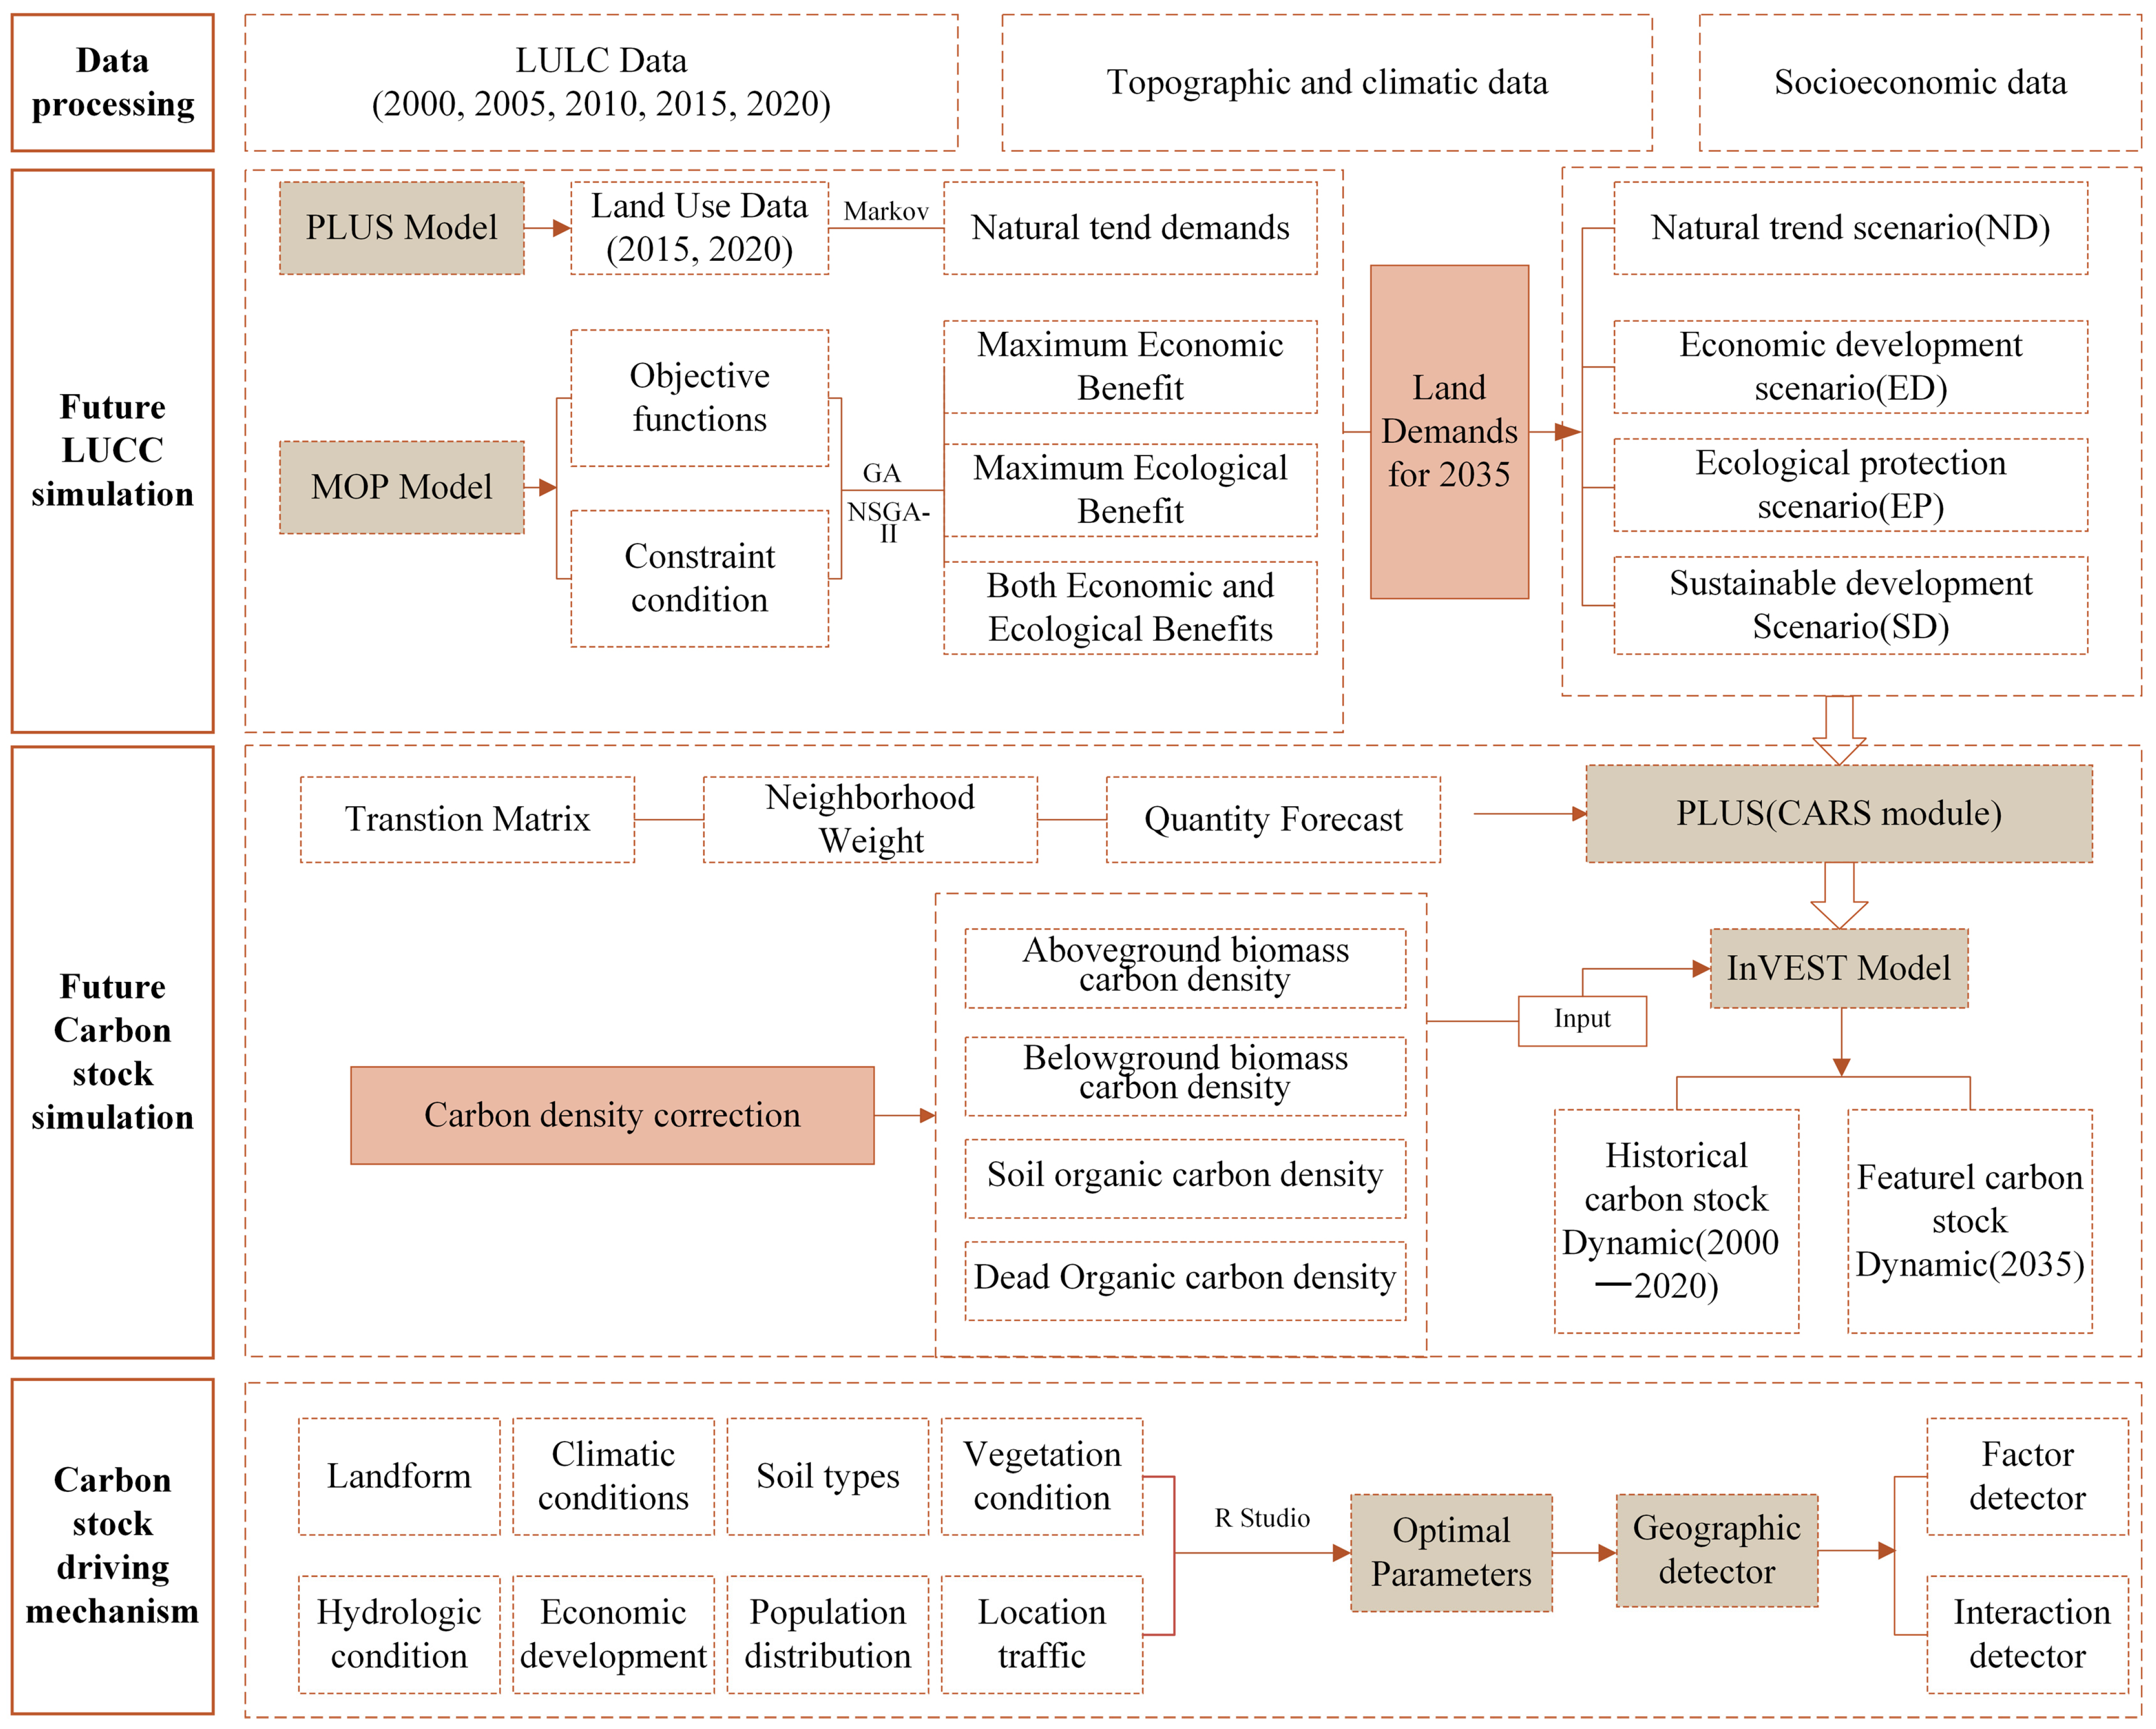
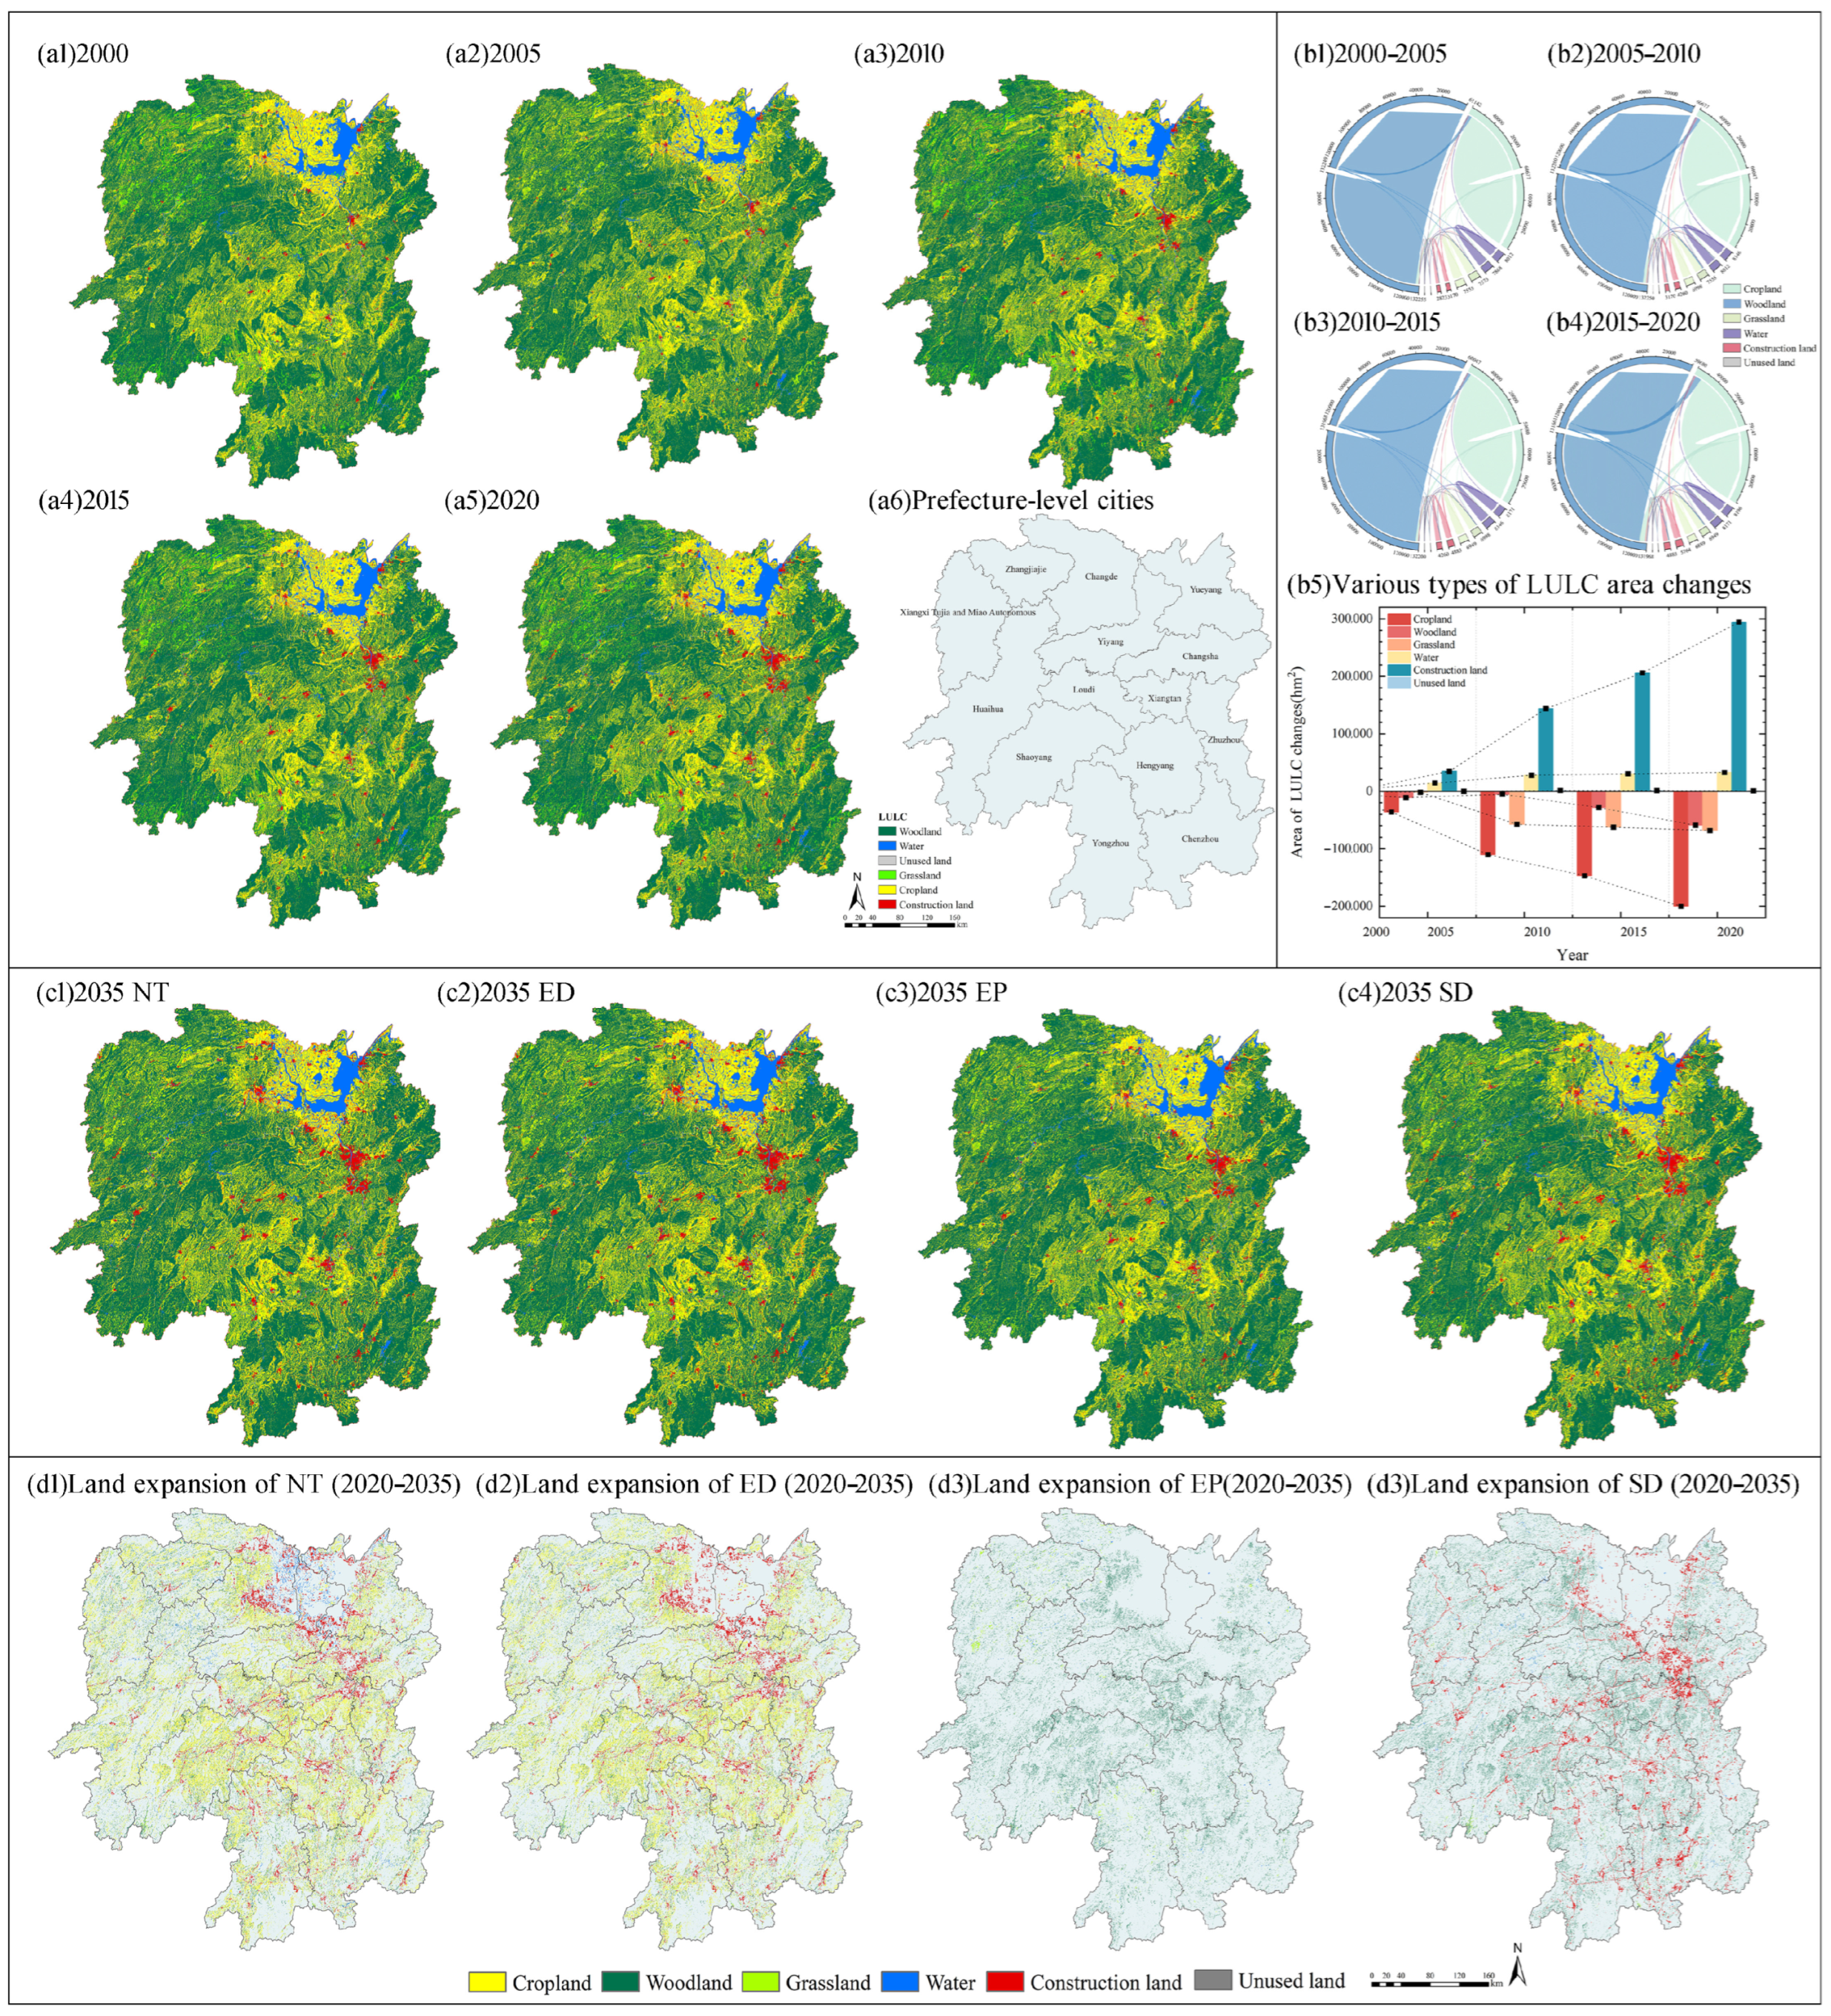
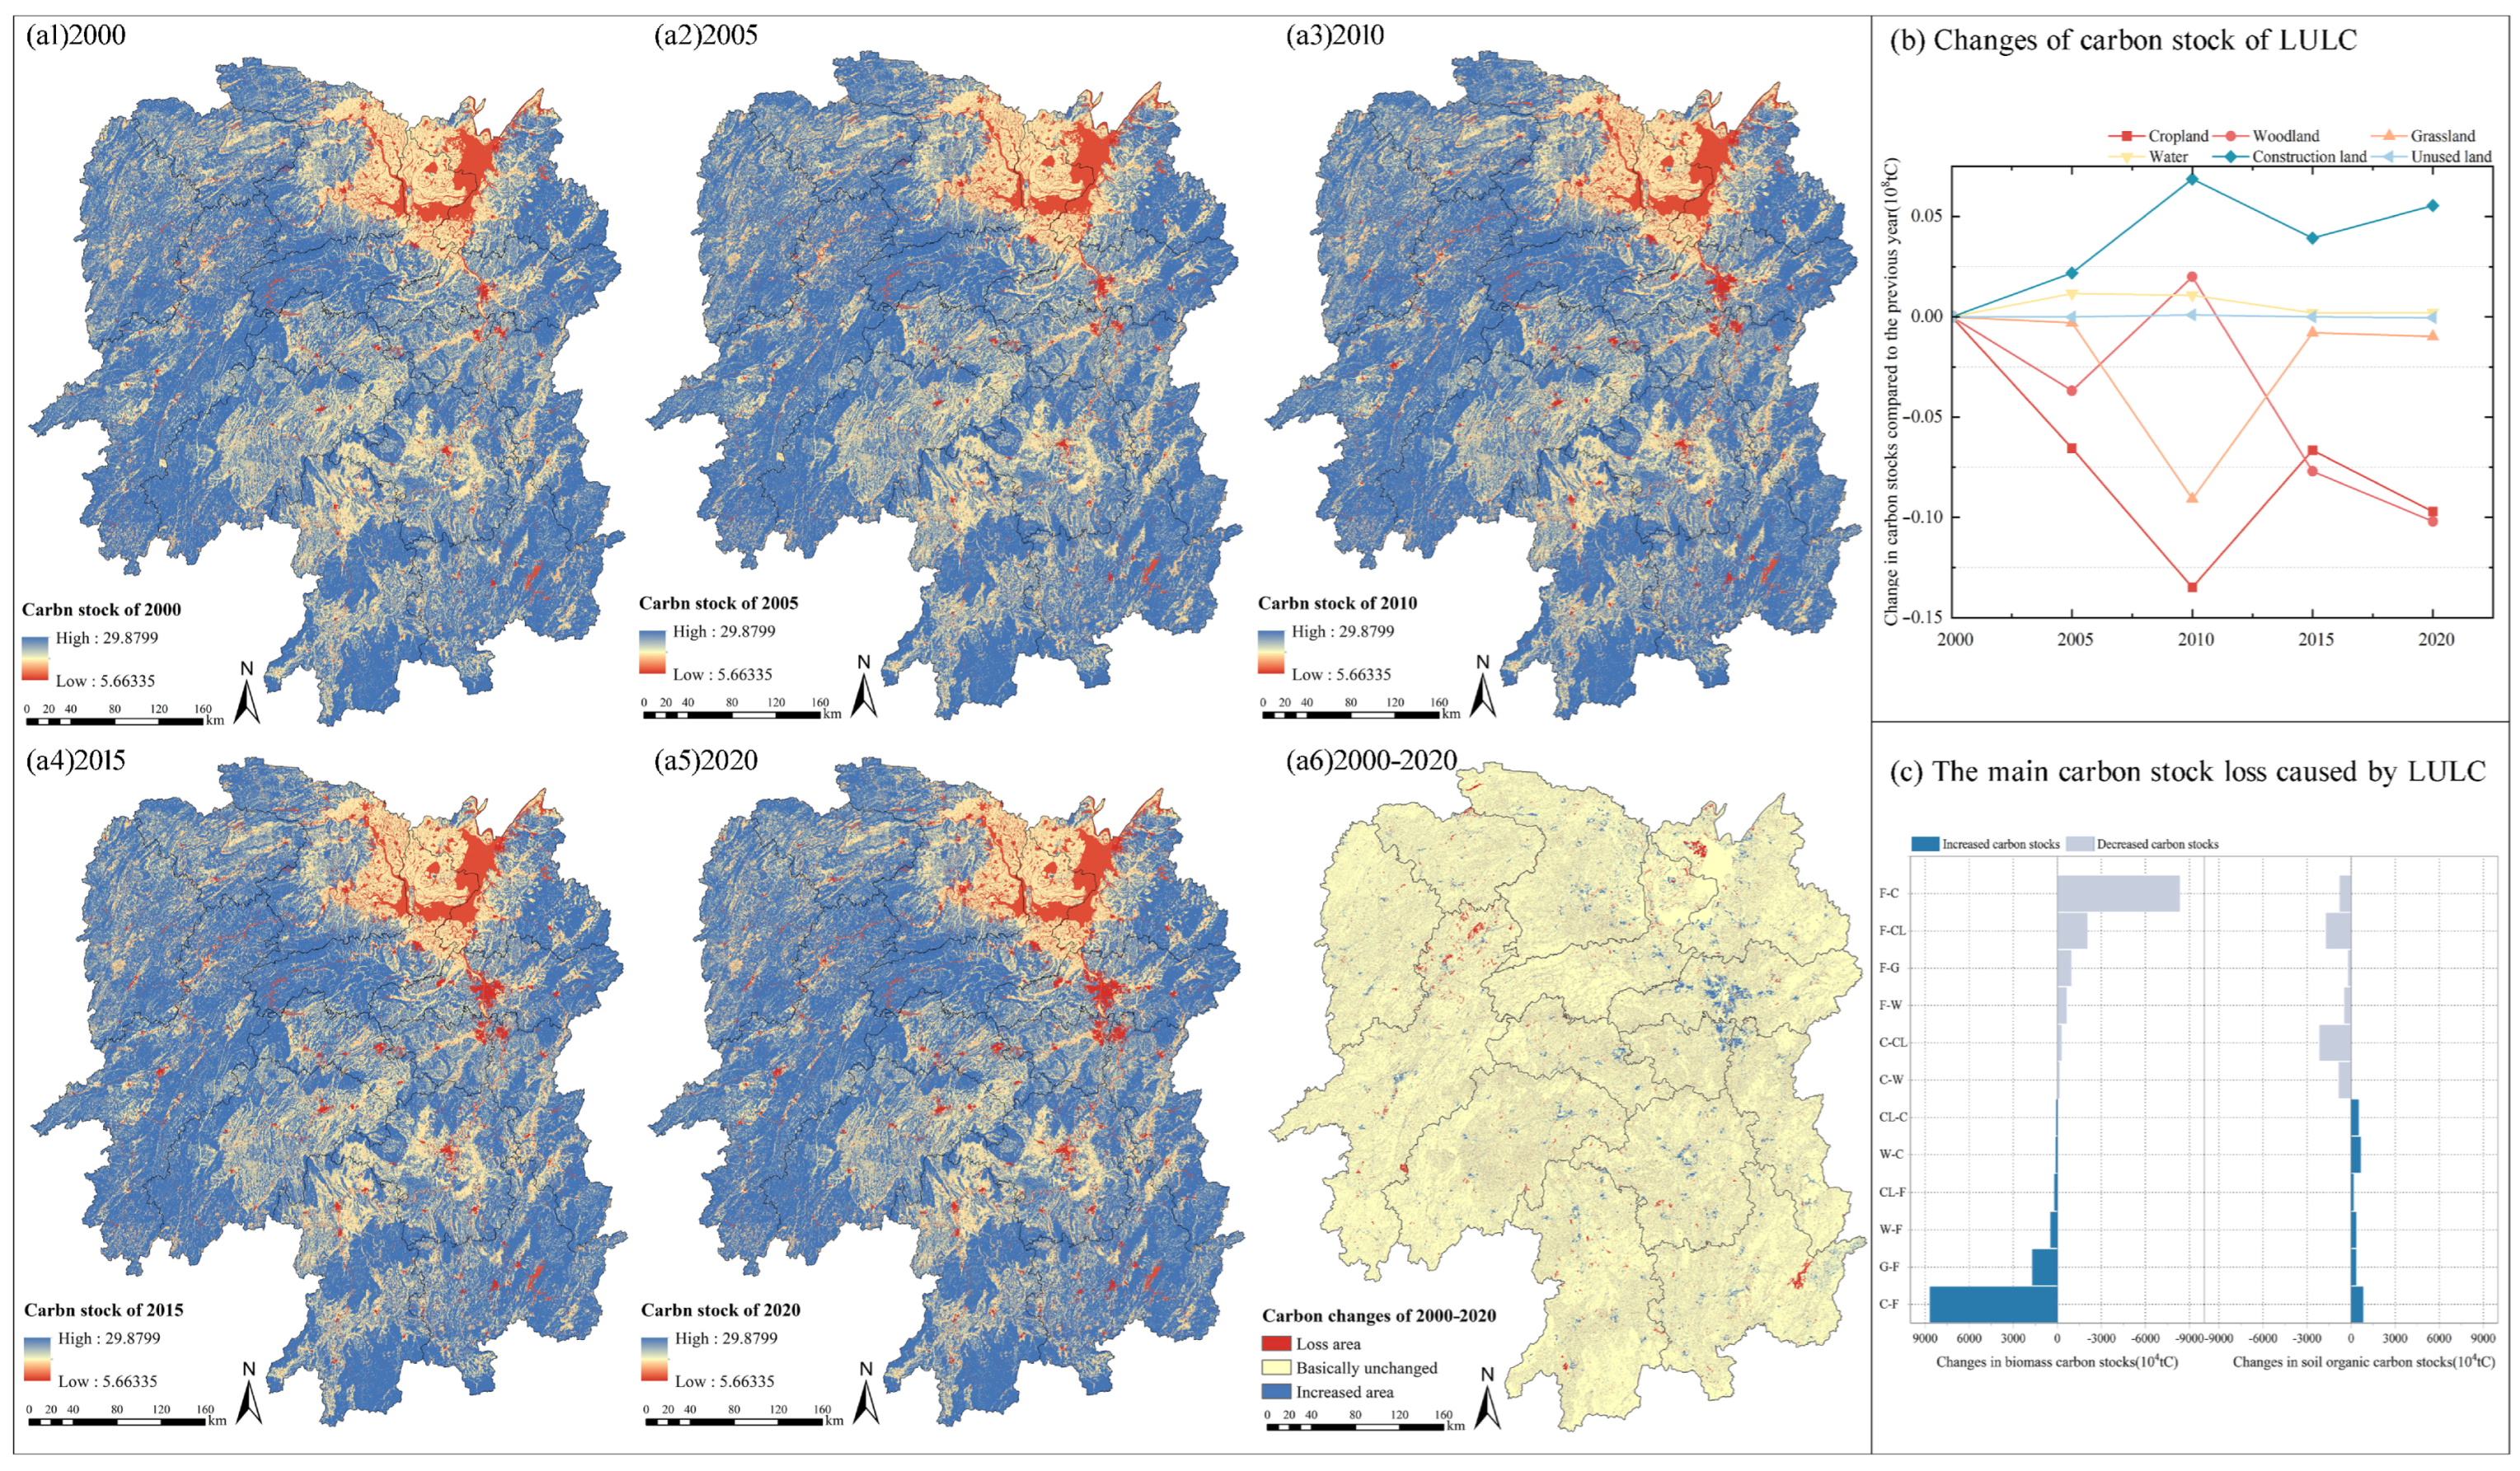
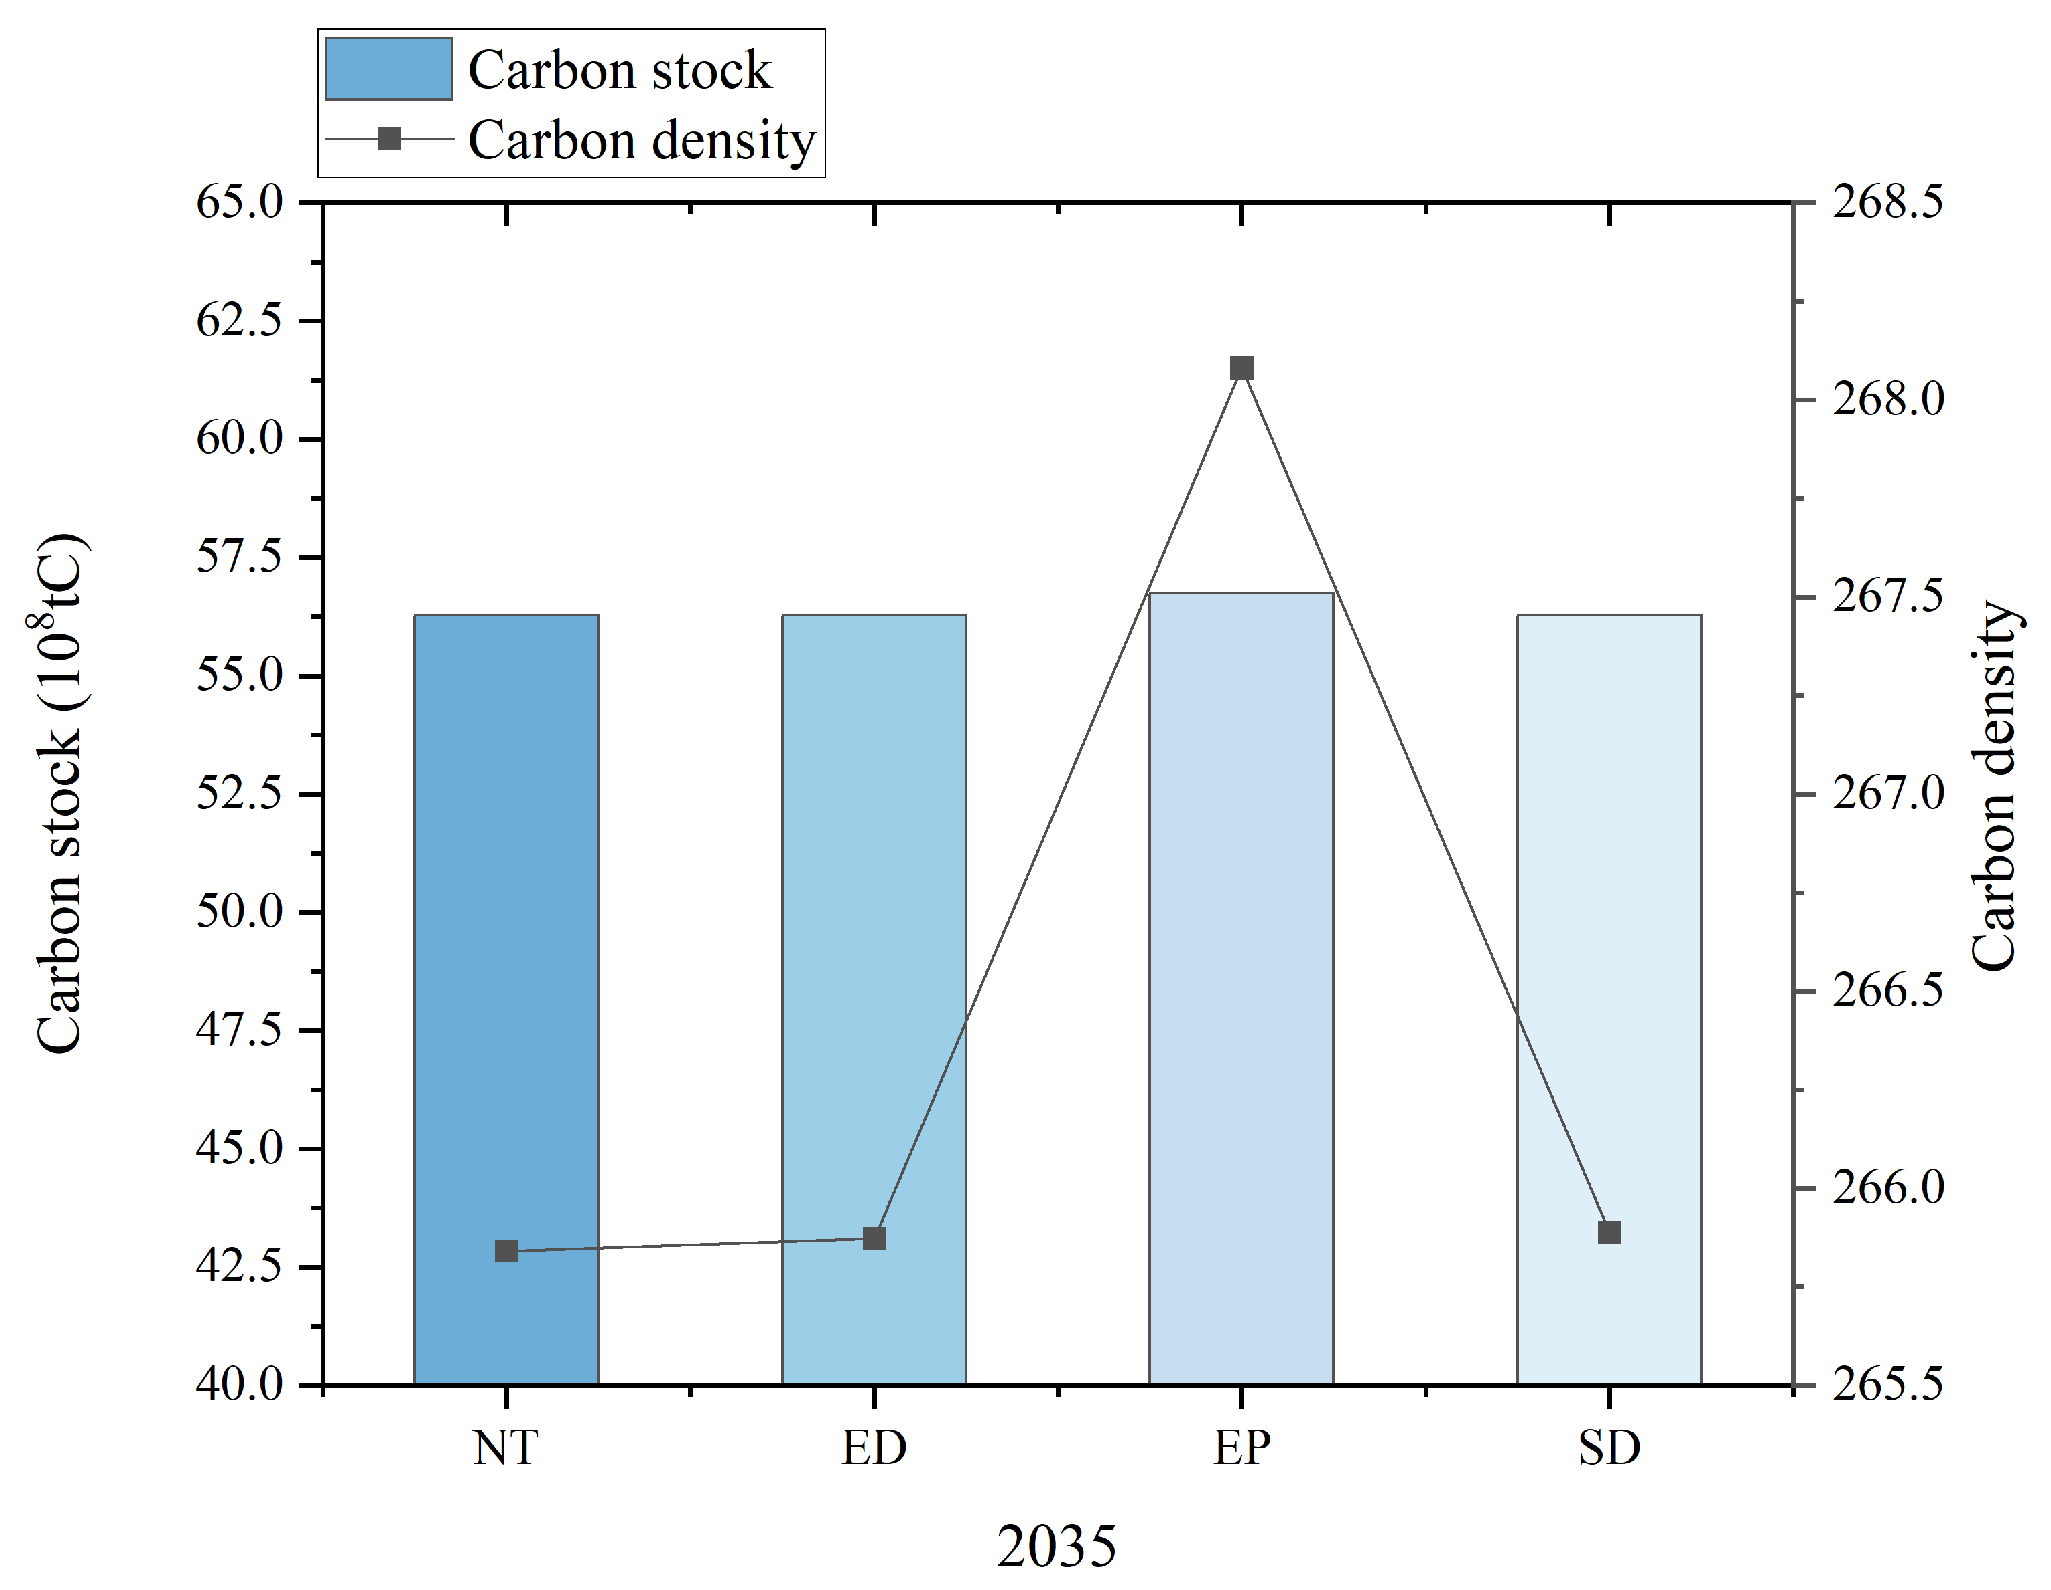

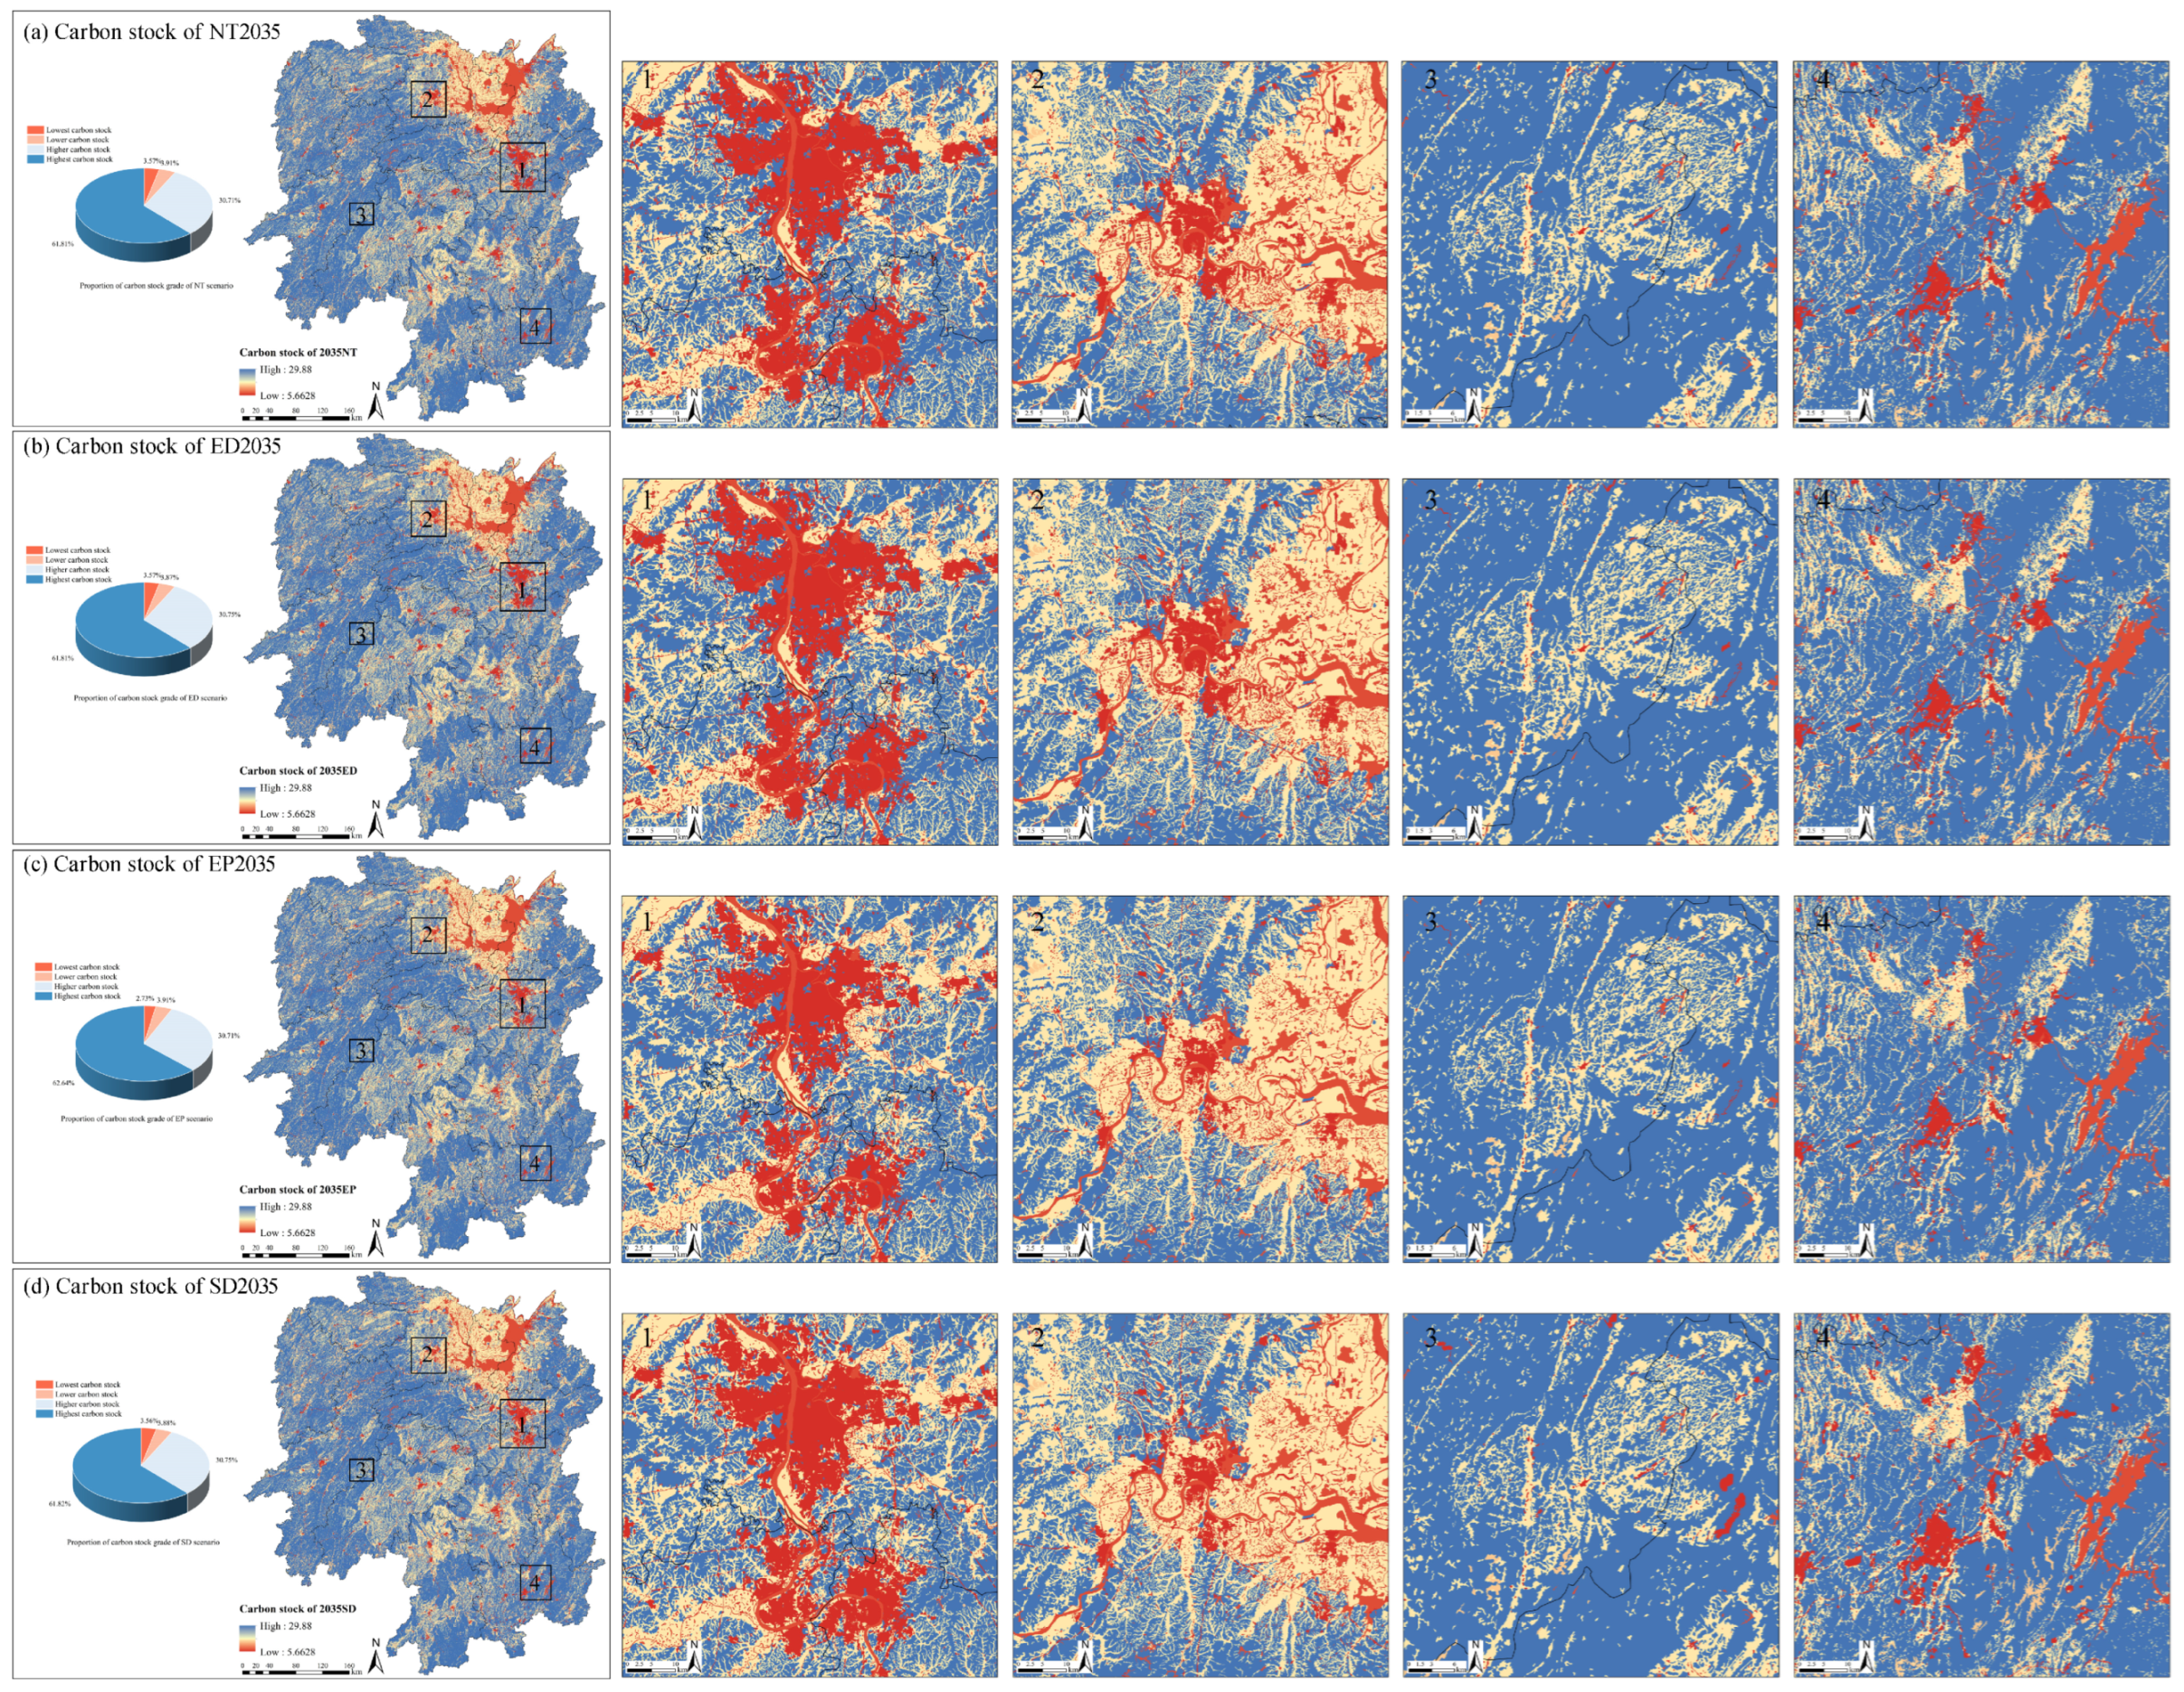
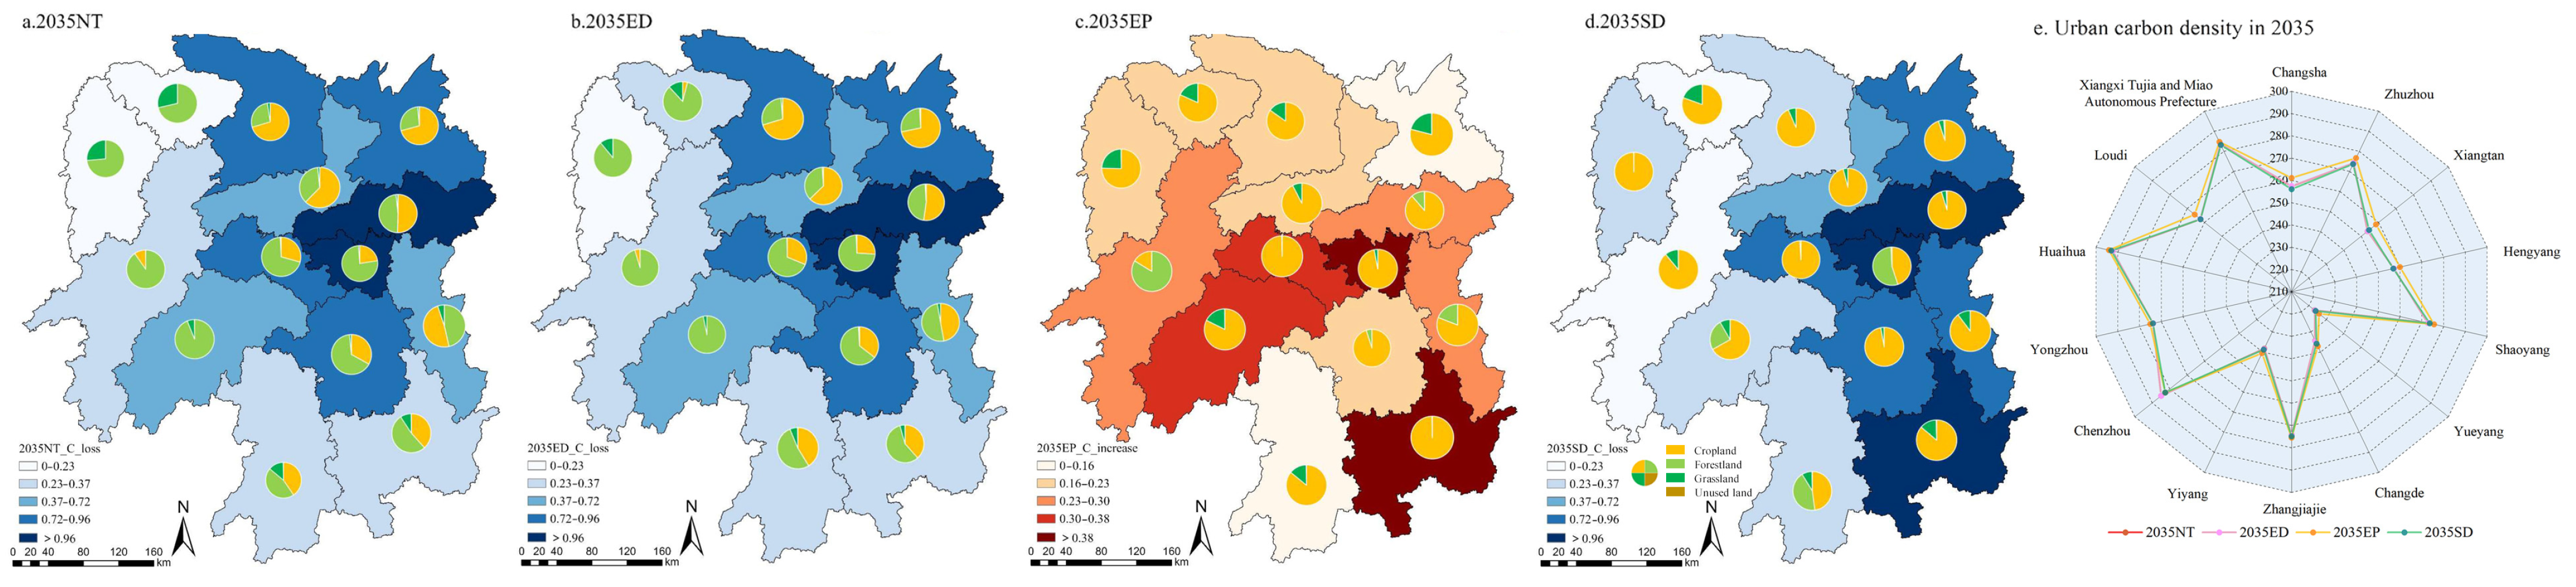
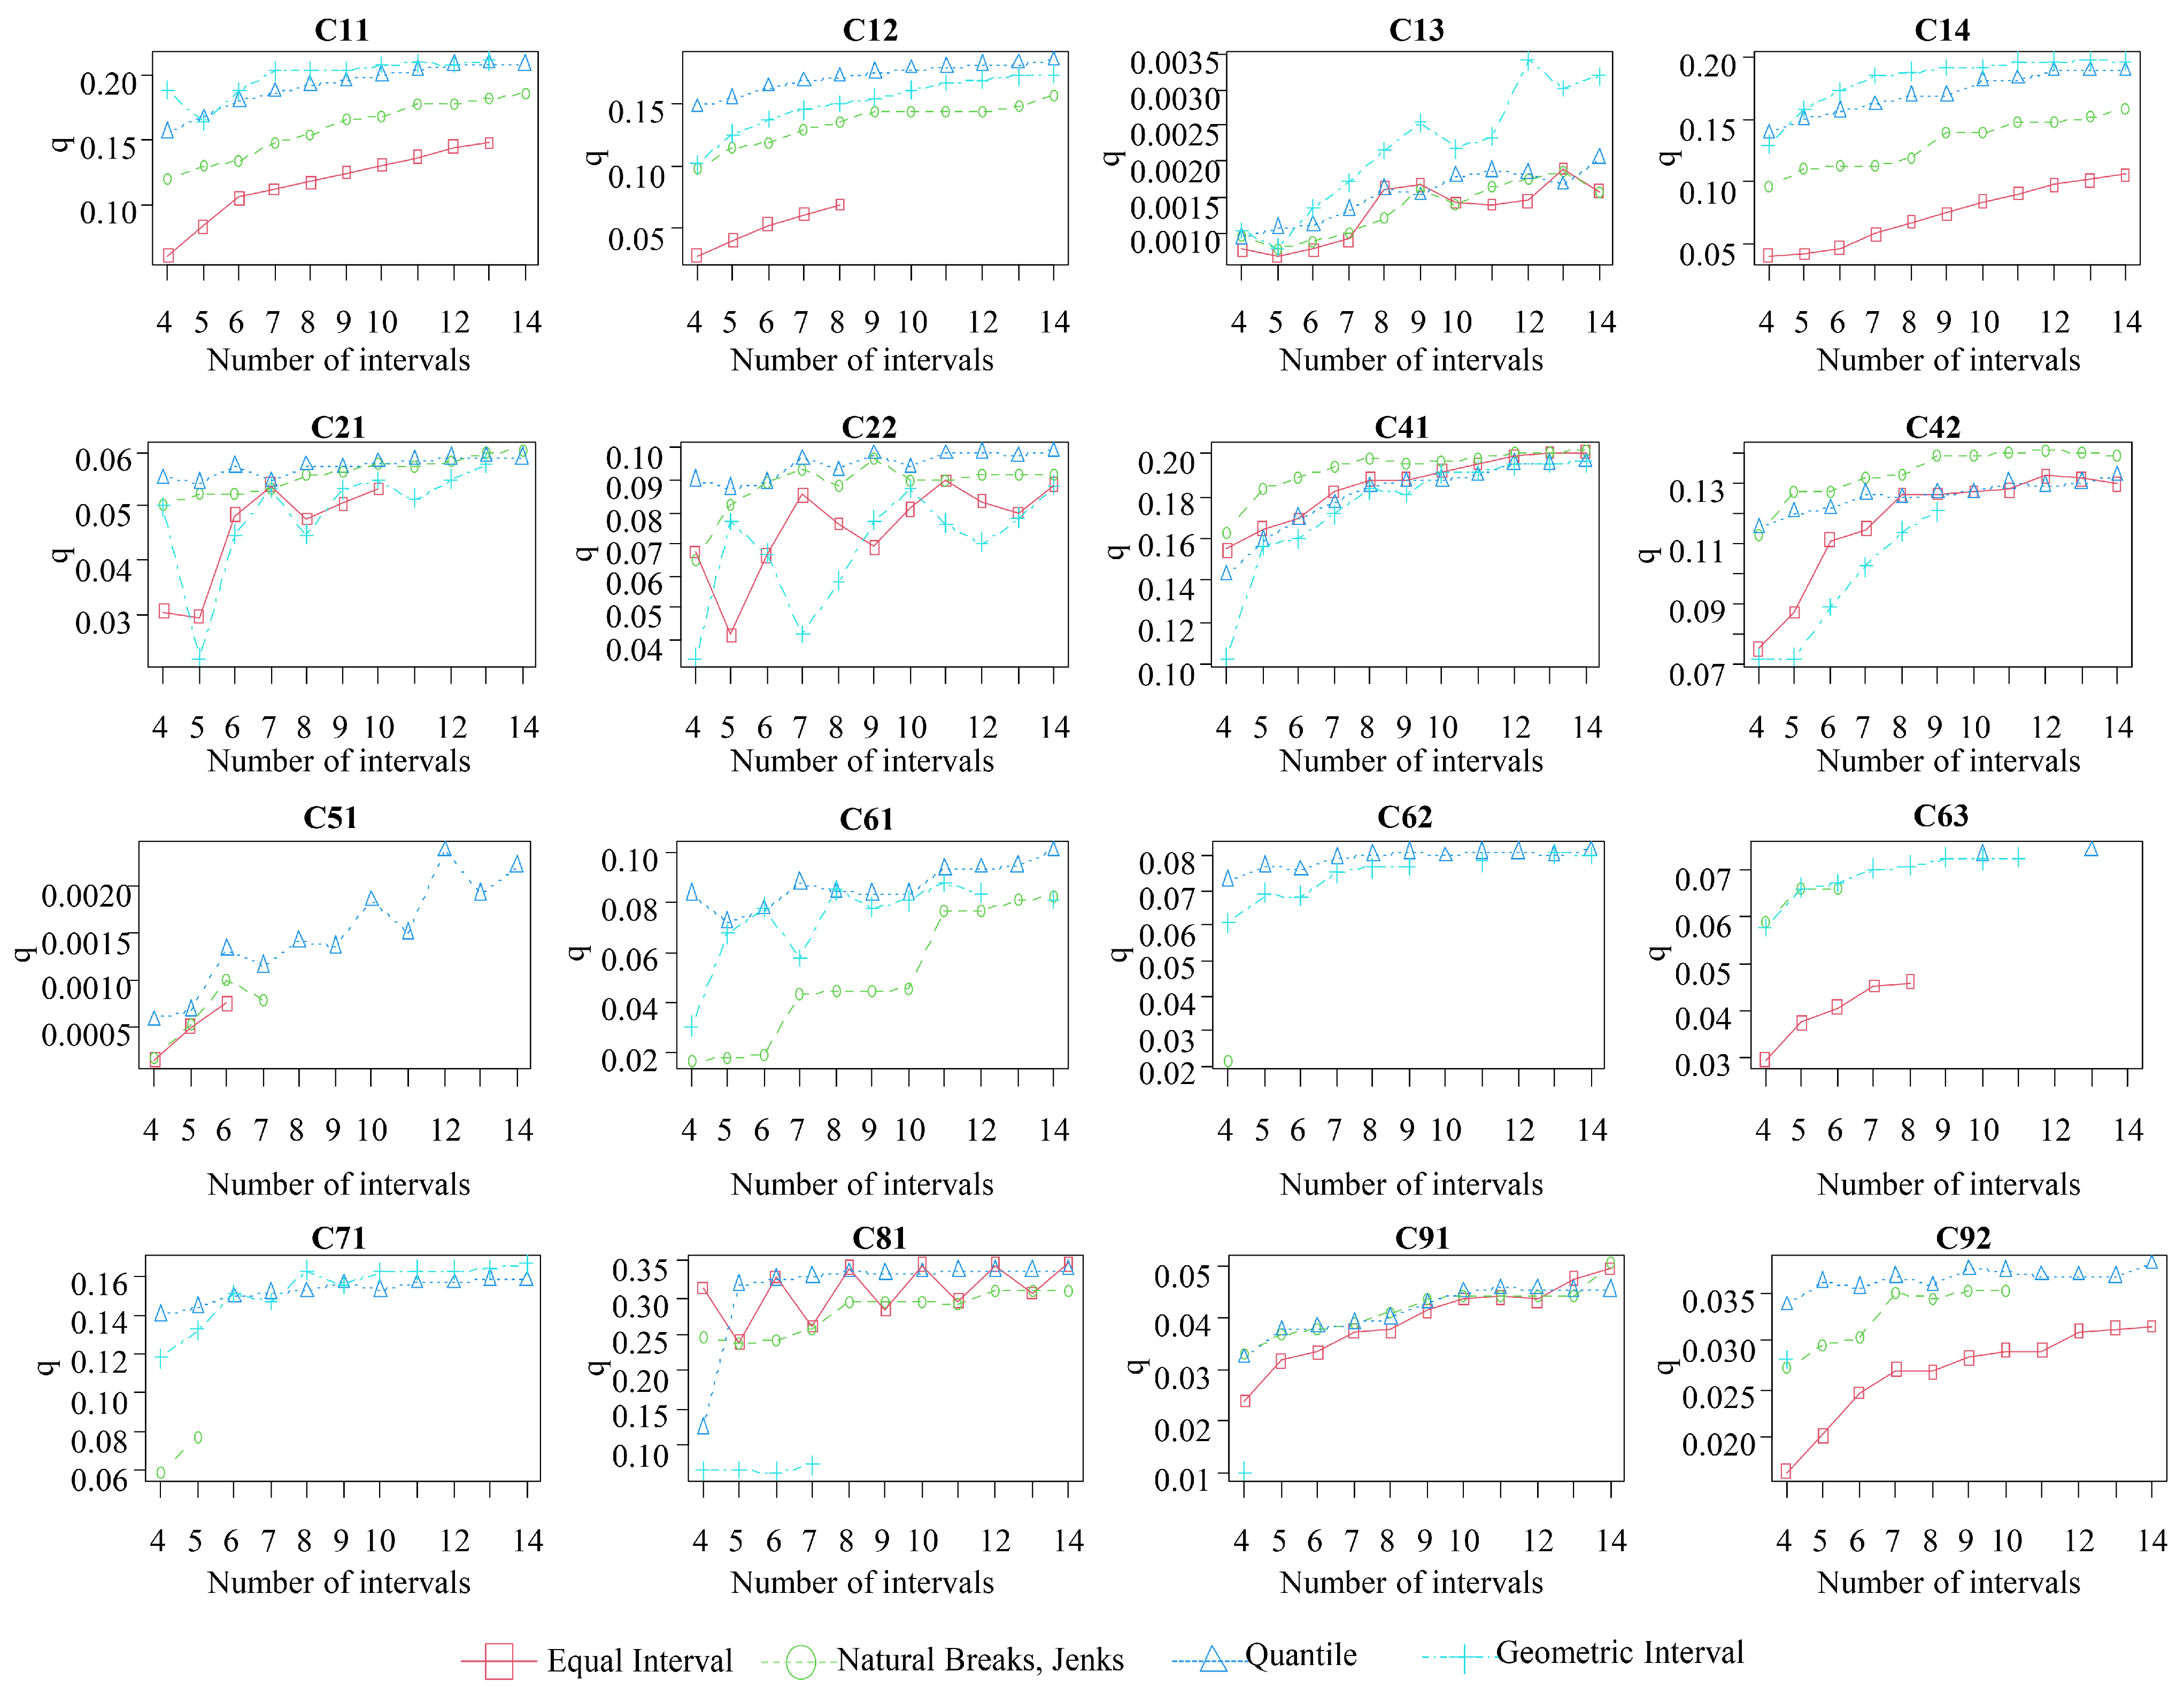
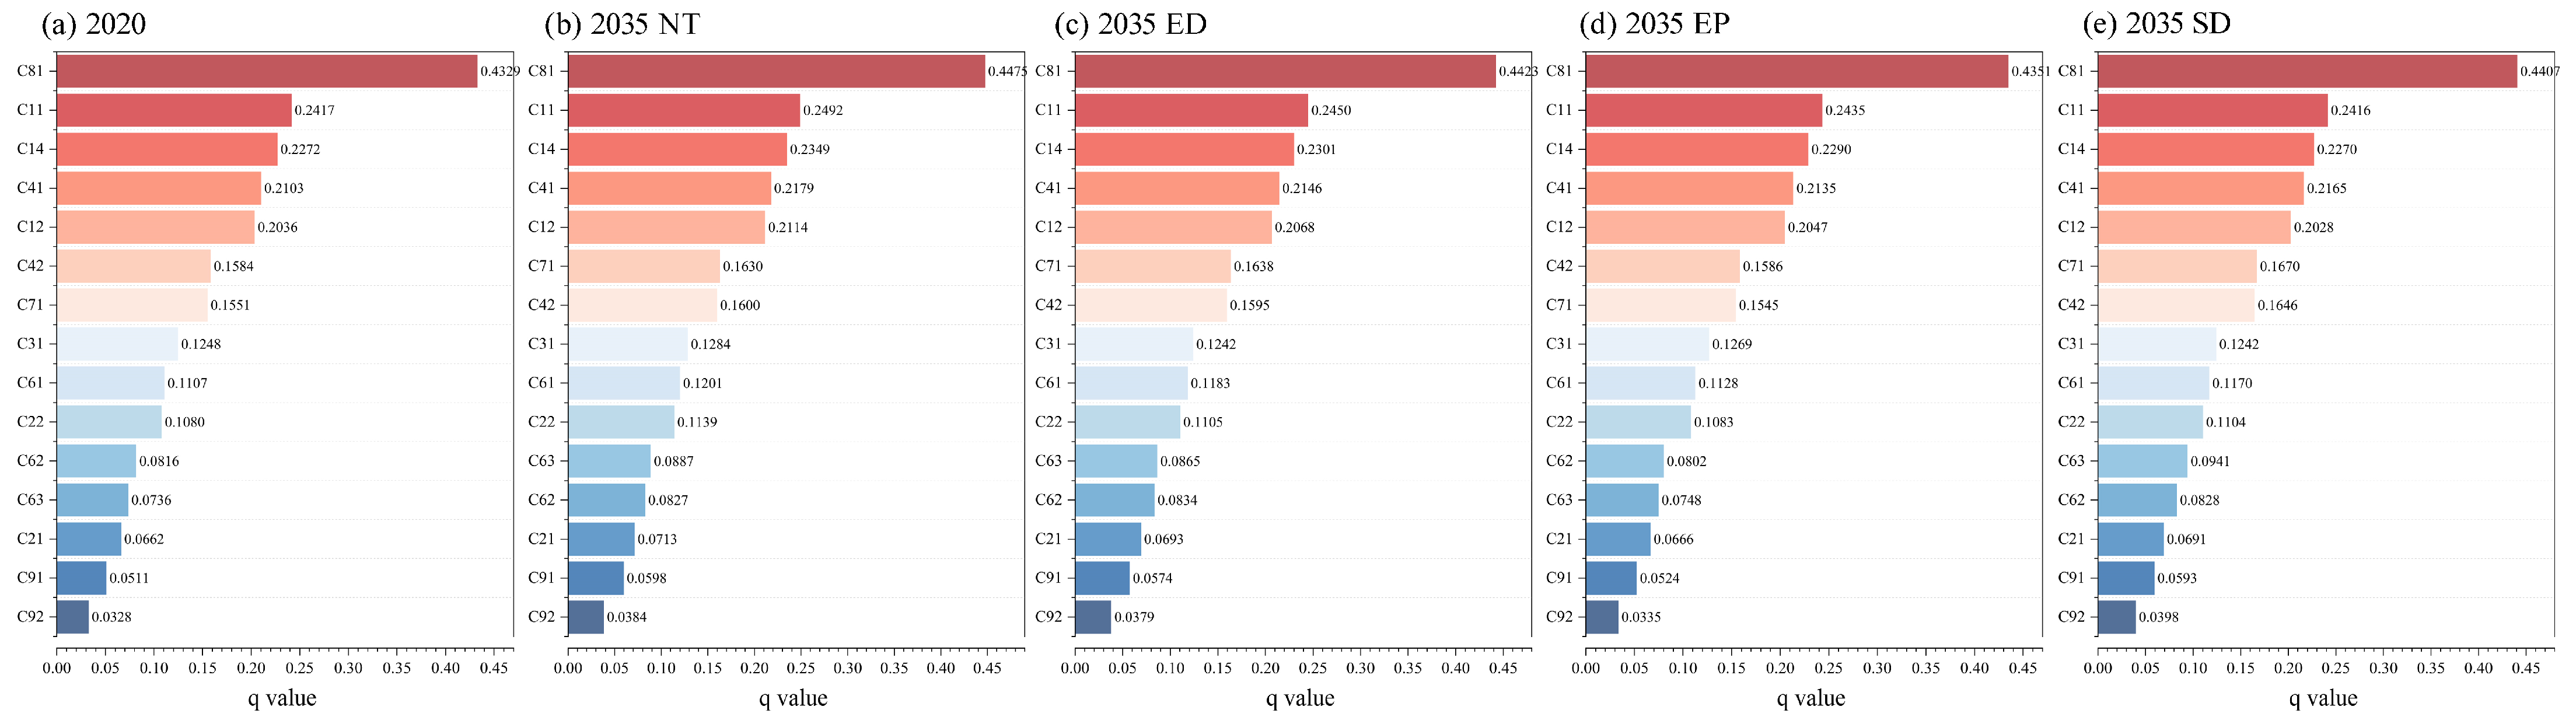
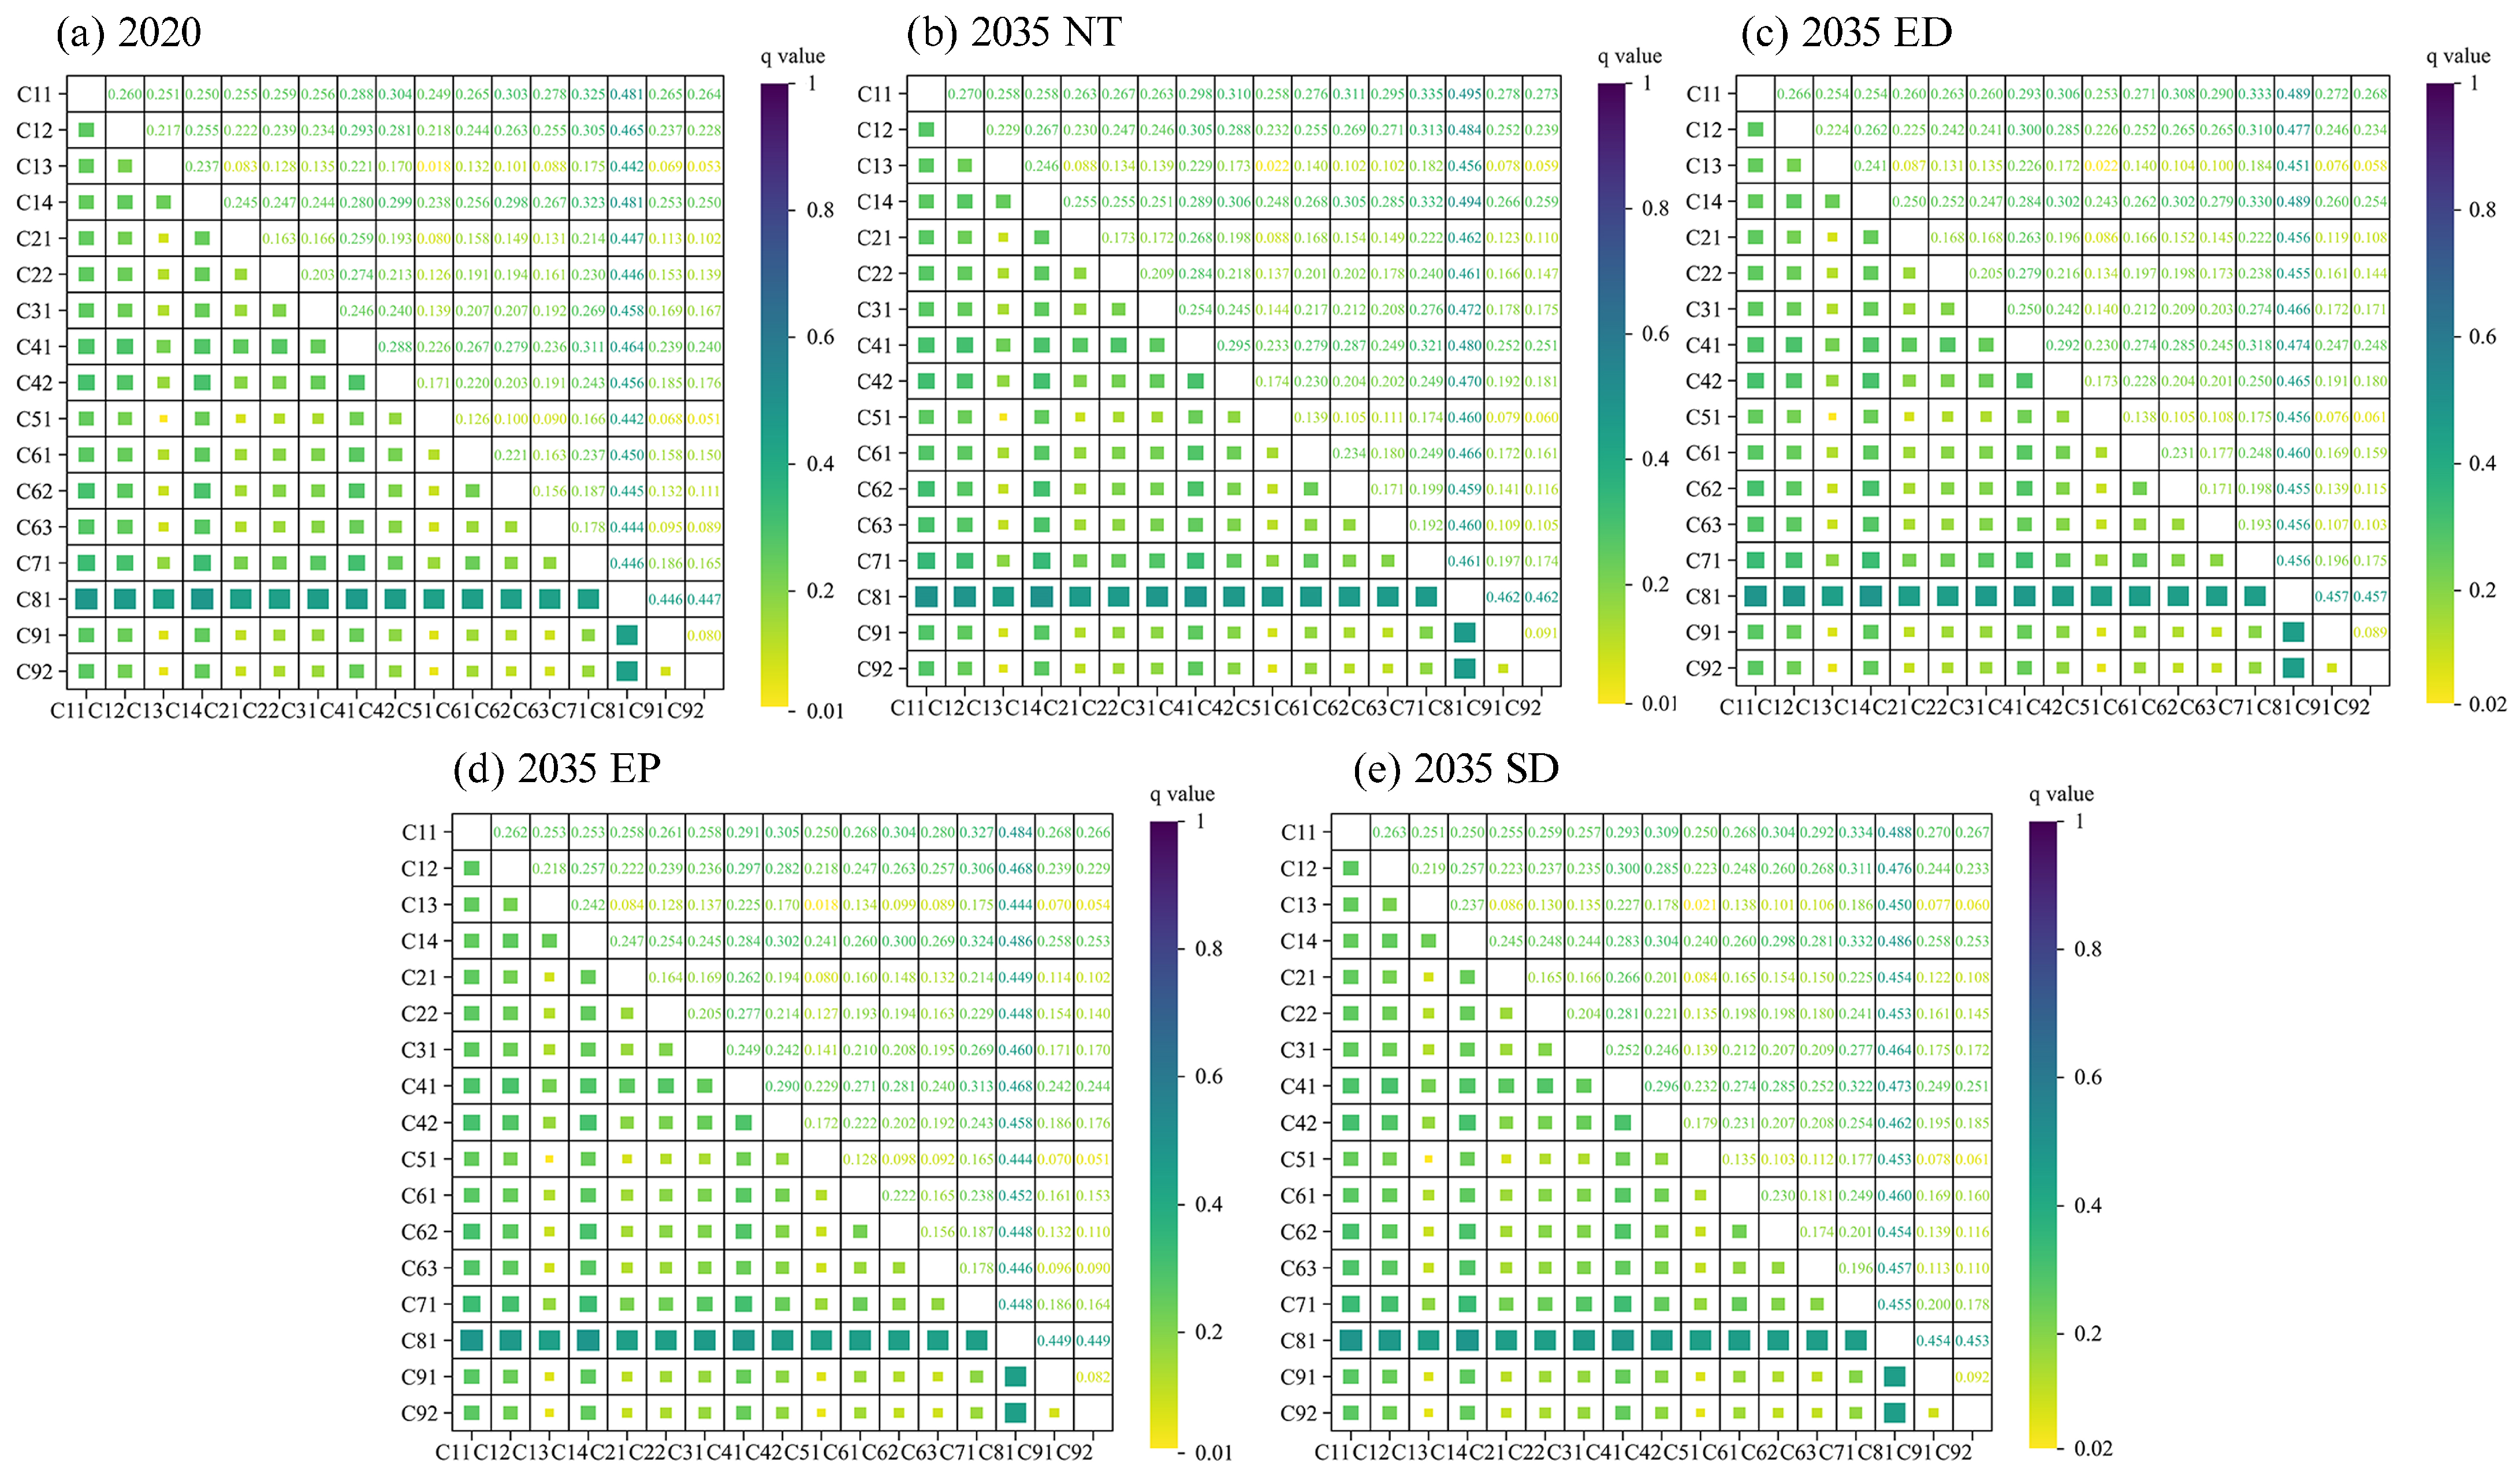
Disclaimer/Publisher’s Note: The statements, opinions and data contained in all publications are solely those of the individual author(s) and contributor(s) and not of MDPI and/or the editor(s). MDPI and/or the editor(s) disclaim responsibility for any injury to people or property resulting from any ideas, methods, instructions or products referred to in the content. |
© 2025 by the authors. Licensee MDPI, Basel, Switzerland. This article is an open access article distributed under the terms and conditions of the Creative Commons Attribution (CC BY) license (https://creativecommons.org/licenses/by/4.0/).