Abstract
The Carbon Intensity Indicator (CII) plays a critical role in assessing vessel efficiency. This study examines the impact of cold ironing (CI) on CII performance by analyzing 183 voyages of container ships. The research evaluates the attained CII values, CII ratings, and a Levelized Cost of Energy (LCOE) under different voyage data of container ships between 2023 and 2030. Results show that while 90.7% of voyages met the CII reference value in 2023, this rate decreased to 68.9% and 19.7% by 2026 and 2030, underscoring the increasing challenge of regulatory compliance, if no energy efficiency measures can be taken. Seasonal variations significantly influenced the CII, especially in March and May. With the implementation of CI on container ships, 6441.95 tons of heavy fuel oil and 6101.77 tons of marine gas oil consumption have been eliminated during port stays based on voyage data. Economic analysis indicates that CI increases the LCOE by 13.76%–19.65%, with a discounted payback period ranging from 4.69 to 24 years. This study highlights CI as a viable short-term measure for reducing maritime emissions and enhancing CII compliance, emphasizing the need for optimized economic models.
1. Introduction
The maritime industry stands as a fundamental pillar of global trade, playing a crucial role in economic development and ensuring the stability and efficiency of international supply chains [1]. With over 80% of global trade relying on seaborne transportation, the sector is indispensable for international commerce [2]. However, its heavy dependence on fossil fuels has led to significant greenhouse gas (GHG) emissions, making maritime transportation a major contributor to global warming [3]. As concerns over climate change and air pollution intensify, the industry faces growing pressure from regulators, policymakers, and researchers to adopt more sustainable practices and develop effective emission reduction strategies [4,5,6,7,8].
One of the critical aspects of maritime emissions is their impact on air quality in port regions and coastal cities [9,10,11]. Ports act as major hubs of economic activity, but they are also hotspots for ship-generated air pollution [10,12,13]. These pollutants are linked to respiratory diseases, cardiovascular issues, and overall public health deterioration, particularly for populations near busy ports [14,15,16]. With rising regulatory pressure and growing health concerns, reducing ship emissions, particularly during port stays, is a key priority for policymakers and industry stakeholders [17,18].
To address these environmental challenges, the International Convention for the Prevention of Pollution from Ships (MARPOL) Annex VI, adopted by the International Maritime Organization (IMO), establishes strict regulations for reducing air pollutants and GHG emissions from ships [19]. Annex VI sets limits on sulfur content in marine fuels, introduces the Energy Efficiency Design Index (EEDI) for new ships, and enforces operational measures such as the Ship Energy Efficiency Management Plan (SEEMP) [20]. Additionally, the Carbon Intensity Indicator (CII) and the Energy Efficiency Existing Ship Index (EEXI) have been introduced under Annex VI to regulate the carbon footprint of existing vessels [15]. These regulations collectively aim to reduce the carbon intensity of global shipping by at least 40% by 2030 and support the long-term goal of achieving net-zero emissions by 2050 [21]. By assessing CII values, one of the key metrics in evaluating the environmental performance of ships, across different voyages, it is possible to analyze operational efficiency and measure a vessel’s compliance with decarbonization targets [22,23].
Among the various decarbonization strategies, CI, known as shore power or alternative maritime power, has emerged as a promising solution to mitigate ship emissions, particularly during port stays [24]. CI allows vessels to turn off their auxiliary engines while docked and rely on electricity supplied by shore-based power grids, significantly reducing fuel consumption and emissions [25]. This method not only helps lower CO2 emissions but also drastically cuts levels of NOX, SOX, and PM by improving air quality and reducing health risks for communities near ports [26].
CI is gaining government support in the European Union (EU) and the IMO due to its environmental benefits and alignment with broader decarbonization policies [27]. The EU’s Fit for 55 packages and FuelEU Maritime initiative promote shore power adoption to meet strict climate targets. Meanwhile, national governments offer financial incentives and regulatory mandates to accelerate the deployment of shore-side electricity infrastructure. [28,29]. Additionally, the IMO acknowledges CI as a viable strategy within its GHG reduction framework, encouraging its adoption alongside other low-carbon solutions.
The benefits of CI go beyond emissions reduction. Shore power adoption enhances regulatory compliance, improves operational efficiency, and supports maritime sector decarbonization [30]. Additionally, when integrated with renewable energy sources, shore power can offer a near-zero-emission solution, making ports and shipping operations more sustainable [31]. However, despite its advantages, the widespread implementation of CI faces challenges such as high infrastructure costs, compatibility limitations between ships and port power supply systems, and electricity pricing concerns [32]. Addressing these challenges requires coordinated efforts among port authorities, ship-owners, and policymakers. Key actions include establishing financial incentives, standardizing connection systems, and expanding global shore power infrastructure [33,34].
Compliance with environmental regulations is crucial from both operational and economic perspectives. Ships must fulfill regulatory requirements while ensuring uninterrupted operations. Therefore, this study aims to determine emission index levels from ship operations and evaluate the effectiveness of CI in achieving optimal emission reductions. In this context, first, this study focuses on analyzing CO2 emissions from ships during sailings and port stays and evaluates the CII scores under different voyage scenarios. A total of 183 voyages on the same route for 5 years are utilized for analyses. Then, the study examines the potential of CI as an effective carbon reduction strategy. It quantifies its effects on emissions mitigation and energy efficiency. For the economic analysis, the Levelized Cost of Energy (LCOE) method compares voyage scenarios under varying fuel prices, with CI costs calculated for different cases. Existing literature on energy efficiency measures predominantly emphasizes the reduction of emissions released during a vessel’s sailing, aiming to enhance the attained CII value and corresponding rating. On the other hand, this study focuses on a novel analytical approach by concentrating on the mitigation and potential elimination of emissions from container ships during long-term operations, aligning with energy efficiency measures. Furthermore, it presents one of the first empirical projections of regulatory compliance risks outlined in the MEPC 83 guidelines. In this context, Z-factors from 2027 to 2030 have been incorporated, and the necessary calculations regarding the attained CII values of ships and their corresponding ratings have been conducted to assess whether specified container ships will meet short-term goals. Acquired results pinpoint both operational and policy-level implications for the maritime sector.
Figure 1 provides a comprehensive overview of the analytical structure and the methods employed in the study. This study investigates the reduction of carbon emissions from ships through CI and offers an economic analysis of this approach. Given the intense competition in the maritime industry, companies face significant cost pressures. Thus, this study is motivated by examining CI as a carbon reduction application from an economic perspective. The findings contribute to the ongoing discourse on sustainable shipping solutions and offer valuable insights for ship operators and regulators seeking to align with the IMO decarbonization goals.
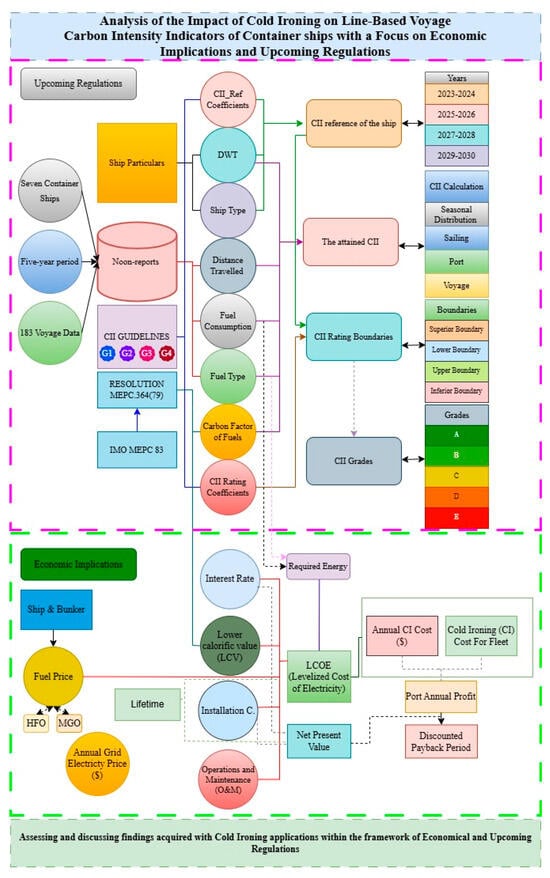
Figure 1.
Flowchart of study.
2. Literature Review
The literature review section mainly focuses on the CII and CI, which are the main scope of this study. Several studies have explored the CII’s role, one of the widely used metrics for assessing vessel efficiency, in emissions monitoring and regulatory compliance. Rauca and Batrinca [35] examined the effectiveness of the CII, implemented under SEEMP III in 2023, by analyzing 1 year of operational data from four vessels. Findings suggested that CII ratings are highly influenced by idle times and voyage planning, emphasizing the need for improved coordination between ship-owners and charterers to optimize port operations and just-in-time arrivals for enhanced efficiency. Bayraktar and Yuksel [36] analyzed the challenges of meeting EEXI and CII regulations, emphasizing that the engine power limitation and alternative fuels such as LNG and methanol significantly enhance compliance. Their findings highlighted the role of dual-fuel conversions and speed optimization in improving CII ratings and EEXI values. Yuan et al. [23] stated that 63% of studied oil tankers received the lowest CII rating (Category E), emphasizing the need for accurate data collection and operational adjustments to enhance compliance with IMO’s decarbonization targets. Yan et al. [34] demonstrated that ship speed optimization using model predictive control effectively improves CII compliance while maintaining trajectory accuracy; however, it may lead to a reduction in total distance sailed under carbon reduction constraints. Kim et al. [37] evaluated the growing impact of CII regulations on international shipping, highlighting that energy efficiency improvements and slow steaming alone are insufficient for long-term compliance. The study identified key causes of low CII ratings and proposed strategic operational and technical solutions to enhance regulatory adherence. The research conducted shows that in order to achieve the CII targets, not only navigation-related processes such as speed reduction are effective, but also precautions must be taken in port and during idle times. In addition, alternative and effective methods such as CI, which is the scope of this research, should be preferred in these processes.
In addition to assessment metrics, implementing effective emission reduction strategies is imperative. CI or shore power connection has been widely studied as an emission reduction method for port stays, allowing ships to use land-based electricity instead of onboard generators. Research has examined its technical feasibility, economic viability, and environmental benefits alongside challenges such as infrastructure costs and compatibility issues. Seyhan et al. [24] evaluated CI and automatic mooring system (AMS) for emission reduction in Izmit Bay. Findings demonstrated that CI alone significantly lowers CO2 (21.21%), NOX (88.85%), PM (47.17%), and SO2 (2.33%), with further improvements when combined with AMS. Bakar et al. [38] provided a comprehensive review of CI technology, highlighting its role in green port strategies and the challenges hindering its widespread adoption, including high installation costs, ship retrofitting complexities, and synchronization issues. They proposed a microgrid-integrated implementation strategy to enhance port decarbonization. Tang et al. [39] assessed the impact of Onshore Power Supply (OPS) at Ningbo Zhoushan Port. The results indicate that although OPS enhances the energy efficiency of berthed ships, its effectiveness diminishes when factoring in indirect emissions and energy losses. This underscores the necessity for optimized implementation strategies to effectively support China’s carbon reduction objectives. Bakar et al. [40] explored the feasibility of CI for short-berthing ferries, integrating it with clean energy sources and energy management strategies. Their findings demonstrated that the proposed system reduces CO2 emissions by 38.44% from shipside operations and 28% from shore-side activities, and they highlight CI’s potential for facilitating cost-effective emission reductions in ferry terminals. Le [41] examined the factors influencing the adoption of CI in Vietnamese ports, revealing that economic incentives and regulatory frameworks facilitate implementation. However, high initial costs and a lack of standardization are significant barriers that underscore the critical need for policy support and investment in developing countries. Bullock et al. [42] investigated the role of shore power in mitigating port emissions and facilitating the integration of future electric vessels and identified significant barriers, including high infrastructure costs and electricity taxation. To address these challenges, the authors proposed collaborative strategies involving port authorities, operators, and government entities to expedite the adoption of shore power solutions. Glavinovic et al. [43] analyzed the feasibility of CI in Croatian state-owned ports. Their findings revealed that, although stakeholder support for CI adoption is evident, only 40% of the ports currently satisfy the minimum power requirements, demonstrating the necessity for significant investments and enhanced stakeholder collaboration to ensure sustainable implementation. Research shows that one of the most important problems in CI applications is cost. In this context, considering costs within the scope of emission reduction strategies is an important element in terms of the commercial activities of companies.
In line with the assumptions derived from the literature mentioned, this study advances previous research by developing the CII as an assessment tool and proposing CI as a viable mitigation strategy, enriching the discourse on sustainable maritime operations. Additionally, it addresses a significant research gap by examining the role of CI in enhancing CII ratings, offering new insights into its potential for reducing carbon intensity.
3. Methodology
The study is based on noon-reports data of seven sister container ships operating on the East America-Europe-Mediterranean of the Transatlantic trade route, which is one of the routes where trade flows are very intense. A total of 183 combined noon reports have been obtained from these ships over a 5-year period. Noon reports detailing total traveled distance, average speed, waiting time at the port, fuel consumption while at the port and during sailing, and the type of fuel used have been employed to calculate the attained CII. The calculation of attained CII is performed on an individual basis for each liner transportation of seven sister container ships. Although CII calculations were introduced in 2019, this study makes calculations for the years 2023 to 2030 for a benchmark on behalf of the last years and the coming years. To improve CII values, CI has been utilized on container ships during the waiting period in the port. However, the use of CI in ports brings certain costs. Therefore, economic modeling within the scope of the LCOE has been carried out by considering both the fuel prices used in the ship and the CI costs encompassing installation, operation and maintenance cost, grid electricity price, interest rate, and required energy.
3.1. CII Calculations Stages and Formulas for Container Ships
The CII is defined as the average CO2 emissions per transport work of a marine vessel. The calculation of the attained CII for the ship is described in Equation (1).
where M is the amount of CO2 emissions, and W is transport work. The fuel amounts and their carbon factors are employed in calculating M. The ship capacity in deadweight tonnages (DWT) and the total distance traveled are used in the computation of W. Total distance traveled is acquired from the IMO Data Collection System (DCS), where the traveled distance is regularly recorded [44]. A reference value for the CII, CIIref is essential for comparing and assessing the CII value achieved by a specific ship type and its corresponding capacity. The equation of CIIref has been defined in Equation (2).
where a and c are coefficients depending on the type of vessel and its capacity, developed in the framework of the data obtained from the IMO DCS in 2019. The coefficients a and c for container ships are 1984 and 0.489, respectively, regardless of capacity. In this equation, the ship’s capacity is represented by its DWT [45].
After 2019, reduction factors are applied to CIIref values at certain rates in the following years to achieve CO2 reduction targets. The reduction rates increase by 2% each year, starting at 5% in 2023 and reaching 11% in 2026 [46]. In addition, according to the MEPC 83 report published in April 2025 by IMO, the CIIref reduction factors for the years 2027, 2028, 2029, and 2030 are 13.625%, 16.25%, 18.875%, and 21.5%, respectively [47,48,49].
Within the scope of CIIref, the attained CII is ranked under five grades: A, B, C, D, and E. Four different boundaries are utilized when assigning grades, as described Equation (3).
Grades encompassing A, B, C, D, and E are expressed in Figure 2 depending on the four different boundaries.

Figure 2.
Grades of CII.
Coefficients of varying ship types and the Required CII are utilized to determine the four boundaries and five grades. The Required CII is calculated by employing CIIref value and reduction factor changes according to year. For the container ship, exp(d1), exp(d2), exp(d3), and exp(d4) are 0.83, 0.94, 1.07, and 1.19, respectively [40].
The 183 voyages included in this study were performed by a fleet of seven sister container ships. The length overall (LOA) of these ships is 182.85 m, and the beam is 28 m; they have 26,812 DWT and 21,092 GT. The container-carrying capacity of these ships is 1880 TEU. The ships are equipped with a 13,280 kW engine. Additionally, there are three different generators on the ships with a capacity of approximately 5000 kW. The service speed of the ships is stated as 19.2 kts, and the maximum speed is 20.0 kts.
Since the primary variables in the CII calculation are fuel consumption, carbon factor, and traveled distance, optimizing fuel consumption while covering the specified distance can significantly improve the attained CII values. This approach makes surpassing the reference CII value easier. Figure 3 illustrates the distances traveled and the average speed in each voyage.
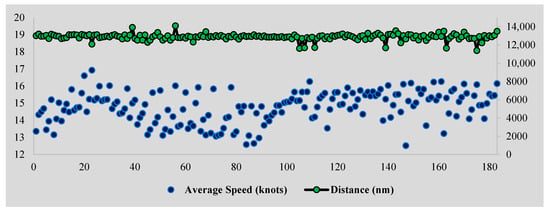
Figure 3.
The distances traveled and the average speed of voyages.
Container ships operate on a specific shipping line, resulting in traveled distances ranging from 11,378 nautical miles (nm) to 14,096 nm, with an average of 12,883.33 nm across the 183 voyages. The average speed of the ships varies from 12.52 to 16.92 knots, corresponding to a 26% fluctuation rate, which is a consequence of a number of factors, including sea and weather conditions, the navigational performance of the ship, capacity utilization rate, congestion at port arrivals and departures, maneuvering at the ports, anchoring before entering the port and while awaiting further instructions, sailing time and the potential for erroneous records [50,51]. The overall mean speed, calculated from all noon reports of the 183 voyages, is 14.77. Additionally, the sailing and waiting times of the ships in port are illustrated in Figure 4.
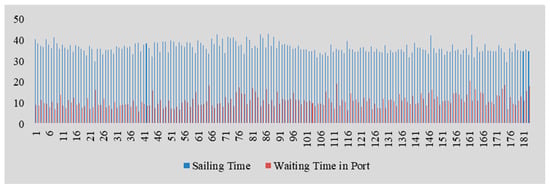
Figure 4.
Time distribution of voyages.
The average sailing time is 36.36 h, with a maximum of 43.23 h and a minimum of 29.48 h. The waiting time at the ports varies between 6.01 days and 20.50 days, with the mean port duration being 10.98 days.
It is expected that the highest fuel consumption will occur during its operational phase. The data obtained from seven sister container ships indicates that the daily consumption of Heavy Fuel Oil (HFO) on the vessels varies between 24.32 and 42.25 tons. It is evident that fluctuations in the average speed of ships during navigation have an impact on the average fuel consumption of container ships. This is due to the fact that the energy derived from the fuels is utilized in the propulsion system. Fluctuations in daily consumption of HFO consumption reach up to 42.4%. Additionally, marine gas oil (MGO) consumption for auxiliary engines is up to 4.12 tons per day, an average of 1.83 t/day for 183 voyages. During the waiting period of the ships at the port, the daily consumption of HFO and MGO achieved up to 9.02 and 6.27 tons, respectively. There is a correlation at the level of 0.656 between the duration of the ships’ waiting time in the port and the daily fuel consumption during the waiting time in the port. This clearly indicates that there is a strong relationship between the two inputs.
Figure 5 presents the daily fuel consumption in the port and in the sailing on the y-axis in detail by fuel type encompassing HFO and MDO. The x-axis represents each turnaround, totaling the number of 183, performed by container ships.
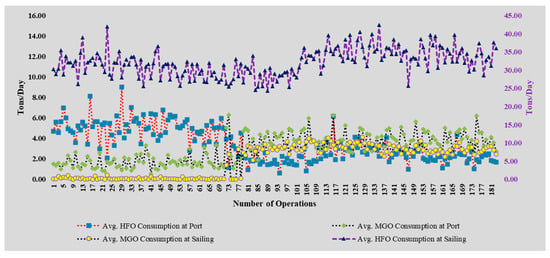
Figure 5.
The daily fuel consumption rate of container ships both in port and on sailing.
3.2. Economic Modeling
The LCOE has been used to compare the economic indications of voyage scenarios with and without CI under various fuel price scenarios. Table 1 presents the assessed fuel prices utilized in this analysis.

Table 1.
Fuel prices under low, average, and high cases (unit is USD/t).
The fuel prices for Istanbul selected regarding the fleet sailing points were sourced from ShipandBunker [41] as of 6 February 2025 and represent one year. The lowest price during this year was designated as the low scenario, while the highest price was classified as the high scenario. The mean value of the annual fuel prices was utilized to represent the average fuel scenario. The annual fuel cost (CFuel) was determined by multiplying annual fuel consumption by the values presented in Table 1.
CI installation cost (CIns) on the reference port is assumed to be $8,875,726, with an annual operation and maintenance cost (CO&M) of $443,786 [52]. The grid electricity price in Türkiye is taken at $0.16 per kWh, following an adjustment for the exchange rate, where one United States dollar (USD) equal to 37.9 Turkish lira [25,53]. The required energy (E) for vessels in the port area is calculated from fuel consumption and the energy density of the fuels. The energy density of HFO and MGO were taken at 10.83 and 11.89 MWh/t, respectively [54]. The LCOE is calculated using Equation (4) [55].
The interest rate (r) is taken at 7% [56,57], while the lifetime (LT) of equipment is assumed to be 25 years [58,59]. Values of 5% and 10% were also employed to illustrate the sensitivity to the r value, with the corresponding changes detailed in the results section. The net present value (NPV) is computed using Equation (5) [60].
The annual cash flow (CF) is determined from the incomes regarding the CI tariff to the case study fleet and annual expenses of CI. The discounted payback period (DPP) is calculated by comparing the NPV with CI and subsequently dividing CI by the annual CF [25,61].
The LCOE for the port and the fleet is calculated separately. For the port side, the LCOE is determined to assess the cost of providing grid electricity through the CI application to the case study fleet vessels. Subsequently, the tariff for this application is examined parametrically by increasing the service provider’s profit ratio (PR) across four distinct scenarios. The LCOE variations for the fleet, resulting from using the CI service, are evaluated based on these scenarios and compared to the conventional baseline case, which utilizes HFO and MGO for ship electrification at the port. Table 2 presents the examined cases for the parametric PR related to the CI application.

Table 2.
PR of examined cases.
The service provider’s profit ratios (PR) used in the LCOE are 0%, 10%, 20%, and 30%, respectively [62].
There are, however, some limitations concerning CII calculation and the economic model:
- During sailing time, various mechanical problems on ships and weather and sea conditions directly affect the fuel consumption of ships. Moreover, unmeasurable factors such as the crew’s ship management characteristics can also change the amount of fuel consumption. These specified internal and external factors are not present in the obtained data source. The conditions of these factors are assumed to be similar.
- Fuel prices are highly vulnerable to political and economic conditions around the world. In addition, fuel prices vary from port to port. To eliminate this vulnerability and variation, it is assumed that the ships perform bunkering operations from only one port (Istanbul).
- The minimum, maximum, and average values of Istanbul fuel prices in the last year are utilized for price fluctuations. The interest rate is assumed to be the value used in literature research, and lower and upper values close to this value are also used for sensitivity.
- In evaluating the CII rating between specified years, it is assumed that the recorded operational data of the container vessels remain constant, and these ships operate in the same ways.
4. Results and Discussion
In the results section, initially, the attained CII values and ratings of the ships according to the following years are calculated utilizing data from recorded voyages. The attained CII calculation considers fuel consumption both in sailing and port operations. To improve the CII rating further, the CI is utilized for ships during their time in port. The CI application in the analysis considers the usage of national grid electricity. Considering this assumption, an economic analysis based on the CI price (in $/MWh), the annual CI cost for the fleet (in $), and the port’s annual profit (in $) is undertaken. Additionally, the analysis has compared the economic indications of ship electrification plants using HFO or MGO with CI utilization. Subsequently, the annual impact of CI utilization on the fleet CII is calculated, and the results are evaluated from 2023 to 2030 comprehensively. The results obtained in this study were critically compared with previous research, and the findings were discussed in light of the existing literature. In addition, infrastructural, regulatory, and economic constraints that may influence the practical implementation of cold ironing are examined in a dedicated subsection to provide a more comprehensive evaluation of the real-world feasibility of this strategy.
4.1. Carbon Intensity of Container Vessels
Considering vessel types and capacities, the CIIref is obtained at 13.58. The attained CII values of ships for each voyage compared to the CIIref values are illustrated in Figure 6. When the attained CII for the 183 voyages is calculated individually based on Eq. 1, it is found that 17 voyages, accounting for 9.3%, do not meet the established threshold for the CIIref value. Conversely, 166 voyages, representing 90.7%, exceed this reference value. Since 2019, the CIIref value has been progressively lowered, making it increasingly challenging to comply. Should the analyzed container vessels maintain the same operational profiles in the coming years, the percentage of container ships failing to meet the CIIref threshold will rise to 31.15% by the end of 2025. This ratio will increase further and reach 37.7% by the end of 2026. By the end of 2030, the milestone year for short-term GHG mitigation measures, this rate reaches 80.3%.
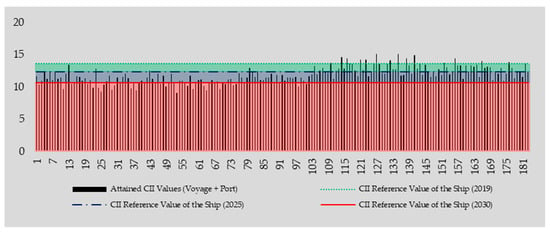
Figure 6.
CII values of ships for each voyage.
Sea and weather conditions are among the factors affecting ship fuel consumption. Seasonal changes have a marked effect on sea states, making ship navigation challenging. Figure 7 presents the seasonal distribution of the attained CII values.
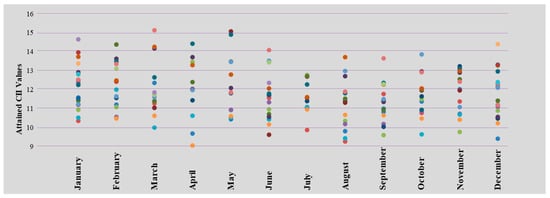
Figure 7.
The seasonal distribution of the attained CII values.
The lowest CII values were recorded in April (9.07), August (9.28), and December (9.42), respectively. Conversely, the highest values were observed in March (15.13) and May (15.08), exceeding the CIIref threshold. When examining the average CII values, the lowest averages have been found in August (11.22), September (11.33), and July (11.58).
Based on the attained CII values, ships are assigned ratings that range from A to E. The CIIref value, ship-type-specific coefficients, and a reduction factor relative to 2019 determine the ratings. For 183 voyages, line-based CII values and their corresponding ratings have been calculated from 2023 to 2030, as illustrated in Figure 8.
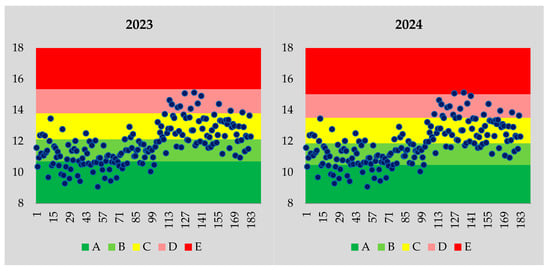
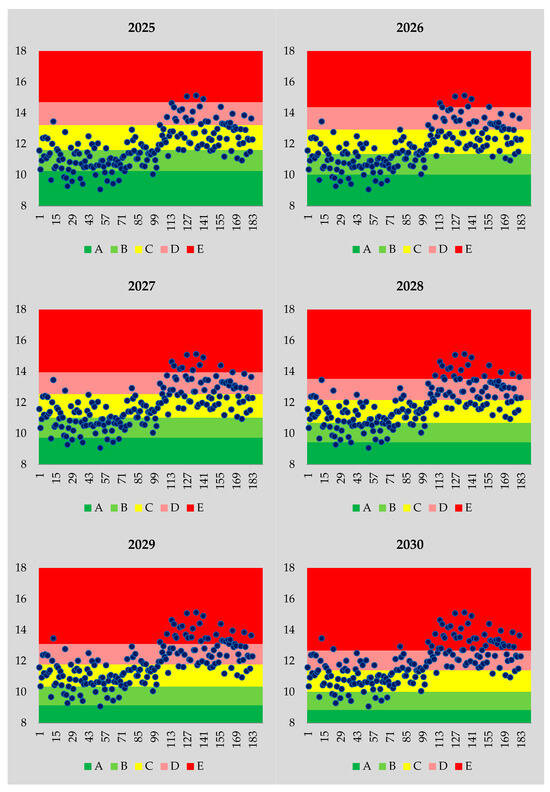
Figure 8.
CII values and grades of voyages.
As the reduction factor increases from 2023 to 2026, the CII ratings of voyages are expected to decline, resulting in lower ratings as the years progress. In 2023, the distribution of the CII ratings among the 183 voyages is as follows: 6.6% have been classified as D grade, 29.5% as C grade, 43.2% as B grade, and 20.8% as A grade. Notably, none of the voyages have received an E grade.
By 2024, the proportion of voyages rated A has decreased to 13.66% among the attained CII values. The highest shares have been held by the B and C grades, at 33.33% and 42.08%, respectively, totaling 75.41%. While no voyages were rated E in 2023, the rating of 2 voyages, representing 1.09%, has been downgraded to E grade. Additionally, 9.84% of the attained CII values fall within the D.
In 2025, the rating of one additional voyage has declined to grade E, bringing the total to three voyages within the E-grade boundaries. Meanwhile, 17 voyages, representing 9.29%, have maintained a rating of A. Consistent with 2023 and 2024, most voyages have been concentrated in grade B, with a rate of 39.89%. This is followed by grade C at 34.43% and D at 14.75%, respectively. The number of voyages falling to grade E was 3. By 2026, the distribution of voyage ratings has shifted significantly. The intensity of grade B ratings has transitioned to grade C, which now accounts for 42.62% of the total, corresponding to 78 voyages. Due to the high reduction factor of 11% applied in 2026, only 12 voyages can maintain a grade A rating. Additionally, 57 voyages, representing 31.15%, have fallen within grade B. The rates of grades D and E have been 16.39% and 3.28%, respectively.
The reduction factors defined in MEPC 83 applied between 2027 and 2030 significantly affect the voyage grade of the container ships. Because the reduction factors increase exponentially between these years, by the end of 2023, none of the voyages of container ships can be maintained at grade A. Unlike other years, most of the container ships rates in grades C at a rate of 34.43% and D at 33.88%. The number voyage of 46 container ships is in grade E, which is the lowest grade. Container ships remaining in CII Grades D and E will face operational disruptions, potentially hindering their ability to comply with regulatory requirements and maintain service continuity on their liner connectivity [22].
To ensure the sustainability of maritime transport and enhance operational efficiency, fleet management must be aligned with determined energy efficiency measures [23]. Therefore, it is essential to implement energy efficiency enhancement measures and CO2 emission mitigation applications on container ships classified as Grade E. The implementation of energy-saving technologies or the use of alternative and renewable clean fuels to meet the CIIref values and operate vessels at higher CII ratings may burden additional operational and capital costs for ship-owner [22].
The total fuel consumption for the 183 voyages, including navigation and port operations, has been thoroughly calculated. During the waiting time in port, the ships consumed 6441.95 tons of HFO and 6101.77 tons of MGO. During navigation, the total fuel consumption was 213,606.16 tons of HFO and 12,027.70 tons of MGO.
Shore electrical energy supply in ports is designed to minimize or eliminate fuel consumption during ship berthing and port operations. This initiative significantly improves air quality in port areas and helps reduce the attained CII of ships, leading them to lower grades. However, the carbon intensity of shore-side electricity generation and its overall environmental sustainability represent critical factors that must also be considered. The resources used in electricity generation vary from country to country. Investigated container ships operate along the Transatlantic trade corridor, specifically servicing the East Coast of North America to the Europe-Mediterranean line. In this study, fuel prices are sourced from the Port of Istanbul, which also serves as the point of departure for the container vessels. Therefore, the resources used by Turkey in electricity generation should be taken into consideration at the stage of applying cold ironing. Considering these sources are analyzed, 35.2% is obtained from coal, 18.9% from natural gas, 21.5% from hydraulic energy, 10.5% from wind, 7.5% from solar, 3.2% from geothermal energy, and 3.2% from other sources [63]. When ships utilize land-based electricity during their waiting time in port, the attained CII values have been calculated based on the performance of a single voyage where the amount of fuel consumption of auxiliary engines during the waiting time of the ship in the port is not considered.
4.2. Economic Analysis
The total annual energy required to meet the energy needs of the case study fleet vessels at the port has been calculated to be 28,463.27 MWh. Additionally, the required navigation energy for the fleet has been determined to be 491,272.81 MWh. The annual grid electricity price has been computed at $4,554,123.64. When the CO&M is added, the total annual expenses for CI at the port facility amount to $4,997,909.64. Based on this annual expenditure and the facility’s CI, the LCOE for CI has been calculated at $190.96 per MWh. Table 3 presents the tariff, costs for the fleet, and the annual income generated for the port from the CI service under the cases outlined in the methodology.

Table 3.
Tariff, annual costs for fleet, and port annual profit for CI service.
When the CI price is calculated using 5% and 10% r values, the resulting differences are −0.38% and +0.59%, respectively. Case 1 shows the service provision without incorporating any profit margin, while Cases 2 through 4 progressively escalate the PR from 10% to 30%. The annual fuel costs for the case study fleet, expressed in USD, are detailed in Table 4.

Table 4.
Annual fuel costs of case study vessels.
The total annual fuel cost of the fleet has varied between $27,717,884 and $30,754,432, depending on the fuel prices. Figure 9 illustrates the LCOE values for the fleet, comparing scenarios with and without the CI usage based on the pricing details outlined in Table 3 and fuel price scenarios.
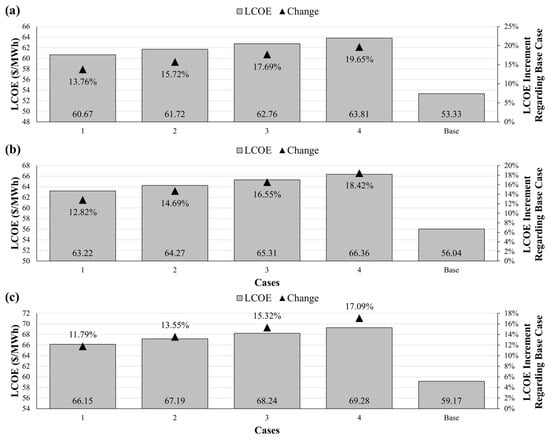
Figure 9.
LCOE of cases under (a) low, (b) average, (c) high fuel prices.
The LCOE for the base case has fluctuated between $53.33 and $59.17 per MWh, contingent upon fuel prices. The CI service inclusion for the fleet has resulted in a 13.76% increase in the low fuel price scenario, even at the lowest tariff. This disparity has escalated as the PR increases, culminating at 19.65%. Notably, the overall increment in the LCOE has decreased with rising fuel prices. Under the lowest tariff, the increase compared to the base case has been 12.82% and 11.79% in average and high fuel price scenarios, respectively, peaking at 18.42% and 17.09%. Table 5 indicates the cash flows and NPV of CI cases.

Table 5.
Cash flows and NPV of CI cases.
The cash flow and NPV values have indicated that the investment value is realized near the end of the plant’s LT if the PR is not implemented. The DPPs derived from the calculations are presented in Figure 10.
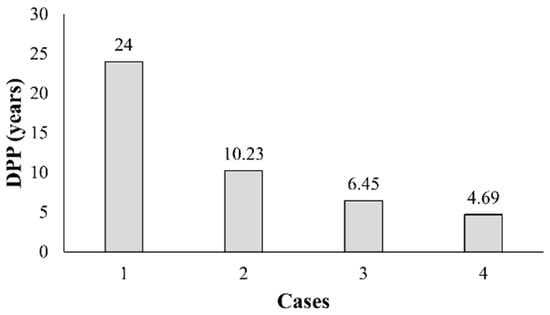
Figure 10.
DPPs of CI cases.
Case 1 has shown the longest DPP at 24 years, suggesting substantial challenges in achieving profitability under this scenario. In contrast, Cases 2, 3, and 4 have demonstrated progressively shorter DPPs of 10.23, 6.45, and 4.69 years, respectively. This trend has demonstrated that the implementation of specific PRs can markedly enhance financial viability, reducing the time to recoup investment.
With an r value of 5%, the DPPs for Cases 2, 3, and 4 changed by −1.22%, −1.32%, and −1.29%, respectively. In contrast, an r value of 10% resulted in changes of +1.81%, +1.97%, and +1.92% for these cases. Notably, the DPP for Case 1 remained unchanged despite variations in the r value.
Regarding NPVs, at an r value of 5%, NPVs decreased by 1.10%, 1.37%, 2.07%, and 2.41% for Cases 1 through 4, respectively. Conversely, the calculations at an r value of 10% led to an increase in the NPV of Case 1 by 1.67%, while NPVs for Cases 2, 3, and 4 decreased by 1.89%, 2.92%, and 3.40%, respectively.
4.3. The Effect of the CI Implementation on the Carbon Intensity
It is known that ships generate electrical energy from auxiliary engines to provide the necessary energy for the vessel during the waiting period in ports. Although not as much as the total fuel consumption of the ship during sailing, a significant amount of fuel is consumed during the waiting period in ports. If the ship is not equipped with engine systems using alternative fuels, it usually generates electricity using conventional fuel, where HFO and MGO are mostly utilized. The utilization of conventional marine fuels has an adverse impact on the compliance of a vessel’s energy efficiency measures and environmental performance. It also leads to deteriorating air quality in and around port areas and exacerbates noise pollution. The implementation of CI during vessel waiting times at port has been experienced to significantly mitigate these adverse impacts. Furthermore, the use of CI has been demonstrated to help improve the CII, which is one of the energy efficiency measures, and the value of ships by eliminating the need for fuel used for electricity generation. Based on line-based noon reports, Figure 11 illustrates the attained CII values and their grades of the vessels by means of utilizing CI application from 2023 to 2030.
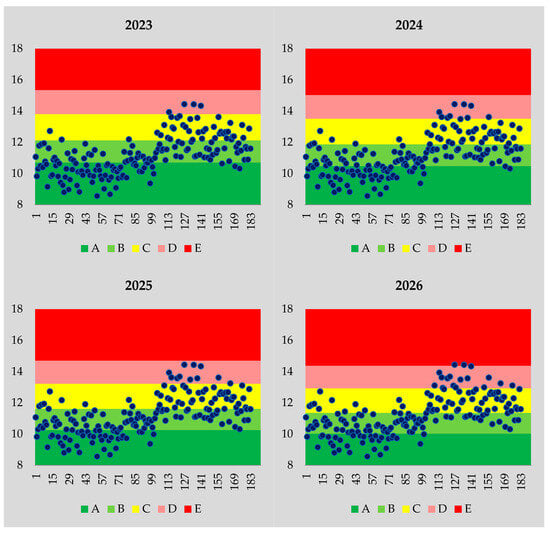
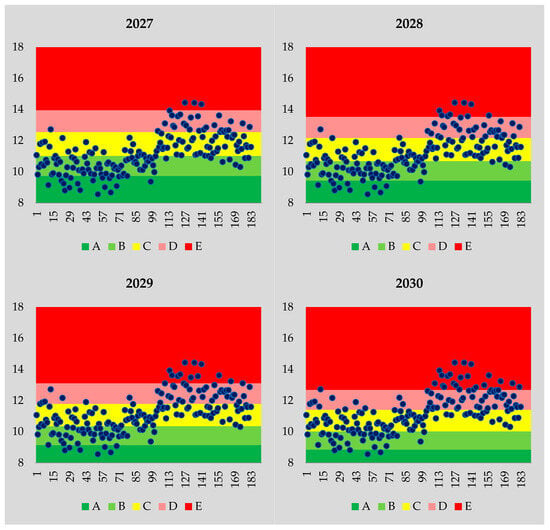
Figure 11.
CII values and grades of voyages with the implementation of CI.
None of the container ship voyages have been ranked as grade E within the CII rating boundaries established for 2023. The CII ratings of the container ship voyages, corresponding to 76.5% of the total voyages, are ranked within Grades A and B g. From 2023 to 2026, there is no significant change in CII ratings of container ships, and most of their voyages are rated as Grade C and above.
However, at the end of 2026, the two voyages with average speeds of 14.80 and 15.42 knots, respectively, have fallen to Grade E. Notably, their average speeds are higher than the overall average speed of 14.77 knots. This shift underscores the impact of performance metrics such as vessel speed on CII ratings. Moreover, findings support the hypothesis that not implementing slow steaming on the ships negatively impacts the CII rating [23,64]. However, slow steaming elevates operational costs as it results in extended voyage durations.
During 2026, the CII ratings of the voyages are still above C grade. During 2027, only one voyage, having 14.16 knots average speed, CII rating fell to Grade E, but the density in Grade B of voyages is gradually shifting to Grade C. In addition to the ship speed affecting the CII rating, factors such as weather conditions, the navigation performance of the ship, voyage performance, and the maintenance of the main engine and auxiliaries could have led to Grade decline. In 2028, the number of grade E voyages is 9, and the container ship voyages mostly intensified in Grade C.
Looking ahead to 2029, The number of container ship voyages that can be held at Grade A is only 7, corresponding to 3.83% of all voyages, and is proportionally behind the other grades. Since the largest reduction factor was applied in 2030, the lowest grades have been obtained this year. The number of container ship voyages rated Grade A, B, C, D, and E are 23, 50, 78, 28, and 4, respectively. This highlights the necessity for further measures beyond slow steaming [64], route optimization, planned propulsion system maintenance, and advanced energy-saving practices [23] to ensure compliance with energy efficiency measures by 2030 and beyond.
Given that the carbon factor of marine fuels is a primary determinant in the calculation of CII ratings, the shift toward cleaner and renewable fuel alternatives is vital for regulatory compliance and alignment with rising environmental awareness [23].
4.4. Policy and Infrastructure Bottlenecks in CI Implementation
Although CI offers notable environmental and regulatory advantages, its large-scale adoption is not without significant challenges. A critical examination of infrastructural, regulatory, and economic constraints is necessary to assess the real-world feasibility of CI implementation, particularly across diverse port contexts and global shipping routes. In emerging economies where CI is to be implemented, the electricity mix still relies heavily on coal and natural gas [65]. This limits CI’s net environmental benefits and raises concerns because it leads to considerable carbon leakage from shore to grid. This type of CI application only eases compliance with international maritime regulations for the vessels; however, it increases the load on the main electricity grid, potentially leading to challenges in ensuring reliable energy access for communities and land-based industries.
CI infrastructure entails high capital investment and technical retrofitting of berth facilities, which are not feasible for many small-to-medium ports [52]. The use of renewable energy for shore-side electricity supply involves substantial initial investment costs [32]. This is particularly relevant given that IMO’s regulatory timelines are uniform, irrespective of port capacity, creating a compliance gap for less-developed ports. The lack of globally unified CI connection standards (frequency, voltage, safety interfaces) complicates interoperability across shipping lines and ports, potentially undermining operational continuity [66]. While IMO recognizes CI as a GHG mitigation measure, national and regional policies, especially those governing grid tariffs, subsidies, and taxation, are often not aligned with maritime decarbonization objectives [38]. This creates policy friction between the energy and transport sectors. Ports that adopt CI may incur substantial operating costs with uncertain returns unless state-backed incentives, emission credit schemes, or mandatory regulations are introduced to ensure adoption.
5. Conclusions
In line with the IMO and global environmental awareness aim to reduce GHG, especially CO2 emissions, from ships, this study investigated CO2 emissions reduction from ships while waiting at port using CI technology. The container ship’s attained CII values and CII ratings are studied considering the reduced CO2 amounts via CI. A cost analysis of the CI system was performed in the scope of the affordable clean energy SDG target.
The outputs obtained are as follows:
- Voyage-based CII values of container ships using conventional fuel still meet the limits with a 68.9% rate by the end of 2025. This rate was 90.7% in 2019. However, in the coming years, the use of fossil fuels by container ships will not be sufficient to meet the CIIref values and will cause a significant decrease in CII ratings.
- The findings reveal that in the absence of energy efficiency enhancement measures, the compliance rate of container ships with the CIIref value drops to 19.7% by the end of 2030.
- While a considerable amount of marine fuel is consumed during sailing time for container ships, a substantial amount of fuel is also used to generate electrical power during waiting time at the port. The fuel consumed during the waiting period in the port causes regional pollution and significantly affects the attained CII values and ratings of the container ships.
- The implementation of CI eliminates emissions from ships in ports and significantly lowers voyage-based emissions to the attained CII values. By the end of 2025, 82% of attained CII values of ships exceed the reference value. Looking ahead to 2030, this rate stands at 37.2%, which is notably favorable compared to container vessels that do not utilize CI technology at port.
- Because cost is an important factor in the CI installation, achieving a 4.69-year DPP among the developed scenarios encourages port operators to adopt this application.
- Since the CI application only reduces CO2 emissions in the port, switching to alternative and renewable fuels on ships is necessary to further reduce emissions, especially during sailing. Zero-carbon fuels, energy-saving devices, and after-treatment systems such as carbon capture and storage are particularly recommended.
- Moreover, ship onboard measures aimed at enhancing energy efficiency and reducing harmful emissions must be economically feasible. Excessive installation and operational costs can undermine SDG 7, which emphasizes affordable and clean energy as a cornerstone of sustainability efforts.
- In particular, the application of CI with utilized alternative or renewable energy sources can provide vital gains to perform the goals of SGDs, especially for climate action.
- As an effective way to reduce emissions, state incentives for CI should be increased, and its implementation should be made widespread.
A limitation of this research is that only container ships were analyzed due to the difficulty of obtaining data. It is recommended that different ship types be analyzed and comparisons be made between ship types in future studies. In addition, the mechanical and navigational conditions of the ships and the differences in the crew managing the ship could not be included in the analysis because they were not available in the data and could not be observed. In addition to this study, it is thought that a future study that will evaluate the use of alternative and renewable fuels with after-treatment systems in the sailing of ships and the use of CI using renewable resources will make a significant contribution to the literature.
Author Contributions
Conceptualization, C.S., M.B., A.S., and O.Y.; methodology, C.S., M.B., and O.Y.; formal analysis, A.S., M.B., and O.Y.; investigation, M.B., A.S., and O.Y.; resources, C.S.; data curation, C.S. and M.B.; writing—original draft preparation, C.S., M.B., A.S., and O.Y.; writing—review and editing, C.S. and A.S.; visualization, C.S., M.B., and O.Y.; supervision, M.B. and O.Y. All authors have read and agreed to the published version of the manuscript.
Funding
This research received no external funding.
Institutional Review Board Statement
Not applicable.
Informed Consent Statement
Not applicable.
Data Availability Statement
Data not available due to [ethical/legal/commercial] restrictions.
Conflicts of Interest
The authors declare no conflicts of interest.
References
- Rony, Z.I.; Mofijur, M.; Hasan, M.M.; Rasul, M.G.; Jahirul, M.I.; Ahmed, S.F.; Kalam, M.A.; Badruddin, I.A.; Khan, T.M.Y.; Show, P.-L. Alternative Fuels to Reduce Greenhouse Gas Emissions from Marine Transport and Promote UN Sustainable Development Goals. Fuel 2023, 338, 127220. [Google Scholar] [CrossRef]
- Han, Z.; Zhu, X.; Su, Z. Forecasting Maritime and Financial Market Trends: Leveraging CNN-LSTM Models for Sustainable Shipping and China’s Financial Market Integration. Sustainability 2024, 16, 9853. [Google Scholar] [CrossRef]
- UNCTAD Review of Maritime Transport 2024. 2024. Available online: https://unctad.org/publication/review-maritime-transport-2024 (accessed on 23 March 2025).
- Haque, F.; Ntim, C.G. Environmental Policy, Sustainable Development, Governance Mechanisms and Environmental Performance. Bus. Strategy Environ. 2018, 27, 415–435. [Google Scholar] [CrossRef]
- Zis, T.; North, R.J.; Angeloudis, P.; Ochieng, W.Y.; Bell, M.G.H. Evaluation of Cold Ironing and Speed Reduction Policies to Reduce Ship Emissions near and at Ports. Marit. Econ. Logist. 2014, 16, 371–398. [Google Scholar] [CrossRef]
- Winnes, H.; Styhre, L.; Fridell, E. Reducing GHG Emissions from Ships in Port Areas. Res. Transp. Bus. Manag. 2015, 17, 73–82. [Google Scholar] [CrossRef]
- Alamoush, A.S.; Ölçer, A.I.; Ballini, F. Ports’ Role in Shipping Decarbonisation: A Common Port Incentive Scheme for Shipping Greenhouse Gas Emissions Reduction. Clean. Logist. Supply Chain. 2022, 3, 100021. [Google Scholar] [CrossRef]
- Hoang, A.T.; Foley, A.M.; Nižetić, S.; Huang, Z.; Ong, H.C.; Ölçer, A.I.; Nguyen, X.P. Energy-Related Approach for Reduction of CO2 Emissions: A Critical Strategy on the Port-to-Ship Pathway. J. Clean. Prod. 2022, 355, 131772. [Google Scholar] [CrossRef]
- Merico, E.; Cesari, D.; Gregoris, E.; Gambaro, A.; Cordella, M.; Contini, D. Shipping and Air Quality in Italian Port Cities: State-of-the-Art Analysis of Available Results of Estimated Impacts. Atmosphere 2021, 12, 536. [Google Scholar] [CrossRef]
- Sorte, S.; Rodrigues, V.; Borrego, C.; Monteiro, A. Impact of Harbour Activities on Local Air Quality: A Review. Environ. Pollut. 2020, 257, 113542. [Google Scholar] [CrossRef]
- Toscano, D. The Impact of Shipping on Air Quality in the Port Cities of the Mediterranean Area: A Review. Atmosphere 2023, 14, 1180. [Google Scholar] [CrossRef]
- Boikos, C.; Siamidis, P.; Oppo, S.; Armengaud, A.; Tsegas, G.; Mellqvist, J.; Conde, V.; Ntziachristos, L. Validating CFD Modelling of Ship Plume Dispersion in an Urban Environment with Pollutant Concentration Measurements. Atmos. Environ. 2024, 319, 120261. [Google Scholar] [CrossRef]
- Papaefthimiou, S.; Sitzimis, I.; Andriosopoulos, K. A Methodological Approach for Environmental Characterization of Ports. Marit. Policy Manag. 2017, 44, 81–93. [Google Scholar] [CrossRef]
- Ducruet, C.; Martin, B.P.; Sene, M.A.; Prete, M.L.; Sun, L.; Itoh, H.; Pigné, Y. Ports and Their Influence on Local Air Pollution and Public Health: A Global Analysis. Sci. Total Environ. 2024, 915, 170099. [Google Scholar] [CrossRef] [PubMed]
- Chatzinikolaou, S.D.; Oikonomou, S.D.; Ventikos, N.P. Health Externalities of Ship Air Pollution at Port–Piraeus Port Case Study. Transp. Res. D Transp. Environ. 2015, 40, 155–165. [Google Scholar] [CrossRef]
- Barberi, S.; Sambito, M.; Neduzha, L.; Severino, A. Pollutant Emissions in Ports: A Comprehensive Review. Infrastructures 2021, 6, 114. [Google Scholar] [CrossRef]
- Ismail, A.M.; Ballini, F.; Ölçer, A.I.; Alamoush, A.S. Integrating Ports into Green Shipping Corridors: Drivers, Challenges, and Pathways to Implementation. Mar. Pollut. Bull. 2024, 209, 117201. [Google Scholar] [CrossRef]
- Paulauskas, V.; Filina-Dawidowicz, L.; Paulauskas, D. The Method to Decrease Emissions from Ships in Port Areas. Sustainability 2020, 12, 4374. [Google Scholar] [CrossRef]
- Senol, Y.E.; Seyhan, A. A Novel Machine-Learning Based Prediction Model for Ship Manoeuvring Emissions by Using Bridge Simulator. Ocean. Eng. 2024, 291, 116411. [Google Scholar] [CrossRef]
- Im, N.; Choe, B.; Park, C.-H. Developing and Applying a Ship Operation Energy Efficiency Evaluation Index Using SEEMP: A Case Study of South Korea. J. Mar. Sci. Appl. 2019, 18, 185–194. [Google Scholar] [CrossRef]
- Govindan, K.; Dua, R.; Anwar, A.H.M.M.; Bansal, P. Enabling Net-Zero Shipping: An Expert Review-Based Agenda for Emerging Techno-Economic and Policy Research. Transp. Res. E Logist. Transp. Rev. 2024, 192, 103753. [Google Scholar] [CrossRef]
- Hua, R.; Yin, J.; Wang, S.; Han, Y.; Wang, X. Speed Optimization for Maximizing the Ship’s Economic Benefits Considering the Carbon Intensity Indicator (CII). Ocean. Eng. 2024, 293, 116712. [Google Scholar] [CrossRef]
- Yuan, Q.; Wang, S.; Peng, J. Operational Efficiency Optimization Method for Ship Fleet to Comply with the Carbon Intensity Indicator (CII) Regulation. Ocean Eng. 2023, 286, 115487. [Google Scholar] [CrossRef]
- Seyhan, A.; Ay, C.; Deniz, C. Evaluating the Emission Reduction Efficiency of Automatic Mooring System and Cold Ironing: The Case of a Port in Izmit Bay. Aust. J. Marit. Ocean. Aff. 2022, 15, 227–245. [Google Scholar] [CrossRef]
- Yuksel, O.; Bayraktar, M.; Seyhan, A. Environmental and Economic Analysis of Cold Ironing Using Renewable Hybrid Systems. Clean Technol. Environ. Policy 2024, 1–29. [Google Scholar] [CrossRef]
- Roberts, T.; Williams, I.; Preston, J.; Clarke, N.; Odum, M.; O’Gorman, S. Ports in a Storm: Port-City Environmental Challenges and Solutions. Sustainability 2023, 15, 9722. [Google Scholar] [CrossRef]
- Piccoli, T.; Fermeglia, M.; Bosich, D.; Bevilacqua, P.; Sulligoi, G. Environmental Assessment and Regulatory Aspects of Cold Ironing Planning for a Maritime Route in the Adriatic Sea. Energies 2021, 14, 5836. [Google Scholar] [CrossRef]
- von Malmborg, F. Explaining Differences in Policy Learning in the EU" Fit for 55” Climate Policy Package. Eur. Policy Anal. 2024, 10, 412–448. [Google Scholar] [CrossRef]
- FuelEU Decarbonising Maritime Transport—FuelEU Maritime. Available online: https://transport.ec.europa.eu/transport-modes/maritime/decarbonising-maritime-transport-fueleu-maritime_en (accessed on 3 February 2025).
- Peddi, K.P.; Ricci, S.; Rizzetto, L. Reduction Potential of Gaseous Emissions in European Ports Using Cold Ironing. Appl. Sci. 2024, 14, 6837. [Google Scholar] [CrossRef]
- Sifakis, N.; Tsoutsos, T. Planning Zero-Emissions Ports through the Nearly Zero Energy Port Concept. J. Clean. Prod. 2021, 286, 125448. [Google Scholar] [CrossRef]
- Şenol, Y.E.; Seyhan, A. Renewable Energy-Based Electrical Microgrid of Cold Ironing Energy Supply for Berthed Ships. Turk. J. Marit. Mar. Sci. 2024, 10, 14–26. [Google Scholar] [CrossRef]
- Zis, T.P.V. Prospects of Cold Ironing as an Emissions Reduction Option. Transp. Res. Part A Policy Pract. 2019, 119, 82–95. [Google Scholar] [CrossRef]
- Yan, D.; Chen, C.; Gan, W.; Sasa, K.; He, G.; Yu, H. Carbon Intensity Indicator (CII) Compliance: Applications of Ship Speed Optimization on Each Level Using Measurement Data. Mar. Pollut. Bull. 2025, 212, 117593. [Google Scholar] [CrossRef] [PubMed]
- Rauca, L.; Batrinca, G. Impact of Carbon Intensity Indicator on the Vessels’ Operation and Analysis of Onboard Operational Measures. Sustainability 2023, 15, 11387. [Google Scholar] [CrossRef]
- Bayraktar, M.; Yuksel, O. A Scenario-Based Assessment of the Energy Efficiency Existing Ship Index (EEXI) and Carbon Intensity Indicator (CII) Regulations. Ocean. Eng. 2023, 278, 114295. [Google Scholar] [CrossRef]
- Kim, M.; Lee, J.-Y.; An, S.; Hwang, D.-J. Proposals on Effective Implementation of the Carbon Intensity Indication of Ships. J. Mar. Sci. Eng. 2024, 12, 1906. [Google Scholar] [CrossRef]
- Bakar, N.N.A.; Bazmohammadi, N.; Vasquez, J.C.; Guerrero, J.M. Electrification of Onshore Power Systems in Maritime Transportation towards Decarbonization of Ports: A Review of the Cold Ironing Technology. Renew. Sustain. Energy Rev. 2023, 178, 113243. [Google Scholar] [CrossRef]
- Tang, D.; Jiang, T.; Xu, C.; Chen, Z.; Yuan, Y.; Zhao, W.; Guerrero, J.M. Assessing the Potential for Energy Efficiency Improvement through Cold Ironing: A Monte Carlo Analysis with Real Port Data. J. Mar. Sci. Eng. 2023, 11, 1780. [Google Scholar] [CrossRef]
- Bakar, N.N.A.; Uyanik, T.; Arslanoglu, Y.; Vasquez, J.C.; Guerrero, J.M. Two-Stage Energy Management Framework of the Cold Ironing Cooperative with Renewable Energy for Ferry. Energy Convers. Manag. 2024, 311, 118518. [Google Scholar] [CrossRef]
- Le, S.-T. Research on Drivers and Barriers to the Implementation of Cold Ironing Technology in Zero Emissions Port. Environ. Health Insights 2024, 18, 11786302241265090. [Google Scholar] [CrossRef]
- Bullock, S.; Higgins, E.; Crossan, J.; Larkin, A. Improving Shore Power Project Economics at the Port of Aberdeen. Mar. Policy 2023, 152, 105625. [Google Scholar] [CrossRef]
- Glavinović, R.; Krčum, M.; Vukić, L.; Karin, I. Cold Ironing Implementation Overview in European Ports—Case Study—Croatian Ports. Sustainability 2023, 15, 8472. [Google Scholar] [CrossRef]
- IMO G1 2022 Guidelines on Operational Carbon Intensity Indicators and The Calculation Methods (Cii Guidelines, G1). Available online: https://wwwcdn.imo.org/localresources/en/KnowledgeCentre/IndexofIMOResolutions/MEPCDocuments/MEPC.352(78).pdf (accessed on 16 February 2025).
- IMO G2 2022 Guidelines on the Reference Lines for Use With Operational Carbon Intensity Indicators (Cii Reference Lines Guidelines, G2). Available online: https://wwwcdn.imo.org/localresources/en/KnowledgeCentre/IndexofIMOResolutions/MEPCDocuments/MEPC.353(78).pdf (accessed on 16 February 2025).
- IMO G3 2021 Guidelines on the Operational Carbon Intensity Reduction Factors Relative to Reference Lines (Cii Reduction Factors Guidelines, G3). Available online: https://wwwcdn.imo.org/localresources/en/OurWork/Environment/Documents/Air%20pollution/MEPC.338(76).pdf (accessed on 16 February 2025).
- DNV Ghg Requirements Approved. Available online: https://www.dnv.com/news/imo-mepc-83-ghg-requirements-approved-taking-effect-from-2028/ (accessed on 14 May 2025).
- ClassNK IMO ve IACS. Available online: https://www.classnk.or.jp/hp/pdf/info_service/imo_and_iacs/MEPC83_sumE.pdf (accessed on 14 May 2025).
- IMO the Marine Environment Protection Committee (MEPC). 2025. Available online: https://www.imo.org/en/MediaCentre/MeetingSummaries/Pages/MEPC-83rd-session.aspx (accessed on 14 May 2025).
- Bayraktar, M.; Sokukcu, M. Marine Vessel Energy Efficiency Performance Prediction Based on Daily Reported Noon Reports. Ships Offshore Struct. 2024, 19, 831–840. [Google Scholar] [CrossRef]
- Stergiopoulos, G.; Valvis, E.; Mitrodimas, D.; Lekkas, D.; Gritzalis, D. Analyzing Congestion Interdependencies of Ports and Container Ship Routes in the Maritime Network Infrastructure. IEEE Access 2018, 6, 63823–63832. [Google Scholar] [CrossRef]
- Innes, A.; Monios, J. Identifying the Unique Challenges of Installing Cold Ironing at Small and Medium Ports—The Case of Aberdeen. Transp. Res. D Transp. Environ. 2018, 62, 298–313. [Google Scholar] [CrossRef]
- Inanc En Güncel Elektrik Birim Fiyatları (Temmuz-2024). Available online: https://enerjiajansi.com.tr/elektrik-birim-fiyatlari/ (accessed on 9 February 2024).
- TheEngineeringToolBox Fuels—Higher and Lower Calorific Values. Available online: https://www.engineeringtoolbox.com/fuels-higher-calorific-values-d_169.html (accessed on 11 February 2025).
- Hansen, K. Decision-Making Based on Energy Costs: Comparing Levelized Cost of Energy and Energy System Costs. Energy Strategy Rev. 2019, 24, 68–82. [Google Scholar] [CrossRef]
- Lu, Z.; Chen, Y.; Fan, Q. Study on Feasibility of Photovoltaic Power to Grid Parity in China Based on Lcoe. Sustainability 2021, 13, 12762. [Google Scholar] [CrossRef]
- Jahangiri, M.; Mostafaeipour, A.; Rahman Habib, H.U.; Saghaei, H.; Waqar, A. Effect of Emission Penalty and Annual Interest Rate on Cogeneration of Electricity, Heat, and Hydrogen in Karachi: 3E Assessment and Sensitivity Analysis. J. Eng. 2021, 2021, 6679358. [Google Scholar] [CrossRef]
- Shu, G.; Liu, P.; Tian, H.; Wang, X.; Jing, D. Operational Profile Based Thermal-Economic Analysis on an Organic Rankine Cycle Using for Harvesting Marine Engine’s Exhaust Waste Heat. Energy Convers. Manag. 2017, 146, 107–123. [Google Scholar] [CrossRef]
- Gülmez, Y.; Konur, O.; Yüksel, O.; Korkmaz, S.A. Comparative Economic Assessment of On-Grid Solar Power System Applications Having Limited Areas: A Case Study on a Shore Facility. Environ. Model. Assess. 2024, 29, 667–681. [Google Scholar] [CrossRef]
- Kabir, M.A.; Hasan, M.M.; Hossain, T.; Ahnaf, A.; Monir, H. Sustainable Energy Transition in Bangladeshi Academic Buildings: A Techno-Economic Analysis of Photovoltaic-Based Net Zero Energy Systems. Energy Build. 2024, 312, 114205. [Google Scholar] [CrossRef]
- Tian, Z.; Zeng, W.; Gu, B.; Zhang, Y.; Yuan, X. Energy, Exergy, and Economic (3E) Analysis of an Organic Rankine Cycle Using Zeotropic Mixtures Based on Marine Engine Waste Heat and LNG Cold Energy. Energy Convers. Manag. 2021, 228, 113657. [Google Scholar] [CrossRef]
- Lee, D.H. Cost-Benefit Analysis, LCOE and Evaluation of Financial Feasibility of Full Commercialization of Biohydrogen. Int. J. Hydrog. Energy 2016, 41, 4347–4357. [Google Scholar] [CrossRef]
- Enerji Energy Electricity. Available online: https://enerji.gov.tr/infobank-energy-electricity (accessed on 14 May 2025).
- Zincir, B. Slow Steaming Application for Short-Sea Shipping to Comply with the CII Regulation. Brodogradnja 2023, 74, 21–38. [Google Scholar] [CrossRef]
- Stolz, B.; Held, M.; Georges, G.; Boulouchos, K. The CO2 Reduction Potential of Shore-Side Electricity in Europe. Appl. Energy 2021, 285, 116425. [Google Scholar] [CrossRef]
- Wang, J.; Li, H.; Yang, Z.; Ge, Y.E. Shore Power for Reduction of Shipping Emission in Port: A Bibliometric Analysis. Transp. Res. E Logist. Transp. Rev. 2024, 188, 103639. [Google Scholar] [CrossRef]
Disclaimer/Publisher’s Note: The statements, opinions and data contained in all publications are solely those of the individual author(s) and contributor(s) and not of MDPI and/or the editor(s). MDPI and/or the editor(s) disclaim responsibility for any injury to people or property resulting from any ideas, methods, instructions or products referred to in the content. |
© 2025 by the authors. Licensee MDPI, Basel, Switzerland. This article is an open access article distributed under the terms and conditions of the Creative Commons Attribution (CC BY) license (https://creativecommons.org/licenses/by/4.0/).