Article

Evaluation of the Narrative Value and Experiential Quality of Urban Trails: A Case Study of the Southwest Regional Trail in Chongqing, China

1
School of Architecture and Urban Planning, Chongqing University, Chongqing 400045, China
2
Key Laboratory of New Technology for Construction of Cities in Mountain Area, Ministry of Education, Chongqing University, Chongqing 400045, China
3
School of Arts, Chongqing University, Chongqing 400044, China
*
Author to whom correspondence should be addressed.
Sustainability 2025, 17(12), 5544; https://doi.org/10.3390/su17125544
Submission received: 24 May 2025 / Revised: 11 June 2025 / Accepted: 13 June 2025 / Published: 16 June 2025

Abstract

:
Urban trails, as vital urban spaces that integrate historical context with contemporary life, play a central role in the rise of deep tourism and the “City Walk” phenomenon. Their spatial legibility positions them as distinctive narrative media, serving as a key channel for promoting urban sustainable development and enhancing citizens’ sense of well-being. However, existing research has yet to establish a comprehensive and systematic framework for evaluating the “spatial narrative” of urban trail systems. This study proposes a dual-perspective quantitative framework for evaluating a spatial narrative, combining objective spatial dimensions with human experiential data to identify strengths and potentials for improvement. The Southwest Regional Trail in Chongqing (comprising the Zhongshan Fourth Road Section, People’s Assembly Hall Section, and Datianwan Section) was used as a case study. First, multi-source spatial data were analyzed via space syntax and ArcGIS to evaluate narrative value from an objective spatial perspective. Next, in-depth questionnaire interviews were conducted to collect subjective data, which were analyzed in SPSS to produce a structured analysis of participant feedback. The findings indicate that (1) Among the three sections of the Southwest Regional Trail, the narrative potential zones rank highest in the Zhongshan Fourth Road Section, followed by the People’s Assembly Hall Section and the Datianwan Section. (2) Urban trails characterized by rich narrative themes and cultural activities are more attractive to visitors. (3) The qualities of narrative symbols, routes, and educational elements are the key factors that specifically influence visitors’ satisfaction with the narrative experience on urban trails. Based on these results, we propose targeted planning and design recommendations for the Southwest Regional Trail. The evaluation methodology and process proposed in this study can provide references for design professionals and relevant urban development departments in conducting spatial narrative quantitative evaluations and optimizing sustainability place-making strategies.

1. Introduction

In recent years, while tourism has brought substantial economic benefits to regions worldwide [1], urban tourism has shifted from superficial sightseeing to a mode of deep and immersive experiences [2]. Dominated by younger cohorts, “City Walk” has emerged in China as a novel approach to urban exploration. It emphasizes traversing the intricate urban fabric on foot, understanding the historical context and fostering an emotional bond with the city [3]. Within this process, the “narrative” experience serves as a crucial mechanism for fulfilling this emerging demand [4]. As a key medium for linear spatial narration [5], urban trails guide visitors along purposeful, interpretive routes, thereby nurturing an emotional connection between travelers and place [6,7,8]. For example, the Freedom Trail in Boston, USA, links various historical sites with a red line embedded in the pavement, telling the story of the American Revolutionary War and its aftermath. Similarly, the London Wall Walk in the UK traces the remains of the ancient Roman city wall, guiding visitors through the evolution of London. These internationally renowned spatial narrative practices enhance visitors’ deep engagement through aspects such as experience richness and educational value, thereby contributing significantly to the sustainable development of cities, societies, and cultures.
In the field of urban trail research, data from UNWTO indicated that walking-based tourism ranks among the most popular and ideal forms of visitor experience; when thoughtfully developed and effectively managed, such trails can yield significant social and economic benefits [9]. A survey-based study of Greek trails similarly demonstrated that trails represent a primary lever for tourism development, enhancing not only residents’ leisure opportunities but also the transmission of cultural heritage. Existing research on urban trails has confirmed their positive effects on urban dwellers’ well-being [10], as evidenced by investigations of pedestrian accessibility [11,12], thermal comfort [13], and perceptual studies [14,15]. Specialized inquiries further revealed that visual environmental quality [16], itinerary planning [17,18] and visit duration [19] are critical for elevating visitor attention and satisfaction, whereas the presence of green space [20], richness of infrastructure [21], and degree of public participation [22] are essential for augmenting a trail’s attractiveness. These findings, which address the multifaceted recreational, ecological, and economic values of urban trails [23], provide an empirical foundation for the selection of evaluative indicators in this study. Yet, given the increasingly pronounced tourism value of urban trails, the question of how to cultivate trails endowed with profound interpretability and internal coherence remains insufficiently explored.
Spatial narrative research involves two main subjects: human and space [24]. In recent years, scholars in the field of spatial narrative have examined how narrative structures facilitate visitors’ cognition and comprehension of urban environments from multiple perspectives. In studies of narrative efficacy, methods such as narrative mapping [25], historical and cultural landmark coding integrated with GIS analysis [26], and space syntax [27] have been employed to uncover the structural characteristics of nodes, pathways, and narrative elements within urban settings. These studies indicate that the spatial distribution of narrative elements, along with the resonance of their embedded meanings, can significantly reinforce place identity and enhance tourism attractiveness, while also contributing to the preservation of landscape integrity and the mitigation of commercial encroachment [28,29]. Further investigations into the constituent elements and mechanisms of spatial narrative emphasize the joint construction of spatial legibility and participation by architecture, events, cultural activities, and collective memory [30], alongside visitors’ sensory immersion [31], emotional engagement [32], and behavioral intentions [33] as the core elements and principal drivers enriching narrative richness. However, existing studies tend to adopt a one-sided approach, focusing either on the spatial configuration or solely on the visitor experience. This fragmented perspective obscures the integral relationship between place and perception, which reveals a pressing need for an integrated evaluative framework.
To address this gap, the present study proposes that, within the framework of linear spatial structuring, the intentional cultivation of cultural identity and social interaction [34,35], alongside the reinforcement of associative memory [36,37] and narrative immersion [38], can synergistically integrate bodily participation, cultural perception, and environmental exploration to enhance tourist engagement [39]. On this basis, we propose the construction of a bidimensional evaluation system that incorporates both spatial narrative value (the spatial perspective) and narrative experience (the human perspective). This study aimed to address three core questions:
  • How can a narrative evaluation framework be developed that integrates spatial narrative value (the spatial perspective) with narrative experience (the human perspective)?
  • Which indicators can quantitatively assess the spatial narrative-value elements of urban trails to identify potential high-value zones and their defining spatial characteristics?
  • How can the current state and problems of visitors’ spatial narrative experience be analyzed to extract and distill their key influencing factors?
The findings of this study will provide theoretical foundations and practical guidance for landscape designers, urban planners, and local urban construction and management departments in the future optimization of urban trail narratives.

2. Materials and Methods

2.1. Research Object

This study focused on the Southwest Regional Trail in Yuzhong District, Chongqing, China. According to statistics from the Chongqing Municipal Culture and Tourism Commission, Chongqing hosted 103 million overnight visitors in 2023, making a significant contribution to both domestic and global tourism [40]. In recent years, amid the nationwide “City Walk” craze, Chongqing’s mountain–urban trails have harnessed stairways, sloping ramps, and alleys to link historical and cultural districts and traditional-style scenic areas, thereby crafting captivating urban itineraries. The Southwest Regional Trail, one of the principal routes in Chongqing’s mountain–urban network, extends approximately 4.2 km. It vividly embodies the abundant cultural and historical legacies left by Chongqing during its period as the wartime capital and in the early years of the People’s Republic of China.
According to the on-site trail map of the Southwest Regional Trail and the Special Plan for the Mountain City Trails System in Chongqing’s Main Urban Area issued by the Chongqing Municipal Planning and Natural Resources Bureau [41], the trail is organized into one loop and three branches. This loop, subsequently referred to as the District Ring, consists of Zhongshan Fourth Road, People’s Branch Road, and nearby segments. The three branch sections are: (1) the Zhongshan Fourth Road Section (Section 1), (2) the People’s Great Hall Section (Section 2), and (3) the Datianwan Section (Section 3) (Figure 1). Through multi-stage field investigations, this study has identified and documented 48 spatial nodes across the three sections for subsequent analysis (Table 1).

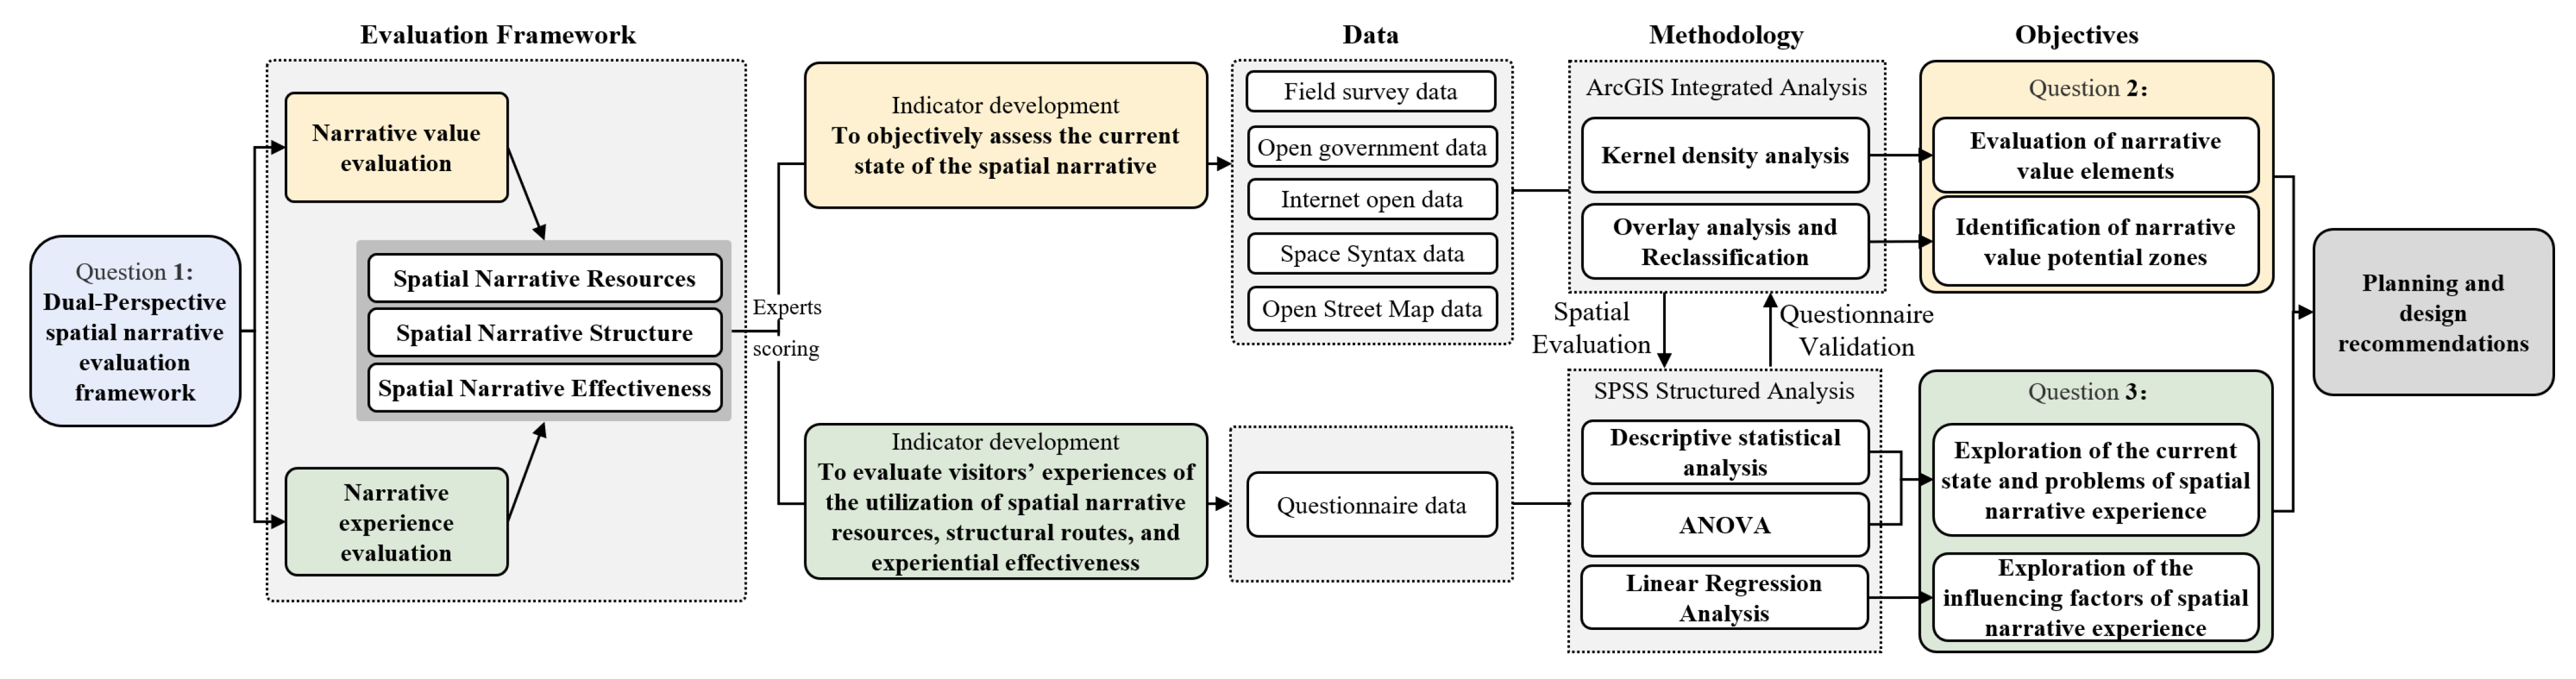
2.2. Evaluation System and Data Sources

To accurately assess the spatial narrative of urban trails in the Southwest Region, we referenced the core concepts and approaches from relevant research on spatial narrative theory [42,43,44]. The evaluation content was divided into two parts: spatial narrative value (from the spatial perspective) and spatial narrative experience (from the human perspective). These were further examined in terms of spatial narrative resources, spatial narrative structure, and spatial narrative efficacy.
Spatial narrative resources refer to the material elements and cultural symbols within urban trails that carry and convey narrative information. Spatial narrative structure refers to the organizational relationships between narrative elements, routes, and stories within the trail space. Spatial narrative efficacy refers to the activation of existing spatial resources, conditions, and advantages.
Based on this foundation, preliminary evaluation indicators for the two parts were established. The first author then organized an expert panel for evaluation, revision, and suggestions. The panel consisted of 13 members, with more than half being young professionals to correspond with the core demographic of current deep tourism, which is primarily youth. The panel included two architects, one urban renewal expert, two landscape designers, two PhD students, and six Master’s students in environmental science, all contributing to enhancing and refining the comprehensiveness of the evaluation system. The final research framework is illustrated in Figure 2.
In the narrative value evaluation, the primary focus was on evaluating the current state of existing narrative resources in the space. Eight spatial evaluation indicators were organized into three categories: Spatial Narrative Resources, Spatial Narrative Structure, and Spatial Narrative Effectiveness (Table 2). Quantitative ranges for each indicator were established to form a five-level rating scale for narrative value across the Southwest Regional Trail. Subsequently, the Analytic Hierarchy Process (AHP) was employed: the importance of each indicator was scored on a five-tier scale, and Yaahp was used to compute weights and perform a consistency check (CR < 0.10) to ensure rationality and coherence.
Indicator data were then collated from multiple sources. Base data on building fabric and trail network geometry were extracted from OpenStreetMap. The dataset was then georeferenced and the road network was corrected by referencing remote sensing imagery and the Amap open platform to improve data accuracy and reliability. Data for Spatial Narrative Resources and Spatial Narrative Effectiveness were gathered from government and Internet open data, as well as on-site surveys administered by field staff. Data for the Spatial Narrative Structure dimension were derived from space syntax analysis of the trail network using Depthmap, yielding metrics such as route integration and choice. Definitions, weights, data sources, and evaluation criteria for all indicators are summarized in Table 3.
In the narrative experience evaluation, the focus is on assessing visitors’ perceptions in three key aspects: the presentation and experiential quality of spatial narrative resources, the route planning and scene structure related to spatial narrative structure, and the emotional and cultural understanding associated with spatial narrative effectiveness. Through discussions by an expert panel, a total of 13 indicators were developed across these three dimensions (Table 4). Each indicator was rated by respondents within the trail area using a five-point Likert scale (1 = very low; 5 = very high). Additionally, a single-item measure, “How satisfied are you with your overall travel experience?” (Table A1, Appendix A), was included to evaluate visitors’ overall satisfaction with the Southwest Regional Trail (1 = strongly disagree; 5 = strongly agree).
The first part of the questionnaire collected basic demographic information from respondents, including gender, age, place of residence, and educational background. Five rounds of on-site surveys were conducted from 8 December 2024 to 16 April 2025. Surveys were carried out primarily on weekends or national public holiday afternoons between 14:00 and 18:00. This time period was chosen for its high pedestrian flow, which satisfied the requirements for random sampling. Sampling points were set at the endpoints of each trail section. To ensure data accuracy, the survey subjects were limited to visitors who had completed the entire trail walk, excluding those who had not finished. After visitors completed their tours, researchers proactively explained the study objectives and survey content. All participants were fully informed, provided voluntary consent, and agreed to complete the questionnaire, which was designed in compliance with the principle of anonymity. A total of 203 questionnaires were collected. After excluding questionnaires with high repetition or missing items, 173 valid questionnaires were retained, comprising 379 records of spatial narrative experience across the three sections.

2.3. Methods and Data Analysis

2.3.1. Methods for Spatial Narrative Value Evaluation

DepthmapX 0.8.0, Python 3.12.7, and GIS 10.8 were integrated to evaluate the spatial narrative value. First, the Space Syntax method was applied using DepthmapX 0.8.0 to quantitatively analyze the trail network. The Choice and Integration metrics were computed under a pedestrian scenario with a local integration radius of 3 [45,46]. Trail centerlines were imported into DepthmapX, segmented, and processed to generate the base data for the two indicators, RC and RI, in the Spatial Narrative Structure dimension.
Second, spatial data encompassing all three dimensions were incorporated and analyzed using GIS-based kernel density estimation (KDE) to identify clustering and dispersion patterns [47] and overall spatial clustering trends [48]. Prior to the analysis, the optimal bandwidth for KDE was determined. Python was employed to implement the Cross-Validation (CV) method using the Scikit-Learn library to evaluate various bandwidth values. A grid search over bandwidths from 10 m to 500 m in 10 m increments (50 candidate values) was conducted via eight-fold cross-validation, and the bandwidth yielding the lowest validation error (220 m) was selected.
Third, the indicator analysis results for the three components—Spatial Narrative Resources, Spatial Narrative Structure, and Spatial Narrative Effectiveness—were assigned weights and then integrated through Overlay Analysis.
Finally, a reclassification procedure was applied to delineate the narrative-value potential zones along the Southwest Regional Trail.

2.3.2. Methods for Spatial Narrative Experience Evaluation

All analyses were performed using SPSS 26. First, the reliability and validity of the questionnaire were assessed, yielding a Cronbach’s α of 0.900, which indicated that the reliability met the required standard; the KMO value was 0.951, and Bartlett’s test of sphericity showed a significance level of 0.000 (p < 0.05), indicating that the validity met the standard. These results warranted subsequent analyses. Second, descriptive statistics were used to summarize respondents’ sociodemographic characteristics and their satisfaction with the trail’s narrative experience. Third, a one-way analysis of variance (ANOVA) was conducted to examine differences in experience indicators among the three sections of the Southwest Regional Trail. Finally, the evaluation of spatial narrative experience was organized into three separate models based on Spatial Narrative Resources, Spatial Narrative Structure, and Spatial Narrative Effectiveness. Linear regression analyses were conducted between the indicators within each model and the Overall Experience Evaluation (OE) to examine the correlations and assess the relative influence of each component. Preliminary results from Pearson correlation analysis showed that all indicators across the three components were significantly correlated with OE at the 0.01 level, indicating that the selection of OE as the dependent variable was appropriate.

3. Results

3.1. Spatial Narrative Value Evaluation

Figure 3 presents the evaluation results of the spatial narrative value. Point colors indicate narrative scores, with dark blue representing high-value locations and light blue indicating low-value ones. The underlying layer shows the kernel density analysis results: warm-colored areas denote high narrative value regions, while cool-colored areas mark low value areas. Black-bordered frames outline the high-value zones identified from the density analysis.

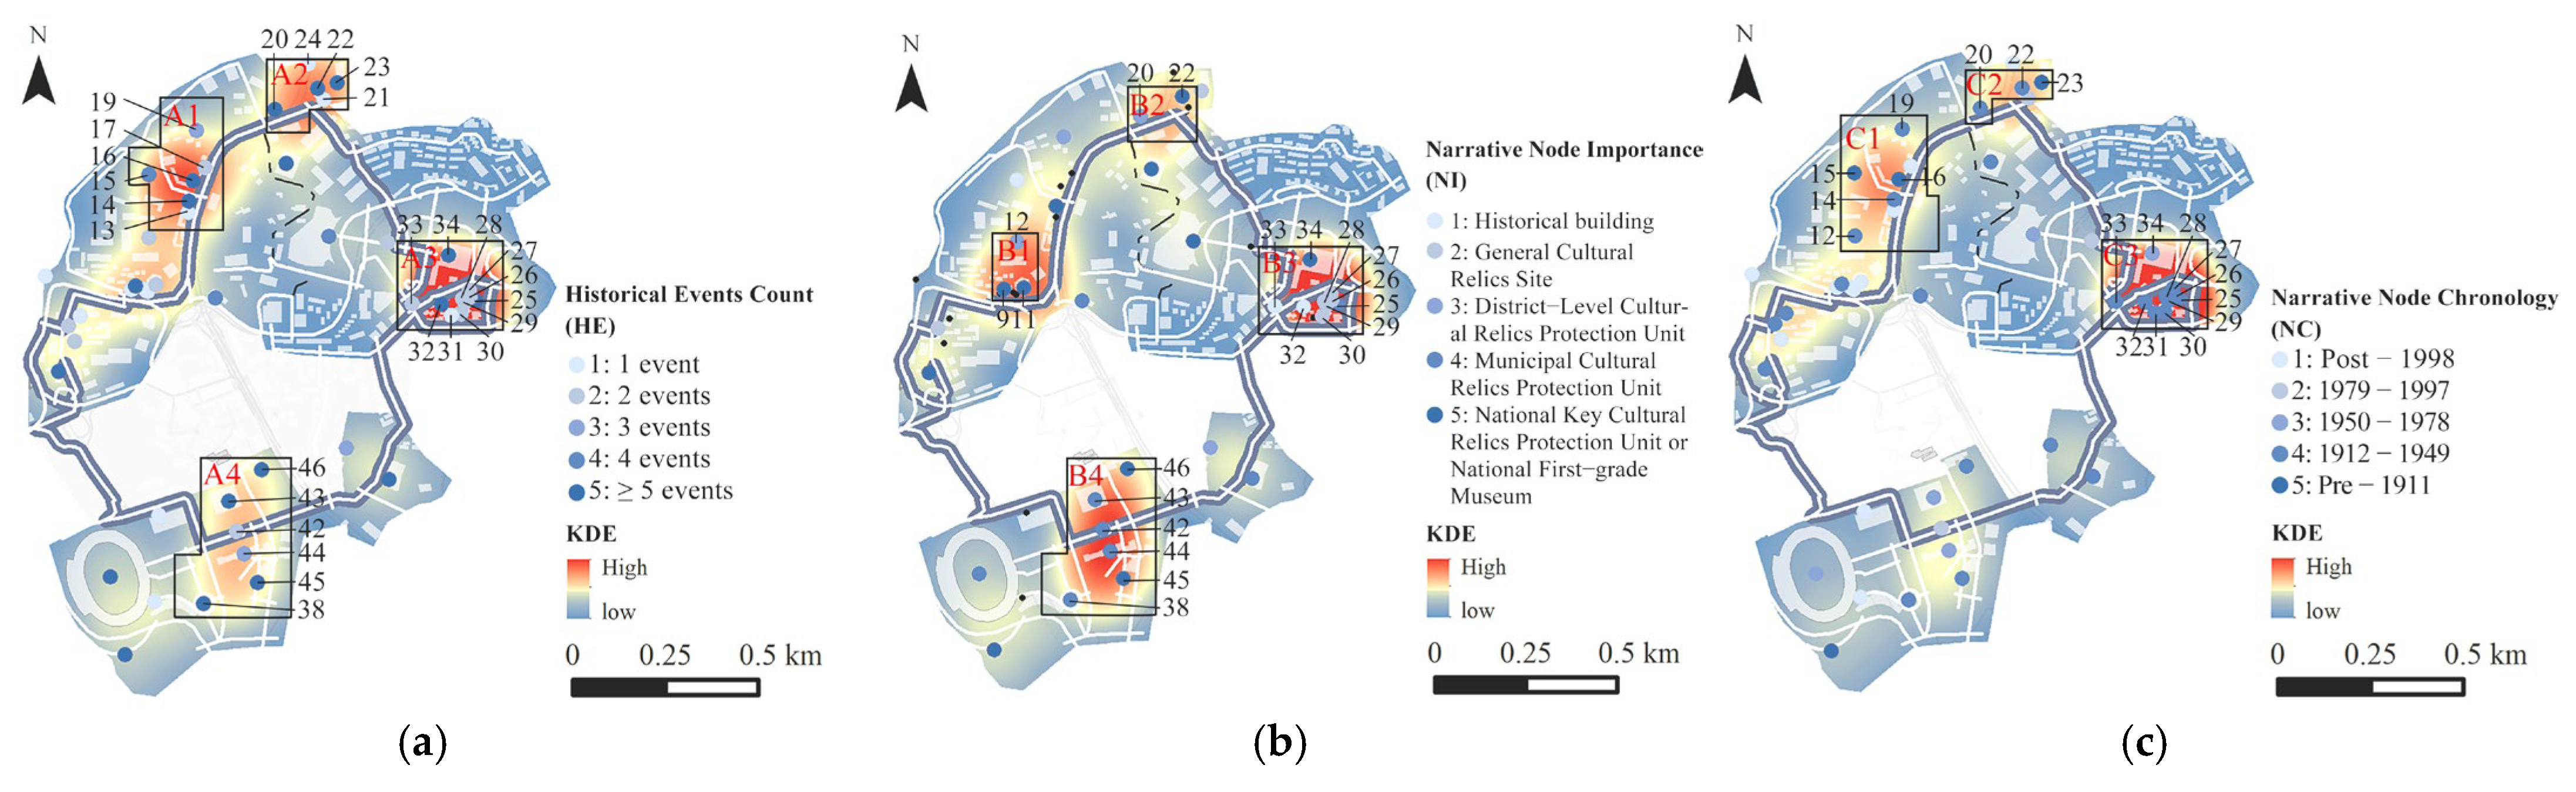
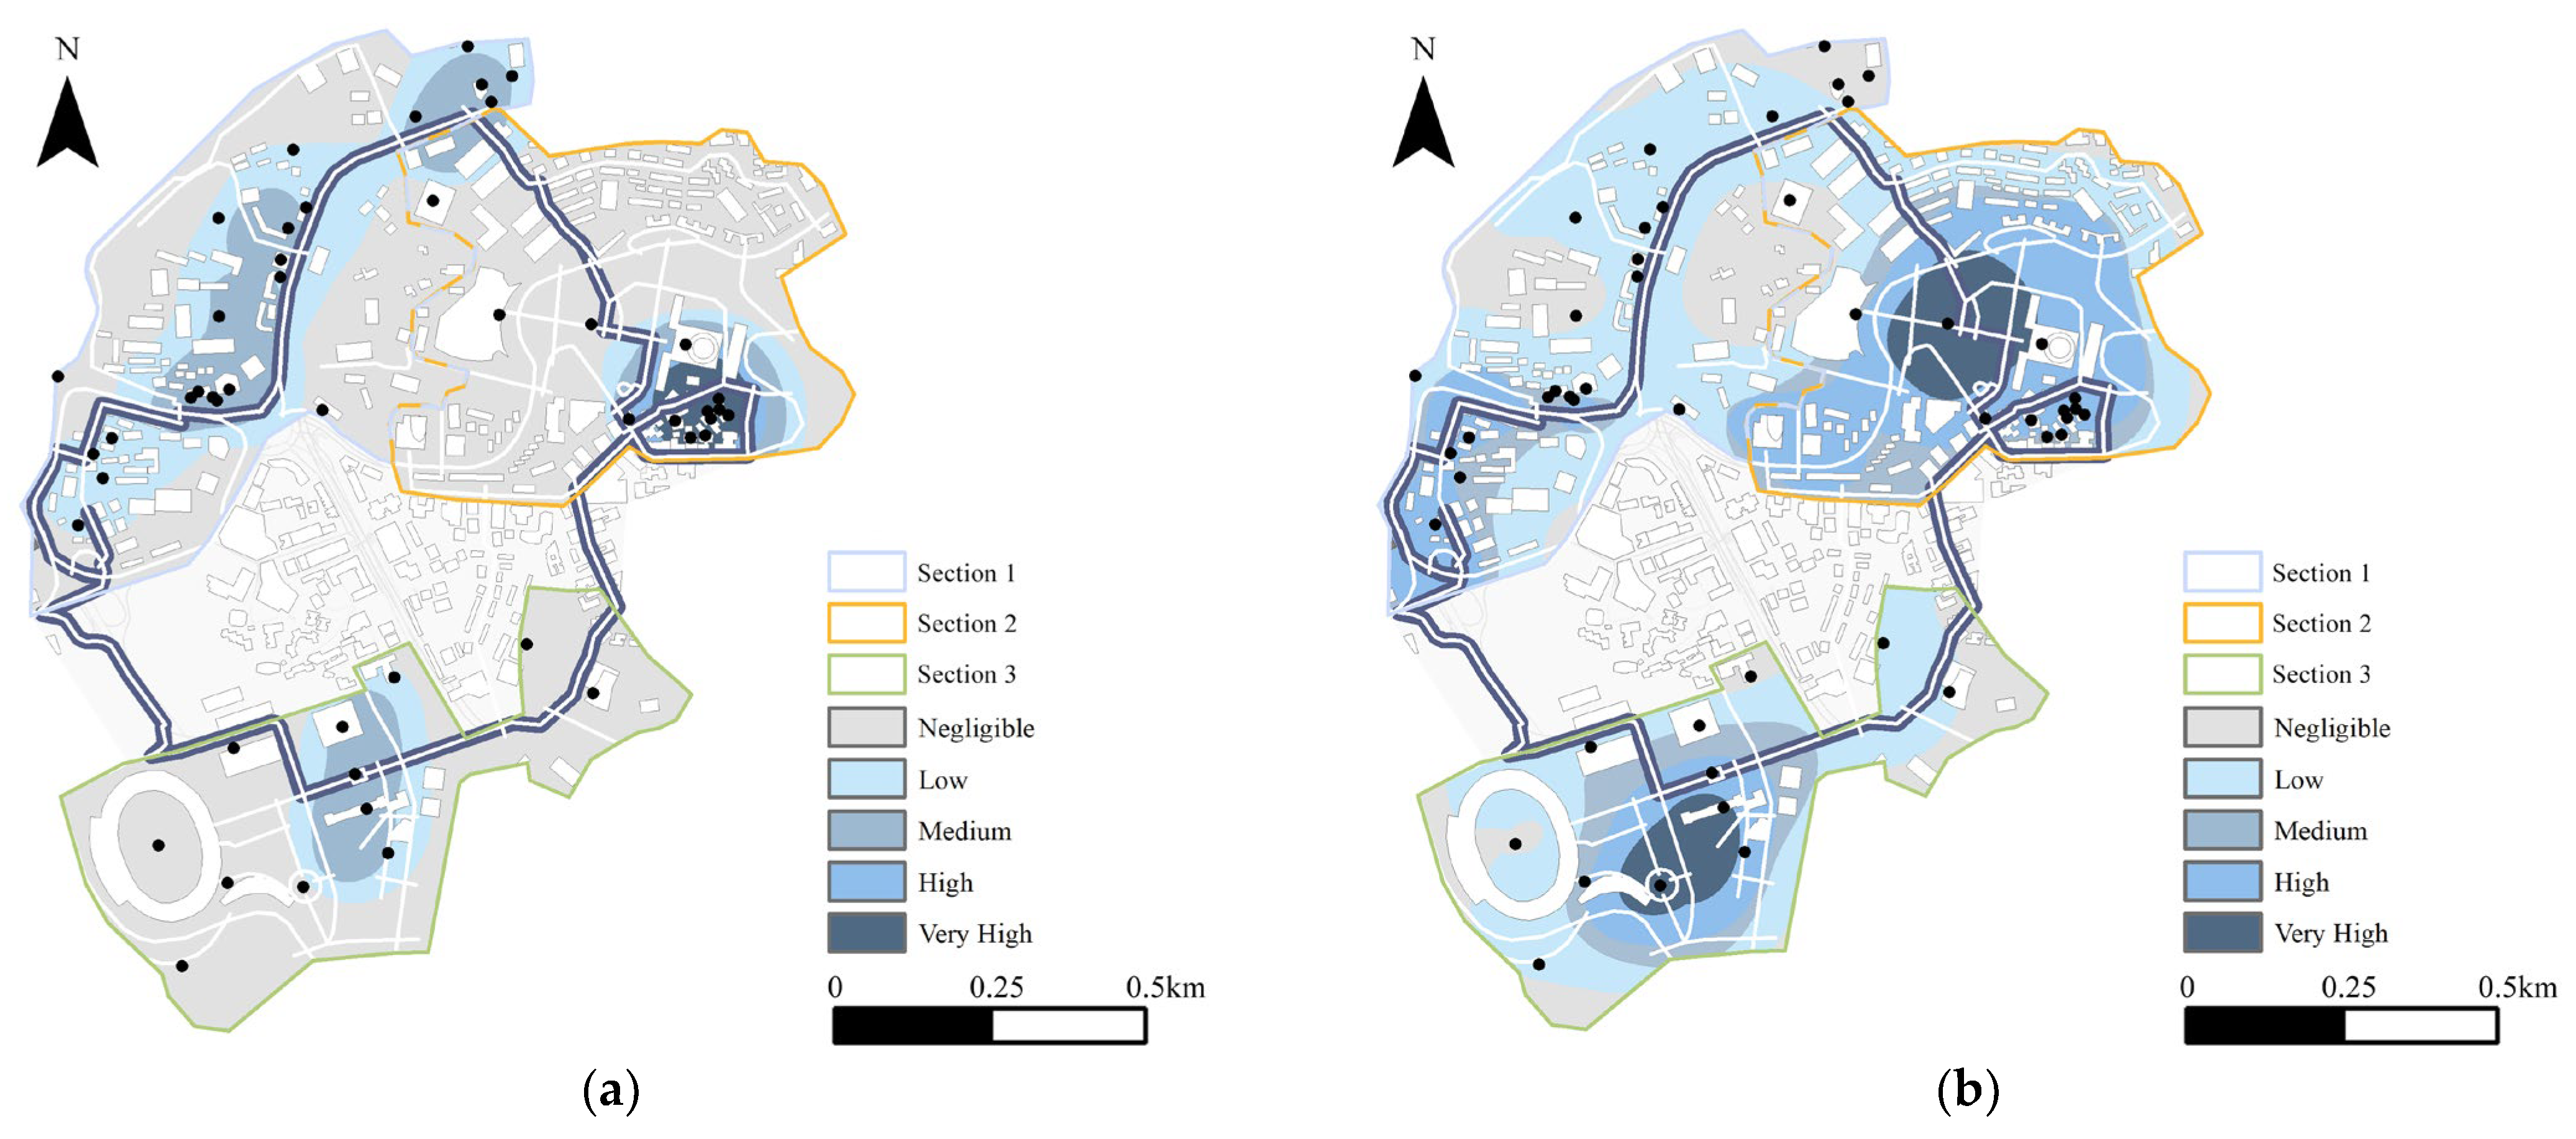
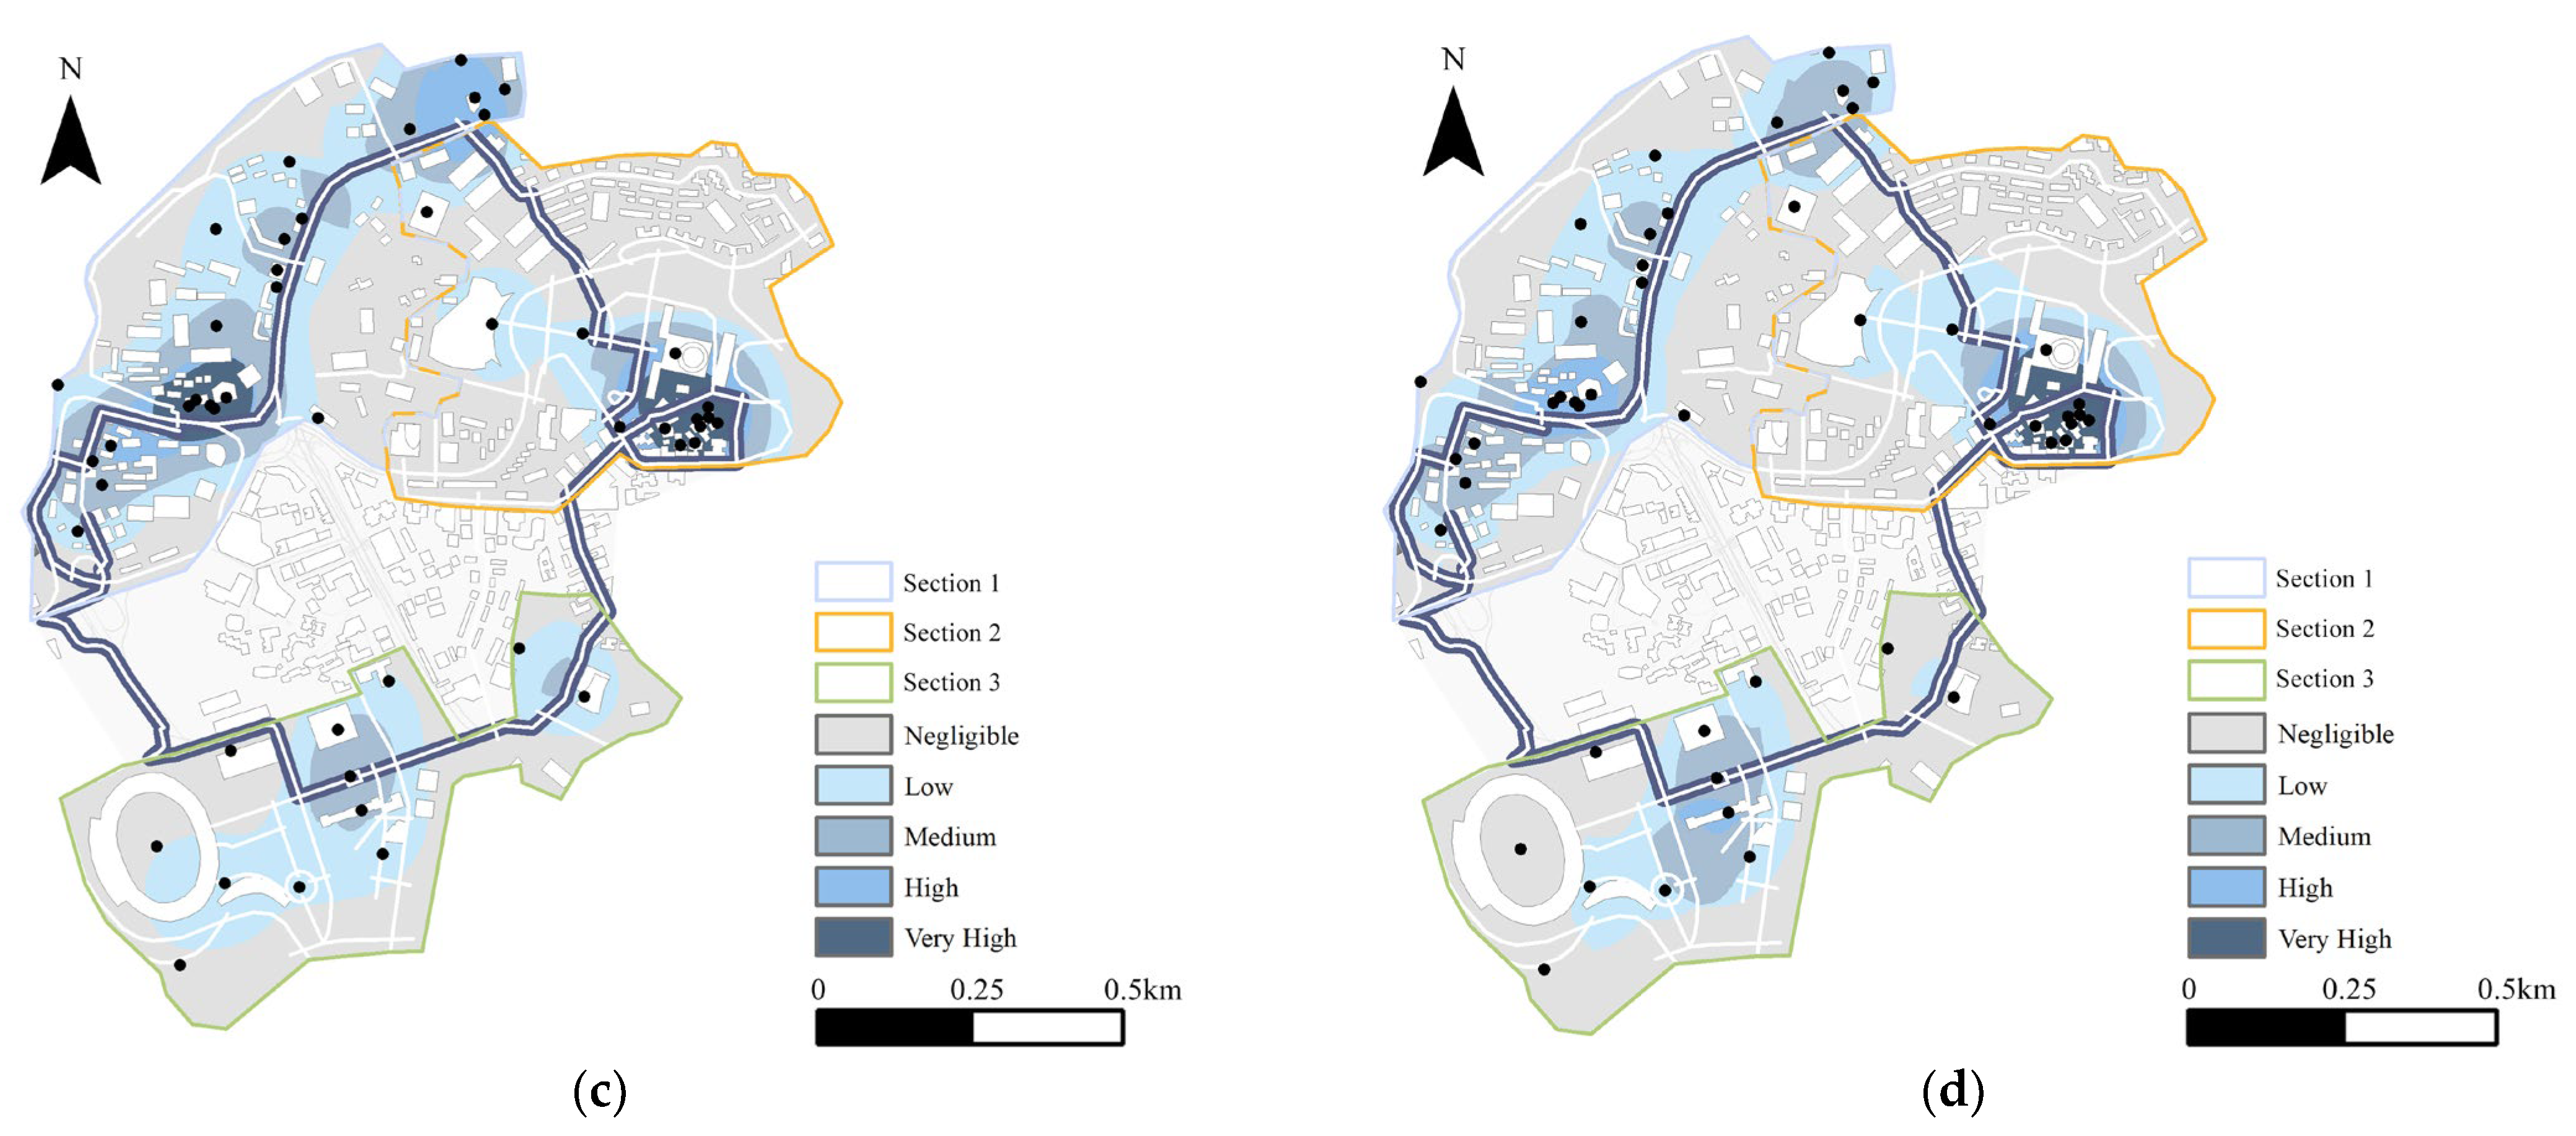
3.1.1. Spatial Narrative Resources

Figure 3a shows the KDE results for HE. In Section 1, high-density hotspots are concentrated in areas A1 and A2 along the main corridor; Section 2’s high-density zone is centered in A3; and Section 3’s in A4.
Figure 3b presents the KDE results for NI. Section 1’s hotspots are concentrated in B1 and B2, comprising three national key cultural relics protection units and one district-level cultural relics protection unit. Section 2 is centered in B3, which includes one national key cultural relics protection unit, one municipal cultural relics protection unit, four district-level cultural relics protection unit, one general cultural relics site, and two historic buildings. Section 3’s high-density area lies in B4, containing two national key cultural relics protection units and four municipal cultural relics protection units.
Figure 3c displays the KDE results for NC. Section 1 exhibits high density in C1 and C2, hosting three pre-1911 buildings. Section 2’s hotspot at C3 is characterized by a well-preserved ensemble of buildings from the Republic of China period.

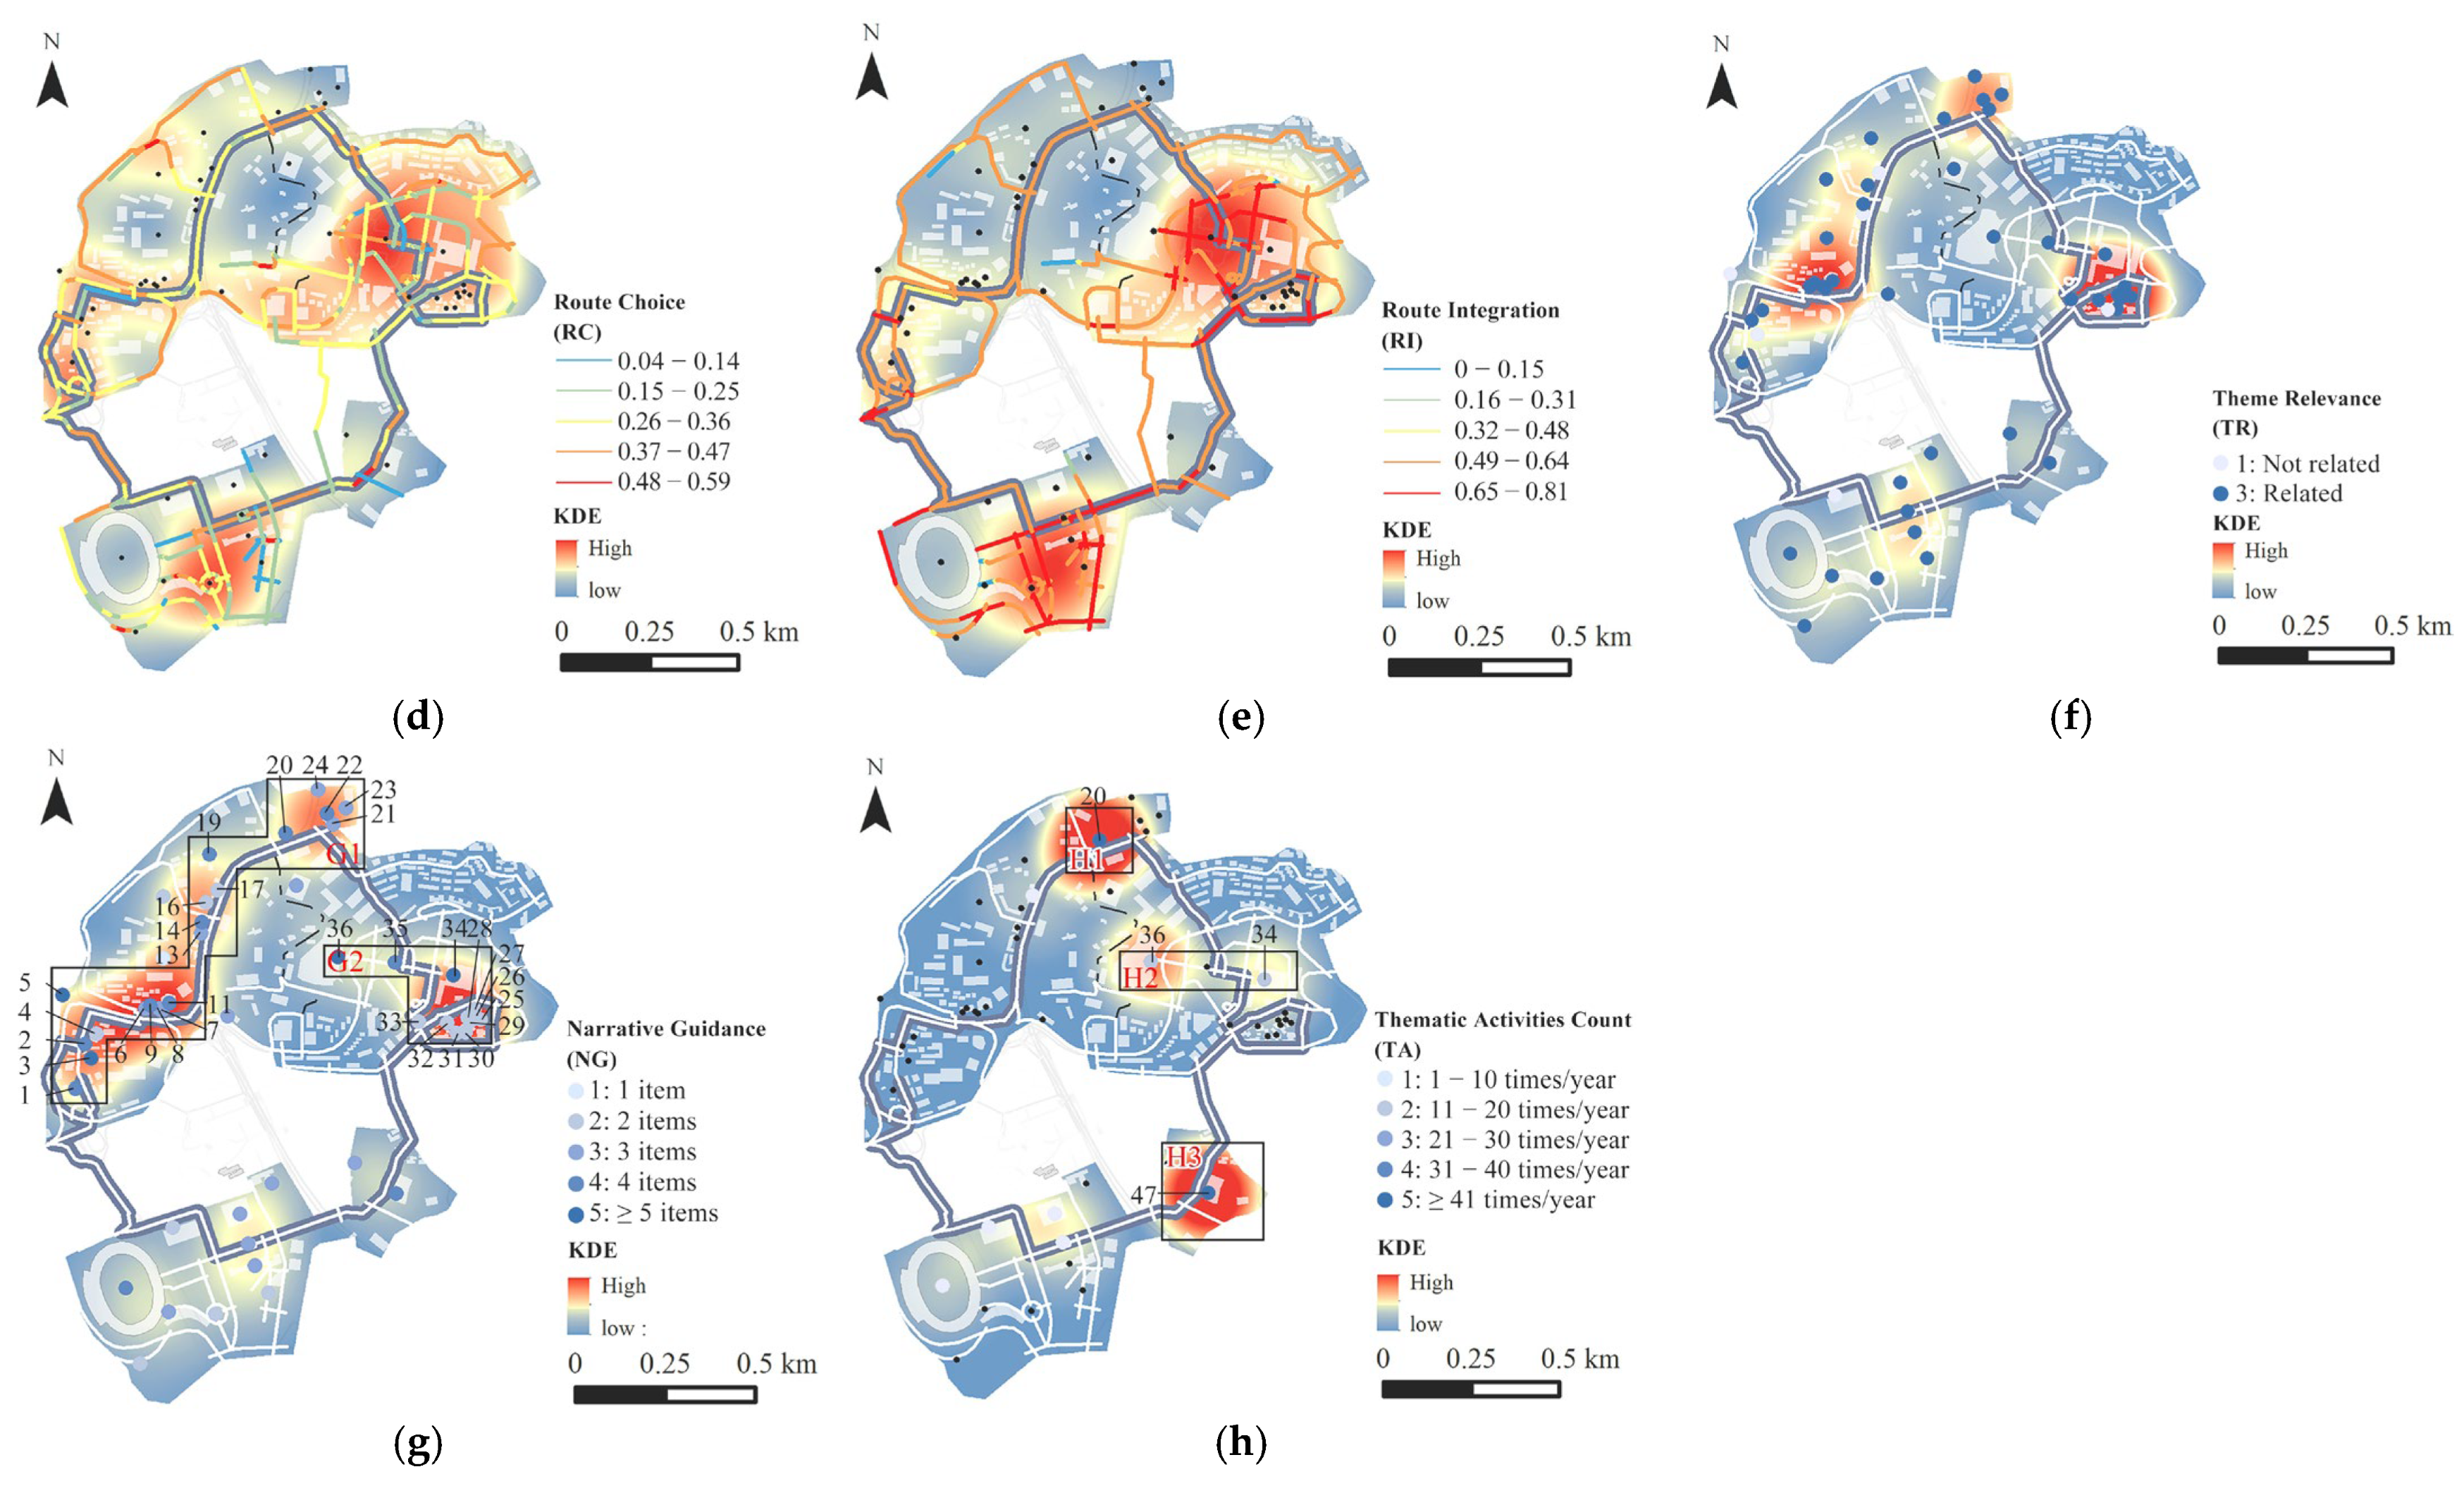
3.1.2. Spatial Narrative Structure

Figure 3d depicts the KDE results for RC. Combined with the space syntax results (Table 5), Section 1 has the highest mean choice value, indicating a more open spatial configuration. The fact that secondary paths surpass the main route in choice values suggests strong pedestrian wayfinding properties, which enhance narrative clarity along the route. Section 2 shows a balanced network with dense internal paths and overall good connectivity. In contrast, Section 3 has the lowest mean choice and the largest standard deviation, indicating an uneven pedestrian network where secondary nodes exhibit low route choice. Optimization of the walking network is therefore recommended.
Figure 3e illustrates the KDE results for RI. In conjunction with space syntax findings (Table 6), Section 3 displays the highest average integration but also the greatest variance, implying notable disparities in walkable accessibility that warrant network restructuring. Sections 1 and 2 exhibit relatively uniform integration distributions, although lower values along key pedestrian corridors may undermine the trail’s overall accessibility and connectivity.

3.1.3. Spatial Narrative Effectiveness

Figure 3f presents the KDE results for TR. The majority (87.5%) of nodes exhibit narrative content closely aligned with the historical development trajectory of the trail, indicating a generally high degree of thematic correlation.
Figure 3g shows the KDE results for NG. Section 1 displays uniformly strong guidance: the dark-red hotspot G1 spans nearly the entire section, confirming the effectiveness of its wayfinding system. Section 2’s guidance is concentrated in hotspot G2, while secondary nodes in Section 3 register low guidance and lack any significant density clusters.
Figure 3h illustrates the KDE results for TA. Sections 1 and 3 emerge as core activity zones, with hotspot H3 recording the highest activity count and dominating the landscape. In contrast, hotspots H1 and H2 show lower overall counts, though they maintain a relatively balanced distribution of activity types.

3.1.4. Overlay Analysis and Reclassification Results

The KDE results for the three dimensions—Spatial Narrative Resources (Figure 4a), Spatial Narrative Structure (Figure 4b), and Spatial Narrative Effectiveness (Figure 4c)—were weighted and summed to yield composite scores (Figure 4d). These scores were then reclassified into five categories, from “Negligible” to “Very High,” with areas rated “Medium” or above designated as narrative-value potential zones. At the dimension level, Section 2 leads in both Spatial Narrative Resources (17.61%) and Spatial Narrative Structure (66.30%), while Section 1 dominates in Spatial Narrative Effectiveness (32.64%). The proportional distributions across sections are summarized in Table 7.
Combining all three dimensions, narrative-value potential zones account for 21.53% in Section 1, 19.63% in Section 2, and 12.64% in Section 3 (Table 7). Thus, Section 1, with its strong narrative effectiveness and well-integrated spatial structure, emerges as the most promising narrative core of the Southwest Regional Trail. Section 2, characterized by concentrated resources and coherent structural integration, ranks second, while Section 3’s lower proportion of narrative-value potential zones indicates the greatest need for targeted enhancements. Given these characteristics, future planning and design should be tailored to each section’s existing resource profile to better meet visitor needs. Moreover, systematic questionnaire surveys are required to identify the key factors that influence visitor experience.

3.2. Spatial Narrative Experience Evaluation

In the previous section, GIS analysis was used to evaluate the spatial narrative value of the Southwest Regional Trail, producing a map of narrative potential zones. This chapter builds on those findings by incorporating questionnaire data to validate the GIS results from the standpoint of public perception and experience. Furthermore, it explores the underlying mechanisms linking spatial narratives to visitors’ recognition and engagement.

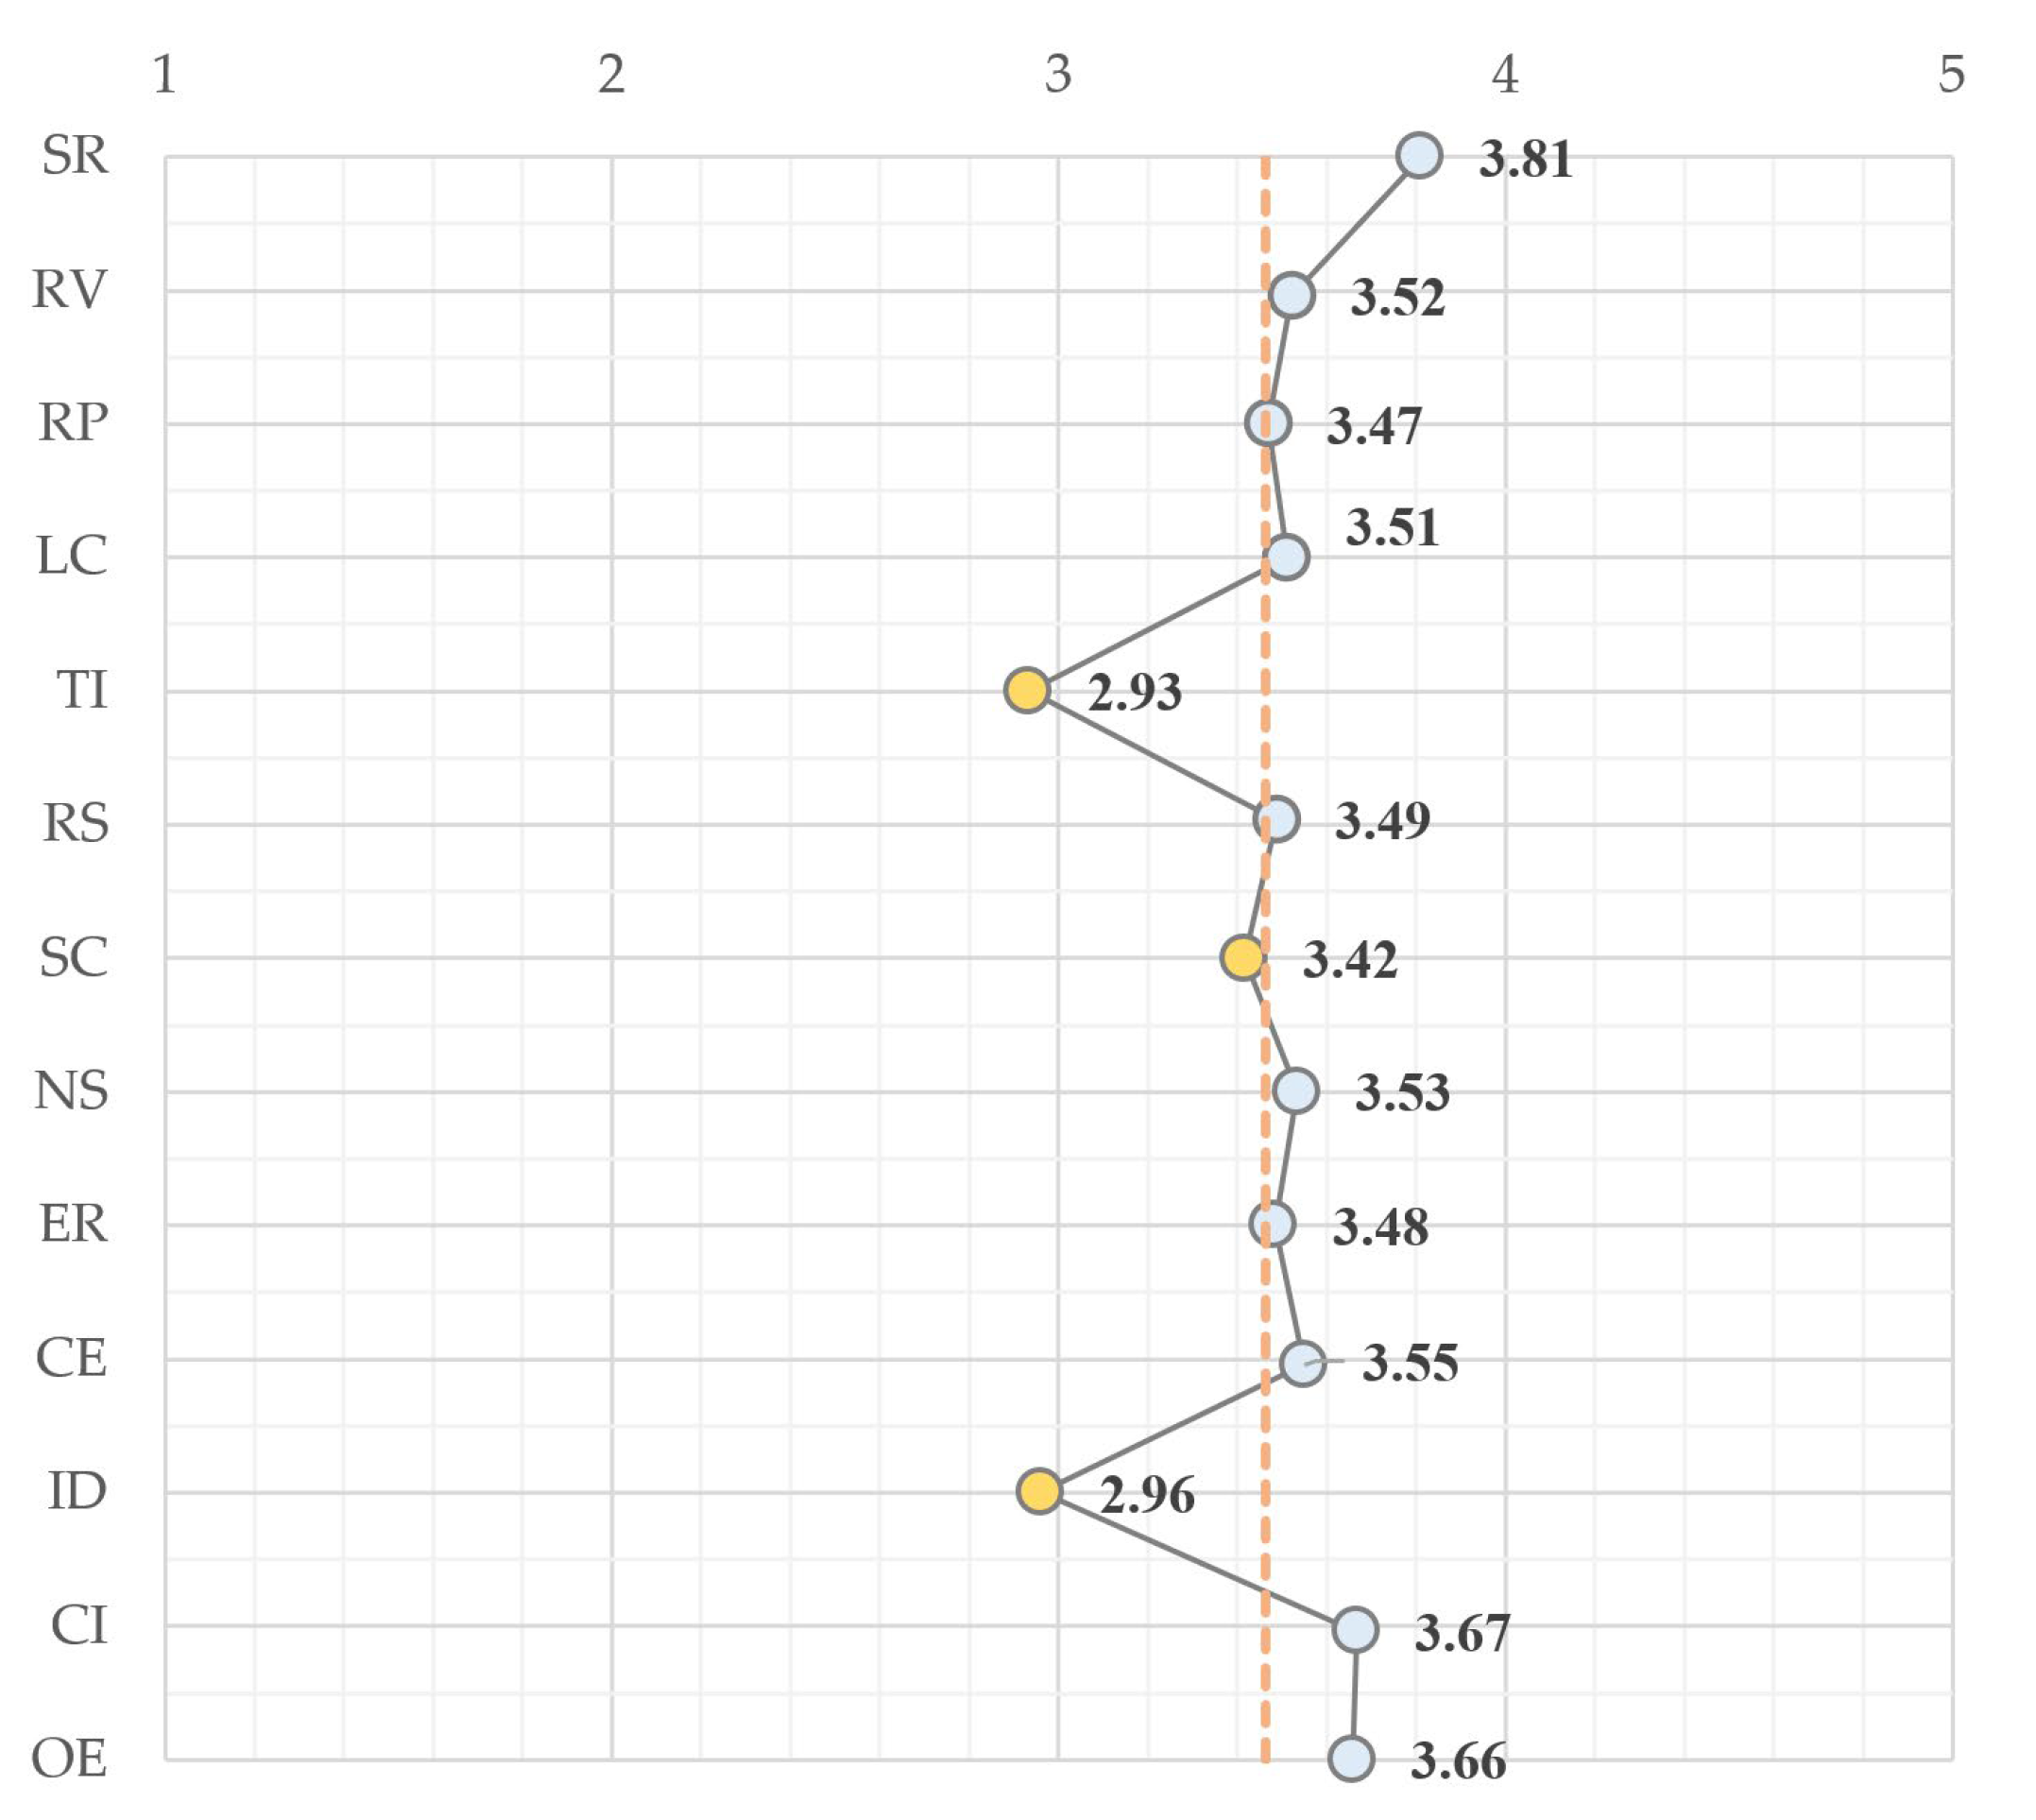
3.2.1. Descriptive Statistical Analysis Results

Among the survey respondents, female respondents comprised 55.49% of the sample. In terms of age structure, the largest age group was 18–25 years (38.15%). Regarding educational background, 65.32% of participants held at least a bachelor’s degree (Table 8).
Regarding trail visitation, 43.93% of respondents explored all three trail sections. Another 31.21% visited two sections, with the combination of Section 1 and Section 2 being the most common, accounting for 13.29%. Meanwhile, 24.86% of visitors experienced only a single section, with Section 1 alone accounting for 13.87% (Figure 5). Overall, Section 1 proved the most popular for both multi-section and single-route visits.
A descriptive statistical analysis was conducted to first compute the mean scores for each of the 13 factors, followed by the calculation of an overall composite mean of 3.46. Based on this composite mean, we evaluated overall satisfaction with the narrative experience. The results show that, except for TI, SC, and ID, all other factors scored above the average, indicating that positive visitor experiences outweighed negative ones, reaching a level of basic satisfaction (Figure 6).
A detailed examination reveals that SR received the highest satisfaction score at 3.81. Other factors also scored above the overall mean, including RV at 3.52, RP at 3.47, LC at 3.51, RS at 3.49, NS at 3.53, ER at 3.48, CE at 3.55, CI at 3.67, and OE at 3.66.
These findings demonstrate that the Southwest Regional Trail’s integrated reinforcement of narrative symbols and thematic clarity across its three sections has significantly improved narrative logic clarity and route legibility. Moreover, the trail’s cultural educational value has been markedly enriched, leaving a lasting positive impression on respondents.

3.2.2. ANOVA Results

To further explore evaluative differences among the three trail sections of the Southwest Regional Trail, one-way ANOVA was applied. The results indicated that three indicators—TI, SC, and ID—varied significantly across sections, whereas the remaining indicators showed no significant differences, reflecting largely consistent evaluations. Accordingly, only TI, SC, and ID are reported in Table 9.
TI differed significantly (p = 0.002). Mean scores were 3.26 for Section 1, 2.84 for Section 2, and 2.65 for Section 3, all below the overall mean of 3.46. Section 2 and Section 3 satisfaction levels were generally low, showing a substantial gap compared to Section 1.
SC approached significance (p = 0.083). Mean scores were 3.57 in Section 1, 3.43 in Section 2, and 3.21 in Section 3. Although Sections 1 and 2 scored above the overall mean (3.46), their satisfaction ratings remained relatively modest.
ID was significant (p = 0.014). Mean scores were 3.17 in Section 1, 2.98 in Section 2, and 2.67 in Section 3, below the overall mean. Section 3’s satisfaction was markedly lower than that of the other two sections.

3.2.3. Linear Regression Analysis Results

Further linear regression analyses were conducted. The results showed that Model 1 (Spatial Narrative Resources) had an R2 = 0.396, Model 2 (Spatial Narrative Structure) had an R2 = 0.467, and Model 3 (Spatial Narrative Effectiveness) had an R2 = 0.416. All models exhibited statistically significant predictive power, with significance levels (Sig) = 0.000b, indicating that all indicators significantly influenced the dependent variable OE. According to the regression coefficient table (Table 10), all Variance Inflation Factor (VIF) values were below 5.0, suggesting no multicollinearity issues. These findings confirm that the models possess strong explanatory power and the appropriateness of the selected dependent variable. The detailed results are as follows:
Model 1: Spatial Narrative Resources
SR, RP, RV, and OE all exhibit positive correlations. Among these, SR (B = 0.383, p < 0.001) has the greatest impact on spatial experience evaluation, followed by RP (B = 0.251, p < 0.001). This indicates that environments characterized by richer narrative symbols and more accurate transmission of narrative information tend to elicit higher overall experience ratings from visitors. These elements are therefore core contributors to the construction of spatial narrative resources.
Model 2: Spatial Narrative Structure
RS, SC, LC, NS, TI, and OE all show positive correlations. RS (B = 0.272, p < 0.001) has the most influential variable, followed by SC (B = 0.214, p < 0.001) and LC (B = 0.178, p < 0.001). These results suggests that urban spaces with richer narrative branches, more continuous storytelling, and clearer narrative logic receive higher experience ratings from visitors. Such elements are key to establishing an effective spatial narrative structure.
Model 3: Spatial Narrative Effectiveness
CE, CI, ER, ID, and OE are all positively correlated. CE (B = 0.295, p < 0.001) has the greatest influence, followed by CI (B = 0.273, p < 0.001) and ER (B = 0.190, p < 0.001). These findings mean that spaces with higher cultural and educational value, greater public recognition of historical and cultural significance, and stronger emotional resonance tend to foster more positive visitor evaluations. These factors play a central role in shaping spatial narrative effectiveness.

4. Discussion and Conclusions

Spatial narrative serves as a crucial foundation for strengthening cultural identity, preserving heritage and fostering emotional resonance in urban public spaces. It also functions as a key anchor for enhancing social cohesion and constructing sustainable urban societies [49,50]. Previous studies have offered valuable paradigms for spatial narrative assessment—either through field investigations that analyze the characteristics of narrative nodes [51], participatory sketching methods from visitor perspectives to evaluate narrative efficacy [52], or text-based approaches identifying significant narrative nodes by collecting textual information [53]. For instance, a study on industrial heritage sites analyzed spatial narrative elements and mapped their relational structures through in-depth interview transcripts [54]. However, the evaluation of urban trails—which have become increasingly important platforms for urban tourism—remains underexplored. In particular, few studies have systematically assessed the narrative value of trails by leveraging their existing spatial conditions, integrating multi-dimensional elements, and scientifically considering targeted visitor experience needs alongside their underlying sociodemographic influencing factors.
In this study, we centered on the highly representative Southwest Regional Trail in Chongqing, conducting research from two perspectives: the spatial perspective of spatial narrative value and the human-centered perspective of spatial narrative experience. We delineated zones with superior narrative resources within the region, followed by questionnaire surveys and interviews to analyze the sociodemographic characteristics of trail users as well as the main factors influencing visitor experiences. Quantitative research methods were employed to derive more targeted and concrete results. The subsequent sections discuss the analytical findings of spatial narrative value and spatial narrative experience, respectively, and integrate the specific results from both dimensions to provide planning and design recommendations for updating the Southwest Regional Trail. The study concludes with three major findings.

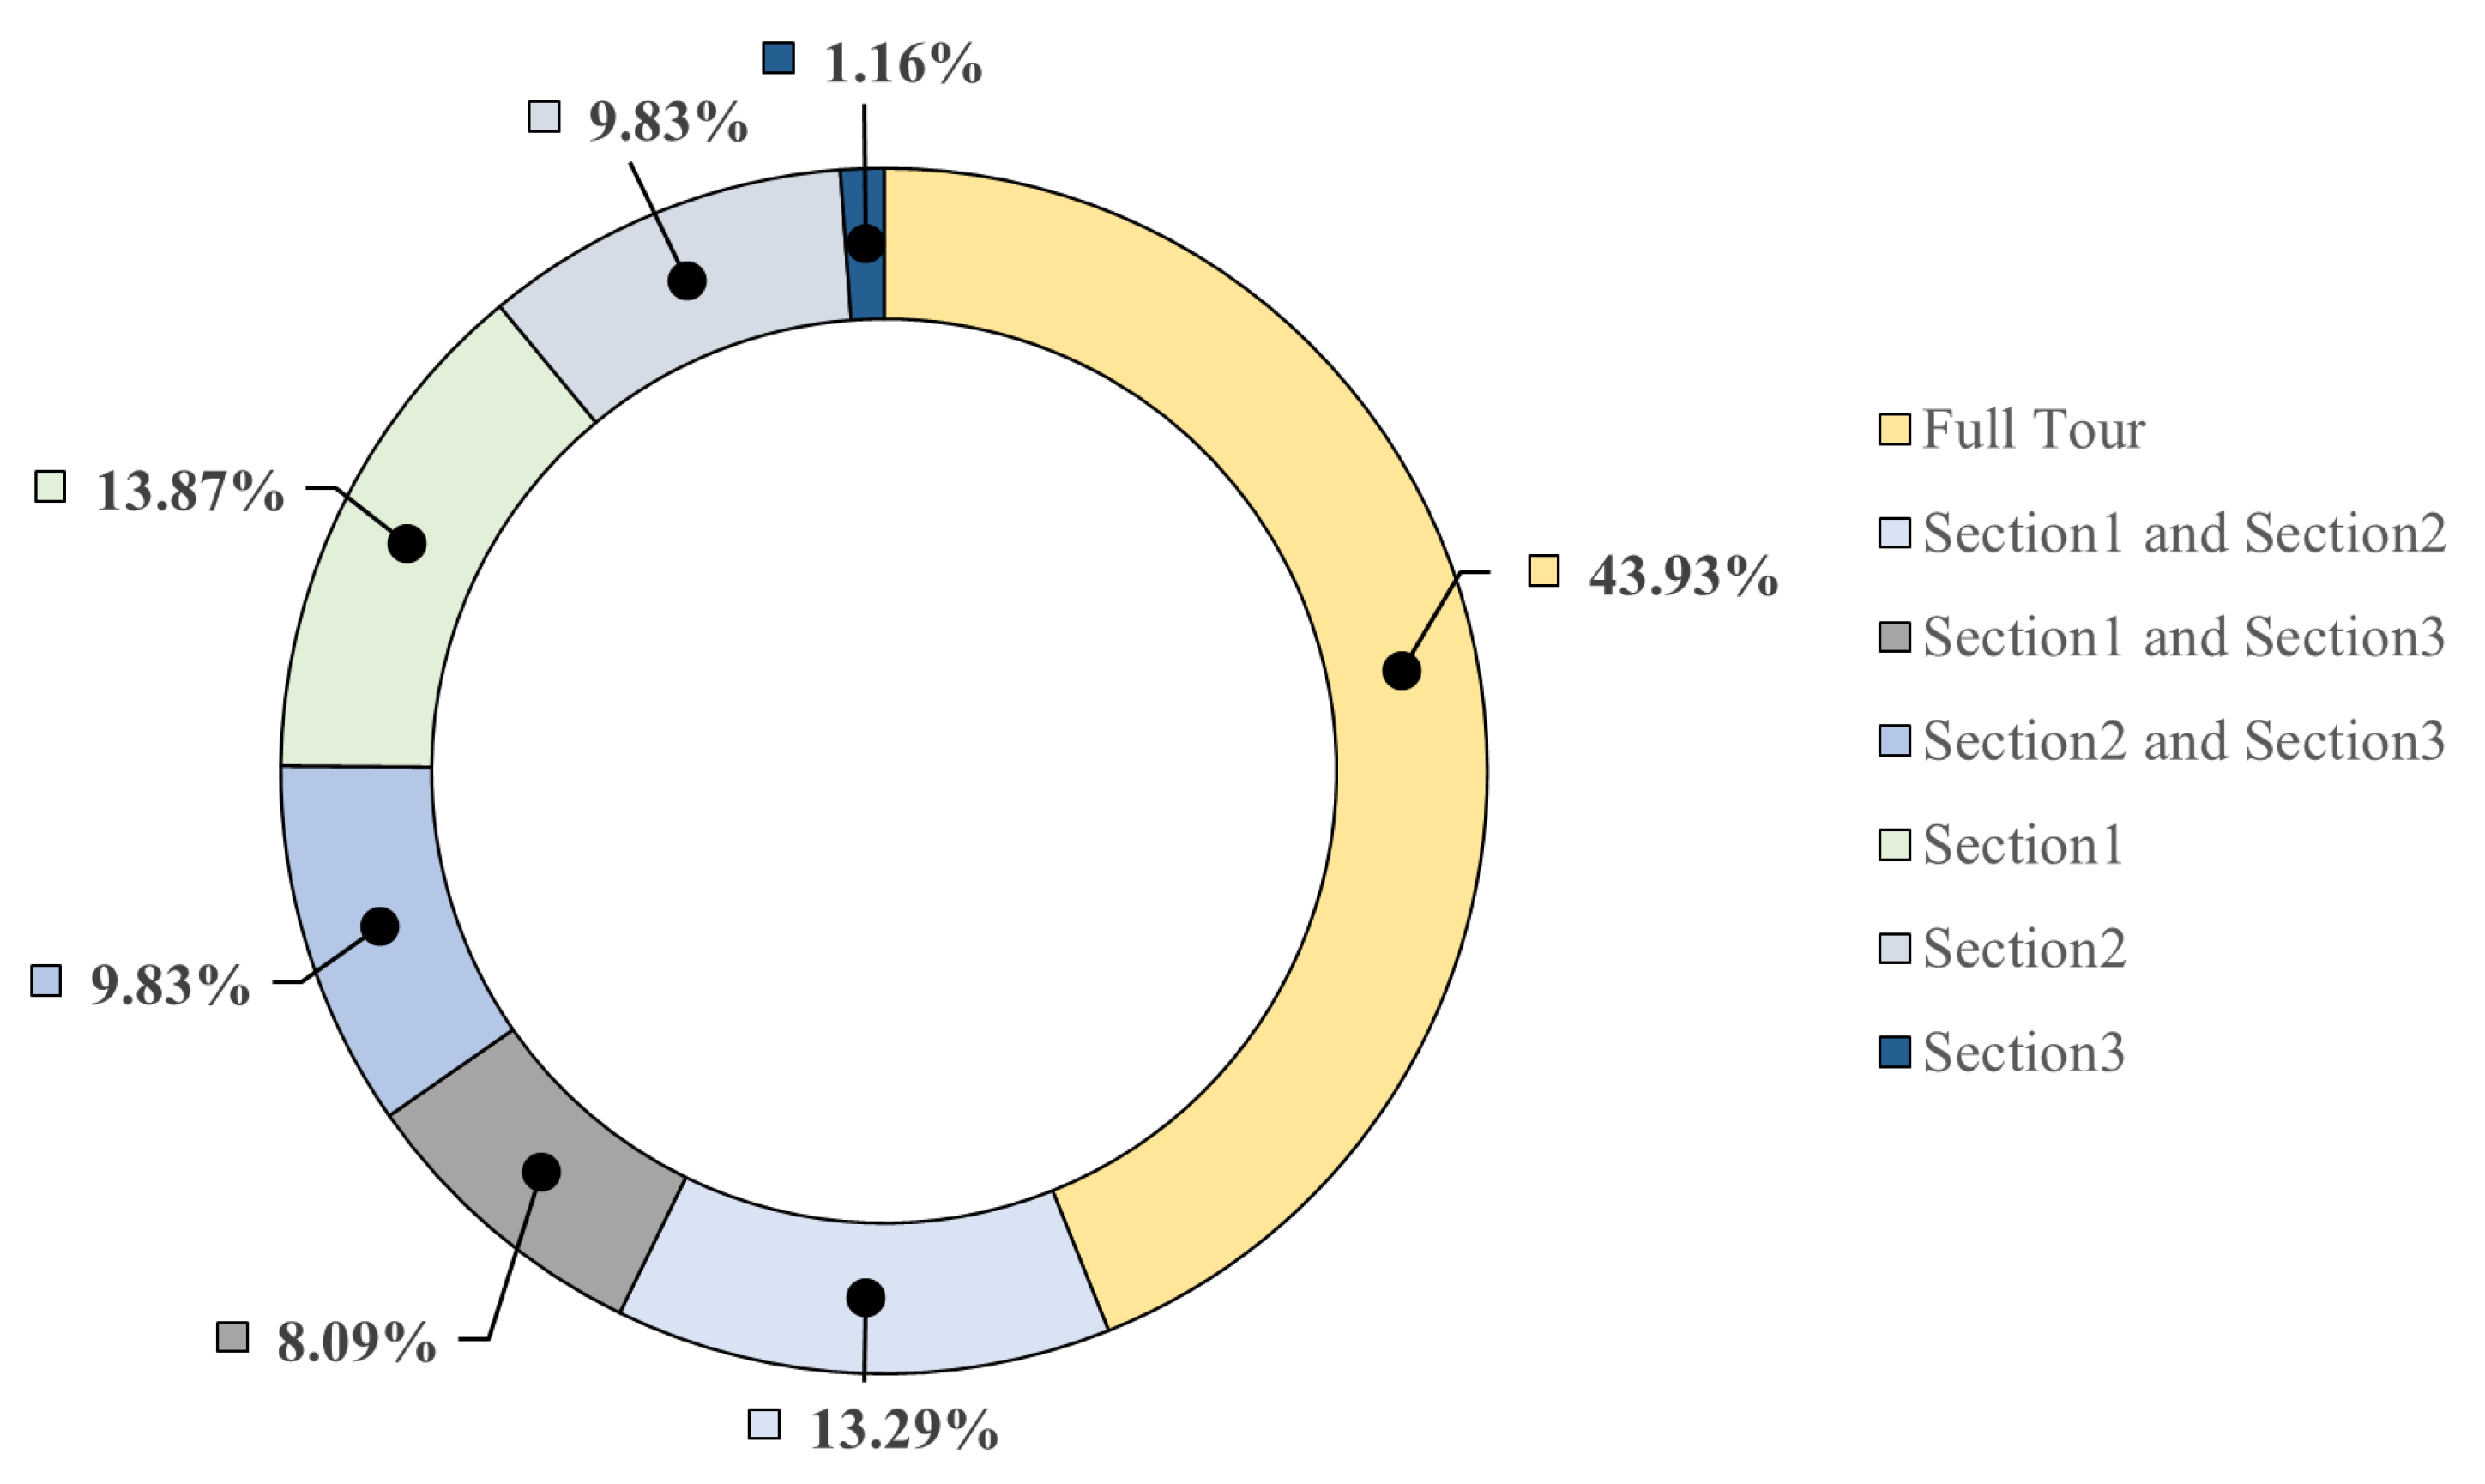
4.1. Superior Spatial Narrative Effectiveness as a Driver of Visitation

The spatial narrative value evaluation reveals distinct performance across the three sections. In the Spatial Narrative Resources dimension, Section 2 accounts for the largest share of potential narrative-value zones, serving as the focal area for interpreting Chongqing’s transition from a Republican capital into a regional center of the People’s Republic. Section 1 follows, which shows high resource coherence in a linear distribution, while Section 3 ranks lowest overall. Within the Spatial Narrative Structure dimension, Section 2 again leads with a well-integrated path network and high branch-selectivity; Section 3 (38.40%) ranks second, indicating the need to enhance its bilateral narrative links; Section 1 (20.51%) scores lowest, suggesting that despite its high integration and connectivity (which foster social interaction [55]), the main corridor’s narrative linkages require further strengthening. For Spatial Narrative Effectiveness, Section 1 attains the highest score, reflecting a well-aligned theme and strong participatory quality, followed by Section 2, while Section 3, despite hosting the greatest number of thematic activities, ranks lowest in overall effectiveness.
Considering all three dimensions, Section 1 accounts for 21.53% of the spatial narrative value potential zone. This section features balanced and diverse resources along with the strongest narrative effectiveness. It includes historical and cultural sites related to education and politics from the Ming and Qing dynasties as well as the early years of the People’s Republic of China (PRC), making it a suitable area for the preservation and adaptive development of historical urban landscapes. Section 2 accounts for 19.63% of the narrative value potential zone and is characterized by clustered resource concentrations and a robust narrative structure. The historical buildings, primarily represented by the Chongqing People’s Assembly Hall and the Ma’anshan traditional-style scenic area, vividly illustrate the city’s evolution from the Republican provisional capital to a regional center of the PRC. However, its narrative resources and effectiveness are limited to specific nodes, suggesting its suitability for developing node-based, in-depth historical and cultural experiences. Section 3, which comprises 12.64% of the narrative value potential zone, hosts numerous thematic activities. However, its limited diversity and interactivity undermine the overall visitor experience, indicating the need for targeted improvements based on visitor needs.
Based on the above analysis and the subsequent findings from the visitor route selection frequency survey conducted along the Southwest Regional trail, one notable phenomenon merits further exploration. Section 1’s core strength in the spatial narrative value evaluation lies in the dimension of spatial narrative effectiveness, where it ranks first. Correspondingly, Section 1 consistently exhibits a high rate of selection and popularity among visitors, whether in combined or single-route tours. This phenomenon suggests a correlation between spatial narrative effectiveness and the frequency of visitation. In other words, aside from the existing physical spatial narrative resources and structures, elements related to spatial narrative effectiveness—such as compelling themes and activities within the space—are key factors that attract visitors to urban trails.

4.2. Key Determinants of Narrative Experience on Urban Trails: Symbols, Routes, and Educational Value

In addition to evaluating the spatial narrative resources of the Southwest Regional Trail itself, the in-depth questionnaire survey and structured data analysis of visitor experiences offer both practical implications and phenomenological insight.
Our results show that young adults currently represent the primary demographic engaged in “City Walk” urban-trail tourism. This observation aligns with recent national tourism statistics. According to the 2024 Domestic Tourism Report, China recorded 5.615 billion domestic trips in 2024—a 14.8% year-on-year increase—and led in terms of consumer willingness to travel [56]. Within this overall growth, travelers aged 20–40 constitute the majority of tourism consumers, with those born in the 1990s accounting for nearly half of that segment.
Further analysis indicates that for this demographic, indicators such as SR, RP, RS, and CE significantly influence spatial experience evaluations. In other words, these visitors prefer abundant narrative symbols in the environment, flexible route choices embedded within the narrative structure, and strong cultural as well as interactive elements. Overall, urban trail tourism among young adults has transitioned from passive architectural appreciation to a more immersive and interaction-driven mode of engagement. Consequently, the planning and design of modern urban trails should adapt to these evolving preferences by offering diverse interpretive perspectives, rich contextual narratives, and participatory elements that enhance visitor engagement.
A more detailed examination of visitor satisfaction with the Southwest Regional Trail‘s spatial narrative experience—based on descriptive statistics and ANOVA—reveals that TI, SC, and ID have the lowest satisfaction scores. Notably, SC demonstrates a significant positive correlation with OE. However, both Section 2 and Section 3 perform poorly in terms of spatial continuity, suggesting insufficient wayfinding coherence and contextual transitions during movement. These shortcomings should be prioritized for targeted improvements. Subsequent interventions may focus on reinforcing the central narrative thread and diversifying interactive formats to enhance overall visitor satisfaction.

4.3. Future Recommendations for Southwest Regional Trail

The narrative experience should be comprehensively examined by considering spatial, human, and temporal factors [57]. By defining the historical and cultural elements of different countries and regions as well as the local characteristics of cities, targeted and distinctive spatial narrative systems can be constructed [58]. Based on the evaluation results of the spatial narrative value and narrative experience of the Southwest Regional Trail, we propose corresponding recommendations for future development, aiming to provide practical references and insights for local urban planning and management authorities, as well as for similar urban trails.
Section 1 ranks second among the three sections in terms of the proportion of potential zones with spatial narrative value. Its spatial distribution is highly coherent, and its narrative effectiveness is notably strong. Visitor evaluations of spatial experience are generally excellent. Therefore, it is recommended to maintain these existing strengths and further develop areas that both showcase and encourage engagement with the section’s distinctive landscape resources.
Section 2 holds the highest proportion of spatial narrative value potential zones and performs strongly in both spatial narrative resources and structure. Its spatial form is characterized by clustered high-value nodes. To address identified deficiencies—such as limited continuity in the narrative experience, lack of coherent wayfinding and contextual transition during movement, and insufficient interactive opportunities—it is advisable to implement clear signage and spatial visual guidance that align with the thematic narratives of both primary and secondary routes. Additionally, reorganizing and reinforcing cultural symbols will help develop the section from a collection of local highlights into a cohesive, region-wide narrative framework.
Section 3 ranks third. While it demonstrates relative strengths in supporting spatial activities, its overall resource value remains low. In response to visitor feedback, efforts should focus on enhancing narrative effectiveness by improving thematic coherence, enriching the activity content, and activating spatial narrative symbols through temporary exhibitions, thematic markets, and intangible cultural heritage experiences. These interventions are expected to unify the narrative system and expand the spatial narrative value of this section.

4.4. Limitations

This study has several limitations that should be addressed in future research. First, the evaluation data obtained through expert scoring and questionnaire surveys may be influenced by subjectivity resulting from individual cognitive biases. Additionally, the current evaluation framework does not yet incorporate external factors and dimensions that may influence walking comfort and overall experience, such as seasonal and weather conditions, travel modes and walking states, traffic safety, and pedestrian density. Second, this study takes a single urban trail as a case, and the conclusions need to be validated in other cities and with different types of trail systems. In the future, the research team plans to conduct repeated studies at multiple sites and longitudinally track the impacts of seasonal or temporal variations on narrative effects so as to enhance the breadth and validity of the research.

Author Contributions

Conceptualization, Z.W. and Y.L.; methodology, Z.W.; software, F.M.; validation, Z.W., Y.L. and F.M.; formal analysis, Y.L. and F.M.; investigation, Y.L. and F.M.; resources, Z.W.; data curation, Y.L. and F.M.; writing—original draft preparation, Z.W.; visualization, F.M.; supervision, Z.W.; project administration, Z.W. and L.Y. All authors have read and agreed to the published version of the manuscript.

Funding

This research received no external funding.

Institutional Review Board Statement

Ethical review and approval were waived for this study because it is a non-interventional study (e.g., surveys, questionnaires, social media studies) that does not involve human subjects, human materials, human tissues, or personal data.

Informed Consent Statement

Informed consent was obtained from all subjects involved in the study.

Data Availability Statement

The data presented in this study are available on request from the corresponding author. The data are not publicly available due to privacy.

Acknowledgments

The authors thank all interviewees for providing valuable feedback on the questionnaires, and the experts for their suggestions regarding this paper.

Conflicts of Interest

The authors declare no conflicts of interest.

Abbreviations

The following abbreviations are used in this manuscript:
HEHistorical Events Count
NINarrative Node Importance
NCNarrative Node Chronology
RCRoute Choice
RIRoute Integration
TRTheme Relevance
NGNarrative Guidance
TAThematic Activities Count
SRNarrative Symbol Richness
RVNarrative Resource Visibility
RPNarrative Resource Prominence
LCNarrative Logic Clarity
TINarrative Thread Identifiability
RSNarrative Route Selectivity
SCSpatial Narrative Continuity
NSNarrative Structural Situationality
EREmotional Resonance Intensity
CECultural Educational Value
IDInteraction Diversity
CICultural Identity
OEOverall Experience Evaluation
KDEKernel Density Estimation

Appendix A

Table A1. Survey Questionnaire.
No.QuestionQuestion TypeOptions
1Your genderSingle choice○ Male ○ Female
2Your ageSingle choice○ 18–25 ○ 26–35 ○ 36–45 ○ 46–59 ○ Over 60
3Your highest education levelSingle choice○ High school or below  ○ College degree
○ Bachelor’s degree      ○ Master’s degree or above
4Which trail section(s) have you experienced?Multiple choice□ Zhongshan Fourth Road Section
□ People’s Assembly Hall Section
□ Datianwan Section
Likert scale (1–5)Strongly disagreeDisagreeNeutralAgreeStrongly agree
○ 1○ 2○ 3○ 4○ 5
1The story symbols along the trail were rich and engaging.○ 1 ○ 2 ○ 3 ○ 4 ○ 5
2The space was clearly connected to the historical and cultural context.○ 1 ○ 2 ○ 3 ○ 4 ○ 5
3You are very familiar with the historical events displayed here.○ 1 ○ 2 ○ 3 ○ 4 ○ 5
4The stories told here are coherent and easy to follow.○ 1 ○ 2 ○ 3 ○ 4 ○ 5
5The space was easy to navigate and well-organized.○ 1 ○ 2 ○ 3 ○ 4 ○ 5
6You had the freedom to choose different paths or experiences.○ 1 ○ 2 ○ 3 ○ 4 ○ 5
7You could easily transition between different stories or scenes.○ 1 ○ 2 ○ 3 ○ 4 ○ 5
8You felt immersed in the story’s atmosphere.○ 1 ○ 2 ○ 3 ○ 4 ○ 5
9You felt emotionally involved in the storytelling.○ 1 ○ 2 ○ 3 ○ 4 ○ 5
10You learned something new or meaningful during the visit.○ 1 ○ 2 ○ 3 ○ 4 ○ 5
11You could interact with installations or exhibits along the trail.○ 1 ○ 2 ○ 3 ○ 4 ○ 5
12You feel more connected to the place or its culture after this experience.○ 1 ○ 2 ○ 3 ○ 4 ○ 5
13How satisfied are you with your overall travel experience?○ 1 ○ 2 ○ 3 ○ 4 ○ 5

References

  1. Zhou, H.; Chi, X.; Norman, R.; Zhang, Y.; Song, C. Tourists’ urban travel modes: Choices for enhanced transport and environmental sustainability. Transp. Res. Part D Transp. Environ. 2024, 129, 104144. [Google Scholar] [CrossRef]
  2. Klarin, A.; Park, E.; Xiao, Q.; Kim, S. Time to transform the way we travel?: A conceptual framework for slow tourism and travel research. Tour. Manag. Perspect. 2023, 46, 101100. [Google Scholar] [CrossRef]
  3. Wu, D. City walk in a gap day: Potential and opportunities for tourism and leisure. Tour. Rev. 2023, 79, 1576–1581. [Google Scholar] [CrossRef]
  4. Kay, İ.; Özkar, M. Designing for spatial narration in children’s playscapes. A/Z. ITU J. Fac. Archit. 2020, 17, 155–167. [Google Scholar] [CrossRef]
  5. Chon, J.; Scott shafer, C. Aesthetic Responses to Urban Greenway Trail Environments. Landsc. Res. 2009, 34, 83–104. [Google Scholar] [CrossRef]
  6. Božić, S.; Tomić, N. Developing the Cultural Route Evaluation Model (CREM) and its application on the Trail of Roman Emperors, Serbia. Tour. Manag. Perspect. 2016, 17, 26–35. [Google Scholar] [CrossRef]
  7. Svensson, D.; Sörlin, S.; Saltzman, K. Pathways to the trail—Landscape, walking and heritage in a Scandinavian border region. Nor. Geogr. Tidsskr.-Nor. J. Geogr. 2021, 75, 243–255. [Google Scholar] [CrossRef]
  8. Senetra, A.; Dynowski, P.; Cieślak, I.; Źróbek-Sokolnik, A. An Evaluation of the Impact of Hiking Tourism on the Ecological Status of Alpine Lakes—A Case Study of the Valley of Dolina Pięciu Stawów Polskich in the Tatra Mountains. Sustainability 2020, 12, 2963. [Google Scholar] [CrossRef]
  9. World Tourism Organization. Walking Tourism—Promoting Regional Development; UNWTO: Madrid, Spain, 2019; p. 68. [Google Scholar]
  10. Panagopoulos, T.; Tampakis, S.; Karanikola, P.; Karipidou-Kanari, A.; Kantartzis, A. The Usage and Perception of Pedestrian and Cycling Streets on Residents’ Well-being in Kalamaria, Greece. Land 2018, 7, 100. [Google Scholar] [CrossRef]
  11. Moreno, C.; Allam, Z.; Chabaud, D.; Gall, C.; Pratlong, F. Introducing the “15-Minute City”: Sustainability, Resilience and Place Identity in Future Post-Pandemic Cities. Smart Cities 2021, 4, 93–111. [Google Scholar] [CrossRef]
  12. Willberg, E.; Fink, C.; Toivonen, T. The 15-minute city for all?—Measuring individual and temporal variations in walking accessibility. J. Transp. Geogr. 2023, 106, 103521. [Google Scholar] [CrossRef]
  13. Gholami, M.; Torreggiani, D.; Tassinari, P.; Barbaresi, A. Developing a 3D City Digital Twin: Enhancing Walkability through a Green Pedestrian Network (GPN) in the City of Imola, Italy. Land 2022, 11, 1917. [Google Scholar] [CrossRef]
  14. Zhou, L.; Li, Y.; Cheng, J.; Qin, Y.; Shen, G.; Li, B.; Yang, H.; Li, S. Understanding the aesthetic perceptions and image impressions experienced by tourists walking along tourism trails through continuous cityscapes in Macau. J. Transp. Geogr. 2023, 112, 103703. [Google Scholar] [CrossRef]
  15. Thibaud, J.-P. Commented City Walks. WI J. Mob. Cult. 2013, 7, 1–32. [Google Scholar]
  16. Liu, W.; Hu, X.; Song, Z.; Yuan, X. Identifying the integrated visual characteristics of greenway landscape: A focus on human perception. Sustain. Cities Soc. 2023, 99, 104937. [Google Scholar] [CrossRef]
  17. MacLeod, N. The role of trails in the creation of tourist space. J. Herit. Tour. 2016, 12, 423–430. [Google Scholar] [CrossRef]
  18. Jóźwiak, M.; Sieg, P. Tourism Development in Post-Industrial Facilities as a Regional Business Model. Sustainability 2021, 13, 2028. [Google Scholar] [CrossRef]
  19. Khavarian-Garmsir, A.R.; Sharifi, A.; Sadeghi, A. The 15-minute city: Urban planning and design efforts toward creating sustainable neighborhoods. Cities 2023, 132, 104101. [Google Scholar] [CrossRef]
  20. Lee, S.; Chung, W.J.; Jeong, C. Exploring Sentiment Analysis and Visitor Satisfaction along Urban Liner Trails: A Case of the Seoul Trail, South Korea. Land 2024, 13, 1349. [Google Scholar] [CrossRef]
  21. Donahue, M.L.; Keeler, B.L.; Wood, S.A.; Fisher, D.M.; Hamstead, Z.A.; McPhearson, T. Using social media to understand drivers of urban park visitation in the Twin Cities, MN. Landsc. Urban Plan. 2018, 175, 1–10. [Google Scholar] [CrossRef]
  22. Keith, S.J.; Larson, L.R.; Shafer, C.S.; Hallo, J.C.; Fernandez, M. Greenway use and preferences in diverse urban communities: Implications for trail design and management. Landsc. Urban Plan. 2018, 172, 47–59. [Google Scholar] [CrossRef]
  23. Kołodziejczyk, K. Networks of hiking tourist trails in the Krkonoše (Czech Republic) and Peneda-Gerês (Portugal) national parks—Comparative analysis. J. Mt. Sci. 2019, 16, 725–743. [Google Scholar] [CrossRef]
  24. Austin, T. Narrative Environments and Experience Design: Space as a Medium of Communication, 1st ed.; Routledge: New York, NY, USA, 2020. [Google Scholar]
  25. Caquard, S.; Cartwright, W. Narrative Cartography: From Mapping Stories to the Narrative of Maps and Mapping. Cartogr. J. 2014, 51, 101–106. [Google Scholar] [CrossRef]
  26. Yuan, M.; McIntosh, J.; Delozier, G. GIS as a Narrative Generation Platform. In Deep Maps and Spatial Narratives; Indiana University Press: Bloomington, Indiana, 2015; pp. 176–202. [Google Scholar]
  27. Lu, S.; Li, X.; Yang, T. Exploration on Application of Space Syntax in Narrative Reconstruction of Memory Place. Mod. Urban. Res. 2024, 5, 65–70. [Google Scholar] [CrossRef]
  28. Bhandari, K. Tourism and the geopolitics of Buddhist heritage in Nepal. Ann. Tour. Res. 2019, 75, 58–69. [Google Scholar] [CrossRef]
  29. Lei, H.; Zhou, Y. Conducting Heritage Tourism-Led Urban Renewal in Chinese Historical and Cultural Urban Spaces: A Case Study of Datong. Land 2022, 11, 2122. [Google Scholar] [CrossRef]
  30. Wise, N.; Jimura, T. Tourism, Cultural Heritage and Urban Regeneration: Changing Spaces in Historical Places, 1st ed.; Springer: Cham, Switzerland, 2020. [Google Scholar]
  31. Nisha, B. Place and Perception: Constructing the Urban Narrative with Spatial Schemas. Available online: https://theccd.org/article/place-and-perception-constructing-the-urban-narrative-with-spatial-schemas/ (accessed on 15 October 2018).
  32. Hawthorne, T.L.; Toohy, K.R.; Yang, B.; Graham, L.; Lorenzo, E.M.; Torres, H.; McDonald, M.; Rivera, F.; Bouck, K.; Walters, L.J. Mapping Emotional Attachment as a Measure of Sense of Place to Identify Coastal Restoration Priority Areas. Appl. Geogr. 2022, 138, 102608. [Google Scholar] [CrossRef]
  33. Mikkonen, K. The “Narrative is Travel” Metaphor: Between Spatial Sequence and Open Consequence. Narrative 2007, 15, 286–305. [Google Scholar] [CrossRef]
  34. Middleton, J. The socialities of everyday urban walking and the ‘right to the city’. Urban Stud. 2016, 55, 296–315. [Google Scholar] [CrossRef]
  35. Zhang, R.; Dai, Y.; Zan, P.; Zhang, S.; Sun, X.; Zhou, J. Research and Evaluation of the Mountain Settlement Space Based on the Theory of “Flânuer” in the Digital Age—Taking Yangchan Village in Huangshan City, Anhui Province, as an Example. J. Asian Archit. Build. Eng. 2023, 23, 57–73. [Google Scholar] [CrossRef]
  36. Oppezzo, M.; Schwartz, D.L. Give your ideas some legs: The positive effect of walking on creative thinking. J. Exp. Psychol. Learn. Mem. Cogn. 2014, 40, 1142–1152. [Google Scholar] [CrossRef] [PubMed]
  37. Pérez Miles, A.; Libersat, J.U. ROAM: Walking, Mapping, and Play: Wanderings in Art and Art Education. Stud. Art Educ. 2016, 57, 341–357. [Google Scholar] [CrossRef]
  38. Roth, R.E. Cartographic Design as Visual Storytelling: Synthesis and Review of Map-Based Narratives, Genres, and Tropes. Cartogr. J. 2020, 58, 83–114. [Google Scholar] [CrossRef]
  39. Kusumastuti, H.; Pranita, D.; Viendyasari, M.; Rasul, M.S.; Sarjana, S. Leveraging Local Value in a Post-Smart Tourism Village to Encourage Sustainable Tourism. Sustainability 2024, 16, 873. [Google Scholar] [CrossRef]
  40. Commission (CCaT). 2023 Tourism Industry Statistical Bulletin of Chongqing Municipality. Available online: https://whlyw.cq.gov.cn/sjfb/202404/t20240425_13156888.html (accessed on 25 April 2024).
  41. China UPSo. Special Plan for Mountain City Trails in Chongqing Main Urban Area. Available online: https://www.planning.org.cn/2016anpc/view?id=666 (accessed on 27 June 2019).
  42. Azaryahu, M.; Foote, K.E. Historical space as narrative medium: On the configuration of spatial narratives of time at historical sites. GeoJournal 2008, 73, 179–194. [Google Scholar] [CrossRef]
  43. Puxan-Oliva, M. Assessing Narrative Space: From Setting to Narrative Environments. Poet. Today 2024, 45, 79–103. [Google Scholar] [CrossRef]
  44. Ridge, M.; Lafreniere, D.; Nesbit, S. Creating Deep Maps and Spatial Narratives through Design. Int. J. Humanit. Arts Comput. 2013, 7, 176–189. [Google Scholar] [CrossRef]
  45. Alalouch, C.; Al-Hajri, S.; Naser, A.; Al Hinai, A. The impact of space syntax spatial attributes on urban land use in Muscat: Implications for urban sustainability. Sustain. Cities Soc. 2019, 46, 101417. [Google Scholar] [CrossRef]
  46. Hu, L.; Yang, T. Landed and Rooted: A Comparative Study of Traditional Hakka Dwellings (Tulous and Weilong Houses) Based on the Methodology of Space Syntax. Buildings 2023, 13, 2644. [Google Scholar] [CrossRef]
  47. Guan, Z.; Wang, T.; Zhi, X. Temporal-Spatial pattern Differentiation of Traditional Villages in Central Plains Economic Region. Econ. Geogr. 2017, 37, 225–232. [Google Scholar]
  48. Zhang, Z.; Zhang, H.; Feng, J.; Wang, Y.; Liu, K. Evaluation of Social Values for Ecosystem Services in Urban Riverfront Space Based on the SolVES Model: A Case Study of the Fenghe River, Xi’an, China. Int. J. Environ. Res. Public Health 2021, 18, 2765. [Google Scholar] [CrossRef] [PubMed]
  49. Mior, F.A. Whose city? Colonial histories, urban governance, and the contestation of space in Kuala Lumpur. Int. Plan. Stud. 2025, 30, 39–53. [Google Scholar] [CrossRef]
  50. Grenni, S.; Horlings, L.G.; Soini, K. Linking spatial planning and place branding strategies through cultural narratives in places. Eur. Plan. Stud. 2019, 28, 1355–1374. [Google Scholar] [CrossRef]
  51. Hanna, S.P.; Carter, P.L.; Potter, A.E.; Bright, C.F.; Alderman, D.A.; Modlin, E.A.; Butler, D.L. Following the story: Narrative mapping as a mobile method for tracking and interrogating spatial narratives. J. Herit. Tour. 2018, 14, 49–66. [Google Scholar] [CrossRef]
  52. Boschmann, E.E.; Cubbon, E. Sketch Maps and Qualitative GIS: Using Cartographies of Individual Spatial Narratives in Geographic Research. Prof. Geogr. 2013, 66, 236–248. [Google Scholar] [CrossRef]
  53. Caquard, S. Cartography I: Mapping narrative cartography. Prog. Hum. Geogr. 2011, 37, 135–144. [Google Scholar] [CrossRef]
  54. Tao, H.; Wen, Y.; Liu, M.; Wu, Y. Industrial Heritage Protection from the Perspective of Spatial Narrative. Land 2025, 14, 1105. [Google Scholar] [CrossRef]
  55. Can, I.; Heath, T. In-between spaces and social interaction: A morphological analysis of Izmir using space syntax. J. Hous. Built Environ. 2015, 31, 31–49. [Google Scholar] [CrossRef]
  56. China MoCaTotPsRo. 2024 Annual Domestic Tourism Data Report. Available online: https://zwgk.mct.gov.cn/zfxxgkml/tjxx/202501/t20250121_958012.html (accessed on 22 January 2025).
  57. Busselle, R.; Bilandzic, H. Fictionality and Perceived Realism in Experiencing Stories: A Model of Narrative Comprehension and Engagement. Commun. Theory 2008, 18, 255–280. [Google Scholar] [CrossRef]
  58. Yuan, M. Geographical Enrichment of Historical Landscapes: Spatial Integration, Geo-Narrative, Spatial Narrative, and Deep Mapping. In Historical Geography and Geosciences; Springer: Cham, Switzerland, 2020. [Google Scholar]
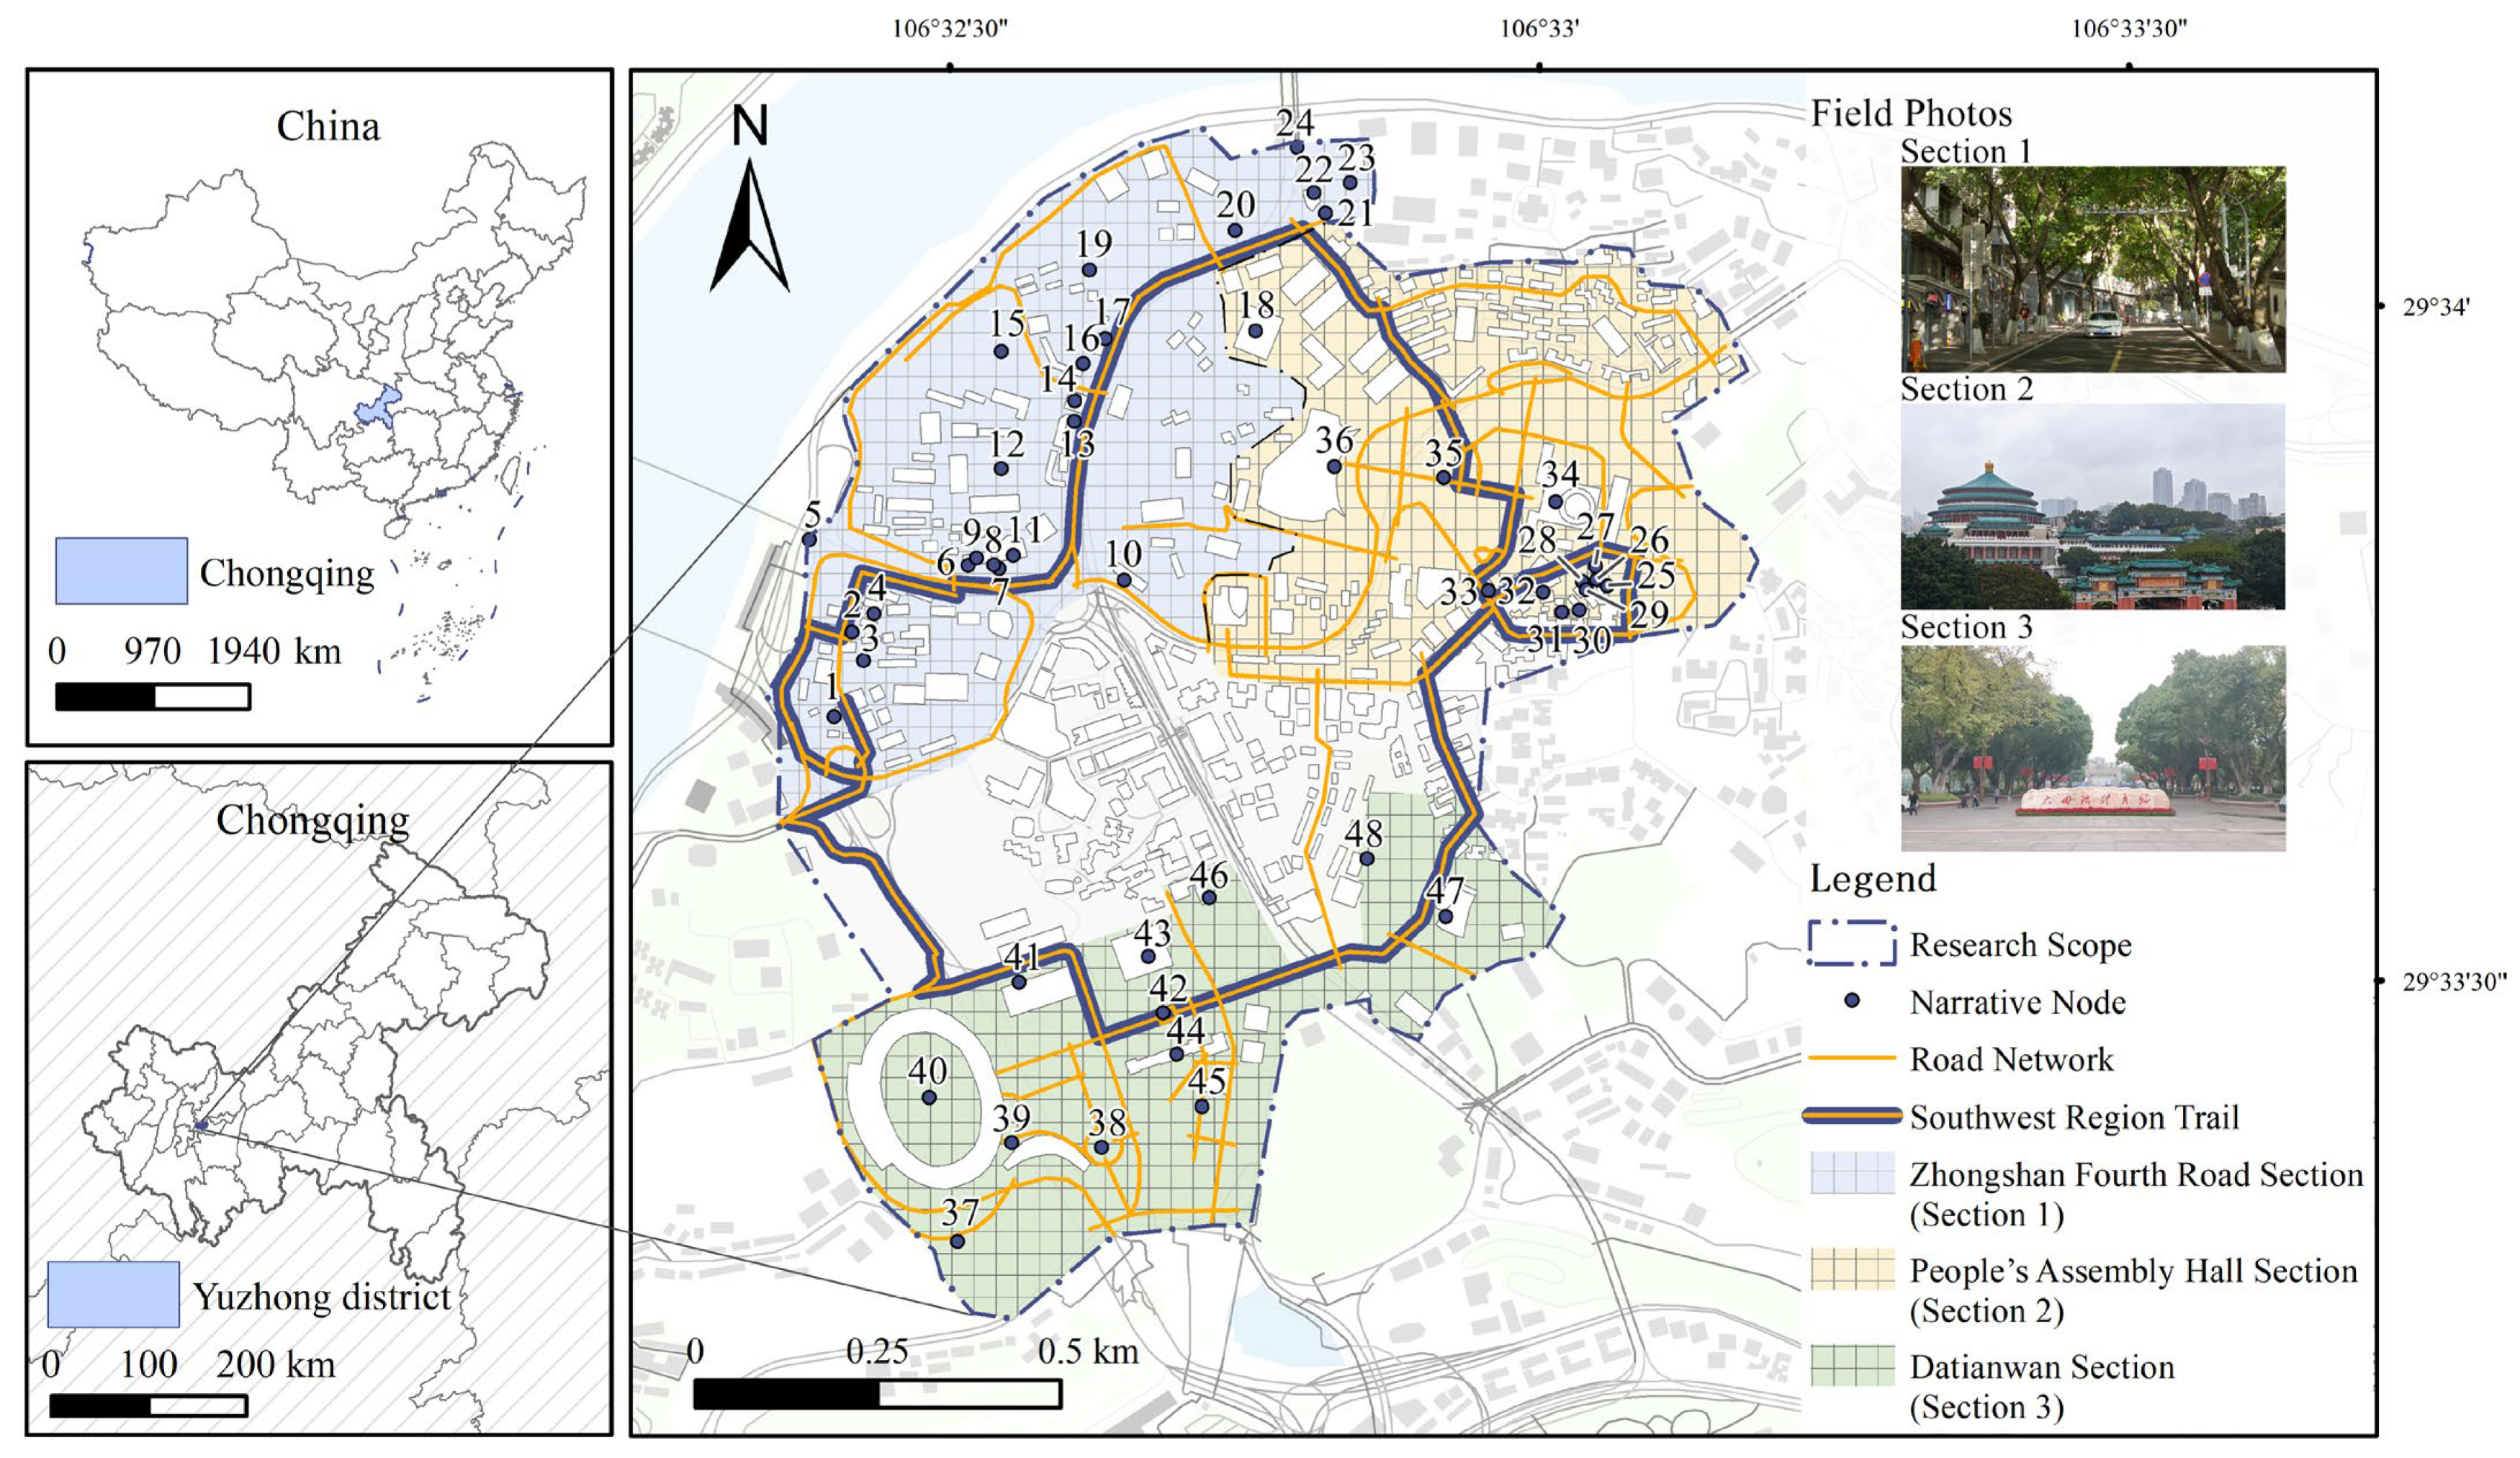
Figure 1. Research Object.
Sustainability 17 05544 g001
Figure 2. Research Framework.
Sustainability 17 05544 g002
Figure 3. KDE results of Spatial Narrative Value Indicators: (a) Historical Events Count (HE), (b) Narrative Node Importance (NI), (c) Narrative Node Chronology (NC), (d) Route Choice (RC), (e) Route Integration (RI), (f) Theme Relevance (TR), (g) Narrative Guidance (NG), (h) Thematic Activities Count (TA). High KDE values (in red) indicate narrative hotspots. All panels share a unified scale bar and legend.
Sustainability 17 05544 g003aSustainability 17 05544 g003b
Figure 4. Results of Overlay Analysis and Reclassification for the Three Dimensions: (a) Spatial Narrative Resources, (b) Spatial Narrative Structure, (c) Spatial Narrative Effectiveness, (d) Composite Narrative-Value Score.
Sustainability 17 05544 g004aSustainability 17 05544 g004b
Figure 5. City Walk Route Choices of Respondents.
Sustainability 17 05544 g005
Figure 6. Descriptive Analysis of Narrative Experience Factors.
Sustainability 17 05544 g006
Table 1. Main Sections of the Southwest Regional Trail and Constituent Nodes.
SectionDistanceThemeDescriptionMain Nodes and Coding
Zhongshan Fourth Road Section
(Section 1)
1.6 kmArchitectural style of the wartime periodNumerous historical features from the period when Chongqing served as the wartime capital have been preserved, reflecting a microcosm of the development of modern education in Chongqing.Yiyuan (1), Former Residence of Xian Ying (2), Jialingqiao Xicun (3), Daguan Pavilion (4), Niujiaotuo (5), “Through Thick and Thin, Hold Discussions Concerning National Policies and Principles” Sculpture (6), China Democratic League Monument (7), Sanmin Doctrine Association Founding Monument (8), Te Garden (9), Former Site of the Central Executive Committee of KMT (10), Democratic Parties History Museum (11), Chongqingshi Renmin Primary School (12), Zhongshan Creative Park (13), Gui Garden (14), Qiujing Middle School (15), Dejing Primary School (16), Wang Qi Art Museum (17), Residence of Pan Wenhua (19), Residence of Dai Li (20), Enlai Square (21), Former Residence of Zhou Enlai (22), Police Bureau Site (23), Zengjiayan Cultural Hall (24).
People’s Assembly Hall Section
(Section 2)
1.4 kmResidences of wartime celebrities and achievements during the Southwest Administrative RegionCentered on the residences of notable figures from the wartime period and the major achievements in the construction of the Southwest Administrative Region.Former Site of the Executive Yuan of the National Government in Chongqing (18), Residence of Shen Junru (25), Former Site of the Foreign Affairs Section of the Southern Bureau of the CPC Central Committee (26), Ma’anshan Building 29 (27), Ma’anshan Building 30 (28), Ma’anshan Building 31 (29), Ma’anshan Building 63 (30), Ma’anshan Building 64 (31), Ma’anshan Building 47 (32), Renmin Road Building 175 (33), People’s Assembly Hall (34), People’s Square (35), Chongqing China Three Gorges Museum (36).
Datianwan Section
(Section 3)
1.2 kmPublic cultural activity scenes during the Southwest Administrative Region periodFocused on “recreating the cultural center of Chongqing in the early years of the People’s Republic of China,” with an emphasis on restoring cultural functions and promoting cultural heritage.Former Site of American Embassy (37), Parachuting Tower (38), Chongqing Sports Museum (39), Datianwan Stadium (40), Chongqing Datianwan Fitness Center (41), Statue of He Long (42), Chongqing Gymnasium (43), Chongqing Municipal Bureau of Sports (44), Former Residence of Soong Ching-ling (45), Former Site of the Eighth Route Army Office—CPC Delegation Office (46), Cultural Palace (47), Former Site of the Investigation and Statistics Bureau of the KMT Central Executive Committee (48).
Table 2. Indicators and Scoring Criteria for the Spatial Narrative Value Evaluation.
Primary IndicatorSecondary IndicatorScoring Criteria
5 Points4 Points3 Points2 Points1 Point
Spatial Narrative ResourcesHistorical Events Count (HE)≥5 events4 events3 events2 events1 event
Narrative Node Importance (NI)National Key Cultural Relics Protection Unit or National First-grade MuseumMunicipal Cultural Relics Protection UnitDistrict-Level Cultural Relics Protection UnitGeneral Cultural Relics SiteHistoric Building
Narrative Node Chronology (NC)Ming and Qing Dynasties
(Pre–1911)
Republic of China Era (1912–1949)Post–Liberation Period (1950–1978)Early Reform and Opening Up Period (1979–1997)Direct-controlled Municipality Era (Post–1998)
Spatial Narrative StructureRoute Choice (RC)0.48–0.590.37–0.470.26–0.360.15–0.250.04–0.14
Route Integration (RI)0.65–0.810.49–0.640.32–0.480.16–0.310–0.15
Spatial Narrative Effective-nessTheme Relevance (TR) Related Not related
Narrative Guidance (NG) 15 items4 items3 items2 items1 item
Thematic Activities Count (TA)≥41 times/year31–40 times/year21–30 times/year11–20 times/year0–10 times/year
1 For the indicator “Narrative Guidance”, all narrative-based wayfinding systems within the district were identified and categorized into the following five types: trail map, information board, stair signage, pavement marking, and directional sign.
Table 3. Weights and Data Sources for the Spatial Narrative Value Evaluation.
Primary IndicatorWeightSecondary IndicatorWeightFinal WeightData Source
Spatial Narrative Resources46.99%HE37.73%17.73%Open government data and on-site survey statistics
Web 1: http://www.cqkaogu.com/gzdt/5903.jhtml (accessed on 27 November 2024)
Web 2: http://www.cqkaogu.com/gzdt/5924.jhtml (accessed on 27 November 2024)
Web 3: https://www.sohu.com/a/253526033_349058 (accessed on 27 November 2024)
NI22.34%10.50%Open government data and on-site survey statistics
Section 1: https://www.cqyz.gov.cn/zjyz/lyyz/rmdkd/202210/t20221005_11164444.html (accessed on 17 December 2024)
Section 2: https://www.cqyz.gov.cn/zjyz/lyyz/ctjq/202210/t20221005_11164464.html (accessed on 18 December 2024)
Section 3: https://www.cq.gov.cn/ywdt/jrcq/202212/t20221231_11442662.html (accessed on 17 December 2024)
NC39.94%18.77%Open government data statistics
Web 1: https://www.cq.gov.cn/zwgk/zfxxgkml/zdlyxxgk/shgysy/ggwhty/whly/201807/t20180702_8807178.html (accessed on 19 December 2024)
Web 2: https://www.cqyz.gov.cn/zwgk_229/zcwj/xzgfxwj/201907/t20190705_6892709.html (accessed on 19 December 2024)
Web 3: https://cq.ifeng.com/c/81iNp6zhRwI (accessed on 19 December 2024)
Spatial Narrative Structure22.71%RC48.91%11.11%Space syntax-based analytical data
RI51.09%11.60%Space syntax-based analytical data
Spatial Narrative Effectiveness30.30%TR40.55%12.29%On-site survey statistics
NG42.53%12.88%On-site survey statistics
TA16.92%5.13%On-site survey statistics
Table 4. Indicators of Narrative Experience Evaluation.
Primary IndicatorSecondary IndicatorDefinitionData Source
Spatial Narrative ResourcesNarrative Symbol Richness (SR)The diversity of narrative symbols displayed within the trail environment.Questionnaire Survey
Narrative Resource Visibility (RV)The extent to which the trail’s narrative resources excavate and manifest the local historical and cultural context.
Narrative Resource Prominence (RP)The degree of prominence of the narrative resources of the trail.
Spatial Narrative StructureNarrative Logic Clarity (LC)The extent to which the storyline embedded in the space is logically structured and easy for visitors to comprehend.
Narrative Thread Identifiability (TI)The ease with which visitors can recognize and follow the main narrative thread throughout the trail.
Narrative Route Selectivity (RS)The degree to which visitors can seamlessly navigate and choose between narrative paths and nodes.
Spatial Narrative Continuity (SC)The convenience and fluidity of pedestrian movement, indicating uninterrupted narrative progression in space.
Narrative Structural Situationality (NS)The degree to which the storyline associated with the narrative structure is contextually embedded within the space.
Spatial Narrative EffectivenessEmotional Resonance Intensity (ER)The strength of emotional engagement elicited by the narrative elements along the trail.
Cultural Educational Value (CE)The amount and significance of new cultural or historical knowledge acquired by visitors.
Interaction Diversity (ID)The variety and richness of interactive opportunities along the trail.
Cultural Identity (CI)The extent of visitors’ recognition of the specific historical events presented.
Primary FactorOverall Experience Evaluation (OE)Visitors’ overall satisfaction with their trail experience.
Table 5. Results of Route Choice Analysis.
No.ValueTrailSection 1Section 2Section 3
1Average0.3110.3410.3120.274
2Minimum0.0430.0830.0940.043
3Maximum0.5860.4960.4960.586
4Std Dev0.0910.0700.0850.107
Table 6. Results of Route Integration Analysis.
No.ValueTrailSection 1Section 2Section 3
1Average0.5720.5520.5770.589
2Minimum0000
3Maximum0.8110.6990.7280.811
4Std Dev0.0930.0920.0790.112
Table 7. Level Proportions of Each Section of the Southwest Regional Trail.
DimensionsSectionNegligible (%)Low (%)Medium (%)High (%)Very High (%)Narrative-Value Potential Zones (%)
Spatial Narrative ResourcesSection 151.7131.4816.81--16.81
Section 275.916.487.773.995.8517.61
Section 377.4411.1711.39--11.39
Spatial Narrative StructureSection 125.8053.697.5812.850.0820.51
Section 27.9025.8113.6440.4712.1966.30
Section 318.7242.8815.2314.398.7838.40
Spatial Narrative EffectivenessSection 140.0527.3221.426.814.4232.65
Section 262.2217.968.186.065.5819.82
Section 354.6837.517.81--7.81
OverallSection 148.6529.8117.084.45-21.53
Section 261.3719.008.294.876.4619.62
Section 367.7519.6111.401.24-12.64
Table 8. Basic Information of Survey Respondents.
VariableCategory (%)
GenderMaleFemale
44.5155.49
EducationBachelor’s DegreeMaster’s Degree or AboveCollege DegreeHigh School or Below
33.5331.7922.5412.14
Age Group18–25 years old26–35 years old36–45 years old46–59 years old60 years old and above
38.1519.6519.0816.186.94
Table 9. ANOVA Statistical Results.
IndicatorMean ScoreANOVA
Section 1Section 2Section 3TotalFSig. (p)
TI3.262.842.652.936.5900.002 *
SC3.573.433.213.422.5000.083
ID3.172.982.672.964.3170.014 *
Note: Standardized coefficients are reported. * p < 0.05.
Table 10. Linear Regression Analysis Results.
Model 1: Spatial Narrative ResourcesUnstandardized CoefficientsStandardized CoefficientstSig. (p)Collinearity Statistics
BStd. ErrorBetaToleranceVIF
1(Constant)0.8290.196 4.2240.000
SR0.3830.0560.3436.8420.0000.6651.505
RP0.2510.0480.2545.2310.0000.7111.407
RV0.1410.0480.1472.9430.0030.6681.498
Model 2: Spatial Narrative StructureUnstandardized CoefficientsStandardized CoefficientstSig. (p)Collinearity Statistics
BStd. ErrorBetaToleranceVIF
1(Constant)0.8070.186 4.3340.000
RS0.2720.0480.2825.6150.0000.6111.637
SC0.2140.0450.2244.7970.0000.7071.414
LC0.1780.0490.1823.6130.0000.6051.654
NS0.1470.0470.1493.1130.0020.6671.499
TI0.0080.0360.0090.2150.8300.9021.109
Model 3: Spatial Narrative EffectivenessUnstandardized CoefficientsStandardized CoefficientstSig. (p)Collinearity Statistics
BStd. ErrorBetaToleranceVIF
1(Constant)0.8080.185 4.3770.000
CE0.2950.0470.3096.2480.0000.6391.565
CI0.2730.0470.2735.7640.0000.6961.438
ER0.1900.0470.1894.0170.0000.7041.420
ID0.0470.0380.0521.2210.2230.8511.175
Disclaimer/Publisher’s Note: The statements, opinions and data contained in all publications are solely those of the individual author(s) and contributor(s) and not of MDPI and/or the editor(s). MDPI and/or the editor(s) disclaim responsibility for any injury to people or property resulting from any ideas, methods, instructions or products referred to in the content.

