Abstract
The research and application of green fertilizers have long been constrained by financial and technical barriers. Farmers’ adoption of green fertilizers is also highly dependent on government policy support. As an intermediary organization bridging the government and farmers, the STB plays a crucial role in encouraging the use of green fertilizers. In order to explore the impact of the STB’s research and development investment, as well as government intervention on farmers’ green production behavior, this paper constructs a tripartite dynamic game model involving farmers, the STB, and the government. The study systematically analyzes the decision-making mechanisms of the different stakeholders and their evolutionary paths. The results show the following: (1) Under certain conditions, the system converges to two stable states: government withdrawal (1,1,0) and continued government participation (1,1,1). (2) Government intervention shows a phased decrease. As the green fertilizer production system matures, farmers and the STB gradually form a stable collaborative mechanism. At this stage, the government shifts from direct participation to a supervisory role, with its implementation coefficient increasing to between 0.75 and 1, indicating that government supervision becomes the primary mode of action. (3) The research and development efforts of the STB are influenced by both the intensity of government support and technological breakthroughs. During periods of high-intensity government support (with a research and development investment coefficient between 0.05 and 0.15), and when technological accumulation achieves a critical breakthrough, the growth rate of investment increases significantly (the coefficient jumps to 0.15–0.3). (4) Farmers’ demand for green fertilizers is stable and consistent, and the market-oriented collaboration between the STB and farmers tends to favor green production technology, which verifies the feasibility of the government’s withdrawal of functions in the later stage of the green agricultural transformation. This study provides a scientific basis for decision-making regarding the STB’s research and development of green fertilizers, while also laying a theoretical foundation for promoting the green transformation of farmers through green fertilizer innovation.
1. Introduction
Green production in agriculture is an essential requirement for the high-quality development of the agricultural sector [1]. Global agriculture faces severe soil degradation and resource constraints. FAO (2022) states that 33% of arable land is degraded by chemical agriculture, while UNEP (2023) emphasizes that agriculture contributes 24% of greenhouse gas emissions, underscoring the urgency of greening production. By optimizing the use of fertilizers and reducing their application, green production minimizes resource waste, lowers carbon emissions, and mitigates soil degradation [2]. The international community is increasingly concerned about the ecological impacts of agricultural practices [3], particularly in developed countries where public awareness is growing. More individuals are advocating for the greening of agricultural production, seeking to avoid the trade-off between environmental preservation and economic development [4]. As agricultural development enters a new phase, the reduction in chemical fertilizers and the research, development, and application of green technologies have become central to the dominant transformation of agricultural industries [5]. The sustainable use of agricultural resources, the protection of the ecological environment, and the promotion of green and safe agricultural products have become new pursuits [6]. The Chinese government has consistently emphasized the importance of green agricultural development [7]. The Chinese government has institutionalized green agricultural development through national strategies, such as the No.1 Central Document (2023), which explicitly prioritizes ‘green and low-carbon agricultural transition’ as a key task. The “14th Five-Year Plan for National Economic and Social Development” and the “Long-Range Objectives for the Year 2035” clearly describe the acceleration of the green transformation of agriculture and the continuous expansion of green production [8]. In 2022, the Ministry of Agriculture of the People’s Republic of China released the “Action Plan for Fertilizer Reduction by 2025”, which outlines specific targets for reducing fertilizer use [9]. By 2025, the coverage rate of soil testing and formula fertilization technology for major crops in China will be stabilized at over 90 per cent. At the same time, the utilization rate of chemical fertilizer for the three major food crops in China will reach 43 per cent by 2025. Additionally, the “Opinions on Accelerating the Comprehensive Green Transformation of Economic and Social Development” highlight various green development initiatives [10], such as the coordinated advancement of digitalization, greening, and low-carbon models. China’s Ministry of Industry and Information Technology (MIIT) and Ministry of Ecology and Environment (MOE) jointly issued the “Circular on the Recommendation of Major Environmental Protection Technologies and Equipment that the State Encourages the Development in 2025” on April 8, encouraging research and development on green fertilizers and providing tax incentives. China has also issued the “Notice from the General Office of the China Association for Science and Technology on Supporting the Construction of the Second Batch of STB and STB Clusters” [11]. This initiative focuses on the development of STBs [12], which play a critical role in helping farmers adopt green agricultural practices. A real push to get the technology off the ground has resulted in a 35–60% increase in the adoption of green technologies, as well as training to reduce farmers’ perceived limitations.
In fact, as a major agricultural country, China continues to rely heavily on traditional chemical fertilizers, while progress in the research and development of green fertilizers remains relatively limited. For a long time, farmers have been accustomed to using nitrogen, phosphate, and potassium-based chemical fertilizers, whereas the adoption of organic fertilizers has remained comparatively low [13]. Currently, the average fertilizer application rate for crops in China is approximately 21.9 kg per mu, significantly exceeding the global average of 8 kg per mu [14]. This overuse of fertilizers contributes to substantial resource wastage and environmental degradation [15]. In 2023, China’s agricultural fertilizer application was about 50.22 million tons, and China’s fertilizer usage accounted for about 26% of the global total, according to the IFA. At the same time, not only is the problem of the amount of traditional fertilizers prominent, according to the China Chemical Industry Information Center data, 2016–2020, despite China’s green fertilizer consumption compound growth rate of about 10%, 2020 green fertilizer consumption still only accounted for 20% of the total consumption of fertilizers, so increasing the research and development of green fertilizers is particularly important.
The Science and Technology Backyard (STB) is a newly established science and technology R&D platform in China, which serves as a hub connecting the government and farmers and facilitating green fertilizer R&D, demonstration, and promotion. Since the establishment of the first Science and Technology Courtyard by China Agricultural University in 2009, more than 1800 such courtyards have been established across the country [16]. These STBs have become a vital platform for governments at all levels to deliver scientific and technological services. Science and Technology Courtyards are established with the support of universities and are typically equipped with well-developed experimental facilities [17]. Professors and expert teams are directly involved in agricultural technology research, creating favorable conditions for the development and innovation of green fertilizers. At the same time, as self-financing entities [18], science and technology institutes have a better understanding of the market and the needs of farmers, and have better agricultural socialization services [19], and facilitate the use of green fertilizers by farmers [20].
Green fertilizers are applied throughout the entire crop growth cycle, contributing to the advancement of sustainable agricultural practices. Studies have demonstrated that green fertilizers are crucial for enhancing soil quality [21], increasing farmers’ profitability [22], and fostering sustainable agricultural development [23]. The promotion of green fertilizers to green technology is mainly reflected in the development of slow-release coating materials (e.g., polylactic acid-based coatings) so that the nutrient release cycle can accurately match the needs of the crop; and in the integration of biotechnology: the application of composite functional bacterial agents has increased the utilization rate of fertilizers by 20–30%. Additionally, they contribute to the advancement of green technologies [24]. In order to reduce the use of traditional fertilizers, more and more scholars are focusing on the research and development of green fertilizers. As far as the field of fertilizer research and development is concerned, the views of the academic community can be divided into two main categories: first, the development of green fertilizers by changing the way fertilizers are used through digital technology, mainly in conjunction with digital technology [25], which is believed to be able to reduce the amount of fertilizers used. Wang [26] believes that fertilizers should be used with industrial technology that is compatible with the current stage, and that industrial technology should be used to achieve a balance of fertility, pH, and other factors in order to promote the growth of crops. Musajan [27] argues that the continued development of digital technology is the main factor in greening the agricultural market, and some scholars also believe that new digital technologies such as sensors [28] and vision systems [29] are the key to breaking the mold. The sensor network [25] can monitor soil moisture (e.g., moisture content ± 0.5% error) and nutrient dynamics (N/P/K concentration updated every 15 min) in real time and with variable fertilizer applicators to achieve a 20–30% reduction in dosage (data from 2023 field trials at China Agricultural University). Machine vision-based crop phenotyping systems [26] can recognize early pests and diseases, so they are key. The second is to find suitable green alternatives or improve traditional fertilizers to develop green fertilizers, resulting in a slow increase in agricultural productivity [30]. For example, Lin [31] argues that the use of new green fertilizers, such as those made from organic materials like bird droppings, yields significant benefits. This highlights the urgent need for further research and development in green fertilizers and demonstrates the impact that new fertilizer products are having on agricultural practices. Faria’s [32] research on ammonia fertilizers suggests that their effectiveness can only be realized through large-scale improvements. He argues that the research and development of these fertilizers has not been sufficiently intensive or widespread to generate the necessary scale and cluster effects, highlighting the need for targeted action in this area. At this stage, the main problem is the limitations on fertilizer research and development. In the aforementioned two research approaches, technological innovation and novel fertilizer development face significant challenges due to patent restrictions. The open-source model, while promoting collaboration among R&D institutions, leads to imbalanced benefit distribution and diminished returns, further exacerbated by low farmer participation. Consequently, there is an urgent need to propose new vehicles that reconcile these issues. Future studies should explore directions for open-source green fertilizers and new R&D carrier development, ensuring equitable stakeholder engagement and sustainable innovation. Further, a vehicle is needed for most research, both in the way fertilizers are used and in their own research and development, but little attention is paid to the STB.
The Science and Technology Backyard conducts research and development on green fertilizers based on market demand, increases capital investment, focuses on technological breakthroughs, and strengthens its innovation capacity. Existing research and development efforts are primarily organized by the government or subsidized R&D institutions [33], often overemphasizing macro-control while neglecting changes in market demand. As a result, these efforts frequently fail to achieve the desired outcomes [34]. In contrast, science and technology institutes, with a focus on environmental protection, develop green fertilizers that are aligned with market demand, effectively addressing the green production needs of farmers. In the context of environmental governance, the development of green fertilizers by the Science and Technology Academy has enhanced the carbon sequestration and utilization rates of fertilizers, reduced carbon emissions and greenhouse gas output [35], and minimized chemical pollution [36]. In terms of alleviating financing constraints, the green fertilizers developed by the science and technology institutes have boosted agricultural productivity, attracted a significant number of farmers to purchase them [37], increased the institutes’ income, and accelerated capital recovery [38]. In the promotion of green fertilizers, the Science and Technology Courtyard has taken the initiative to contact farmers through multiple channels to actively publicize green production and stimulate the enthusiasm of farmers to use green fertilizers [39], improving smallholders’ capacity-building by creating an enabling environment for sustainable crop production. Therefore, with the financial support of the government, small science and technology institutes to strengthen scientific research cooperation with universities, and research and development of green fertilizers to meet the needs of farmers, a win-win situation can be formed. STB, as a professional platform for disseminating research outcomes, operates on a non-profit-oriented model. This approach mitigates issues arising from imbalanced benefit distribution while enhancing farmer engagement through active field-level promotion. Due to its proximity to agricultural practices, STB facilitates open-source technology sharing, thereby eliminating unipolar R&D structures and enabling real-time user feedback to guide innovation. Research on the STB model demonstrates its paradigmatic breakthrough in agricultural knowledge co-innovation systems. Furthermore, it addresses critical academic gaps in the diffusion of innovation theory within smallholder economies in developing countries, including institutional innovation gaps through redefined stakeholder collaboration mechanisms, knowledge production gaps by bridging the disconnect between research and practical applications, and governance model gaps via a decentralized, participatory framework for technology development.
Existing research has effectively contributed to the greening of agriculture, but there are still some shortcomings. First of all, in terms of research methodology, the research method of evolutionary game is relatively rarely used to deal with the issue of green fertilizers. The evolutionary game repeatedly interacts between dynamic data that constantly leaps upward, and plays a key role as a bridge to the research and development and promotion of green fertilizers through STB. Through the interaction of several parties and the adjustment of strategies to achieve a dynamic balance, it has a unique advantage in the evolution of social transformation. Secondly, in terms of research objects, now more research focuses on the use of fertilizers, fertilizer production means of use, or the digital transformation; although less attention is given to green fertilizer research and development in this regard, the importance of its agricultural production cannot be ignored. Finally, in terms of the content of the study, the emergence of the subject of STBs as a carrier of the transition is necessary to study, which is one of the shortcomings of the existing research; most of the studies acquiesced to the government’s uninterrupted funding, but ignored the fatigue after a long period of operation, and the possibility that the government will ultimately fade out. The greening of agricultural production has a dynamic impact on the way in which the country is regulated at the macro level. Therefore, this study proposes the following research question: based on the tripartite evolutionary game in the research methodology, we construct a tripartite model of farmers, science and technology institutes, and the government, so as to explore the dynamic equilibrium of the three parties. In terms of research content, through dynamic data simulation, real-time analysis of attached scenarios to explore government policies, STB R&D inputs, and farmers’ own needs to show the dynamic impact, this study contributes to the development of agricultural greening, and collaborates in the establishment of green agricultural production co-progress mechanism.
The remainder of this paper is organized as follows. Section 2: the initial modeling of the tripartite is constructed from the theoretical foundations as an introduction, while the relevant assumptions are established. Section 3: the expected returns from different policies of the tripartite participants are analyzed and the dynamic equations are replicated to analyze the impacts of the corresponding policies in the system, while the stabilization and destabilization scenarios are elaborated. Section 4: sensitivity analysis is carried out for the relatively critical parameters in the model system to simulate the changes in the parameters as well as their impacts and to analyze the changes in the attitudes of the remaining two towards the different behaviors of the STB. Section 5: a comprehensive discussion of the simulation results. Section 6: recapitulates the findings of this study, proposes corresponding policy opinions based on the findings, and objectively points out the limitations of the model in terms of boundary condition setting and data acquisition dimensions.
2. Materials and Methods
2.1. Application of Evolutionary Game
Evolutionary game theory was initially introduced by R. A. Fisher in his 1930 work, ‘The Genetical Theory of Natural Selection’. Subsequently, this theory has been applied beyond biology and has been widely extended to fields [40] such as economics, sociology, and political science, where it serves as a valuable tool for analyzing strategic interactions and adaptive behaviors in complex systems. The core idea of evolutionary game theory is that the behavioral strategies of individuals within a group evolve over time to adapt to environmental conditions and social dynamics [41]. An ‘equilibrium strategy’ refers to a relatively stable behavioral pattern that emerges in a specific environment. Successful individuals can enhance their benefits by reinforcing and expanding the advantages associated with this equilibrium strategy [42].
An evolutionarily stable strategy is a behavioral strategy that, once adopted by the majority of a population, remains stable in a dynamically changing environment and effectively resists invasion by alternative strategies. Such a strategy is both stable and sustainable, and is typically widely accepted and adopted by members of the group. However, due to temporal factors, different steady states may not initially constitute an optimal strategy [43].
Compared with evolutionary game theory, system dynamics offers a clearer delineation of the division of labor among elements within a system. It describes the distribution and evolution of different components in a group and emphasizes the feedback relationships—both positive and negative—among these elements. By characterizing the evolutionary process of a group as a dynamic system, group behavior can be analyzed using mathematical modeling techniques [44].
As a key pillar of the national economy, the green transformation of agricultural production entails decision-making adjustments and systemic changes across multiple stakeholders. As an effective analytical tool, evolutionary game theory provides theoretical support for analyzing the dynamic evolution of complex systems involving multiple interacting stakeholders. By constructing a mathematical model, the theory is able to deeply explain the interaction mechanism of multiple participating subjects in a specific environment and reveal their dynamic adaptation process based on behavioral benefits. Within the framework of the model, the level of inputs to the STB can be conceptualized as a series of combinations of strategies, each of which is adjusted to produce differential effects for both farmers and the government. By analyzing the interaction mechanisms between these strategies, it is possible to identify combinations of strategies that are more environmentally adaptive and thus achieve long-term stability of the system. In addition, evolutionary game theory provides theoretical support for the model, which can be used to explore the cooperative and competitive relationships between participants. Therefore, the model not only provides an effective analytical tool for agricultural green production, but also can provide a theoretical basis for the development of optimal decision-making strategies.
2.2. Major Players
The research and development of green fertilizers is not only a key initiative by the Chinese government to promote green agricultural practices and advance agricultural greening, but also a critical pathway to achieving sustainable industrial development and enhancing farmers’ productivity. Therefore, the development of green fertilizers by science and technology colleges constitutes a socially impactful initiative that necessitates the coordinated participation of science and technology colleges, farmers, and government agencies.
Farmers: With the advent of the era of agricultural green transformation, chemical fertilizer substitution technologies have increasingly become an integral component of the agricultural production system. This study examines the influence of green fertilizers developed by the STB on farmers’ production decisions. While the yield-enhancing effects of green production technologies have been partially supported by empirical evidence, farmers exhibit highly rational behavior in their adoption decisions. Due to the marginal costs associated with applying new bio-fertilizers and the information asymmetry arising from uncertainty about expected benefits, farmers’ willingness to adopt green technologies demonstrates significant heterogeneity across the group [45].
Science and Technology Backyard (STB): As a platform connecting the government and grassroots agricultural production, the Science and Technology Courtyard is able to reflect policy changes in a timely manner and form effective interactions with the universities, which are able to provide feedback on real-time problems in agricultural production, while the universities provide solutions based on their specialized knowledge and technological strengths. China’s aim for green fertilizer research and development is not to obtain short-term gains through market distortion, but to enhance the value of the product through technological research and development, which is why R&D on green fertilizers is crucial for the STB. However, due to information asymmetry among farmers [46], their adoption of high-quality green fertilizers provided by the STB directly influences income dynamics. When farmers adopt green fertilizers at scale, the STB can realize increased revenues and benefit from economies of scale. Conversely, limited adoption may hinder product promotion efforts and lead to a decline in income.
Government: The government serves as the primary macro-level regulator of agricultural development. In the transition toward green production, governments face a critical decision between adopting proactive policy incentives and implementing punitive regulatory measures [47]. Currently, the Chinese government incentivizes farmers to adopt green fertilizers through two primary policy approaches. On the one hand, government transfers are primarily directed toward subsidizing green production initiatives [48]. The subsidy approach, primarily based on price subsidies, encourages farmers to pursue green transformation by alleviating the financial pressures associated with greening production, while also mitigating moral hazard and reducing the occurrence of opportunistic or fraudulent subsidy claims. On the other hand, in addition to rewards, the policy framework also includes penalties. These are applied in cases of fraudulent behavior and are directed at individuals who fail to comply with national policy guidelines or who exhibit parochial resistance to the green transition. The popularization of education by the government will at the same time lead to changes in the strategies of the first two parties. Strong policy stimulus also implies increased fiscal spending. Therefore, the government must find the optimal decision by interacting with farmers and the STB. In fact, as the subsidy policy shifted from heavy initial support to complete withdrawal, government investment gradually decreased, leading to a stabilized state in the relevant economy or industry.
Farmers, the STB, and the government make decisions based on costs and benefits. Although there is consistency in some aspects of their optimal strategies, the fact that they choose to cooperate based on different logics suggests that there is still a game between them. The game relationship is shown in Figure 1.
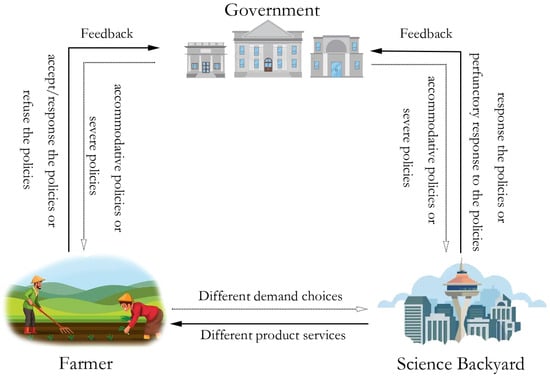
Figure 1.
Logical relationship of the tripartite evolutionary game model.
2.3. Underlying Model Assumptions
In the process of agricultural green transformation, the government, science and technology institutes, and farmers form a tripartite synergistic system, with each playing a critical role. The government, as the system architect, promotes green transformation by constructing an environmental governance framework and providing policy guidance, with the public interest as its central objective. By employing policy instruments such as financial subsidies and technology promotion, the government facilitates the alignment of farmers’ income growth with the goals of green development. As a regional innovation platform, the Small Academy of Science and Technology has achieved significant progress in the research and development of green fertilizers and the advancement of low-carbon agricultural production technologies. Through technical training, field demonstrations, and other outreach methods, farmers are supported in mastering green production techniques, thereby achieving a balance between environmental sustainability and production efficiency. As the primary implementers, farmers have enhanced their operational efficiency and reduced environmental costs by adopting innovative technologies such as green fertilizers and water-saving irrigation systems. Their decisions regarding technology adoption directly influence the effectiveness of the green transformation, forming a dynamic equilibrium between environmental maintenance costs and production benefits. The interrelationships among the key elements are illustrated in Figure 2. The central argument is that when farmers adopt green fertilizers developed by the Science and Technology Backyard, the cost of environmental maintenance is effectively offset by the enhanced benefits resulting from environmental optimization.
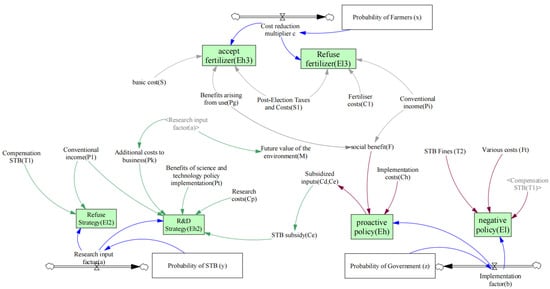
Figure 2.
Linkage between tripartite elements.
H1.
In this paper, we consider three game subjects, farmers, science and technology institutions and government individuals; all three are finite rational individuals, and all of them have a certain learning ability and behavioral choice power.
H2.
As the primary agents of agricultural production, individual farmers make decisions based on the ‘aversion to uncertainty’ principle, choosing between green fertilizers and traditional fertilizers. The probability of adopting green fertilizers is denoted by x, while the probability of opting for traditional fertilizers is 1 − x; in response to national policies, the Science and Technology Academy initiates relevant green initiatives and conducts research and development (R&D) on green fertilizers. The intensity of R&D efforts may vary, with a probability y representing active and high-level R&D engagement, and 1 − y representing perfunctory or minimal scientific efforts. Naturally, the effectiveness of product optimization depends on the level of R&D commitment; the central government may choose to supervise and incentivize local science and technology micro-institutions with a high degree of enforcement, represented by probability z, or allow them to operate autonomously without supervision or incentives under low enforcement, represented by probability 1 − z.
H3.
Let Pi denote the net income of individual farmers who do not adopt green production technologies, with C1 representing fertilizer costs and S representing other basic production costs. When farmers adopt green production, they receive a subsidy Cd for using green fertilizers, and their fertilizer cost becomes C1/a, which varies depending on the level of scientific research. After adopting green fertilizers, the yield increases, resulting in a new net income Pg, and the additional cost of purchasing related technological products is denoted as S1. Typically, Pg > Pi and S1 > S. Let M represent the normal future value of the environment, while aM denotes the value of high-quality geospatial space that generates enhanced environmental effects in the future. The difference between these two values, (1 − a)M, reflects the additional environmental benefit attributable to improved spatial quality.
H4.
To promote green fertilizers, the STB must incur both R&D costs (e.g., equipment purchases, sample testing) and non-R&D costs (e.g., wages, land rent), denoted as C1. They receive corresponding subsidies Ce from the government and invest in research at a cost Cp, influenced by a research investment coefficient. The net benefit derived from implementing green technology policies is denoted as Pt. If the response is merely perfunctory, the resulting benefit is P1, with research costs reduced by a factor of c, where the relationship between R&D inputs and response strength satisfies a + c = 1. When Science and Technology Courtyards respond perfunctorily, higher authorities may resort to deceptive compensatory measures to mask this behavior [49]. Implementing such deception incurs a cost to the government, denoted as T1, which is significantly lower than the research cost that should have been incurred (T1 ≪ Cp). Conversely, when the Science and Technology Courtyards actively promote green technologies, the government incurs an additional payment cost Pk to overcome institutional and administrative barriers, thereby supporting genuine policy implementation. The coefficient of scientific research input is defined as the proportion of total input allocated to research activities, with a value of 1 indicating that all inputs are devoted to scientific research. Due to the lack of complete data on the current quality and effectiveness of green fertilizer products, this study uses the level of input as a proxy for performance—where higher input intensity is assumed to correspond to better performance [50], and lower input intensity to poorer performance.
H5.
Government policy implementation can be categorized into two levels: high implementation and general implementation. Under high implementation, the government incurs an implementation cost denoted as Ch, due to the involvement of multiple administrative departments. It also provides differentiated subsidies (Ce) to Science and Technology Backyards (STBs) that are more responsive to science and technology policies. These subsidies are further linked to the scientific research input coefficient and extend to individual subsidies for farmers (Cd). If farmers fail to adopt green production practices under high implementation, they are subject to penalties (T), while non-compliant STBs incur penalties denoted as T2. Under general implementation, the total cost is denoted as Ft, with an implementation coefficient b, and no subsidies are provided. Instead, social benefits (F) arise from STBs that still respond positively to science and technology policies. The implementation coefficient reflects the level of regulatory stringency: the higher the coefficient, the stricter the enforcement and the more severe the penalties [1].
3. Evolutionary Game Equation Analysis Results
3.1. Tripartite Expected Benefits
According to the evolutionary game theory and the constructed payoff matrix, the expected payoffs and average payoffs of the farmer, the STB, and the government under different decisions can be calculated. Under different strategy choices, each of the three parties adopts different behaviors, leading to different results, thus constituting the corresponding payoff matrices. Specific details are given below:
The graph of benefits to farmers, STBs, and the government is shown in Table 1.

Table 1.
Benefits matrix for the three parties.
3.1.1. Government Evolutionary Stabilization Strategy
The benefits to the government:
- (1)
- High implementation:
- (2)
- General implementation:
- (3)
- Government expected return:
3.1.2. Evolutionary Stabilization Strategies for STB
The benefits to the STB:
- (1)
- Highly responsive:
- (2)
- Perfunctory response:
- (3)
- Expected return of the STB:
3.1.3. Evolutionary Stabilization Strategies for Farmers
The benefits of Farmers:
- (1)
- Highly responsive:
- (2)
- Perfunctory response:
- (3)
- Expected return of the STB:
3.2. Stability Analysis
The strategies of farmers, the STB, and the government evolve dynamically throughout the game process. Therefore, it is necessary to analyze these changes through differentiation. According to the stability criterion of differential equations, the system tends toward stability when the eigenvalues of the Jacobian matrix are less than zero. In this context, the Jacobian matrix represents a linear approximation of the replication dynamic equations at a given strategy point, expressed through partial derivatives. Due to this characteristic, when external strategies continue to fluctuate, their rate of change diminishes, ultimately leading to a stable outcome. This negative feedback mechanism ensures the stability of the equilibrium point. The resulting matrix is constructed as follows.
In the tripartite game among farmers, Science and Technology Backyards (STBs), and the government, each party dynamically adjusts its strategy throughout the game process. To analyze the system’s local stability, the Jacobian matrix is derived using differential methods, which provides a linear approximation of the replicator dynamic equations at a given strategy point. According to the stability theory of nonlinear dynamical systems, the system converges to a stable state when all eigenvalues of the Jacobian matrix are negative. In this case, the influence of external variables diminishes over time, and the system ultimately stabilizes. The computed eigenvalues of the Jacobian matrix for each equilibrium point are presented in Table 2.
Table 2.
Equilibrium points and eigenvalues for each strategy.
Since the first-order derivatives are too lengthy, the algebra is hereby set up instead
For farmers, the following conclusions are drawn:
- (1)
- , , . That is, stabilization is reached, so the only case in which x = 1 is an evolutionary stabilization point in this study is when the government employs policy stimulus. It also shows that farmers are interested in using green fertilizer.
- (2)
- , so while x = 1/0, , and while x = 1/0, stabilization could not be achieved; thus, at this stage of the study, any change in the x-strategy represented a relatively general yet stable fluctuation—that is, the magnitude of the strategic adjustment remained consistent and exhibited no significant variation and was without values.
- (3)
- , , , stability has been reached, so the only case where x = 1 is an evolutionary stability point in this study is when it indicates a policy stimulus from the government and at the same time a farmer rejects the use of green fertilizers.
For the STB, the following conclusions are drawn:
- (1)
- This indicates that y = 1 is the point of stability for the STCs and also indicates that the STBs will choose to actively invest in the research approach for green fertilizers.
- (2)
- This suggests that y = 0 is the inability of the STC to achieve stability at this stage, and also suggests that the STC will opt for a wavering and fluctuating investment approach to research with regard to green fertilizers.
- (3)
- This indicates that y = 0 is the evolutionary stabilization point for the STBs, suggesting that STBs are inclined to adopt a perfunctory approach to research input for green fertilizer development.
For the government, the following conclusions are drawn:
- (1)
- This suggests that z = 1 represents the evolutionary stabilization point for the government, indicating that the government will adopt a highly enforced implementation strategy in relation to the green fertilizer policy.
- (2)
- This suggests that z = 1 or z = 0 indicates the government’s inability to reach a stable state, reflecting a tendency toward fluctuating or inconsistent implementation of green fertilizer policies.
- (3)
- This suggests that z = 0 is the stabilization point for the government, and also indicates that the government will choose to implement a general policy with respect to green fertilizer policy and allow green fertilizers to develop freely.
3.3. Data Source
As a globally significant agricultural producer, China faces considerable challenges in fertilizer research and development. With the continued expansion of green fertilizer research, there is a growing demand for enhanced R&D capabilities in green technologies. In this context, the present study focuses on optimizing agricultural productivity through green fertilizers developed by the STB, and explores their role in advancing the green transformation of agriculture. Regarding data processing, due to the substantial differences in scale and functional positioning among the government, STB, and farmers, using farmers’ income as a unified benchmark fails to accurately capture the heterogeneity of these stakeholders. Therefore, this study adopts a proportional analysis method, standardizing data within each respective system to ensure scientific rigor and comparability in the analysis.
Using farmers’ returns as the baseline (set at an index value of 100), this study draws on experimental data from Gan Zihua to demonstrate that the adoption of green fertilizers can significantly enhance the net returns from agricultural production [51]. In 2022, Gan and colleagues conducted a field experiment in Menghai County, Xishuangbanna Dai Autonomous Prefecture, Yunnan Province, to assess the yield-increasing effects of green fertilizers in rice cultivation. Under controlled conditions with equal nitrogen and phosphorus input levels, the study compared three types of conventional fertilizers—conventional nitrogen, phosphorus, and potassium fertilizer (TN), conventional compound fertilizer 1 (TP), and conventional compound fertilizer 2 (TK)—against a green fertilizer treatment (TG). The results showed that TG led to a substantial yield increase of 26.2% to 38.1% compared to the conventional treatments. Based on the robustness and consistency of the data, this study adopts a conservative average yield increase of 30% as the benchmark for subsequent analysis. The study by Gan et al. was selected due to the comprehensiveness of its data and the representativeness of rice, which is a globally significant staple crop.
According to the 2023 National Economic and Social Development Statistical Bulletin of the People’s Republic of China, the total output value of the primary industry reached CNY 8975.5 billion. Based on data from the China Statistical Yearbook 2023, China’s agricultural fertilizer usage totaled 50.22 million tons in 2023 [52]. Taking compound fertilizer as a representative product, large-scale statistical data indicate that the average market price in June 2024 was approximately CNY 2849 per ton, corresponding to about 1.6% of primary industry income. Additional costs associated with green fertilizer adoption—due to limited uptake by farmers—are estimated to account for approximately 10%, with an initial assumed value of 6% for modeling purposes.
In the dataset related to the STB, their net gains are standardized using a base value of 100. Based on technological advancement, the gain from S&T policy implementation (Pt) is set to 115 [53]. At present, the primary approach to green fertilizer adoption in China is through research and development (R&D), and thus its impact can only be reflected in the total R&D investment. Due to the lack of publicly available and comprehensive data on the funding of the STB, the total investment is used as a proxy measure. According to the China Statistical Yearbook 2023, the share of agricultural S&T investment in the national total R&D input was 6.3% in 2020 [54]. For ease of calculation, the initial R&D input coefficient is set to 0.05, and this coefficient is proportionally increased to reflect growth in human-driven R&D input. As for deceptive compensation, no official commercial data are currently available. In light of this uncertainty, a conservative approach is adopted. Given that green fertilizer promotion through deceptive practices has been reported, the cost of such compensation is assumed to be significantly lower than that of legitimate scientific research, and is therefore set at a nominal value of 3.
This study utilizes publicly available government data and parameterizes its values using government revenue as the benchmark, which is set to 100. According to the Report on the Forecast of Central General Public Budget Revenue in 2025 [55], China’s central general public budget revenue is projected to reach CNY 9.696 trillion. Based on a comprehensive analysis of fiscal expenditure and social efficiency indicators, a weight of 80 is assigned to revenue-related inputs (representing 80% of the benchmark value), reflecting the fact that tax revenue—including individual income tax and foreign trade-related taxes—accounts for 76.1% of general public budget revenue. Meanwhile, a weight of 20 is assigned to various cost and expenditure factors.
Regarding the implementation coefficient, this study refers to the projected national agricultural investment of CNY 500 billion in 2025, which constitutes approximately 5% of total fiscal revenue. This level of investment is interpreted as indicating a “high concern” policy status (threshold > 5%). Accordingly, the parameter for high implementation cost (Ch) is set at 10, which is twice the baseline level of 5% [55].
Based on the Policy Implementation Report of the Ministry of Agriculture and Rural Affairs [56], agricultural subsidies are capped at 30% of the total project cost. Thus, the combined parameter for direct subsidies (Cd) and institutional subsidies (Ce) is set at 20. Notably, data on fines and the compensatory mechanisms associated with the STB are limited due to the absence of publicly available statistical information. Therefore, this study estimates these values based on the implementation guidelines for the STB. Most penalties for the STB tend to be non-monetary in nature, with few cases of substantive financial penalties [54] Refer to Table 3 for specific values.
Table 3.
Data presentation.
3.4. Analysis of the Destabilizing Points
In cases of information asymmetry, evolutionarily stable strategies (ESSs) in asymmetric games are necessarily pure strategies [61]. Based on this principle, eight pure strategy equilibria are identified: E1 = (0,0,0), E2 = (1,0,0), E3 = (0,1,0), E4 = (0,0,1), E5 = (1,1,0), E6 = (0,1,1), E7 = (1,0,1), and E8 = (1,1,1). However, it is often difficult to determine directly which of these equilibria represents a stable state. Therefore, this study employs the Lyapunov stability criterion and uses the Jacobian matrix to analyze the local stability of the equilibria. A local equilibrium point is considered asymptotically stable only if all eigenvalues of its corresponding Jacobian matrix are negative. On this basis, we obtained the Jacobi matrix and its eigenvalues using the first-order partial derivatives of F (x), F (y), and F (z) with respect to x, y, and z, respectively, and analyzed the trend of evolutionary stability between the government, farmers’ cooperatives, and consumers, from which the replicated dynamical equations were jointly solved by letting F (x) = 0, F (y) = 0, and F (z) = 0, to obtain eight equilibrium points.
- 1
- Analysis of E1(0,0,0): In this scenario, government incentives for green fertilizer initiatives are insufficient, and regulatory oversight is weak or absent. STBs are constrained in their ability to act effectively. Farmers are motivated by profit motive, frustrated, and less trustful, and turn to high environmental cost production methods. The combination of policy instability and farmers’ subjective factors makes the promotion of green fertilizer projects a serious challenge.
- 2
- Analysis of E2 (0,1,0): From a game-theoretic perspective, this equilibrium state exhibits significant asymmetry. In the absence of adequate government policy support and with low willingness among farmers to adopt green fertilizers, a synergistic mechanism cannot be established despite active scientific input from the STB. The burden of research and development falls disproportionately on the STB, making the equilibrium highly unstable. Relying solely on the efforts of a single stakeholder renders this tripartite interaction inherently fragile; even minor disturbances can lead to the breakdown of the equilibrium.
- 3
- Analysis of E3 (0,0,1): As the market demand for green products increases, although the government takes the lead in organizing green production, farmers and small science and technology houses only stay at the ideological level and take a wait-and-see attitude in their actions. Farmers, as rational economic subjects, will reject green production when the cost of action is higher than the benefit, resulting in the government’s lack of unidirectional promotion. Therefore, (0,0,1) is not a long-term stability point.
- 4
- Analysis of E4 (0,1,1): The choice of green fertilizer development by the STB is driven by profit. In the context of government regulation and the promotion of R&D by the STB, small farmers tend not to participate due to competitive disadvantages in the market, high costs of green production, and low and unstable returns. Although the government implements incentives and supervision, farmers and the STB do not participate in a timely manner, and the environmental benefits are much lower than the government’s inputs, resulting in the (0,1,1) equilibrium point being difficult to stabilize in the long term.
- 5
- Analysis of E5 (1,0,0): Under the current policy framework, government departments and the STB have not yet established an effective policy support system or a robust product supply mechanism. This institutional deficiency, combined with supply-side limitations, has led to inadequate systemic support for the green transformation of agricultural production entities, thereby hindering sustainable development. From the perspective of game theory, a unilateral mode of action cannot form a stable Nash equilibrium. As such, the current state of green transformation represented by this configuration is neither sustainable nor stable.
- 6
- Analysis of E6(1,0,1): Under the current market equilibrium, sustainable green production cannot be achieved solely through the bilateral interaction between farmers and the government. Only through dynamic collaboration among farmers, the government, and the STB can the challenges posed by market competition be effectively addressed. While farmers and the government may engage positively, the absence of the STB—who serve as the core agents of technological innovation and diffusion, possessing greater market sensitivity and risk resistance—undermines the stability of this configuration. Without the support of scientific and technological infrastructure, the innovation chain breaks, market adaptability declines, and the current equilibrium becomes unsustainable in the long term.
3.5. Analysis of the Stabilization Point
Building on the analysis of E5 (1,0,0), E1(1,1,0) reflects the evolution of governmental regulatory strategies from mandatory intervention to institutional guidance. This shift has led to a significant spontaneous increase in farmers’ awareness of green production. Concurrently, STBs actively promote agricultural green transformation through mechanisms such as technological diffusion. Their core contributions include constructing innovation systems for green fertilizers that enhance fertilizer use efficiency and developing technologies for the prevention and control of non-point source pollution. The cost–benefit analysis shows that although the cost of green technology application increases by 18.7% compared with the traditional model, the net benefit spillover from its positive environmental externality creates an economic incentive for continuous iteration of technological innovation. Further research found that the intensity of policy guidance was significantly and positively correlated with farmers’ participation. It is worth noting that the structural shift in social and ecological value preferences has led to a gradual stabilization of farmers’ green production participation, with the overall trend shown in Figure 3. From a long-term perspective, the (1,1,0) equilibrium state aligns with the future developmental trajectory of the agricultural sector. This equilibrium reflects a spontaneous evolution of market actors: even in the absence of continuous government incentives, farmers and STBs are capable of independently transitioning toward green production. To validate these theoretical insights, this study conducted systematic simulations using Matlab R2024a. Focusing on the evolutionary outcomes under varying policy scenarios, we adjusted key parameters—particularly the intensity of technological investment and the allocation of fertilizer costs to farmers—to examine their influence on system evolution. The research input coefficient was initially set at 0.05, and its synergistic variation with research costs was explored to understand its impact. The simulation results, presented in Figure 3, clearly illustrate how parameter changes influence the system’s equilibrium. Figure 3a shows that farmers will ultimately opt for green production; Figure 3b indicates that STBs will increase their R&D investments regardless of initial conditions; and Figure 3d, a three-dimensional representation, demonstrates that the dynamic system eventually stabilizes at the point (1,1,0). Notably, the diagram suggests two distinct evolutionary trends—towards (1,1,1) and (1,1,0)—corresponding to different stages of policy intervention and institutional maturity. The shift to z = 0.1 in the government’s strategy curve suggests that the ideal state of full cooperation (1,1,1) may be transient, with long-term stability more likely at (1,1,0).
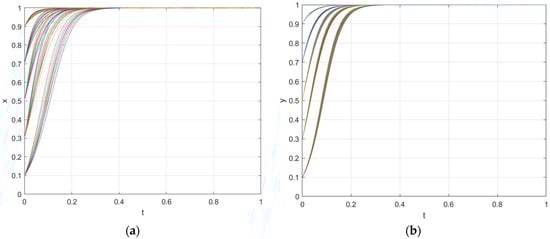
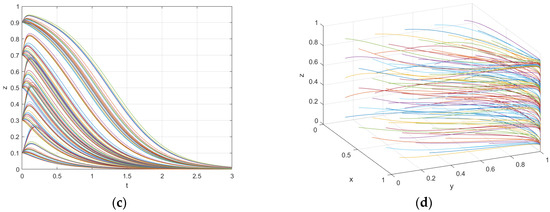
Figure 3.
Evolution of willingness for (1,1,0). (a) The evolutionary trajectory of agricultural farmers. (b) The evolutionary trajectory of Science and Technology Backyards. (c) The evolutionary trajectory of the government. (d) The overall tendency.
Analysis of E2 (1,1,1): Building upon the (1,1,0) equilibrium, the continuous strengthening of government regulation and the systematic expansion of green production in STBs result in a significant reduction in the marginal input costs for farmers participating in green production. Simultaneously, the overall benefits of green production show a positive growth trend. According to marginal utility theory, when the expected net present value of green production exceeds the income threshold of traditional agricultural practices, farmers will experience a Pareto improvement in their decision-making. This occurs within the cost–benefit analysis framework, leading to the formation of a stable preference for green production. In the (1,1,0) equilibrium, based on Keynesian macroeconomic policy theory, the synergy between STBs and the government enhances the multiplier effect of macroeconomic policies on the green industry’s development. By establishing an institutionalized governance mechanism, this approach amplifies the positive effects of policy tools. However, this government-led regulatory model reveals inefficiencies in resource allocation at the practical level. This underscores the critical role of the farmers’ demand response mechanism, which is essential for optimizing the system. To ensure the dynamic stability of the equilibrium point, the study optimizes the policy implementation coefficient b to 1. Notably, even under mandatory environmental regulations imposed by the government, farmers must still navigate a three-stage evolutionary path—comprising “cognition, adaptation, and internalization”—due to initial technological knowledge gaps and ecological trust deficits in their behavior. This finding aligns logically with Nash’s refined equilibrium theory, which holds for the (1,1,0) equilibrium. The dynamic simulation results, presented in Figure 4, indicate that once the intensity of policy guidance surpasses the inflection point on the adaptive learning curve, the adoption rate of green technology by farmers experiences exponential growth. Consequently, the system converges to the (1,1,1) equilibrium state.
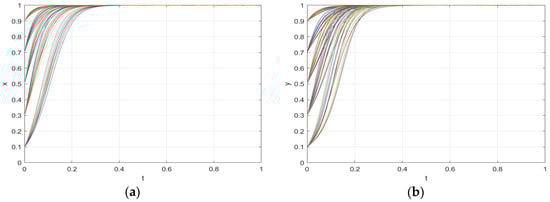
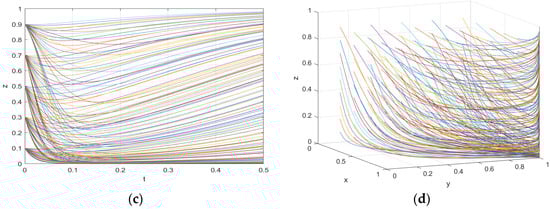
Figure 4.
Evolution of willingness for (1,1,1). (a) The evolutionary trajectory of agricultural farmers. (b) The evolutionary trajectory of Science and Technology Backyards. (c) The evolutionary trajectory of the government. (d) The overall tendency.
The scenario hypothesis analyzes two evolutionary stable states of the model, namely the evolutionary stable points (1,1,0) and (1,1,1). In this study, two typical evolutionary stable strategies are identified through a multi-actor evolutionary game model. Benchmark parameter calibration reveals that the system initially exhibits characteristics consistent with the (1,1,1) equilibrium, which aligns closely with the early stage of China’s green agricultural transition—characterized by government-led regulation, external incentives driving farmers to adopt green fertilizers, and parallel increases in R&D investment by STBs. Grounded in the theoretical framework of sustainable development, this study designates the (1,1,0) equilibrium as the ultimate goal state, representing a self-sustaining green production system that persists after the withdrawal of direct government regulation. At this stage, the government subsidy mechanism undergoes a qualitative transformation: financial support shifts from being a mandatory input to serving as a supplementary measure, introduced through phased policy interventions. Eventually, the system reaches a stable (1,1,0) state of autonomous evolution, at which point the government’s role is limited to market regulation. This outcome establishes a new governance paradigm of “market-driven, technology-supported, and self-motivated green transformation”.
4. Sensitivity Analyses
4.1. Parameter Selection
The parameters selected for the evolution of the three parties are very critical, and in this study, four parameters were selected: (research input coefficient), b (government implementation coefficient), Ce (government subsidies to farmers), Cd (government subsidies to science and technology colleges); and these four variables have a great substantive impact on the change in the three parties’ strategies during the evolution process; their role is quite obvious, and they occupy a significant role in the three-party operation process, as shown in Figure 5; thus, these four parameters were selected.
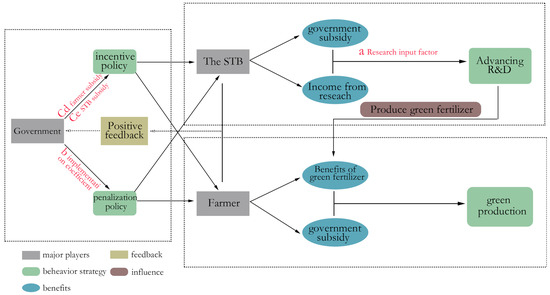
Figure 5.
Flowchart of the three parties.
4.2. Variable Analysis
4.2.1. Influence of Research Input Factor a
Impact of Changes in the Research Input Coefficient (a) on the Three Stakeholders: This study constructs an evolutionary model in which the research input coefficient (a) is treated as a core variable influencing both research investment and research costs (Cp). While an initial value of 0.05 represents an idealized scenario, simulation experiments gradually increased this value to 1. In practice, however, the coefficient typically remains relatively low; therefore, the model sets the practical threshold range between 0.05 and 0.3. The simulation results are illustrated in Figure 6. It is evident that when Science and Technology Backyards increase their research input coefficient, it simultaneously enhances the quality of their products and services. This improvement leads to a shift in farmers’ initially unstable attitudes toward green fertilizers, prompting them to adopt a preference for green production (i.e., tending toward x = 1). This behavioral shift improves fertilizer efficiency, reduces fertilizer runoff and pollution, and promotes environmental greening. In turn, farmers’ increased demand for green fertilizers incentivizes Science and Technology Backyards to further enhance their research engagement—transitioning from passivity (y = 0) to active participation (y = 1). From the government’s perspective, proactive research investment by Science and Technology Backyards alleviates fiscal pressure, reducing the need for heavy subsidies. Consequently, the government’s role transitions from mandatory supervision and financial incentives (z = 1) toward a more passive regulatory function (z = 0), marking a gradual phase-out of direct intervention. This evolution reflects a shift toward autonomous development and a self-sustaining innovation ecosystem among the three parties. (The following x, y, z are farmers, science and technology centers, and the government, respectively).
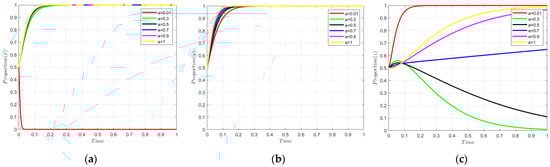
Figure 6.
Research input factor a change in tripartite selection from 0.01 to 1.0. (a) The evolutionary trajectory of agricultural farmers. (b) The evolutionary trajectory of Science and Technology Backyards. (c) The evolutionary trajectory of the government.
To conduct a robust sensitivity analysis, an initial range for the research input coefficient (a) was defined. The simulation considered values of 0.01, 0.3, 0.5, 0.7, 0.9, and 1.0. Among these, 0.01 and 1.0 represent extreme cases: the former reflects a scenario in which STBs invest minimally in R&D, while the latter denotes a scenario of substantial input aimed at maximizing yield. This wide range allows for a comprehensive sensitivity assessment, with the results presented in Figure 6, particularly the strategic choices of both farmers and the government. Specifically, when a ranges from 0.01 to 0.3, the relationship exhibits a substantial shift—from a negative to a positive correlation—suggesting that even modest increases in scientific research investment by Science and Technology Backyards can substantially alter stakeholder behavior. Furthermore, the analysis reveals a distinctive sensitivity in the government’s strategic response (z) when a approaches 1.0, marking a critical threshold. Given this inflection point, the study places particular emphasis on exploring the behavioral dynamics and equilibrium outcomes at a = 1.0 to better understand the nonlinear interactions among stakeholders and to inform optimal policy design.
At 0.01 or before, the science and technology colleges are completely obedient to the implementation, and farmers are also under the government’s compulsion to take the green fertilizer, but from 0.15 onwards, the eigenvalue is not able to find a completely negative stability point, so fluctuations arise. In reality, that is, due to scientific research inputs from both sides to achieve a certain, but not completely stable, degree of qualitative change, science and technology hospitals know the benefits of green fertilizer increases, while the short-sightedness of the farmers to see both sides of the benefits increases, so the three sides of the choice are also swaying. After 0.15, the direction of the science and technology institute is determined, the benefits generated by the inputs are stable and greater than the cost of input consumption, the relationship between the choice of agricultural production is gradually determined so that it tends to be a stable choice of “1”, in which case farmers are happy to accept high-quality products, and the government is also happy to see this situation. Subsequently, government subsidies gradually fade, subsidies are slowly reduced, and finally end up at “0”, leaving only regulation, which is also the ideal state of affairs if the government withdraws funds and the greening of the production model continues, as shown in Figure 7.
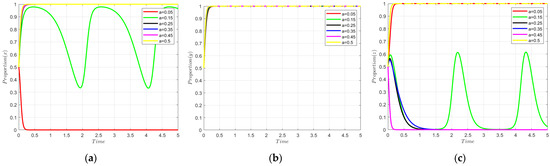
Figure 7.
a from 0.05 to 0.5 tripartite. (a) The evolutionary trajectory of agricultural farmers. (b) The evolutionary trajectory of Science and Technology Backyards. (c) The evolutionary trajectory of the government.
4.2.2. Implementation Factor b
This study analyzes the impact of the government enforcement coefficient b on the strategic decisions of the three stakeholders. A higher enforcement coefficient corresponds to a higher implementation cost, reflecting stronger subsidy intensity; conversely, a lower coefficient signifies weaker subsidies, with regulation serving as the primary policy tool. In the model, the enforcement coefficient is set at five levels: 0.1, 0.25, 0.5, 0.75, and 1.0, where 1.0 represents full implementation—i.e., efficient regulation with relatively lower costs. Simulation results indicate that as the enforcement coefficient increases, the probability of both farmers and STBs choosing to participate in green production approaches closer to 1. Farmers’ decisions are positively correlated with the level of government enforcement, particularly influenced by the severity of penalties. When penalties are low, farmers perceive them as manageable, leading to a lower initial willingness to adopt green practices. However, as penalties increase, farmers are less able to bear the associated risks, prompting a greater willingness to comply. Compared to individual farmers, STCs demonstrate stronger adaptability, reaching higher participation levels by increasing their research investments. Their overall decision-making tends to converge to 1, with government behavior accelerating this evolutionary trajectory. However, the provision of a high-quality regulatory environment imposes significant fiscal burdens on the government, which may be reluctant to sustain such costs over the long term. Consequently, as enforcement intensifies, the government’s ultimate strategic inclination gradually shifts toward 0.
There is a positive correlation between the research inputs of STBs, farmers’ willingness to adopt green fertilizers, and the government enforcement coefficient. Specifically, as the enforcement coefficient increases, both farmers’ willingness to adopt green fertilizers and the research input levels of STBs exhibit a more rapid and consistent upward evolutionary trend. Conversely, when the enforcement coefficient is low, the pace of evolution in both variables slows significantly. Under a moderate enforcement coefficient, the tension between government subsidies and implementation costs becomes more pronounced, thereby disrupting the dynamic equilibrium of the entire system. This imbalance, compounded by farmers’ cognitive limitations regarding green production technologies, results in noticeable fluctuations in individual farmers’ choices, as illustrated in Figure 8a.
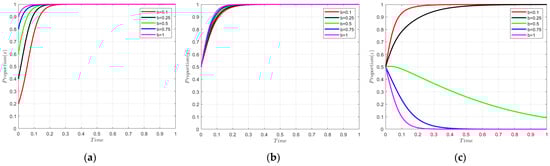
Figure 8.
b from 0.1 to 1 tripartite. (a) The evolutionary trajectory of agricultural farmers. (b) The evolutionary trajectory of Science and Technology Backyards. (c) The evolutionary trajectory of the government.
4.2.3. Subsidies for STBs (Ce) and Farmers (Cd)
This study examines the variation in government subsidy Ce to STBs and subsidy Cd to farmers to analyze the differential effects on the behavioral decisions of farmers and STBs. Under the government budget constraint, the total amount of initial subsidy is set at 20 and simulated under four scenarios, while a critical value of 40 is introduced to observe the effect of sudden change in subjects’ willingness. The results show that as the subsidy Cd increases, the willingness of farmers to accept the subsidy increases significantly, and the slope of their decision curves steepens, indicating that the subsidy has a stronger incentive effect on farmers’ behavior. For STBs, when the initial subsidy is low, their willingness to invest in research is insufficient, and they may even have non-cooperative behaviors; when the subsidy is increased, STBs are more inclined to actively invest in research, and the probability of their choices evolves towards “1”.
However, from the government’s perspective, increasing subsidies entails higher fiscal expenditures. The government’s willingness to refuse increases in the absence of a compromise on its own returns, and it tends to reduce its subsidy inputs. This adjustment in subsidy policy significantly influences the behavioral decisions of all stakeholders, highlighting the complex mechanisms through which government subsidies affect the incentives for adopting green production practices.
There is a significant positive correlation between government subsidies and the behavioral decisions of STBs and farmers. Specifically, an increase in the level of subsidies accelerates the evolution of both parties’ decisions toward “1”, indicating a stronger inclination to adopt green production practices. Conversely, a decrease in subsidy levels leads to a more rapid shift toward “0”, reflecting reduced adoption of green production behaviors. This trend is both logically consistent and aligned with the intended objectives of policy intervention. In the context of green development, the gradual reduction in subsidies—paired with mechanisms that encourage autonomous decision-making by farmers and STBs—represents an inevitable trajectory toward sustainable agricultural transformation. The dynamics of this process are illustrated in Figure 9.
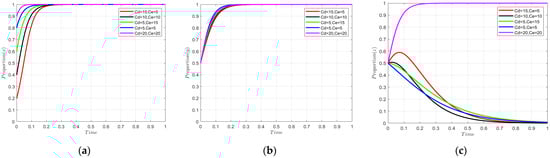
Figure 9.
Effect of changes in subsidies for farmers (Cd), subsidies for STBs (Ce) on tripartite selection. (a) The evolutionary trajectory of agricultural farmers. (b) The evolutionary trajectory of Science and Technology Backyards. (c) The evolutionary trajectory of the government.
5. Discussion
As a major agricultural producer [62], China ranks among the highest in the world in fertilizer usage, with its consumption equaling that of the United States and India combined and accounting for approximately one-third of global fertilizer application. This excessive usage has led to serious challenges, including significant resource waste and escalating environmental pollution [63]. Although China is attempting to improve resource efficiency through the point-to-point application of fertilizers with scientifically calculated ratios and through green fertilizer research aimed at reducing chemical fertilizer use, this alone cannot fully address the problem. In this context, the development and widespread adoption of green fertilizers have become a pressing necessity, underscoring their critical role in the sustainable transformation of China’s agricultural sector. STBs on the research and development of green fertilizers aim to solve the contradiction between profit and open source, while reducing the waste of resources, so that some of the technology to really lands rather than takes up the resources; however, there is a delay in the landing of the problem, so that the farmers obtain the benefits of technological upgrading, and the study of the three-party interests of the mutual game actually involves the use of the stakeholder theory [64] and the theory of behavioral economics [65].
This research investigates the emergence of STBs through a tripartite evolutionary game framework, offering novel insights into technology governance and innovation diffusion. The study highlights how this approach simultaneously addresses information asymmetry challenges in principal–agent relationships while elucidating the critical role of institutional design in shaping stakeholder behavior. This is similar to traditional research [66]. Furthermore, it extends beyond conventional analyses by explicitly examining technology promotion and commercialization processes, emphasizing the importance of open innovation in practical implementation. A key theoretical contribution lies in its phased analysis of government intervention, demonstrating how distinct technology drivers at different developmental stages may necessitate differentiated policy responses—a perspective that distinguishes this work from prior studies in the field.
Western developed countries are also actively promoting green agricultural production and the digitalization of agriculture [67]. In the United States, efforts have been directed toward technological research and development in agricultural fertilizers, including the establishment of relevant infrastructure such as mechanized fertilizer application equipment [68]. Additionally, behavioral guidance policies have been implemented to encourage farmers to adopt environmentally friendly and ecologically sound fertilizers, thereby reducing reliance on traditional mineral-based fertilizers [69]. Similarly, the European Union (EU) has introduced comprehensive regulatory frameworks aimed at supporting green fertilizer adoption; these include restrictions on the use of conventional fertilizers and reforms to market access requirements, such as lowering barriers for innovative and organic fertilizers [70]; these measures aim to provide consumers with a broader selection and accelerate the integration of green fertilizers into the agricultural market. China has also taken a series of measures for fertilizer R&D, with the promulgation of the 14th Five-Year Plan and active participation in the World fertilizer Congress, aiming to discover better fertilizers, as well as setting up dedicated institutes to research and develop them, such as the Institute of Applied Ecology in Shenyang [71]. However, despite increasing policy support, the effectiveness of these governmental measures in greening agriculture has not met expectations. The disconnect between policy efforts and actual agricultural practices suggests that government-led initiatives alone are insufficient to drive sustainable transformation; the government has introduced a combination of subsidies and penalties to incentivize change [72], which suggests that reasonable subsidies and penalties in the early stages are important for greening agricultural production, but that the government acts as an external force, and that if farmers remain reluctant, they will fall into an inefficient equilibrium trap [73], which will lead to the greening of agricultural production when subsidies stop. Therefore, the internal drive to develop quality fertilizers to attract farmers to use them is also necessary. Multiple parties need to be involved in the early stages of developing quality fertilizers [74].
Therefore, a transitional organization—namely, the Science and Technology Backyard (STB)—is essential in facilitating the greening transformation [75]. Given their critical role in fertilizer research and development (R&D), the proportion and efficiency of R&D investment by these backyards are key determinants of progress toward sustainable agricultural practices [76]. The proportion of R&D investment directly affects the rate of innovation in agricultural technologies (e.g., water-saving irrigation, organic fertilizers, etc.), and the efficiency of R&D determines how quickly these technologies can be transformed into practical applications. If more R&D funds in the backyard economy flowed to precision agriculture technologies, it could significantly reduce resource waste and directly contribute to sustainability. In parallel, it is crucial to enhance farmers’ awareness and willingness to adopt green technologies. This creates a virtuous cycle: STBs develop high-quality green fertilizers; farmers adopt these products, leading to improved yields and environmental outcomes; in turn, farmers provide valuable feedback that informs further R&D efforts by the institutes. This iterative process of fertilizer innovation and adoption not only reinforces the role of STBs but also continuously deepens the green transformation of agricultural production.
In general market mechanisms [77], government subsidy incentives [78] play essential roles in the green transformation of agriculture. In the early stages, due to technological limitations, the R&D inputs of STBs often do not yield proportional returns, making government subsidies particularly crucial. Additionally, because technological breakthroughs require time, farmers—faced with uncertainty and risk—are often reluctant to adopt new fertilizers, and may even reject them altogether [79]. This is where government subsidies come into play again. In the long run, the government subsidy is decreasing. Eventually, a self-sustaining system can emerge in which STBs and farmers form a feedback loop governed by market forces, enabling profitability even in the absence of subsidies. Thus, over time, leveraging market mechanisms becomes essential for promoting the sustainable greening of agriculture.
6. Conclusions
According to evolutionary game theory and relevant data, this study constructs an evolutionary game model to examine how research and development (R&D) of green fertilizers by STBs promotes green production among farmers. The model reveals the dynamic benefit-sharing interactions among farmers, STBs, and the government. The main findings are as follows: In specific conditions, the system can evolve toward two stable states: (1,1,0) and (1,1,1). (1) In the early stage, (1,1,1) is a stable equilibrium, where all three actors exhibit high engagement. During this phase, the government implementation coefficient b ranges between 0.1 and 0.5, indicating milder penalties and stronger subsidies. (2) The combined value of government subsidies to STBs Cd and to farmers Ce exceeds 20. Due to the availability of generous subsidies, STBs invest less of their own capital in R&D, with the research input coefficient a ranging from 0.05 to 0.15. Consequently, farmers’ willingness to adopt green fertilizers increases slowly. (3) In the later stage, the system evolves toward the (1,1,0) equilibrium. Government subsidies gradually phase out, with b increasing to between 0.75 and 1, signifying stricter enforcement and reduced financial support, and the combined value of Cd + Ce falls below 10. (4) In response to lower subsidies, STBs have to increase their own investment in R&D, and the input coefficient a rises to between 0.15 and 0.3. With reduced reliance on government funding, STBs prioritize technological empowerment and self-driven innovation. As the quality of green fertilizers improves, farmers’ willingness to adopt them increases more rapidly than in the earlier stage. From a policy perspective, the findings suggest that subsidy policies exhibit dynamic adjustment—from strong initial support to gradual withdrawal. This staged disinvestment strategy facilitates the achievement of economic equilibrium and the sustainable development of green agriculture and related industries.
Based on the findings of this study, the following policy recommendations are proposed:
First, the government should develop targeted and adaptive subsidy policies. These policies must be aligned with different stages of development in the green agricultural transition. In the early stages, the government should conduct a comprehensive evaluation of the R&D capacity of STBs and design specialized subsidy schemes for green production, taking into account technological maturity, market potential, and cost-effectiveness. At the same time, to improve the regulatory mechanism, the government needs to abandon the mode of relying solely on high subsidies to promote green production, and improve the relevant penalty mechanism to curb the farmers’ fluke, so as to promote their willingness to participate in green production on their own. Second, STBs should aim for high-quality innovation and strategic technological development. They should actively align with national policy objectives by guiding research teams to focus on the development of green fertilizers and other sustainable agricultural inputs. In addition to improving product quality, STBs must also enhance service delivery by aligning product offerings with practical farming needs. This includes the development of complementary services such as high-quality agricultural product support systems. Improving the overall service ecosystem will help increase farmers’ satisfaction and strengthen societal recognition of green fertilizers. Third, farmers should proactively engage in green agricultural production. Farmers are encouraged to transition in line with national green development goals, participate in awareness and training programs, and adopt green fertilizers that align with their economic circumstances and production needs. By optimizing production strategies to pursue high-quality outcomes and reduce planting costs, farmers can play an active role in promoting sustainable agriculture. Although the widespread adoption of high-quality green fertilizers will require time and faces multiple barriers, it is imperative for all stakeholders—government, STBs, and farmers—to seek a balance between competition and cooperation. Only through strategic coordination can the system reach a stable equilibrium and enable the large-scale diffusion of green production practices.
Also, as an innovative body of green fertilizer R&D, the model of STBs has an important interdisciplinary value for biopharmaceuticals, environmental governance, and other fields, which provides a practical model of “industry-university-research-application” close synergy for the biopharmaceutical industry; secondly, environmental governance experts can analyze the interaction law between policy tools and farmers’ environmental behavior in the promotion of green agricultural technology by means of the framework of the tripartite game in the S&T Academy, providing a micro-behavioral decision-making basis for the management of face source pollution. Secondly, environmental governance experts can analyze the interaction law of policy tools, corporate social responsibility, and farmers’ environmental protection behavior in the promotion of technology through the three-party game framework of the Science and Technology Courtyard, so as to provide a micro-behavioral decision-making basis for the management of surface pollution.
There are three main limitations in this study: first, in terms of research perspective, it only focuses on the direct impact of green fertilizers on agricultural production, but fails to systematically examine its comprehensive effect on the whole agricultural industry chain, and ignores horizontal industrial synergies; second, at the level of technological analysis, although it identifies technological barriers, it fails to adequately explain the dynamic mechanism of technological breakthroughs, the role of the main body of innovation, and the transmission mechanism of technological benefits, and the modeling of farmers’ adoption behaviors is too simplified, which fails to take into account the complexity of farmers’ cognition and decision-making in the real world; lastly, due to China’s significant region-al heterogeneity and the large differences in the level of economic development, resource endowment, and agro-ecological characteristics of different regions, the universality of the findings of this study is limited, especially in the eastern part of the country. In particular, it may be difficult to directly generalize the practical experience of the eastern region to other regions, which requires strengthening the validation of regional differentiation in subsequent studies to enhance the external validity of the conclusions.
Author Contributions
Conceptualization, Y.B.; methodology, Y.B.; software, J.L.; validation, J.L.; investigation, Y.B.; data curation, Y.W.; writing—original draft preparation; writing—review and editing, L.C.; supervision, J.L.; funding acquisition, Y.B. All authors have read and agreed to the published version of the manuscript.
Funding
This research was funded by the Zhejiang Province Soft Science Research Program in China, grant number 2025C25016.
Institutional Review Board Statement
Not applicable.
Informed Consent Statement
Not applicable.
Data Availability Statement
The data supporting the results of this study have been represented in articles as well as within the literature.
Acknowledgments
The project is grateful for the funding support from the Zhejiang Province Soft Science Research Program in China.
Conflicts of Interest
The authors declare no conflict of interest.
Abbreviations
The following abbreviations are used in this manuscript:
| STB | Science and Technology Backyard |
| R&D | Research and Development |
References
- Pretty, J.; Sutherland, W.J.; Ashby, J.; Auburn, J.; Baulcombe, D.; Bell, M.; Bentley, J.; Bickersteth, S.; Brown, K.; Burke, J.; et al. The top 100 questions of importance to the future of global agriculture. Int. J. Agric. Sustain. 2010, 8, 219–236. [Google Scholar] [CrossRef]
- Wang, S.W. The positive effect of green agriculture development on environmental optimization: Measurement and impact mechanism. Front. Environ. Sci. 2022, 10, 1035867. [Google Scholar] [CrossRef]
- Nowak, A.; Kasztelan, A. Economic competitiveness vs. green competitiveness of agriculture in the European Union countries. Oeconomia Copernic. 2022, 13, 379–405. [Google Scholar] [CrossRef]
- Wrzaszcz, W.; Prandecki, K. Agriculture and the european green deal. Zagadnienia Ekon. Rolnej 2020, 365, 156–179. [Google Scholar] [CrossRef]
- Phiri, R.; Rangappa, S.M.; Siengchin, S. Agro-waste for renewable and sustainable green production: A review. J. Clean. Prod. 2024, 434, 139989. [Google Scholar] [CrossRef]
- Li, X.F.; Du, J.G.; Li, W.; Shahzad, F. Green ambitions: A comprehensive model for enhanced traceability in agricultural product supply chain to ensure quality and safety. J. Clean. Prod. 2023, 420, 138397. [Google Scholar] [CrossRef]
- Zhang, H.X.; Feng, Y.; Jia, Y.X.; Liu, P.Q.; Hou, Y.; Shen, J.B.; Zhu, Q.C.; Zhang, F.S. China’s agriculture green development: From concept to actions. Front. Agric. Sci. Eng. 2024, 11, 20–34. [Google Scholar] [CrossRef]
- U.S.-China Economic and Security Review Commission. Outline of the 13th Five-Year Plan for National Economic and Social Development of the People’s Republic of China. Available online: https://www.gov.cn/xinwen/2016-03/17/content_5054992.htm (accessed on 4 March 2025).
- National Development and Reform Commission of the People’s Republic of China. Action Plan for Fertilizer Reduction by 2025. Available online: https://www.ndrc.gov.cn/fggz/jjmy/zyspqk/202212/t20221227_1344041.html (accessed on 4 March 2025).
- Government of the People’s Republic of China. Opinions on Comprehensively Promoting the Green Transformation of Economic and Social Development. Available online: https://www.gov.cn/gongbao/2024/issue_11546/202408/content_6970974.html (accessed on 31 July 2024).
- Central People’s Government of the People’s Republic of China. Notice from the General Office of the China Association for Science and Technology on Supporting the Construction of the Second Batch of STB and STB Clusters. Available online: https://www.gov.cn/zhengce/zhengceku/202404/content_6946764.htm (accessed on 31 July 2024).
- Ministry of Education of the People’s Republic of China. About Supporting the Construction of the Second Batch of Science and Technology Courtyards and Notification of the Cluster of Science and Technology Courtyards. Available online: http://www.moe.gov.cn/srcsite/A22/moe_826/202404/t20240415_1125626.html (accessed on 25 February 2025).
- Tian, S.; Xu, Y.; Wang, Q.S.; Zhang, Y.J.; Yuan, X.L.; Ma, Q.; Feng, X.F.; Ma, H.C.; Liu, J.X.; Liu, C.Q.; et al. The effect of optimizing chemical fertilizers consumption structure to promote environmental protection, crop yield and reduce greenhouse gases emission in China. Sci. Total Environ. 2023, 857, 159349. [Google Scholar] [CrossRef]
- Li, B.W.; Qian, Y.J.; Kong, F.B. Does Outsourcing Service Reduce the Excessive Use of Chemical Fertilizers in Rural China? The Moderating Effects of Farm Size and Plot Size. Agriculture 2023, 13, 1869. [Google Scholar] [CrossRef]
- Hu, L.X.; Zhang, X.H.; Zhou, Y.H. Farm size and fertilizer sustainable use: An empirical study in Jiangsu, China. J. Integr. Agric. 2019, 18, 2898–2909. [Google Scholar] [CrossRef]
- Liu, Y.; Lv, Z.; Hou, H.; Lan, X.; Ji, J.; Liu, X. Long-term effects of combination of organic and inorganic fertilizer on soil properties and microorganisms in a Quaternary Red Clay. PLoS ONE 2021, 16, 0261387. [Google Scholar] [CrossRef] [PubMed]
- Hou, Y.; Chen, X.P.; Oenema, O. Nutrient management in China at the crossroads. Nutr. Cycl. Agroecosyst. 2023, 127, 1–10. [Google Scholar] [CrossRef]
- Zhang, W.F.; Cao, G.X.; Li, X.L.; Zhang, H.Y.; Wang, C.; Liu, Q.Q.; Chen, X.P.; Cui, Z.L.; Shen, J.B.; Jiang, R.F.; et al. Closing yield gaps in China by empowering smallholder farmers. Nature 2016, 537, 671–674. [Google Scholar] [CrossRef] [PubMed]
- Zhang, T.Z. Agricultural socialized services can facilitate the rapid development of the Science and Technology Backyard. Front. Agric. Sci. Eng. 2024, 11, 210–212. [Google Scholar] [CrossRef]
- An, Z.C.; Yang, Y.; Yang, X.; Ma, W.Q.; Jiang, W.; Li, Y.J.; Chen, G.F.; Zhang, W.F.; Zhuang, M.H.; Wang, C.; et al. Promoting sustainable smallholder farming via multistakeholder collaboration. Proc. Natl. Acad. Sci. USA 2024, 121, 519121. [Google Scholar] [CrossRef]
- Wang, Y.L.; Yu, A.Z.; Shang, Y.P.; Wang, P.F.; Wang, F.; Yin, B.; Liu, Y.L.; Zhang, D.L.; Chai, Q. Research Progress on the Improvement of Farmland Soil Quality by Green Manure. Agriculture 2025, 15, 768. [Google Scholar] [CrossRef]
- Musana, B.S.; Nabahungu, N.L.; Bucagu, C.; Mukuralinda, A.; Barrios, E.; Rutebuka, J.; Nyaga, J.; Muthuri, C.W. Enhancing crop productivity and its economic farm profitabilty of smallholder farmer through the use of green manures from Alnus acuminata. Cabi Agric. Biosci. 2024, 5, 67. [Google Scholar] [CrossRef]
- Sarac, V.; Milic, D.; Vukelic, N.; Novakovic, T.; Novakovic, D.; Ljubojevic, M.; Rodic, V. Assessment of Beef Manure Economic Value by the Method of Equivalent Green and Mineral Fertilizer Substitution. Horticulturae 2024, 10, 125. [Google Scholar] [CrossRef]
- Zhang, M.; Fang, K.; Zhang, D.T.; Zeng, D.J. Relationship between the evaluation of agricultural scientific and technological innovation capacity and the influencing factors of green agriculture. PLoS ONE 2023, 18, 0295281. [Google Scholar] [CrossRef]
- Li, Z.Y.; Huang, H.; Duan, Z.P.; Zhang, W.F. Control temperature of greenhouse for higher yield and higher quality grapes production by combining STB in situ service with on time sensor monitoring. Heliyon 2023, 9, e13521. [Google Scholar] [CrossRef]
- Wang, M.Y.; Cheng, L.Y.; Huang, C.D.; Lyu, Y.; Zhang, L.; Lu, Z.Y.; Wei, C.Z.; Ma, W.Q.; Rengel, Z.; Shen, J.B.; et al. Green intelligent fertilizers-A novel approach for aligning sustainable agriculture with green development. Front. Agric. Sci. Eng. 2024, 11, 186–196. [Google Scholar] [CrossRef]
- Musajan, A.; Lin, Q.N.; Wei, D.W.; Mao, S.P. Unveiling the Mechanisms of Digital Technology in Driving Farmers’ Green Production Transformation: Evidence from China’s Watermelon and Muskmelon Sector. Foods 2024, 13, 3926. [Google Scholar] [CrossRef] [PubMed]
- Colaço, A.F.; Bramley, R.G.V. Do crop sensors promote improved nitrogen management in grain crops? Field Crops Res. 2018, 218, 126–140. [Google Scholar] [CrossRef]
- Leone, M.; Consales, M.; Passeggio, G.; Buontempo, S.; Zaraket, H.; Youssef, A.; Persiano, G.V.; Cutolo, A.; Cusano, A. Fiber optic soil water content sensor for precision farming. Opt. Laser Technol. 2022, 149, 107816. [Google Scholar] [CrossRef]
- Sutradhar, S.; Alam, N.; Christopher, L.P.; Fatehi, P. KOH catalyzed oxidation of kraft lignin to produce green fertilizer. Catal. Today 2022, 404, 49–62. [Google Scholar] [CrossRef]
- Lin, J.R.; Wang, Y.D.; Pan, Y.M.; Wang, S.F.; Zhao, X.M.; Qu, S.; She, Z.B.; Cao, K.A.; Yuan, Z.D.; Ma, X.; et al. Arsenic effects and behavior during the transformation of struvite to newberyite: Implications for applications of green fertilizers. Chem. Eng. J. 2023, 458, 141396. [Google Scholar] [CrossRef]
- Faria, J.A. Renaissance of ammonia synthesis for sustainable production of energy and fertilizers. Curr. Opin. Green Sustain. Chem. 2021, 29, 100466. [Google Scholar] [CrossRef]
- Jayne, T.S.; Rashid, S. Input subsidy programs in sub-Saharan Africa: A synthesis of recent evidence. Agric. Econ. 2013, 44, 547–562. [Google Scholar] [CrossRef]
- Zhang, D.L.; Dong, F.; Li, Z.C.; Xu, S.L. How Can Farmers’ Green Production Behavior Be Promoted? A Literature Review of Drivers and Incentives for Behavioral Change. Agriculture 2025, 15, 744. [Google Scholar] [CrossRef]
- Yadav, R.L.; Dwivedi, B.S.; Pandey, P.S. Rice-wheat cropping system: Assessment of sustainability under green manuring and chemical fertilizer inputs. Field Crops Res. 2000, 65, 15–30. [Google Scholar] [CrossRef]
- Wu, L.Q.; Yan, X.J.; Huang, J.Y.; Xu, X.Z.; Zhang, S.W.; Cui, S.L.; Chen, X.H.; Zeng, Z.X.; Huang, S.Y.; Zeng, Y.Z.; et al. Towards sustainable fruit production: Identifying challenges and optimization strategies. Agric. Syst. 2024, 221, 104132. [Google Scholar] [CrossRef]
- Xiong, Q.Z.; Wang, S.J.; Lu, X.W.; Xu, Y.T.; Zhang, L.; Chen, X.H.; Xu, G.; Tian, D.; Zhang, L.G.; Jing, J.Y.; et al. The Effective Combination of Humic Acid Phosphate Fertilizer Regulating the Form Transformation of Phosphorus and the Chemical and Microbial Mechanism of Its Phosphorus Availability. Agronomy 2023, 13, 1581. [Google Scholar] [CrossRef]
- Dahlin, J.; Halbherr, V.; Kurz, P.; Nelles, M.; Herbes, C. Marketing Green Fertilizers: Insights into Consumer Preferences. Sustainability 2016, 8, 169. [Google Scholar] [CrossRef]
- Guo, Y.; Li, R.; Ning, P.; Jiao, X.Q. A way to sustainable crop production through scientist-farmer engagement. Front. Agric. Sci. Eng. 2022, 9, 577–587. [Google Scholar] [CrossRef]
- Slobodkin, L.B.; Rapoport, A. An optimal strategy of evolution. Q. Rev. Biol. 1974, 49, 181–200. [Google Scholar] [CrossRef]
- Fefferman, N.H.; Starks, P.T. A modeling approach to swarming in honey bees (Apis mellifera). Insectes Sociaux 2006, 53, 37–45. [Google Scholar] [CrossRef]
- Cheikbossian, G. The evolutionary stability of in-group altruism in productive and destructive group contests. J. Econ. Behav. Organ. 2021, 188, 236–252. [Google Scholar] [CrossRef]
- Nowak, M. An evolutionary stable strategy may be inaccessible. J. Theor. Biol. 1990, 142, 237–242. [Google Scholar] [CrossRef]
- Mihailovs, N.; Cakula, S. Dynamic System Sustainability Simulation Modelling. Balt. J. Mod. Comput. 2020, 8, 192–201. [Google Scholar] [CrossRef]
- Lindgren, U.; Elmquist, H. Environmental and economic impacts of decision-making at an Arable farm: An integrative modeling approach. Ambio 2005, 34, 393–401. [Google Scholar] [CrossRef]
- Bourgeois, C.; Jayet, P.A. Regulation of relationships between heterogeneous farmers and an aquifer accounting for lag effects. Aust. J. Agric. Resour. Econ. 2016, 60, 39–59. [Google Scholar] [CrossRef]
- Ding, X.D. Innovation and technology transfer in Chinese agriculture. J. Small Bus. Enterp. Dev. 2006, 13, 242–247. [Google Scholar] [CrossRef]
- An, J.; He, G.Q.; Ge, S.L.; Wu, S.S. The impact of government green subsidies on corporate green innovation. Financ. Res. Lett. 2025, 71, 106378. [Google Scholar] [CrossRef]
- Schwardmann, P.; van der Weele, J. Deception and self-deception. Nat. Hum. Behav. 2019, 3, 1055–1061. [Google Scholar] [CrossRef]
- Tunkel, S.; Herbold, S. Exploring the relationship between performance metrics and cost saving potential of defect prediction models. Empir. Softw. Eng. 2022, 27, 182. Available online: https://link.springer.com/article/10.1007/s10664-022-10224-4 (accessed on 25 February 2025). [CrossRef]
- Gan, Z.; Xin, Z.; Ming, D.; Jia, K.; Zheng, P.; Fang, W.; Zhou, W.-C. Research on the yield increasing effect and mechanism of green intelligent fertilizer on rice. Soils Fertil. Sci. China 2024, 128–136. Available online: http://chinatrfl.alljournal.net.cn/zgtryfl/article/html/20240814?st=article_issue (accessed on 25 February 2025).
- National Bureau of Statistics of China. 2023 Fertilizer Application Rates. Available online: https://data.stats.gov.cn/easyquery.htm?cn=C01&zb=A0D06&sj=2023 (accessed on 25 February 2025).
- Wu, P.; Chang, Y.; Chen, G. The Impact of Technology Innovation on the Middle-Income Group: Heterogeneity of Technological Originality or Introduction Re-Innovation. Available online: https://qks.sufe.edu.cn/mv_html/j00001/201807/6b5a1911-5d74-415d-a812-305ae793a1e3_WEB.htm (accessed on 6 March 2025).
- China Rural Professional and Technical Association. Management Measures for Evaluation of Science and Technology Institutes. Available online: https://kjc.syau.edu.cn/info/1399/11907.htm (accessed on 25 February 2025).
- Central People’s Government of the People’s Republic of China. Report on the Execution of the Central and Local Budgets in 2024 and the Draft Central and Local Budgets for 2025. Available online: https://www.gov.cn/yaowen/liebiao/202503/content_7010832.htm (accessed on 6 March 2025).
- Ministry of Agriculture and Rural Affairs of the People’s Republic of China. Notice on Carrying Out the Pilot Work of Green Planting and Breeding Circular Agriculture. Available online: http://www.zzys.moa.gov.cn/gzdt/202105/t20210526_6368443.htm (accessed on 26 May 2021).
- Borisov, P.; Kolaj, R.; Yancheva, C.; Yancheva, S. Influence of the common agricultural policy on Bulgarian agriculture. Bulg. J. Agric. Sci. 2019, 25, 439–447. [Google Scholar]
- Cofas, E.; Ursu, A. The analyse of value structure of agricultural production for conventional agriculture. Sci. Pap.-Ser. Manag. Econ. Eng. Agric. Rural Dev. 2016, 16, 109–114. [Google Scholar]
- Barbier, E.B. Greening agriculture for rural development. World Dev. 2025, 191, 106974. [Google Scholar] [CrossRef]
- Ul Haq, S.; Boz, I.; Shahbaz, P.; Yildirim, Ç. Evaluating eco-efficiency and optimal levels of fertilizer use based on the social cost and social benefits in tea production. Environ. Sci. Pollut. Res. 2020, 27, 33008–33019. [Google Scholar] [CrossRef]
- Qin, G.; Chen, X.; Sun, M.; Zhou, X.Y.; Du, J.F. Appropriate quantization of asymmetric games with continuous strategies. Phys. Lett. A. 2005, 340, 78–86. [Google Scholar] [CrossRef]
- Fan, P.F.; Mishra, A.K.; Feng, S.Y.; Su, M.; Hirsch, S. The impact of China’s new agricultural subsidy policy on grain crop acreage. Food Policy 2023, 118, 102472. [Google Scholar] [CrossRef]
- Luo, C.Y.; Chen, L.; Zhao, H.; Guo, S.Y.; Wang, G.S. Challenges facing socioeconomic development as a result of China’s environmental problems, and future prospects. Ecol. Eng. 2013, 60, 199–203. [Google Scholar] [CrossRef]
- Zhang, Y.C. A path to sustainable development of agri-industries: Analysis of agriculture 5.0 versus industry 5.0 using stakeholder theory with moderation of environmental policy. Sustain. Dev. 2024, 32, 4829–4843. [Google Scholar] [CrossRef]
- Li, Y.Y.; Sun, J.N.; Chen, J.; Li, J.L.; Sun, L.; Cao, K.W. How to Promote the Development of Cultural and Creative Industries from an Evolutionary Game Perspective: Policy Mechanisms for Certification plus Incentives. Sustainability 2024, 16, 4440. [Google Scholar] [CrossRef]
- Zhang, F.; Bei, J.D.; Shi, Q.Z.; Wang, Y.; Wu, L. Research on Agricultural Machinery Services for the Purpose of Promoting Conservation Agriculture: An Evolutionary Game Analysis Involving Farmers, Agricultural Machinery Service Organizations and Governments. Agriculture 2024, 14, 1383. [Google Scholar] [CrossRef]
- Bellon-Maurel, V.; Piot-Lepetit, I.; Lachia, N.; Tisseyre, B. Digital agriculture in Europe and in France: Which organisations can boost adoption levels? Crop Pasture Sci. 2023, 74, 573–585. [Google Scholar] [CrossRef]
- Goldsmith, P. The Global View: Issues Affecting US Production Agriculture. J. Agromed. 2010, 15, 184–191. [Google Scholar] [CrossRef]
- Uddin, M.K.; Saha, B.K.; Wong, V.N.L.; Patti, A.F. Organo-mineral fertilizer to sustain soil health and crop yield for reducing environmental impact: A comprehensive review. Eur. J. Agron. 2025, 162, 127433. [Google Scholar] [CrossRef]
- Kurniawati, A.; Stankovics, P.; Hilmi, Y.S.; Toth, G.; Smol, M.; Toth, Z. Understanding the future of bio-based Fertilizerfertilizers: The EU’s policy and implementation. Sustain. Chem. Clim. Action 2023, 3, 100033. [Google Scholar] [CrossRef]
- Institute of Applied Ecology, Chinese Academy Sciences. Focus on the Innovation and Application of Green Fertilizers. Available online: https://iae.cas.cn/gb2019/xwzx_156509/ttxw_156510/202409/t20240908_7341196.html (accessed on 26 February 2025).
- Xu, J.B.; Wang, T.Y.; Wang, J.J.; Li, C.X.; Zhao, L.M. “Forced Transformation” or “Regulation Capture”-Research on the Interactive Mechanism between Environmental Regulation and Green Transformation of Dairy Farming Subject Production. Int. J. Environ. Res. Public Health 2022, 19, 12982. [Google Scholar] [CrossRef]
- Adam, J.; Messely, L.; Prové, C.; Sanders, A. Wellbeing and collective grievances among farmers: The case of Flanders, Belgium. J. Rural Stud. 2024, 108, 103278. [Google Scholar] [CrossRef]
- Wan, M.; Kuang, H.B.; Yang, Y.B.; He, B.; Zhao, S.; Wang, Y.; Huo, J.Y. Evaluation of Agricultural Green Development Based on Gini Coefficient and Hesitation Fuzzy Multi-Attribute Decision-Making: The Case of China. Agriculture 2023, 13, 699. [Google Scholar] [CrossRef]
- Li, J.H.; Leeuwis, C.; Heerink, N.; Zhang, W.F. The Science and Technology Backyard as a Local Level Innovation Intermediary in RuraL China. Front. Agric. Sci. Eng. 2022, 9, 558–576. [Google Scholar] [CrossRef]
- Sadras, V.; Alston, J.; Aphalo, P.; Connor, D.; Denison, R.F.; Fischer, T.; Gray, R.; Hayman, P.; Kirkegaard, J.; Kirchmann, H.; et al. Making science more effective for agriculture. In Advances in Agronomy; Sparks, D.L., Ed.; Elsevier: Amsterdam, The Netherlands, 2020; Volume 163, pp. 153–177. [Google Scholar]
- Sanders, R. A market road to sustainable agriculture? Ecological agriculture, green food and organic agriculture in China. Dev. Chang. 2006, 37, 201–226. [Google Scholar] [CrossRef]
- Barbosa, M.W. Government Support Mechanisms for Sustainable Agriculture: A Systematic Literature Review and Future Research Agenda. Sustainability 2024, 16, 2185. [Google Scholar] [CrossRef]
- Altieri, M.A. Linking ecologists and traditional farmers in the search for sustainable agriculture. Front. Ecol. Environ. 2004, 2, 35–42. [Google Scholar] [CrossRef]
Disclaimer/Publisher’s Note: The statements, opinions and data contained in all publications are solely those of the individual author(s) and contributor(s) and not of MDPI and/or the editor(s). MDPI and/or the editor(s) disclaim responsibility for any injury to people or property resulting from any ideas, methods, instructions or products referred to in the content. |
© 2025 by the authors. Licensee MDPI, Basel, Switzerland. This article is an open access article distributed under the terms and conditions of the Creative Commons Attribution (CC BY) license (https://creativecommons.org/licenses/by/4.0/).