Article

Multi-Objective Optimization for Intermodal Freight Transportation Planning: A Sustainable Service Network Design Approach

by
Alexander Chupin
1,*,
Abdelaal Ahmed Mostafa Ahmed Ragas
2,
Marina Bolsunovskaya
3,
Alexander Leksashov
3 and
Svetlana Shirokova
4
1
Department of International Economic Relations, Peoples’ Friendship University of Russia (RUDN University), 6 Miklukho-Maklaya Street, 117198 Moscow, Russia
2
Accounting and Finance Department, United Arab Emirates University (UAE), Al Ain P.O. Box 15551, United Arab Emirates
3
Graduate School of Intelligent Systems and Supercomputing Technologies, Peter the Great St. Petersburg Polytechnic University (SPbPU), 29 Polytechnicheskaya Street, 195251 St. Petersburg, Russia
4
Graduate School of Business Engineering, Peter the Great St. Petersburg Polytechnic University (SPbPU), 29 Polytechnicheskaya Street, 195251 St. Petersburg, Russia
*
Author to whom correspondence should be addressed.
Sustainability 2025, 17(12), 5541; https://doi.org/10.3390/su17125541
Submission received: 25 March 2025 / Revised: 31 May 2025 / Accepted: 9 June 2025 / Published: 16 June 2025
(This article belongs to the Special Issue Large-Scale Production Systems: Sustainable Manufacturing and Service)

Abstract

:
Modern logistics requires effective solutions for the optimization of intermodal transportation, providing cost reduction and improvement of transport flows. This paper proposes a multi-objective optimization method for intermodal freight transportation planning within the framework of sustainable service network design. The approach aims to balance economic efficiency and environmental sustainability by minimizing both transportation costs and delivery time. A bi-criteria mathematical model is developed and solved using the Non-dominated Sorting Genetic Algorithm III (NSGA-III), which is well-suited for handling complex, large-scale optimization problems under multiple constraints. The aim of the study is to develop and implement this technology that balances economic efficiency, environmental sustainability and manageability of operational processes. The research includes the development of a two-criteria model that takes into account both temporal and economic parameters of the routes. The optimization method employs the NSGA-III, a well-known metaheuristic that generates a diverse set of near-optimal Pareto-efficient solutions. This enables the selection of trade-off alternatives depending on the decision-maker’s preferences and specific operational constraints. Simulation results show that the implementation of the proposed technology can reduce the costs of intermodal operators by an average of 8% and the duration of transportation by up to 50% compared to traditional planning methods. In addition, the automation of the process contributes to a more rational use of resources, reducing carbon emissions and increasing the sustainability of transportation networks. This approach is in line with the principles of sustainable economic development, as it improves the efficiency of logistics operations, reduces pressure on infrastructure and minimizes the environmental impact of the transport sector. Route optimization and digitalization of transport processes can increase resource efficiency, improve freight flow management and contribute to the long-term stability of transport systems. The developed technology of automated planning of intermodal transportation is oriented to application in large-scale production systems, providing effective management of cargo flows within complex logistics chains. The proposed method supports the principles of sustainable development by providing a formal decision-making framework that balances transportation cost, delivery time and environmental objectives. Instead of optimizing for a single goal, the model enables the identification of efficient trade-offs between economic performance and ecological impact. Moreover, by generating multiple routing scenarios under varying operational constraints, the approach enhances the adaptability and robustness of freight transportation systems in dynamic and uncertain environments.

1. Introduction

The economic growth and sustainable development of a country are closely linked to the efficiency of its logistics sector. Freight transportation relies on various modes, including road, rail, air and sea, with road transport accounting for 60% of global freight turnover [1]. However, its prevalence contributes significantly to negative externalities such as carbon emissions, noise pollution, traffic congestion and accidents [2], posing challenges to environmental sustainability. Recognizing these issues, the European Commission (2015) emphasized the need to transition towards more sustainable freight transport solutions, particularly rail and intermodal rail transport (IRR). This shift is not only essential for reducing the ecological footprint of logistics but also plays a crucial role in the broader strategy for decarbonizing the transport sector and achieving long-term sustainability goals [3,4].
The organization of intermodal transport of goods is one of the main directions of modern European transport policy for sustainable development. International practice shows that in recent years, two-thirds of international freight transportation has been carried out in door-to-door intermodal traffic. In European countries, due to legislative restrictions on the passage of trucks, combined transportation is widely used, which is more environmentally friendly and has less impact on the roadway [5,6].
An important component of this area is its impact on sustainable economic development, which is directly related to the achievement of the Sustainable Development Goals (SDGs) set by the United Nations. Thus, Automated Intermodal Transportation Planning Technologies are central to the process of achieving sustainable economic development, which is closely linked to the implementation of the Sustainable Development Goals (SDGs) set by the United Nations. They significantly reduce production costs, increase labor productivity and create new jobs in related sectors of the economy, which is fully in line with SDG #8 (decent work and economic growth). These technologies ensure efficient use of resources and routes, minimizing the carbon footprint and contributing to SDG 13 (combating climate change) and SDG 12 (responsible consumption and production) [7,8,9,10]. In addition, the introduction of automated systems significantly improves the integration and coordination of different actors in logistics processes, leading to a sustainable transport infrastructure in line with SDG 9 (industrialization, innovation and infrastructure). These systems are highly adaptable to fluctuations in market demand and external conditions, strengthening regional economies and increasing access to international markets.
Thus, transport logistics automation is becoming a key element in achieving global sustainable development goals by providing tools for efficient and environmentally friendly supply chain management.
In this context, special attention is paid to the implementation of international initiatives, such as the European Transport Policy, aimed at creating a system that enhances economic progress and competitiveness. Currently, the European Transport Policy under the flagship initiative “An efficient Europe in terms of resource use” aims to create a system that supports European economic progress, with the aim of increasing competitiveness, providing a high-quality mobility service while ensuring a more efficient use of resources through intermodal transport [11,12].
To eliminate the existing obstacles to the introduction of multimodal transportation of goods in Europe, it is necessary to implement reforms aimed at increasing the level of competitiveness of rail transportation, door-to-door delivery of goods, simplification of border crossing procedures, expansion of the customer base and the issues of technical compatibility of wagons when crossing state borders remain unresolved.
The experience of a number of countries proves the economic efficiency of the intermodal transportation of goods. It is noted that such transportation provides door-to-door delivery of goods, but their main disadvantage is a large time frame for loading and dispatch of cargo, and the apparatus of mathematical justification of such transportation technology has not been fully investigated.
Recent developments in international rail freight transportation have shown a growing adoption of specialized rolling stock and increased reliance on intermodal and containerized logistics solutions. These trends are particularly evident in long-distance and cross-border transport, where operational efficiency and modal integration are critical [13]. Intermodal transportation, as world experience shows, is undoubtedly one of the most promising areas for expanding the range of transportation services. Intermodal transportation is a system of cargo movement using several modes of transport, such as rail, road, sea and aviation, which ensures the consistency of all stages of delivery. Their main advantage is the possibility of combining vehicles to achieve a balance among cost, speed and environmental sustainability of transportation. However, the complexity of coordination between the participants of the transportation process and the high requirements for planning accuracy requires the introduction of innovative solutions based on modern information and analytical technologies.
The automation of planning processes in intermodal transportation allows a reduction in the influence of the human factor, ensuring the processing of large amounts of data in real time, which becomes especially important in an unstable market environment. The use of artificial intelligence, machine learning and mathematical modeling opens up new perspectives for developing optimal routes, demand forecasting and resource management.
At the same time, large-scale transport logistics systems play an important role in integrating and coordinating the different phases of transportation. These systems integrate infrastructure facilities, information platforms and logistics processes to form a complex network that can adapt to changing conditions and needs. The effective functioning of such systems requires integrated digital solutions capable of providing real-time data analysis, risk prediction and resource optimization scenarios. The inclusion of large-scale systems in the automated planning process allows us to take into account not only local but also global aspects of logistics, increasing the sustainability and competitiveness of transportation networks.
Most studies of intermodal transportation are reduced to the minimization of operating costs, but in modern conditions, a significant number of cargo owners require acceleration of delivery and minimization of operating costs from the carrier [14,15,16]. Thus, there is a need to solve the scientific problem of improving the technology of intermodal transportation by two criteria (operating costs and delivery time), which are different in nature—which, as input data, require predicting the traffic load of the elements of the transportation system.
In present-day realization, in the competition between modes of transportation, preference is given to the mode of transportation, the quality of which is higher [14,17]. To objectively assess the quality of services of different types of transport, theoretical qualimetry methods are used—a scientific field that combines quantitative methods of quality assessment, which are used to justify decisions made in product quality management and standardization. At the same time, the diversity of transportation means does not allow for a comprehensive assessment of their properties. Different types of transportation have a different range of technical characteristics. Therefore, there is a need to use a comprehensive indicator of vehicle quality.
The scientific novelty of the work consists of the development of automated technology for planning intermodal transportation using the genetic algorithm NSGA-III, forming a set of Pareto-optimal solutions. The developed model for forecasting the load of transport nodes increases the accuracy of calculations and minimizes the risks of downtime. The integration of automated data analysis into the route selection process ensures that not only the current network conditions are taken into account but also the forecasting of possible changes. The application of digitalization technology and integration of information platforms increase the flexibility of logistics operations.
Thus, automation of transport logistics becomes a key element of sustainable development, providing tools for efficient and environmentally friendly management of logistics chains. The developed method allows not only optimizing routes but also adapting logistics processes to dynamic changes in market demand and transport infrastructure, increasing their sustainability and competitiveness.
This study is organized as follows: Section 1 is the introduction. Section 2 presents the literature review. The model construction and research methods are presented in Section 3. An empirical case is presented in Section 4. A discussion of the results of this study is presented in Section 5. The conclusions of the study are presented in Section 6.

2. Literature Review

This section presents an analysis of existing research on the technology of intermodal container transportation.
In current freight transportation practice, the selection of the transport mode is increasingly guided by qualitative factors such as reliability, lead time, service frequency and flexibility rather than by cost alone. This shift reflects evolving expectations from shippers who operate in time-sensitive and demand-volatile markets. Especially in intermodal logistics, decision-making processes prioritize responsiveness and predictability, which are crucial for competitive supply chains. Recent research confirms that service quality often outweighs cost as a decisive criterion in mode selection, particularly for high-value or perishable goods, just-in-time logistics and complex transnational corridors [12,13,14,15,16].
Following [12], to ensure the seamless operation of the transport system, the intermodal transport sector is defined by several decision-makers who must collaborate.
Automation of intermodal transport planning plays a key role in the development of modern logistics systems, ensuring efficient interaction between different modes of transport and minimizing costs. In recent years, research in this area has focused on improving the resilience of transport networks, route optimization, the use of digital technologies and information systems and the impact of intermodal transport on sustainable development goals.
The digitalization of intermodal transport is a growing area of research with significant implications for efficiency and sustainability. Recent studies indicate the adoption of technologies such as wireless communications, sensors and web-based platforms in intermodal freight transportation worldwide, with potential applications in low-income countries [13]. Research focuses on three main areas: basic principles, operational excellence and systems modeling [14]. Progress in intermodal transportation is driven by technological innovation, policy frameworks and stakeholder views, highlighting the importance of digitalization, automation and data analytics to optimize supply chain operations [15]. Integrating these digital trends into logistics presents both challenges and opportunities for improving the efficiency and sustainability of freight transportation networks [16]. Overall, the digitalization of intermodal transportation is changing the logistics landscape, promising more connected, efficient and sustainable global supply chains.
Intermodal transport is increasingly recognized as a key strategy for achieving sustainable development in the transport sector. Compared to single-modal transport, it provides economic benefits, reduces environmental impact and improves resource efficiency [17,18]. The European Union is promoting intermodal and comodal transportation to address issues such as pollution, congestion and energy consumption [19]. However, the implementation of intermodal solutions faces challenges, including the need to establish appropriate infrastructure and decision-making processes [20]. While traditional transportation mode choices have focused on utility and economic efficiency, environmental sustainability has become increasingly important in these decisions [21]. To realize the full potential of intermodal transportation, new approaches to policy development and public participation are needed, as well as investments in intermodal transfer terminals and supporting infrastructure [22,23].
Today’s intermodal freight transportation networks (IFTNs) provide cost-effective and safe transportation of goods but are subject to various disruptions, including natural disasters, infrastructure problems and pandemics. Wei et al. (2024) [21] propose a two-stage robust optimization aimed at minimizing the negative consequences of such failures. Their models allow us to assess network vulnerability, predict the impact of potential disruptions and develop strategies to avoid them. This approach demonstrates its effectiveness in analyzing real international transportation systems, improving their resilience and adaptability to external influences.
Increasing the share of intermodal transportation is an important challenge that is being addressed at the state level as part of sustainable development strategies. Mohri and Thompson (2022) [22] studied the impact of tariff subsidy policies on rail transportation and proved that targeted discounts on rail tariffs can significantly increase the attractiveness of intermodal routes at no significant cost to the government. The approach proposed by the authors focuses on redistributing freight flows in favor of more environmentally friendly modes of transport, which reduces the carbon footprint and promotes the development of transport infrastructure. Given the growing volume of freight traffic, route optimization is an important area of research. Bei et al. (2024) [23] developed a multi-criteria route selection model for perishable goods that takes into account three key parameters: transportation costs, carbon emissions and customer satisfaction. Their algorithm, based on the particle swarm method (PSO), has been shown to be highly effective in finding optimal solutions and minimizing the loss of product quality during transportation.
Other studies look at the application of machine learning to predict CO2 emissions and optimize logistics routes. Temizceri and Kara (2024) [20] developed a model using linear regression, decision trees and random forest methods to estimate emissions and create more sustainable transportation plans. These studies highlight the importance of using advanced analytical tools in transportation logistics management. The introduction of digital technologies into the logistics industry is helping to increase process transparency and improve coordination among intermodal transportation stakeholders. Meyer-Hollatz et al. (2024) [24] studied the requirements for information platforms that seamlessly integrate different transportation systems. Their study showed that efficient digital solutions can significantly reduce delays, improve planning accuracy and minimize operational risks. The development of such systems is becoming a necessity for the modern logistics sector.
The transition from road freight transport to intermodal rail routes has a positive impact on the environment and energy efficiency of transportation systems. Gandhi et al. (2024) [13] revealed that the use of rail transport reduces pollutant emissions by 77.4%, increases fuel efficiency by 43.5% and reduces transportation costs compared to road transportation. This emphasizes the importance of developing intermodal logistics as part of a sustainable development strategy. In a recent study, Weng et al. (2024) [25] proposed the integration of transport and energy systems within the concept of “smart cities”, which allows for more environmentally friendly and efficient transportation. They emphasize that digitalization and automation of processes are an integral part of modernizing transport logistics and increasing its sustainability.

3. Model Construction

Containerized transportation plays a pivotal role in intermodal logistics and international trade. Intermodal transport involves the integration of two or more modes of transportation, with a key distinguishing feature being that the cargo remains within the same transport unit, such as a container, throughout the entire journey. This process is managed under a single transport document and supervised by a unified operator. Under these conditions, shippers are relieved from the need to negotiate separate contracts with different transport companies or oversee complex logistical processes, such as container reloading and schedule coordination. The seamless nature of intermodal transport enhances its attractiveness, ensuring a steady influx of new customers. Furthermore, operators manage customs procedures at international borders, further simplifying the shipping process and reinforcing the efficiency of this transportation model.
Intermodal transportation is also a lifeline for the railway industry of the Russian Federation, as several international transport corridors pass through its territory. However, in order to increase the competitiveness and attractiveness of intermodal transportation, it is necessary to make it as convenient as possible for customers by bringing them as close as possible to the planning process. One of the primary tasks is the operational planning of transportation, as a result of the solution of which the route will be determined, taking into account not only the length of segments corresponding to different modes of transport but also the time factor. The main objective of the proposed approach is to ensure an increase in the accuracy of delay time accounting during the transfer of cargo from one transport enterprise to another and to ensure the possibility of simultaneous consideration of customer requirements regarding the cost of transportation and delivery time.

3.1. Sets

N —set of nodes in the transportation network (terminals, hubs, ports, etc.).
A N × N —set of arcs representing possible transportation links between nodes.

3.2. Parameters

d i j —distance of arc i , j [km].
c i j —transportation cost per TEU on arc i , j [USD/TEU].
v i j —transfer or handling time at node i before proceeding to arc i , j [h].
c a p i j —available container capacity on arc i , j [TEU].
s i —service or processing time at node i [h].
w i —warehouse storage cost at node i [USD/TEU/h].

3.3. Decision Variables

x i j 0 ,   1 1 if arc i , j is selected for transportation, 0 otherwise.
t i 0 —arrival time at node i [h].

3.4. Objective Functions

The model simultaneously optimizes two conflicting objectives:
  • Transportation cost minimization:
min C o s t = ( i , j ) A c i j x i j
  • Delivery time minimization:
min T i m e = i , j A d i j v i j + t i j x i j
A Pareto-optimal set of solutions is generated to balance between these two objectives.

3.5. Objective Functions

  • Flow conservation:
j : i , j A x i j j : i , j A x i i = 1 ,   i f   i = s o u r c e   n o d e , 1 ,   i f   i = d e s t i n a t i o n   n o d e , 0 ,   o t h e r w i s e .
  • Time update constraints:
t j t i + d i j v i j + t i j ( i , j ) A   such   that   x i j = 1
  • Capacity constraints (if applicable):
Demand c a p i j ( i , j ) A   such   that   x i j = 1
  • Binary decision variables:
x i j 0 ,   1 ( i , j ) A .
The mathematical model for determining the optimal route of intermodal container transportation is presented in the form of two target functions.
One of the criteria for planning intermodal transportation is its cost. It is reasonable to form the target function in the form of costs per container:
C X , t 0 = ( e z + n i = 1 # X ( L x i e x i + e x i z 1 + e x i z 2 + θ ( m x i m x i + 1 ) ( e S x i k i n c , e S x i + 1 p o c h + e S x i + 1 p o c h s k l + χ e S x i + 1 p o c h o x τ S x i k i n c , S x i + 1 p o c h n e p t 0 ) ) / n m i n
where X —an ordered variable vector (set) of arc numbers corresponding to the cargo movement route in the graph;
e z —expenses for execution of transportation documents;
n —cargo shipment volume, reduced to TEU;
# X —power of the set of elements of the variable vector X ;
L x i —length of the route segment corresponding to the i-th element of the set x ;
e x i —unit cost of moving the container on the section corresponding to the arc x i ;
e x i 1 —additional arc costs x i related to the cargo (charges for additional fastening, overloading, etc.);
e x i 2 —additional arc costs x i related to the specifics of vehicle promotion;
e S x i k i n c , —unit costs associated with unloading a container at the end terminal of the arc x i displacement and load at the arc terminal x i + 1 ;
e S x i + 1 p o c h s k l —cost of storage at the terminal warehouse located at the initial vertex of the arc x i + 1 during load standby;
e S x i + 1 p o c h o x —unit cost of guarding a container at the terminal warehouse, which is located at the initial vertex of the arc x i + 1 during load standby;
χ —a Boolean variable that takes the value 1 if guarding is required and 0 otherwise;
m x i —mode of transportation on the arc x i ;
τ S x i 2 , S x i + 1 1 n e p ( t 0 ) —time interval of delay at transition between arcs x i and x i + 1 (when changing from one mode of transport to another or performing operations with trains at railway stations, customs operations, etc.), which depends on the moment of the start of route implementation t 0 .
θ ( x ) —Heaviside function,
θ x = 0 , x 0 1 , x > 0 .
Another important criterion is the time of cargo delivery. It can be represented as the following target function:
T X , t 0 = i = 1 # X ( L x i V x i k x i z a m t 0 + τ S x i 2 , S x i + 1 1 n e p ( t 0 ) ) m i n
where V x i —average speed of movement along the arc x i ;
k x i z a m t 0 —delay coefficient for moving along the arc x i , which depends on the moment of the start of route realization t 0 .
In addition, in order to obtain an adequate solution, certain constraints are imposed on the control variables of the model:
t l m t 0 t p m S x i k i n c = S x i + 1 p o c h ,   i = 1,2 , ,   X S x 1 p o c h = S p o c h S x # X k i n c = S k i n c n w x i t 0 ,   i = 1,2 , , # # X   ,
where t l m and t p m —left and right boundaries of the interval of possible start of route realization, determined by the consignor;
S p o c h and S k i n c —numbers of nodes of the transportation network graph, which correspond to the start and end points of the route, respectively;
S x i k i n c and S x i + 1 p o c h —number of the end vertex of the arc x i and number of the start vertex of the arc x i + 1 accordingly;
S x 1 p o c h and S x # X k i n c —number of the initial vertex of the first arc of the route and number of the final vertex of the last arc of the route, accordingly;
w x i t 0 —the number of available container slots (slots on board the container ship or fitting platforms for loading containers) at the time of the beginning of cargo movement along the arc x i , depending on the moment of the start of route implementation t 0 .
The first constraint ensures the search for a solution whose start moment of route realization is within a certain time interval, which corresponds to the shipper’s conditions. The second constraint ensures the integrity of the route by controlling the coincidence of the end vertex of the previous arc and the start vertex of the next arc. The third and fourth constraints ensure that only those route options are selected that connect the vertices of the transportation network defined by the shipper as the start and end points of the shipment. The fifth constraint ensures that only those routes are selected that provide sufficient free container space to ensure that the shipment can be moved in its entirety along all sections of the route.
Thus, the formulated optimization model represents a bi-objective Mixed-Integer Linear Programming (Bi-MILP) problem, where binary decision variables are used to select transportation arcs, and the objectives of cost minimization and delivery time minimization are both linear functions of the decision variables.
The solution to vector optimization problems is not only conceptually but also technically more complex than problems that use only one criterion. The conceptual complexity lies in the fact that, in general, there is no single solution that would simultaneously satisfy the minima for all criteria. Thus, a solution to a problem can only be a compromise solution, i.e., one that satisfies certain requirements or ratios between criteria or seeks a certain level of balance.
Consequently, there exists a whole set of “best” solutions, which is called the Pareto set or Pareto-front. The first step in solving such a problem is to find the set of solutions corresponding to the Pareto-front over the entire domain of possible solutions. This is the technical difficulty of solving this problem because the search for the set of Pareto-front points can, in turn, represent a significant computational complexity, which can increase at a more than exponential rate compared to the linear rate of increase in the dimensionality of the problem.
In order to overcome these difficulties, a special heuristic optimization algorithm, NSGA-III, is proposed. This algorithm belongs to the class of genetic algorithms, i.e., algorithms based on the principles of conservation and improvement of the gene pool in living nature. This algorithm was specially developed for solving multi-objective optimization problems. It was created as a result of further development of the NSGA-II algorithm, and its main difference is a new mechanism for controlling the local crowding of the Pareto-front set; namely, the estimation of the crowding distance was replaced by the density estimation, which is determined using reference points.
In the first step of the algorithm, initialization of the initial population of solutions takes place P = x i i = 1 N , as well as sets of reference points R = r i i = 1 N . Each individual in the population is a vector of variables, which, in genetic algorithm terminology, is called a “chromosome”, and an element of the vector is called a “gene”. Each gene contains the number of arcs in the graph chosen to construct the route. The last gene of the chromosome contains the start time of the transportation.
In the second step of the algorithm, based on the current “parent” population, the next population of “descendants” is generated using genetic operations such as crossing and mutation.
In the third step, non-dominated sorting of the aggregate set of solutions is applied P Q with separation of g non-dominated decision fronts from it F 1 , F 2 , , F g .
In step four, starting from the front, F 1 decisions are copied to a temporary archive P ¯ until its size equals or exceeds the value of the N so that P ¯ = i = 1 k 1 F i . If the population size P ¯   equals N , then the capacity of the archive is used as the new population P = P ¯ , and if the conditions for stopping the algorithm are not reached (step 7), then the next step of the algorithm is executed.
In the fifth step, we determine the value of crowding on the reference points of the set R by linking the solution points to the nearest reference point. The proximity to the reference point is understood not as the direct distance to it but as the length of the perpendicular drawn on the line passing through the origin and the corresponding reference point (Figure 1).
Thus, the number of decision points that are associated with a given reference point is called its density value Figure 1). After processing the points of the last edge F g and adding them to the set of the new population P , the current value of the reference point density is recalculated. In the sixth step, a solution point is randomly selected from the subset of solutions that are in the region of the reference point with the smallest density value until the population size is P , which does not compare to N . At the seventh step, the algorithm checks the stopping criteria, and if at least one of them is reached, the algorithm stops and outputs the result of its work in the form of a Pareto-front, which is represented by the front F 1 . All other fronts are discarded due to the fact that they were ancillary and were only used to maintain population diversity to avoid hitting local minima.
In case the current state of the algorithm does not meet any of the stopping criteria, the algorithm resumes execution starting from the second step.
This iterative process is essential because NSGA-III, as a population-based evolutionary algorithm, improves solution quality progressively across generations. Each iteration (or generation) enables the algorithm to explore new regions of the solution space, refine existing solutions and maintain diversity along the Pareto front. Restarting from the second step ensures that selection, crossover, mutation and reference-point association are performed again on the updated population. Without continuing the iterations, the algorithm would not be able to evolve the population towards a better approximation of the true Pareto-optimal set.
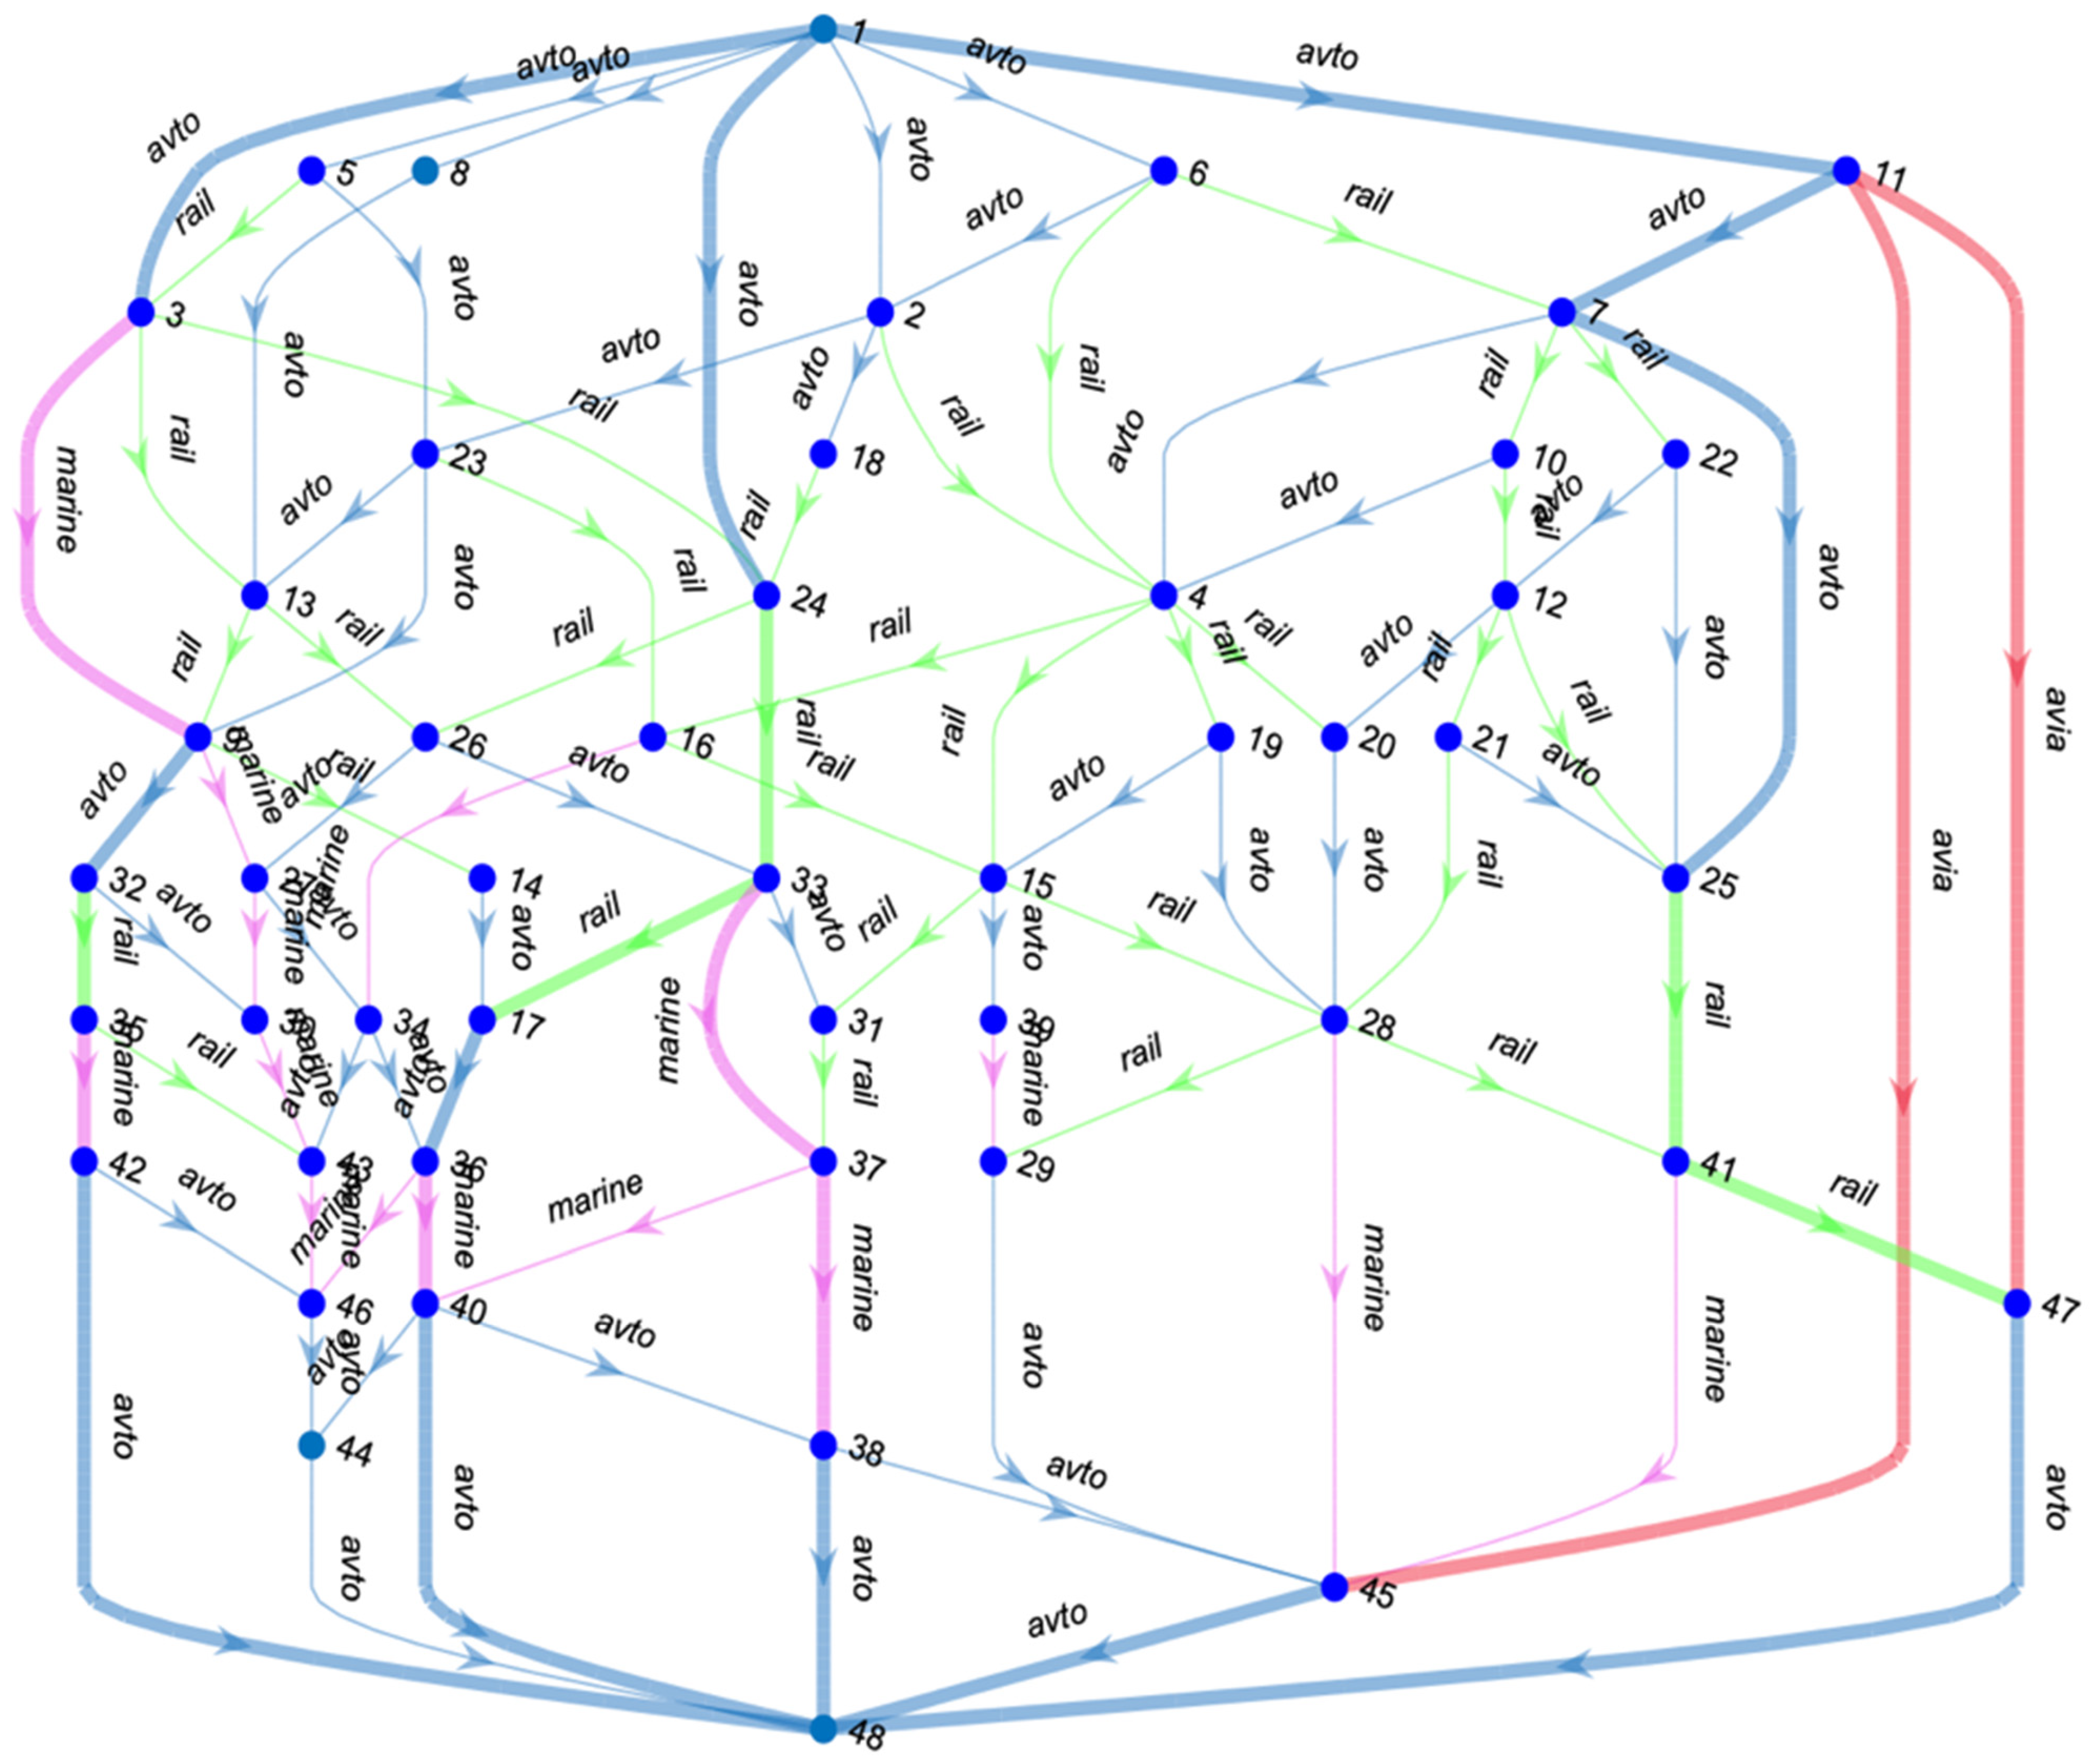
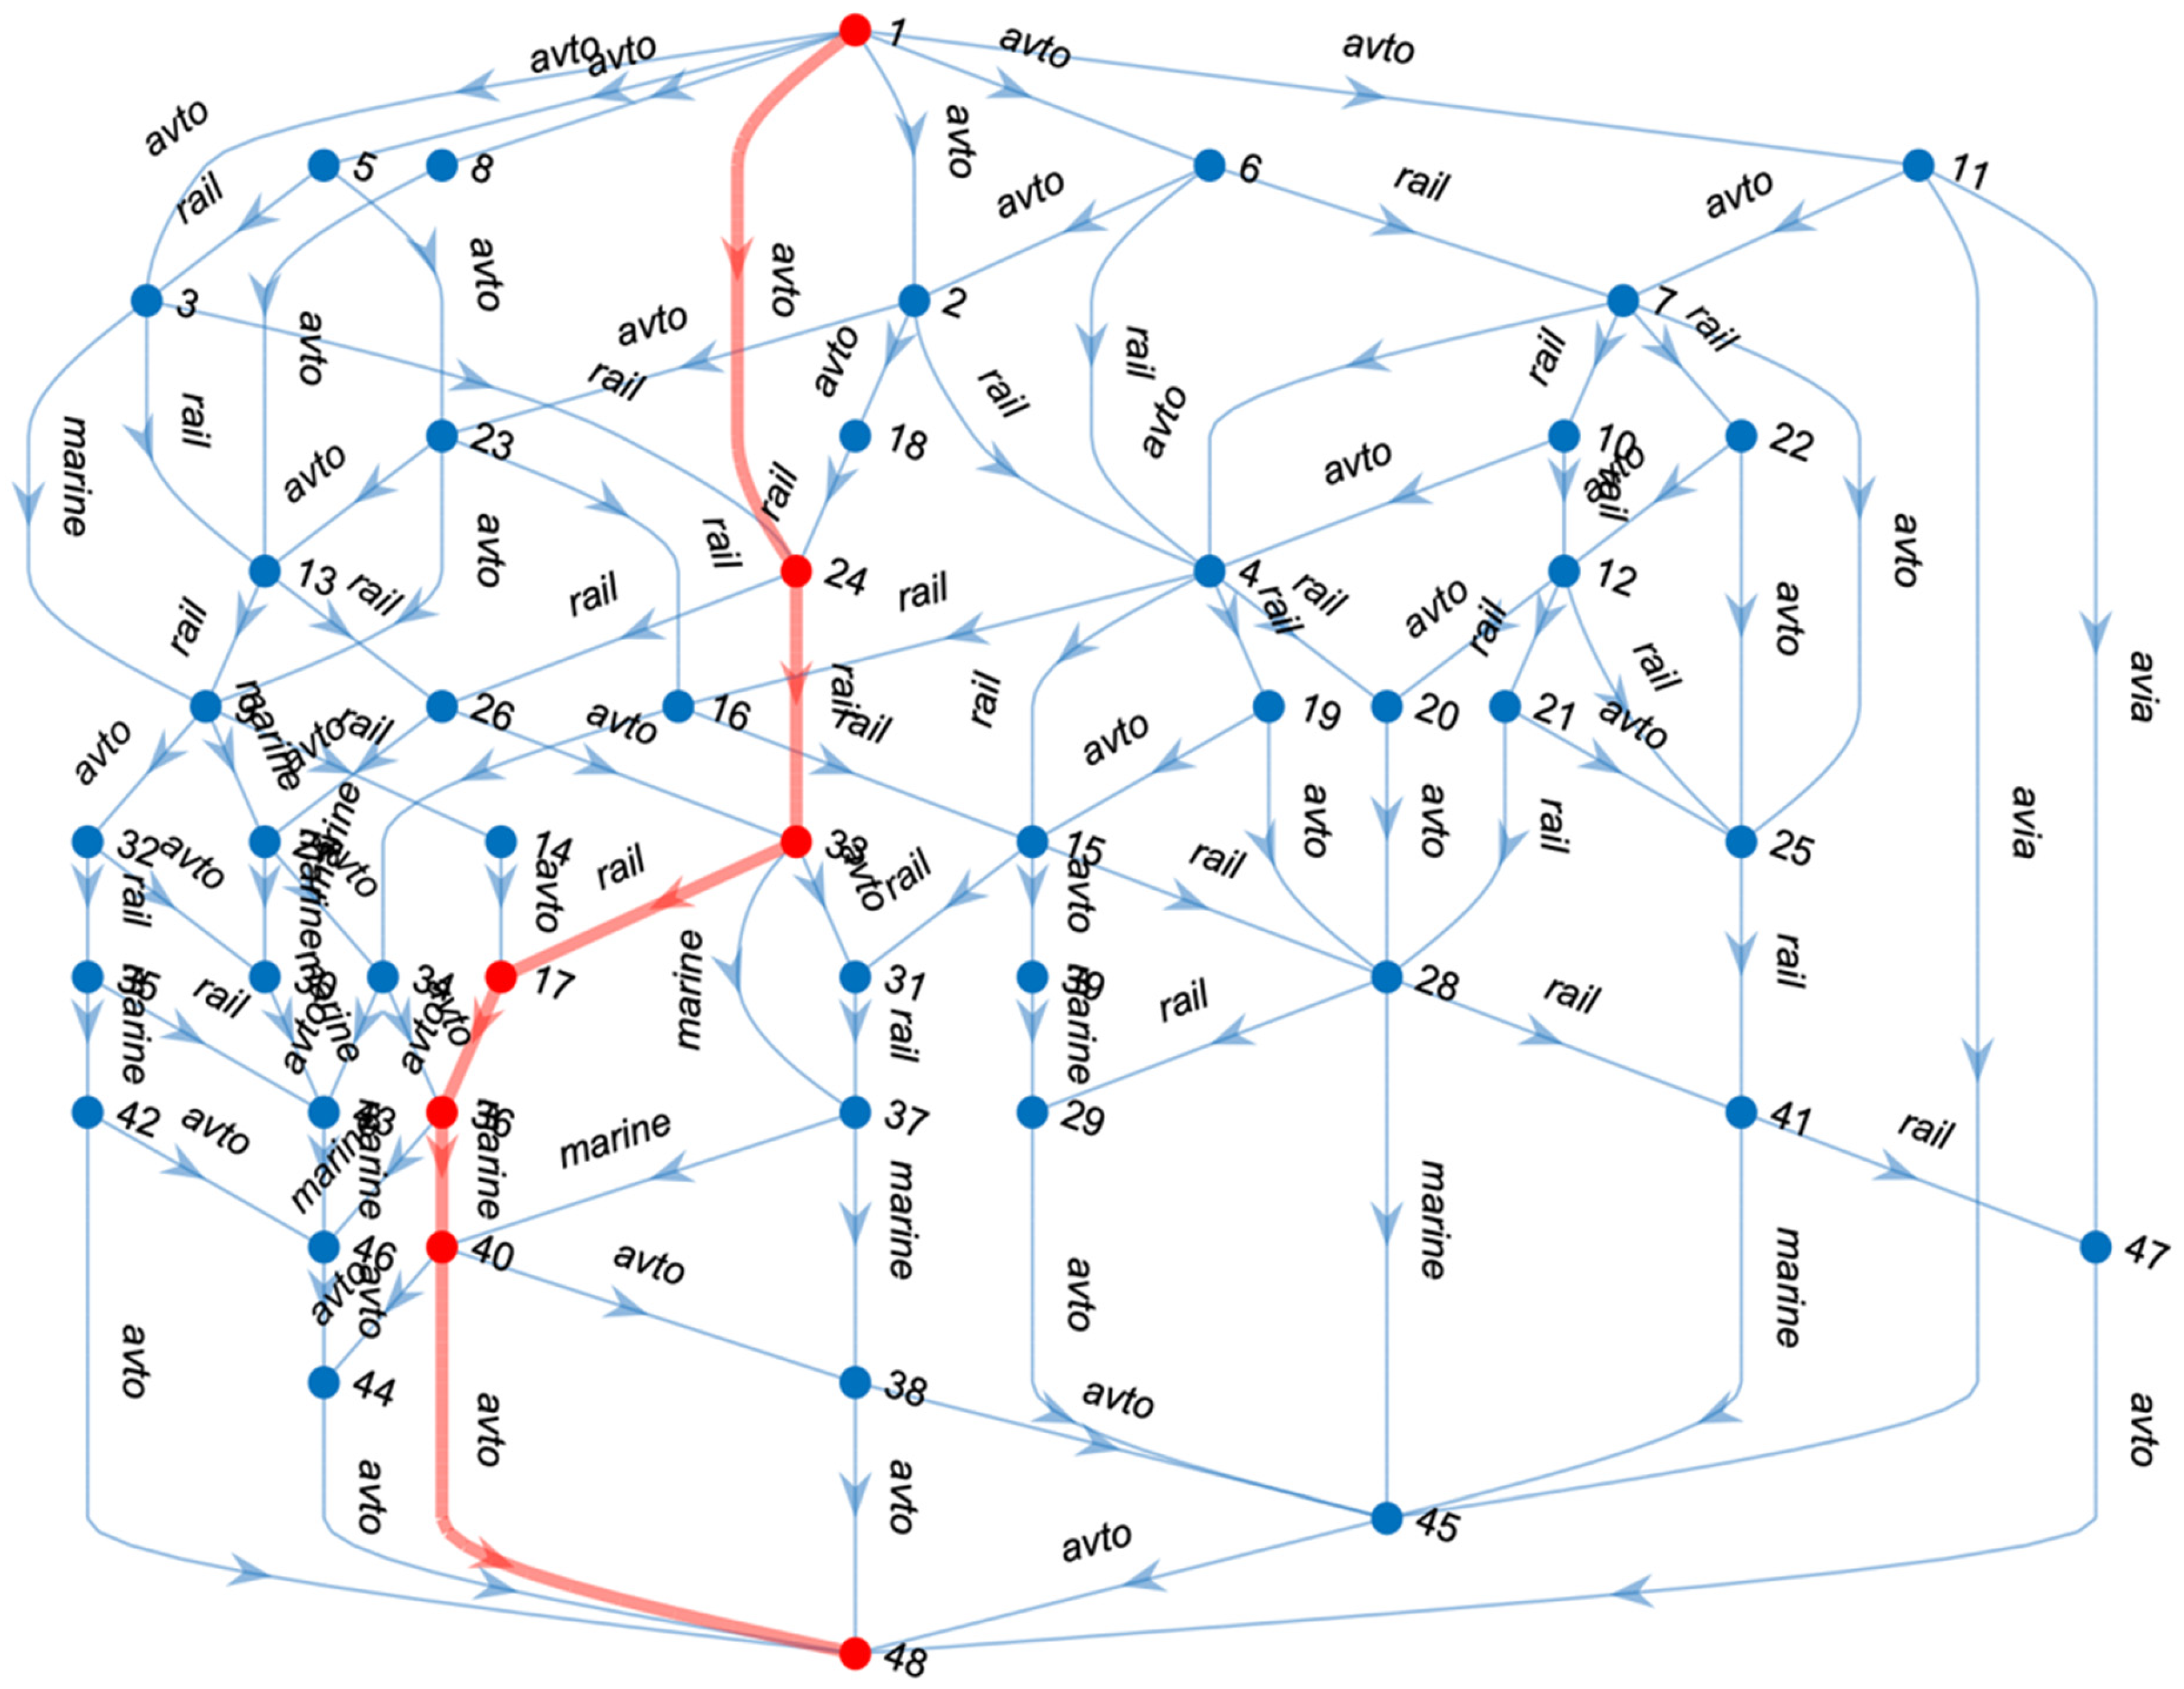
As input data, an abstract transportation network was used, which contains track sections corresponding to four types of communication: road, rail, sea and air. This network is represented by an oriented graph, which is shown in Figure 2.
The parameters of the graph arc are the type of message, distance, speed of movement and cost of transportation of one TEU container per 1 km. At each vertex of the graph, the costs of transshipment from one mode of transportation to another are also defined, corresponding to pairs of arcs, one of which represents the section of the route on which the cargo arrives at a given point, the second arc represents the section on which the cargo departs from a given point on the route. The starting point of each arc is also associated with the schedule of delays at the beginning of the movement along this arc, which corresponds to the moment of time when the cargo arrives at this point during the realization of transportation.
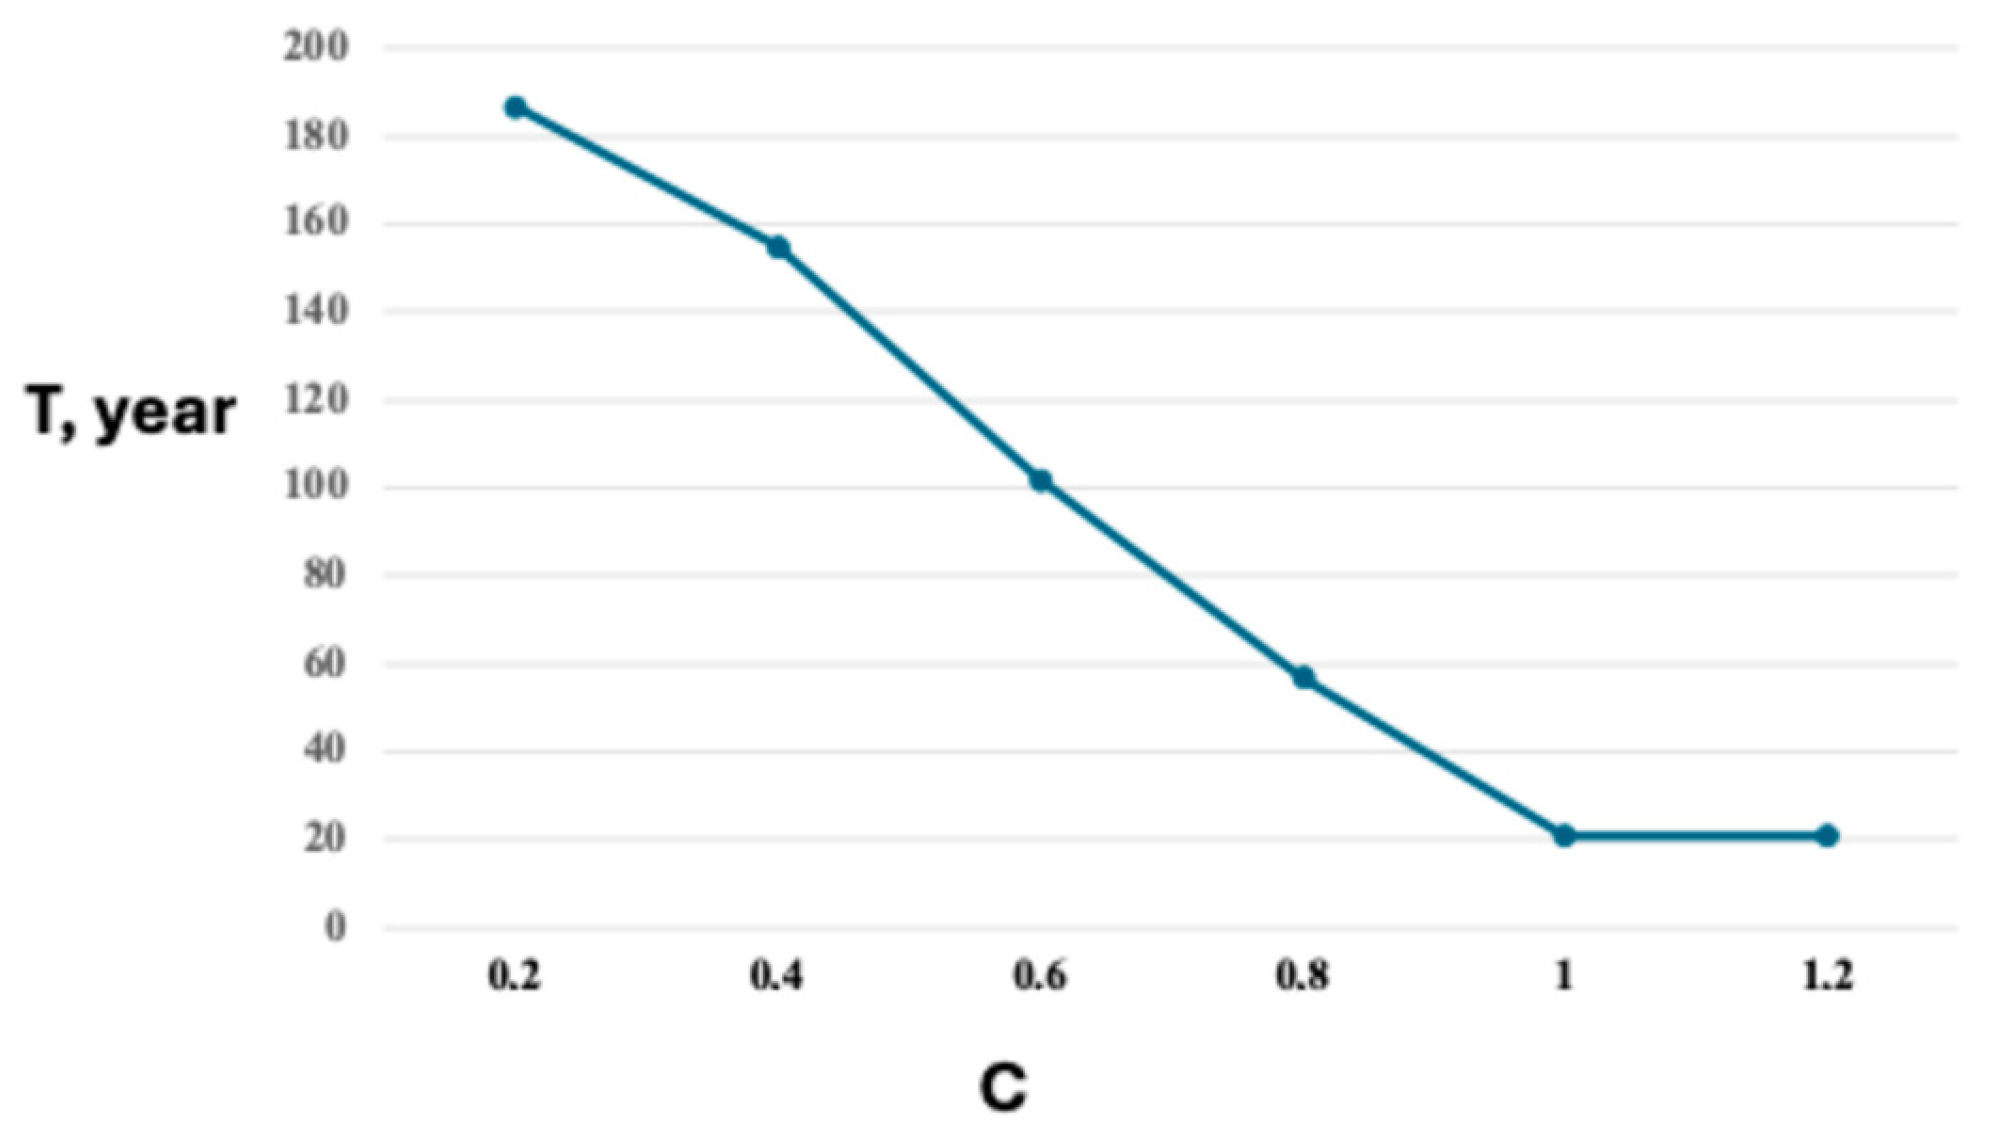
By applying a genetic algorithm of NSGA-III type, a set of Pareto-optimal solutions was obtained, which is presented in Figure 3.
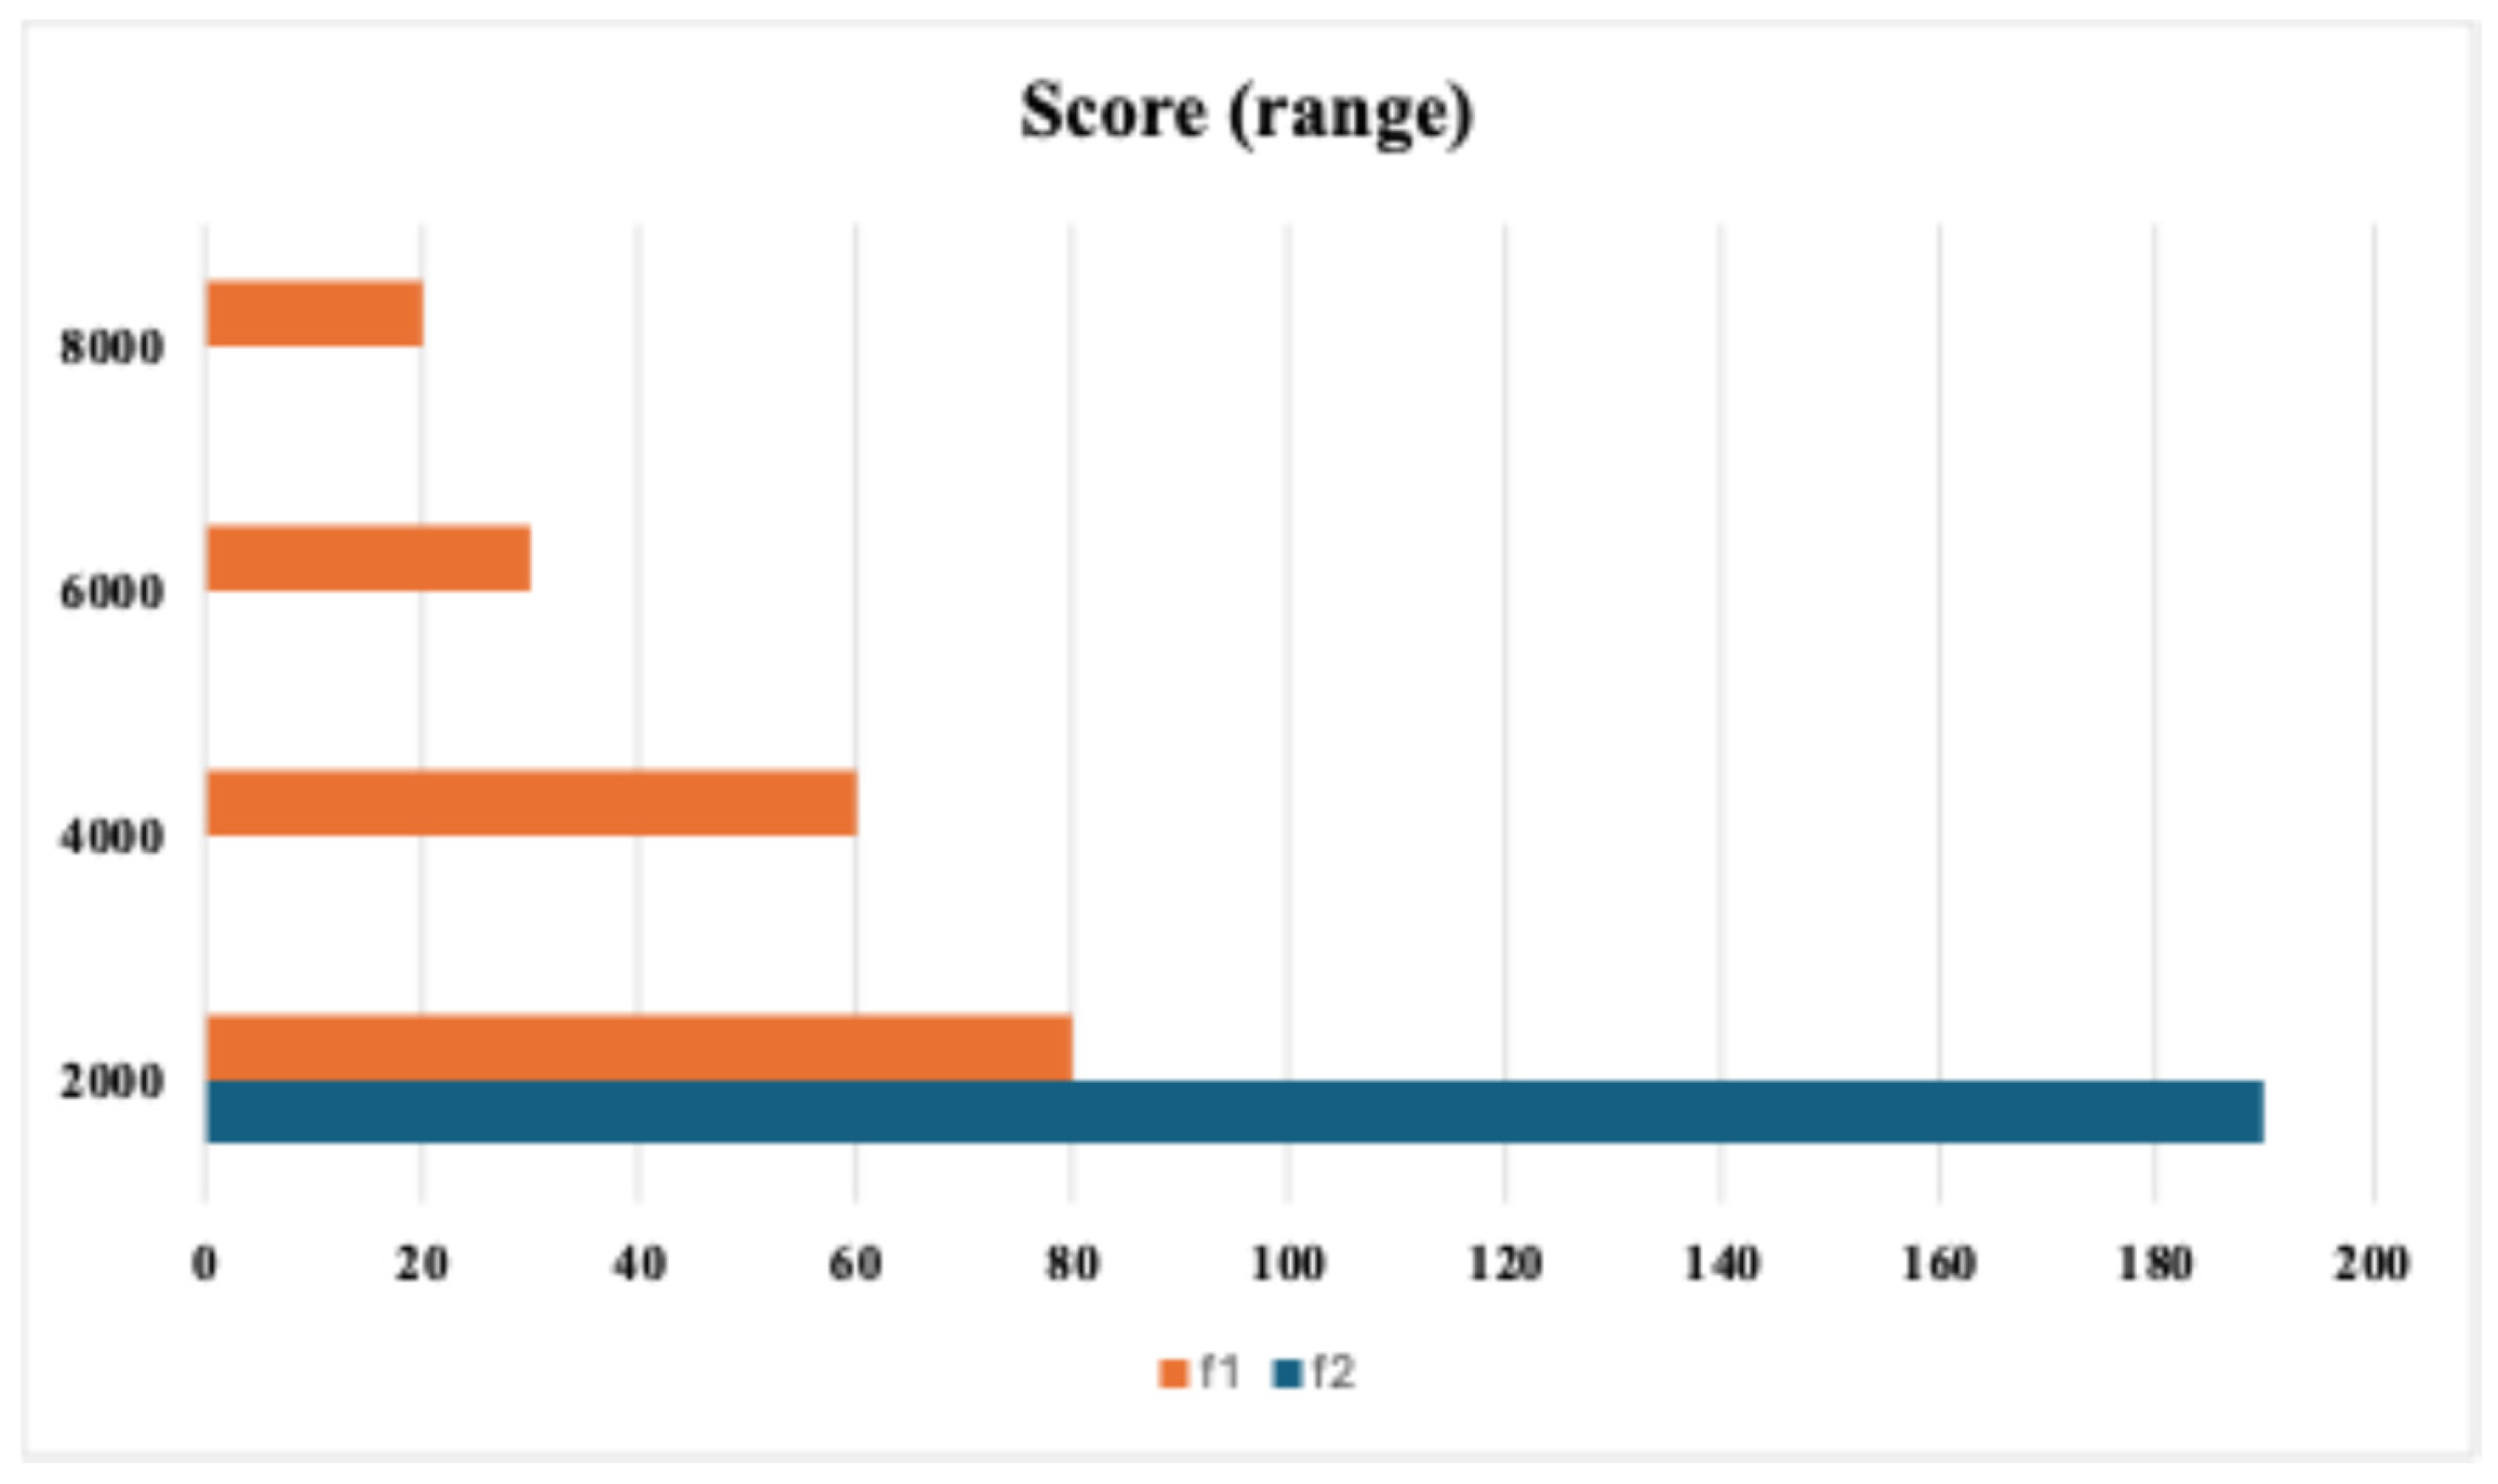
Thus, the set of Pareto-optimal solutions includes six target vectors (Figure 4). Figure 4 shows the result of ranking the population of solutions during the execution of the NSGA-III algorithm.
A Pareto front is a set of non-dominated target vectors, each of which is better than the others by the value of at least one target function. Thus, each of the presented routes is better than at least one other route corresponding to the target vector of the obtained Pareto-front set, either by the criterion of transportation cost or by the criterion of delivery time.
Consequently, selecting a single solution from this set that maximally satisfies all technical requirements is a separate task that can sometimes also present a significant challenge. The key to solving this problem is to choose the method that best takes into account all the factors that are important in making this decision.
In this study, to address the complexity of multi-objective optimization and the combinatorial nature of intermodal transportation planning, we employ the Non-dominated Sorting Genetic Algorithm III (NSGA-III). NSGA-III is a state-of-the-art evolutionary metaheuristic specifically designed to approximate Pareto-optimal fronts in multi-criteria problems with high computational efficiency. Although it does not guarantee finding the global Pareto-optimal solutions, it effectively generates a diverse set of high-quality, near-optimal solutions within a reasonable computational time frame. This makes it particularly suitable for real-world transportation systems, where operational conditions are dynamic and multiple trade-offs must be evaluated.
The key steps of NSGA-III include population initialization, non-dominated sorting, reference point association for diversity preservation and evolutionary operators such as crossover and mutation. The application of NSGA-III allows decision-makers to select the most appropriate transportation plan based on sustainability priorities, operational flexibility and cost–time trade-offs.

4. Applied Research

There are methods that do not require additional information, such as the marginal utility method. However, when selecting a route, it is necessary to take into account the shipper’s requirements regarding delivery time and transportation costs. To evaluate how these criteria influence routing decisions in realistic intermodal settings, a synthetic but representative case study has been developed.
The transportation network constructed for the simulation reflects typical structural and operational characteristics of Eurasian freight corridors, particularly those linking Russia, China and Europe. Although it is not mapped to a specific geographic region, the model mimics the multimodal integration and transit logic of real-world logistics systems. The network consists of 15 nodes and 25 directed arcs, representing logistics hubs and terminals connected by road, rail and sea routes.
Key input parameters—distances (50–1200 km), average modal speeds (30–80 km/h), transportation costs (0.4–1.2 EUR per km per TEU) and transshipment times (2–12 h)—have been synthetically generated based on typical values reported in the literature and industry sources (e.g., Gandhi et al., 2024 [13]; Bei et al., 2025 [23]). Additionally, capacity constraints are included on selected arcs to simulate real-world bottlenecks.
While the model does not currently incorporate enterprise-level operational data due to access limitations, it is designed to simulate plausible logistics scenarios and provide a meaningful testbed for evaluating the performance and adaptability of the proposed optimization algorithm. Future extensions of the research will focus on applying the model to specific geographies and validating it with empirical data obtained from logistics providers.
In this regard, the so-called weighted stress function method is of considerable interest. Its main advantages are the following: focus on multi-criteria choice with the possibility of taking into account the degree of importance of each criterion, as well as taking into account the value of the ideal vector when making a choice.
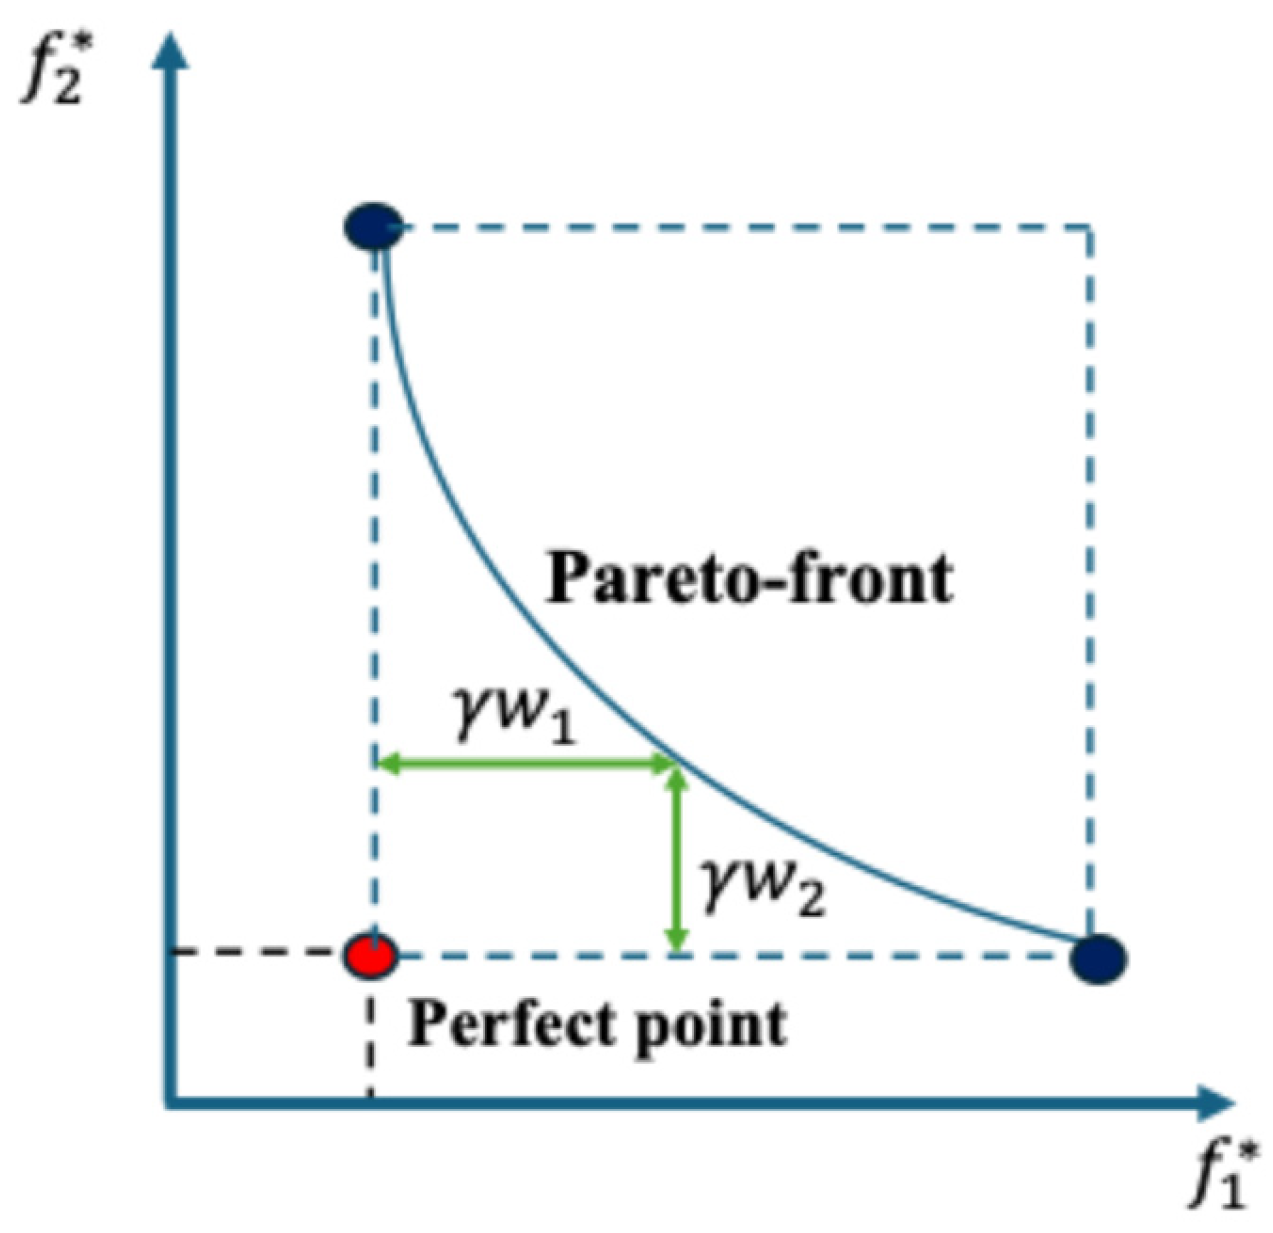
This method is built on the analogy with the stress–strain behavior of a material. Thus, stress is defined as the difference between the ideal point and the target vector (Figure 5). The magnitude of stress also depends on the weight of the criterion.
Consequently, the magnitude of stress depends on the weights that are associated with each criterion, i.e., a component of the target vector. Thus, the weight corresponding to a certain criterion is analogous to the parameter of material elasticity along a certain direction of force (stress).
The optimal solution corresponds to the target vector that provokes the minimum level of stress. The calculation of stress function values is based on the values of the target vectors, but for this purpose, the values of the target functions need to be normalized so that they belong to the numerical interval [0, 1]. The normalized value of the target function can be obtained by the following formula:
f i j * = f i j f i m i n f i m a x f i m i n
where f i j —values i in the target function j of the target vector Pareto-front;
f i m i n , f i m a x —minimum and maximum value i of the target function over the whole set of Pareto-front points.
The corresponding stress function value can be calculated using the following formula:
y i j f i j * , w i = 1 + a i j f i j * , w i β i w i ,
where a i j f i j * , w i   and   β i w i —coefficients of elasticities corresponding to components of target vectors and selected weights.
The second coefficient is calculated according to the formula:
β i w i = 1 t g π 2 w i 1 2 1 + δ 2 t g π 2 1 + δ 2 ,
where δ 2 —parameter, the value of which is taken at the level of δ 2 = 0.008 as the best value that has been established by experience.
The first coefficient is calculated using the formula:
a i j f i j * , w i = s t g ( π f i j * w i φ i ( w i ) ) φ i ( w i ) t g ( π w i ϕ i ( w i ) δ 1 ) ϕ i ( w i ) , f i j * w i t g ( π f i j * w i ϕ i ( w i ) t g ( π w i ϕ i ( w i ) ) , f i < w i ,
where additional coefficients are defined as φ ( w i ) = 3 4 w i 2 + 2 1 w i + δ 1 and φ ( w i ) = 3 4 w i 2 + w i + δ 1 ;
δ 1 —an additional parameter that is used for detuning from the zone close to the asymptote;
s —correction factor, which is applied to ensure smoothness when joining two parts of the curve.
It should be noted that the given formula is without a correction factor, which makes it unsuitable for practical applications. In the given, δ 1 = 0.002 , as the best value established by experience. However, at this value, there are significant distortions of curve shapes, which leads to the loss of meaning of this method.
It was experimentally established that the value of the parameter δ 1 , at which these distortions are absent, is within the range of 0.33 < δ 1 < 0.88 . In the course of calculations, the value of the parameter was taken at the level of δ 1 = 0.5 .
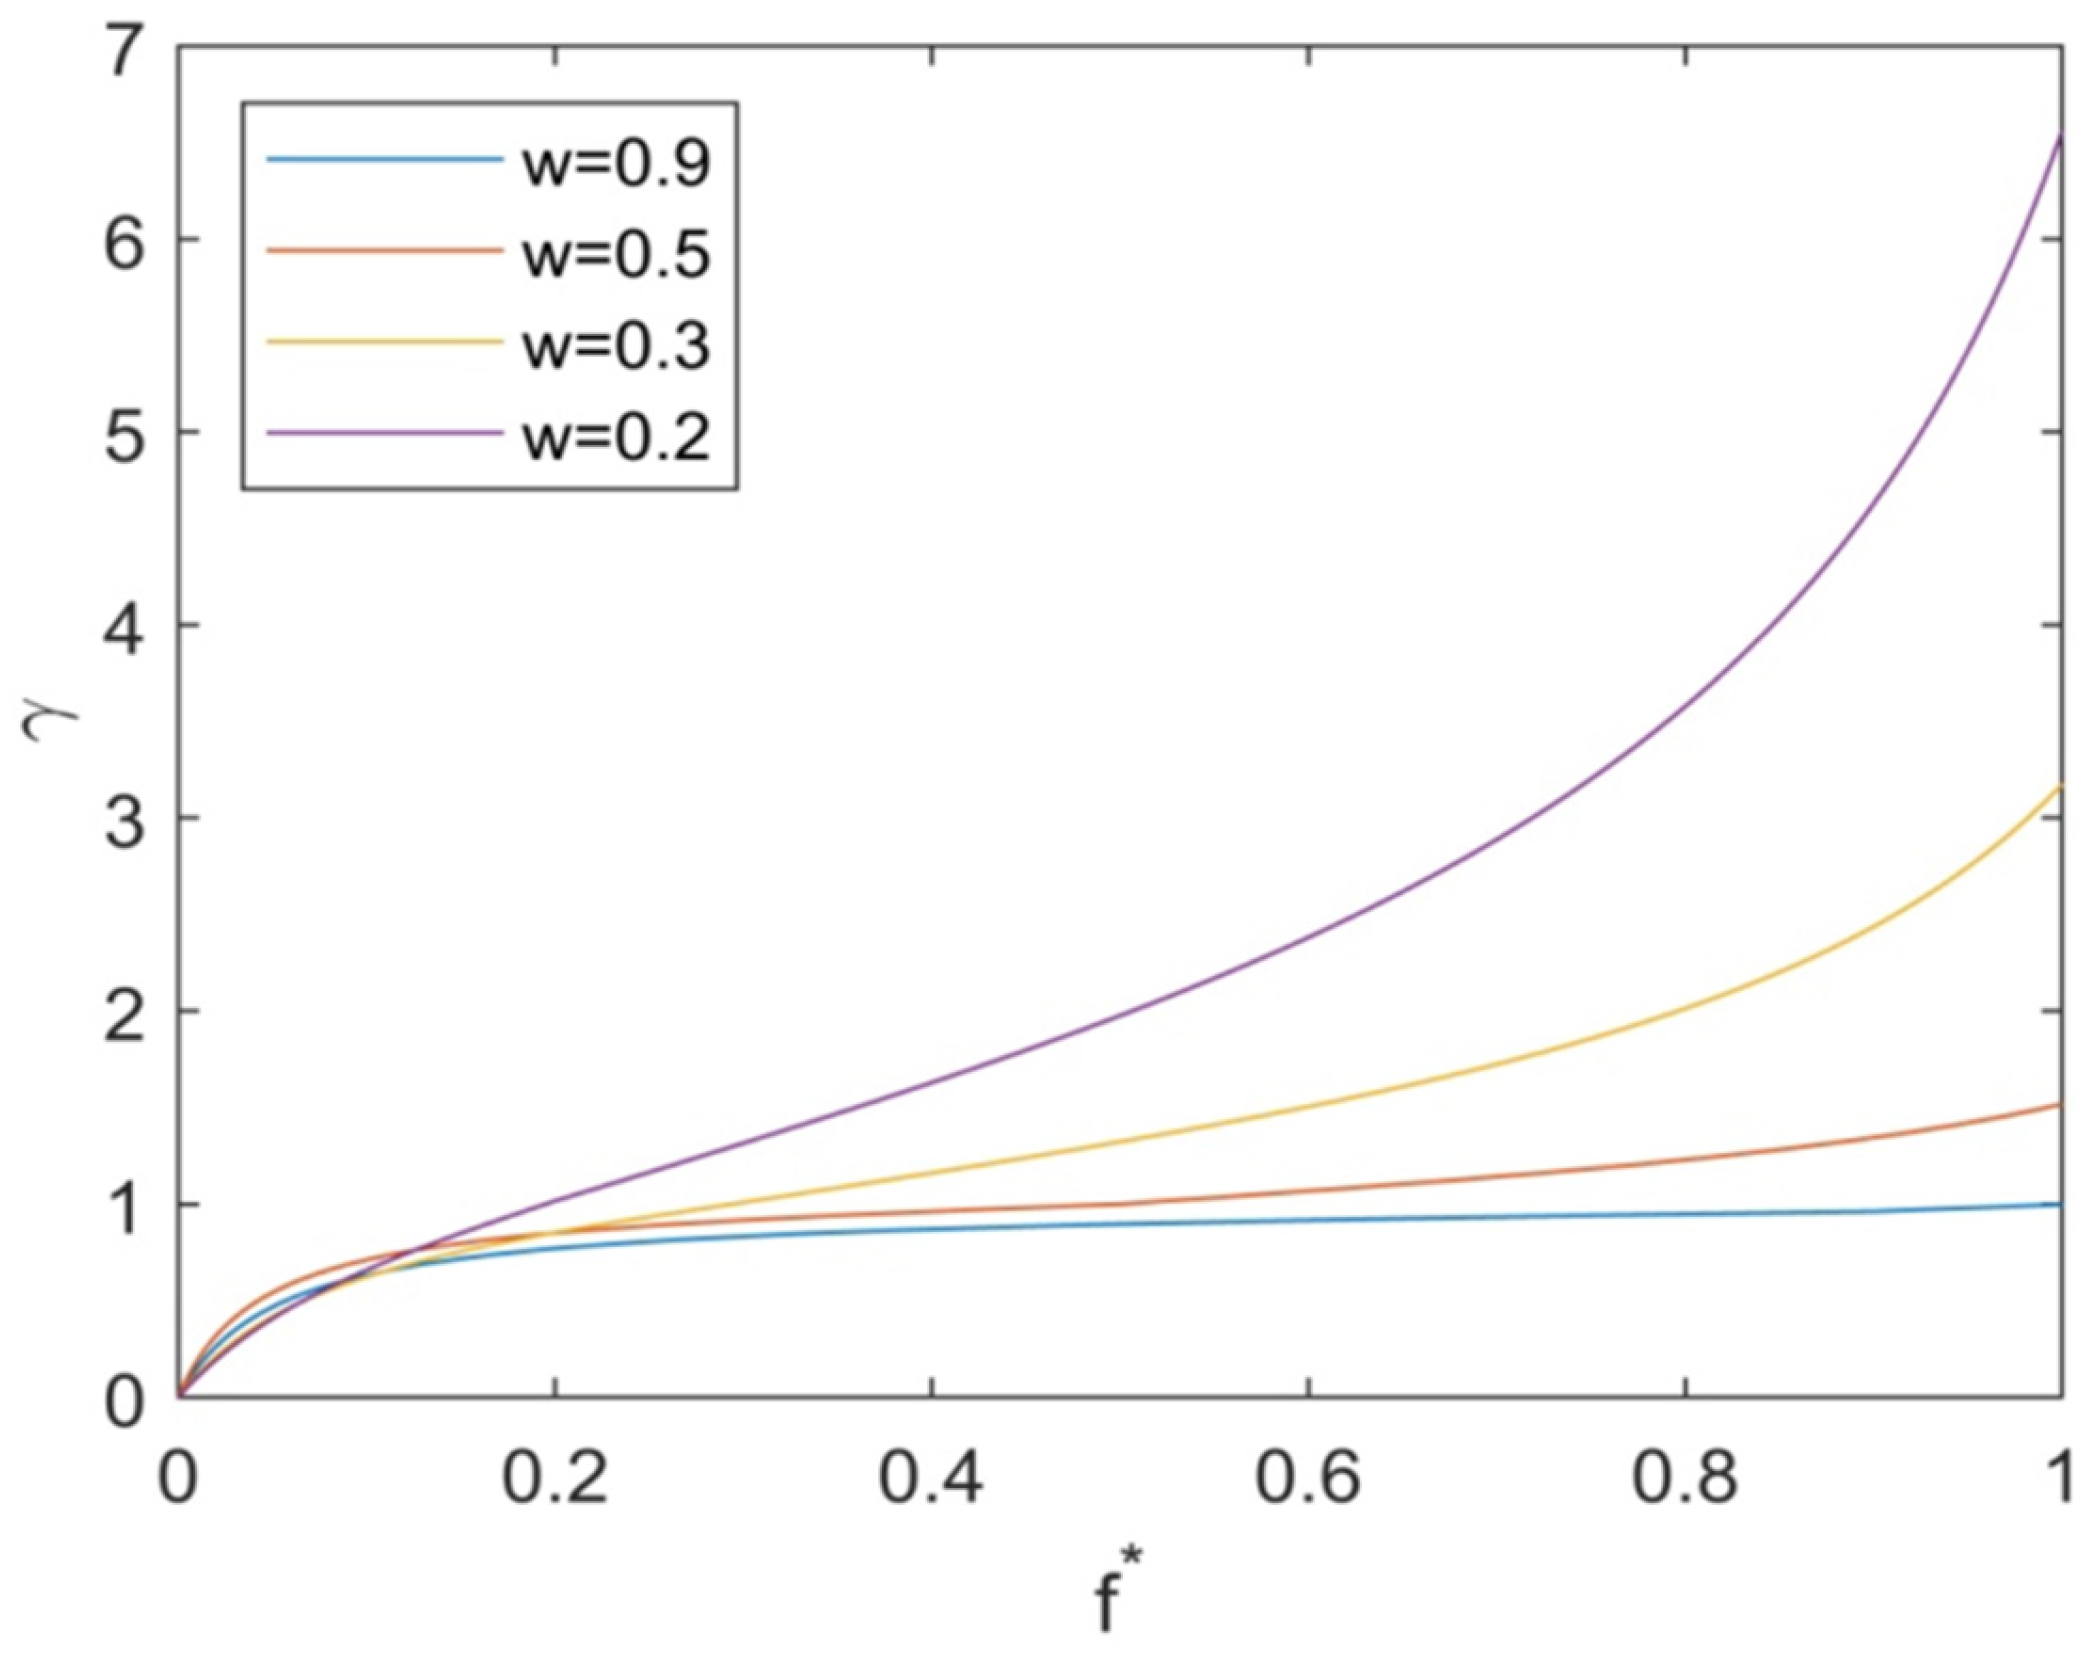
It should also be noted that the value of the correction factor s depends on the values of the parameters δ 1 and w i . The following type of dependence was used in the calculations s w i ,   δ 1 = 0.4 ( w i δ 1 ) 0.1 w i , δ 1 . The nomogram of dependencies calculated using the above formulas is shown in Figure 6.
This nomogram (Figure 7) is analogous to the stress–strain curves, where the middle part of the curves represents the most plastic phase of material deformation.
Consequently, the target vector of the Pareto set and its corresponding values of the manipulated variable t 0 and control variable vector X corresponding to the optimal solution must also correspond to the minimum of the following target function:
Q X j , t 0 j = y 1 j f 1 j * X j , t 0 j , w 1 y 2 j f 2 j * X j , t 0 j , w 2 m i n ,
Calculations were performed using the weighted stress function method. The values of weight coefficients reflecting the level of significance of the criteria were taken as follows: w 1 = 0.6 ,     w 2 = 0.4 . The results of which are summarized in Table 1.
The results of the multi-objective optimization performed using the NSGA-III algorithm are summarized in Table 1. Each row corresponds to a specific intermodal route connecting the origin and destination terminals via intermediate multimodal hubs. The itinerary column indicates the sequence of nodes (terminals) in each route. For every route, the table reports the total transportation distance, the economic cost function C x = f 1 x expressed in USD per container, and the time function C x = f 2 x expressed in hours per year. The normalized values f 1 * ( x ) and f 2 * ( x ) are used to construct the final composite quality indicator Q ( x ) , which ranks the Pareto-optimal solutions.
Among the options presented, Route 3 (1 → 24 → 33 → 17 → 36 → 40 → 48) demonstrates the most balanced trade-off between cost and delivery time, with a total cost of 2964 USD and a delivery duration of 100.81 h (highlighted in bold). This solution was selected from the Pareto front as the recommended alternative and corresponds to the optimized result referenced in the conclusion section.
To evaluate the relative performance of the proposed approach, a baseline routing scenario was constructed based on conventional planning logic—selecting the shortest feasible path with minimal transfers and no cost–time trade-off analysis. According to industry data and typical values from European transport reports, the average transportation cost under such conditions exceeds 5200 USD per container, while delivery time reaches or exceeds 200 h. Compared to this reference, the NSGA-III solution offers an estimated cost reduction of approximately 8% and a reduction in delivery time of over 50%, demonstrating the practical relevance and efficiency of the developed optimization framework.
According to the calculation results, the optimal route corresponds to the target vector #3 because it has the minimum value of the Q function. Figure 8 gives the Pareto front and shows the distance between the solution point and the ideal point.
Based on the generated model, software was created in Matlab (ver. MATLAB 9.7 R2019b). Figure 8 shows the optimal route in the graph of the transportation network.
According to the calculation results, the route length was 2964 km, the route duration was 100.81 h and the cost of transportation of one container was 4818.74 USD. According to expert estimates and calculations, this technology will provide an average reduction in costs of intermodal operators by 8% if it is used on complex transport networks and up to 50% reduction in the duration of transportation compared to traditional planning technology.
To substantiate these estimates, we included a baseline comparison scenario that reflects traditional route planning practices commonly used in enterprise logistics. This baseline route was constructed using standard shortest-path logic without multi-objective optimization or adaptive reallocation of modes. Based on representative values from industry reports and published logistics datasets, the average transportation cost in such traditional configurations is approximately 5240 USD per container, and the typical delivery time exceeds 200 h for comparable transit chains.
Against this reference, Figure 8 presented in Table 1—generated using the NSGA-III algorithm—achieves a cost reduction of about 8% and a delivery time improvement of more than 50%. Although the comparative data are based on synthetic yet realistic assumptions, they serve as a valid proxy for evaluating the efficiency and practical relevance of the proposed optimization approach.
The developed method of selecting a single solution on the Pareto set can take into account the priorities of the consignor by using weighted stress functions when selecting the optimal plan of intermodal transportation.
These figures are based on expert estimation and simulation scenarios, not on verified enterprise-level operational data. They are intended to illustrate the model’s potential under typical freight transportation conditions. Future research will aim to validate these results using real-world datasets obtained from logistics enterprises.
To support transparency and reproducibility, we intend to make the simulation code, synthetic dataset and all model parameters publicly available in a dedicated GitHub repository upon final acceptance of the article. This package will include the implementation of the NSGA-III algorithm, the full list of assumptions and coefficients (including carbon emission factors) and the scripts used to generate the optimization results and figures presented in this study.

5. Discussion

This section compares the method of intermodal transportation optimization proposed in this study with similar approaches presented in other papers. In addition, its impact on the sustainability of transportation systems, possibilities for further improvement of the model and prospects for its practical application in global logistics are discussed.
The NSGA-III algorithm proposed in this paper for the optimization of intermodal transportation routes takes into account the cost and delivery time minimization and sustainability aspects such as CO2 emission reduction and traffic flow balancing. In this context, it is important to consider the differences between our methodology and existing approaches presented in current studies. In their study, Refs. [26,27,28,29,30,31] investigated a maritime transportation optimization problem using a mixed integer programming (MILP) method to minimize transportation costs. However, their model focused solely on economic aspects, whereas our methodology combines economic efficiency with environmental sustainability, which is particularly relevant in the context of tightening environmental standards and international agreements to reduce greenhouse gas emissions.
Hu et al. (2022) [14] analyzed subsidies for intermodal transport incentives by developing a two-level model for optimizing the allocation of freight flows between water and land routes. Although their study estimates the impact of financial incentives on traffic reallocation, it does not consider a comprehensive solution to the optimal route selection problem considering several objective functions, as in our approach. In contrast to their model, our method offers a more versatile tool for automated real-time traffic flow planning. Hosseini & Khaled (2021) [32] propose a methodology for optimizing freight flows by taking into account critical transport nodes, focusing on the structural vulnerability of logistics networks. Their work is a valuable contribution to the field of strategic planning but does not sufficiently cover the sustainability and environmental impact of transportation decisions. In contrast, our method takes into account routing and carbon footprint reduction, which makes it more applicable to today’s logistics challenges. Li et al. (2023) [33] developed a two-stage model of intermodal hub siting, taking into account government subsidies and analyzing the impact of policy decisions on the development of transportation systems. While their study provides useful macroeconomic insights, it does not address issues of operational routing and flexibility in decision-making. Our approach considers both long- and short-term factors affecting the sustainability of transportation systems, including the impact of climate change and global crises on logistics processes. The proposed approach contributes to both long- and short-term sustainability considerations by optimizing transportation plans in a flexible, multi-objective framework. In the short term, the model supports operational routing decisions by enabling real-time selection among multiple Pareto-optimal routes based on changing delivery requirements, cost fluctuations or capacity constraints. In the long term, the ability to simulate and generate diverse sets of trade-off solutions provides planners with the tools to redesign or adapt transportation strategies in response to systemic disruptions, such as those caused by climate change (e.g., infrastructure damage, route closures) or global crises (e.g., pandemics, geopolitical conflicts).
Moreover, the integration of multiple transportation modes in the network model encourages resilience by reducing dependency on any single mode of transport. The application of the NSGA-III algorithm allows the system to maintain a high degree of solution diversity, ensuring that even under altered conditions, feasible and efficient routing options remain available. This adaptability directly supports the sustainability and robustness of freight transportation systems facing uncertain and evolving external environments. Barlogis et al. (2025) [5] investigate the use of IoT data to predict container arrival times in intermodal transportation. Their model demonstrates a high level of predictive accuracy, which contributes to improved supply chain management. However, their work does not solve the route optimization problem, whereas our model offers an integrated approach by combining prediction and optimization. Mashayekhi & Verma (2025) [34] present an analytical method for the design of railroad–road intermodal networks. Although their study covers important aspects of network design, it does not focus on reducing the environmental impact of traffic flows. In contrast, our model considers the possibility of adapting routes depending on environmental constraints, which contributes to the efficiency of the transportation network. Braekers et al. (2013) [35] analyze the routing of barge shipments in order to minimize the cost of container idling. Although their methodology is applicable in individual cases, it is not adapted for multi-objective optimization, including economic, environmental and social aspects, which makes our method more comprehensive and versatile. Zhang et al. (2024) [36] propose a model for container terminal location selection with decentralized traffic forecasting. Their work focuses on infrastructure design, while our model aims to manage traffic flows in an operational mode, making it more flexible and adaptable to changing market conditions. Bei et al. (2025) [23] are developing a route optimization model for perishable goods that takes customer satisfaction into account. While their model is effective in its domain, it is not designed for general intermodal transportation management. In contrast to their approach, our methodology allows us to adapt to different types of shipments, including both perishable goods and containerized shipments. Zhou et al. (2025) [37] analyze the impact of subsidies on the choice of container shipping routes using NSGA-II. Their model focuses on economic incentives but does not take into account a wide range of optimization criteria included in our study, such as the sustainability of transport systems and adaptability to changes in the market environment.
The application of the proposed method helps to improve the sustainability of transportation systems in several key areas. It allows the selection of routes that minimize the negative environmental impact, as evidenced by an 8% reduction in emissions compared to traditional routes. Balancing traffic volumes between different vehicles helps to reduce the load on critical nodes and reduce congestion [38]. Cost efficiency is achieved by reducing transportation costs and delivery times, making logistics operations more competitive. An important advantage is the flexibility of adaptation: the ability to quickly redesign routes in response to changes in the market situation or in the availability of transportation infrastructure makes the proposed method relevant for a wide range of logistics problems.
Thus, the proposed method outperforms alternative approaches in a number of indicators, providing a balance among efficiency, economy and sustainability of transportation systems. In the future, it is possible to further improve the model by integrating it with machine learning systems for the automatic prediction of optimal routes in real time, as well as to expand the optimization parameters taking into account social sustainability and adaptability to force majeure.

6. Conclusions

The developed procedure for determining the choice of transportation technology allows us to take into account the importance of one or another component of the criterion at any given time when making decisions. The proposed criterion, due to its complex nature, can be used to improve the efficiency of interaction between road and rail transport, as well as for other modes of transport. To ensure the efficient organization of the transportation process, a formalized technological framework for container movement in intermodal transport has been developed. This framework is designed to maximize the fulfillment of shippers’ requirements and is represented as a bicriteria mathematical model for planning intermodal container transportation. The length of route segments corresponding to different modes of transportation and the time factor are taken into account. The developed optimization model provides a compromise solution between the time and cost of delivery, which allows us to reproduce the process of planning intermodal transportation, using as input data the topology of the transport network and all the necessary additional information presented in the form of a graph structure.
In addition, the proposed technology of automated intermodal transportation planning contributes to sustainable economic development by providing a balance among economic efficiency, environmental safety and social responsibility. The implementation of this technology reduces operator costs, improves the accuracy of demand forecasting and optimizes logistics processes, leading to increased competitiveness of transportation systems. Route optimization reduces carbon emissions, promotes more efficient use of natural resources and reduces traffic congestion, which makes freight transportation more sustainable and less dependent on fuel market fluctuations.
According to the results of calculations, the route length was 2964 km, transportation duration was 100.81 h and the cost of delivery of one container was 4818.74 USD. The application of the proposed technology will reduce the costs of intermodal operators by 8% on average and reduce the duration of transportation by up to 50% compared to traditional planning methods.
The simulation results confirm that the developed mathematical model and optimization method are effective tools for improving the sustainability of logistics processes.
We acknowledge that the key performance improvements presented in this study are derived from simulation-based expert assessments. Due to limited access to actual operational data from enterprises, empirical validation remains a challenge at this stage. Future work will prioritize collaboration with industry stakeholders to obtain anonymized logistics data for rigorous model testing and refinement.
The introduction of the proposed technology into the transportation system will not only ensure an increase in the economic efficiency of transportation but also enhance its environmental and social sustainability, which makes it an important element of the long-term development strategy.

Author Contributions

Conceptualization, A.C. and A.A.M.A.R.; methodology, A.C., A.A.M.A.R., M.B., S.S. and A.L.; formal analysis, A.C., A.A.M.A.R., M.B., S.S. and A.L.; investigation, A.C. and S.S.; resources, A.C., A.A.M.A.R., M.B., S.S. and A.L.; data curation, A.C., M.B. and S.S.; writing—original draft preparation, A.C., A.A.M.A.R., M.B., S.S. and A.L.; writing—review and editing, A.C., A.A.M.A.R., M.B., S.S. and A.L.; project administration, A.C., A.A.M.A.R. and M.B.; funding acquisition, A.C. and M.B. All authors have read and agreed to the published version of the manuscript.

Funding

The research is funded by the Ministry of Science and Higher Education of the Russian Federation as part of the World-Class Research Center Program: Advanced Digital Technologies (contract No. 075-15-2022-311 dated 20 April 2022).

Institutional Review Board Statement

Not applicable.

Informed Consent Statement

Not applicable.

Data Availability Statement

The data presented in this study are available on request from the corresponding author.

Acknowledgments

All authors acknowledge funding support given by the Ministry of Science and Higher Education of the Russian Federation as part of World-Class Research Center Program: Advanced Digital Technologies (contract No. 075-15-2022-311 dated 20 April 2022).

Conflicts of Interest

The authors declare no conflicts of interest. The funders had no role in the design of the study; in the collection, analyses, or interpretation of data; in the writing of the manuscript; or in the decision to publish the results.

References

  1. Kaack, L.H.; Vaishnav, P.; Morgan, M.G.; Azevedo, I.L.; Rai, S. Decarbonizing intraregional freight systems with a focus on modal shift. Environ. Res. Lett. 2018, 13, 083001. [Google Scholar] [CrossRef]
  2. Janic, M. Modelling the full costs of an intermodal and road freight transport network. Transp. Res. Part D Transp. Environ. 2007, 12, 33–44. [Google Scholar] [CrossRef]
  3. Meyer, T. Decarbonizing road freight transportation—A bibliometric and network analysis. Transp. Res. Part D Transp. Environ. 2020, 89, 102619. [Google Scholar] [CrossRef]
  4. Yamahaki, C.; Breviglieri, G.V.; von Lüpke, H. Explaining the absence of climate change integration in low-carbon sectoral policies: An analysis of Brazil’s maritime cabotage policy. Case Stud. Transp. Policy 2024, 16, 101183. [Google Scholar] [CrossRef]
  5. Barlogis, R.; Montarnal, A.; Ouedraogo, C.; Gourc, D. Predicting container intermodal transport arrival times: An approach based on IoT data. Internet Things 2025, 29, 101460. [Google Scholar] [CrossRef]
  6. Balsalobre-Lorente, D.; Shah, S.A.R. Stay circular economy, empowerment, and natural resource utilization factual factors for SDG 12? The principal role of digital technologies. J. Environ. Manag. 2024, 370, 122459. [Google Scholar] [CrossRef]
  7. Rahman, M.M.; Hossain, M.E. Green technology, policy and sustainable finance nexus with SDG-12: Moderating effects of stakeholder awareness. Sustain. Futures 2024, 8, 100405. [Google Scholar] [CrossRef]
  8. Aziz, K.M.A.; Daoud, A.O.; Singh, A.K.; Alhusban, M. Integrating digital mapping technologies in urban development: Advancing sustainable and resilient infrastructure for SDG 9 achievement—A systematic review. Alex. Eng. J. 2025, 116, 512–524. [Google Scholar] [CrossRef]
  9. Reyes-Menéndez, A.; Mediavilla, J.C.; García, N.V. Understanding STI and SDG with artificial intelligence: A review and research agenda for entrepreneurial action. Technol. Forecast. Soc. Change 2023, 196, 122785. [Google Scholar] [CrossRef]
  10. Simionescu, M.; Radulescu, M.; Cifuentes-Faura, J. The role of natural resources rents and e-government in achieving sustainable development in the European Union. Resour. Policy 2024, 97, 105278. [Google Scholar] [CrossRef]
  11. Baldassarre, B. Circular economy for resource security in the European Union (EU): Case study, research framework, and future directions. Ecol. Econ. 2025, 227, 108345. [Google Scholar] [CrossRef]
  12. Tatar, V.; Ayvaz, B.; Pamucar, D. Analysis of Renewable Energy Investments in China’s BRI Middle Corridor Using Spherical Fuzzy Decision-Making Framework. Renew. Energy 2025, 244, 122631. [Google Scholar] [CrossRef]
  13. Gandhi, N.; Kant, R.; Thakkar, J.J. Evaluation of benefits due to adoption of enablers of unimodal road to intermodal railroad freight transportation. Transp. Policy 2024, 146, 295–311. [Google Scholar] [CrossRef]
  14. Hu, Q.; Gu, W.; Wang, S. Optimal subsidy scheme design for promoting intermodal freight transport. Transp. Res. Part E Logist. Transp. Rev. 2022, 157, 102561. [Google Scholar] [CrossRef]
  15. Al-lami, A.; Török, Á. Assessing sustainability indicators of public transportation using PAHP. Sustain. Futures 2025, 9, 100500. [Google Scholar] [CrossRef]
  16. Kine, H.Z.; Gebresenbet, G.; Tavasszy, L.; Ljungberg, D. Digitalization and Automation in Intermodal Freight Transport and Their Potential Application for Low-Income Countries. 2022. Available online: https://www.semanticscholar.org/paper/Digitalization-and-Automation-in-Intermodal-Freight-Kine-Gebresenbet/011b316f7e0b6aa4379ffaa53d5c7f77a5f7f129 (accessed on 24 March 2025).
  17. Agamez-Arias, A.-M.; Moyano-Fuentes, J. Intermodal transport in freight distribution: A literature review. Transp. Rev. 2017, 37, 782–807. [Google Scholar] [CrossRef]
  18. Goyal, A.; Rani, Y. A Study on Advancement in Intermodal and Multimodal Transportation. Int. J. Res. Publ. Rev. 2024, 5, 5511–5540. [Google Scholar] [CrossRef]
  19. Verdeș, C.; Mironescu, A.A. The Future of Logistics: A Literature Review of Digitalization Trends. Commun. Int. Proc. 2023, 2023, 4126623. [Google Scholar] [CrossRef]
  20. Temizceri, F.T.; Kara, S.S. Towards sustainable logistics in Turkey: A bi-objective approach to green intermodal freight transportation enhanced by machine learning. Res. Transp. Bus. Manag. 2024, 55, 101145. [Google Scholar] [CrossRef]
  21. Wei, X.; Wang, M.; Meng, Q. Vulnerability Assessment and Reduction for Intermodal Freight Transportation Networks. Reliab. Eng. Syst. Saf. 2024, 245, 109969. [Google Scholar] [CrossRef]
  22. Sina Mohri, S.; Thompson, R. Designing sustainable intermodal freight transportation networks using a controlled rail tariff discounting policy—The Iranian case. Transp. Res. Part A Policy Pract. 2022, 157, 59–77. [Google Scholar] [CrossRef]
  23. Bei, H.; Yu, M.; Yang, T.; Murcio, R. Optimization of intermodal transportation routes for perishable goods considering customer satisfaction. Res. Transp. Bus. Manag. 2025, 59, 101261. [Google Scholar] [CrossRef]
  24. Meyer-Hollatz, T.; Kaiser, M.; Keller, R.; Schober, M. Understanding information needs for seamless intermodal transportation: Evidence from Germany. Transp. Res. Part D Transp. Environ. 2024, 130, 104161. [Google Scholar] [CrossRef]
  25. Weng, Y.; Zhang, J.; Yang, C.; Ramzan, M. Intermodal travel planning and decision support integrated with transportation and energy systems. Heliyon 2024, 10, e31577. [Google Scholar] [CrossRef]
  26. Klapita, V. Analysis of Operational Performance of Intermodal Transport Terminals in Slovakia in the Context of Intermodal Transport Infrastructure Development in EU Countries. Transp. Res. Procedia 2024, 77, 201–209. [Google Scholar] [CrossRef]
  27. Ballantyne, P.; Filomena, G.; Rowe, F.; Singleton, A. Developing two-dimensional indicators of transport demand and supply to promote sustainable transportation equity. Comput. Environ. Urban Syst. 2024, 113, 102179. [Google Scholar] [CrossRef]
  28. Thompson, E.A.; Alimo, P.K.; Abudu, R.; Lu, P. Towards sustainable freight transportation in Africa: Complementarity of the fuzzy Delphi and best-worst Methods. Sustain. Futures 2024, 8, 100371. [Google Scholar] [CrossRef]
  29. Vida, L.; Illés, B.; Bányainé-Tóth, Á. Logistics 4.0 in intermodal freight transport. Procedia Comput. Sci. 2023, 217, 31–40. [Google Scholar] [CrossRef]
  30. Hrušovský, M.; Demir, E.; Jammernegg, W.; Van Woensel, T. Real-time disruption management approach for intermodal freight transportation. J. Clean. Prod. 2021, 280, 124826. [Google Scholar] [CrossRef]
  31. Michela Le Pira Carla Giuffrida, N.; Tapia, R.J.; Pilla, F.; Tavasszy, L.A. Innovations in last mile logistics: Towards inclusivity, resilience and sustainability. Res. Transp. Econ. 2024, 105, 101446. [Google Scholar] [CrossRef]
  32. Hosseini, S.; Al Khaled, A. Freight flow optimization to evaluate the criticality of intermodal surface transportation system infrastructures. Comput. Ind. Eng. 2021, 159, 107522. [Google Scholar] [CrossRef]
  33. Li, L.; Wang, J.; Wang, H.; Jin, X.; Du, L. Intermodal transportation hub location optimization with governments subsidies under the Belt and Road Initiative. Ocean Coast. Manag. 2023, 231, 106414. [Google Scholar] [CrossRef] [PubMed]
  34. Mashayekhi, Z.; Verma, M. An Analytical Approach to Rail-Truck Intermodal Network Design. Transp. Res. Procedia 2025, 82, 356–366. [Google Scholar] [CrossRef]
  35. Braekers, K.; Caris, A.; Janssens, G.K. Optimal shipping routes and vessel size for intermodal barge transport with empty container repositioning. Comput. Ind. 2013, 64, 155–164. [Google Scholar] [CrossRef]
  36. Zhang, J.; Lin, Y.H.; Chew, E.P.; Tan, K.C. Intermodal container terminal location and capacity design with decentralized flow estimation. Transp. Res. Part B Methodol. 2024, 190, 103092. [Google Scholar] [CrossRef]
  37. Zhou, Y.; Liu, Q.; Zheng, S.; Zhang, Q. Impact of subsidy strategies on the optimization of container intermodal transport route selection. Reg. Stud. Mar. Sci. 2025, 84, 104115. [Google Scholar] [CrossRef]
  38. Zhen, L.; Wu, J.; Wang, S.; Li, S.; Wang, M. Optimizing automotive maritime transportation in Ro-Ro and container shipping. Transp. Res. Part B Methodol. 2025, 194, 103175. [Google Scholar] [CrossRef]
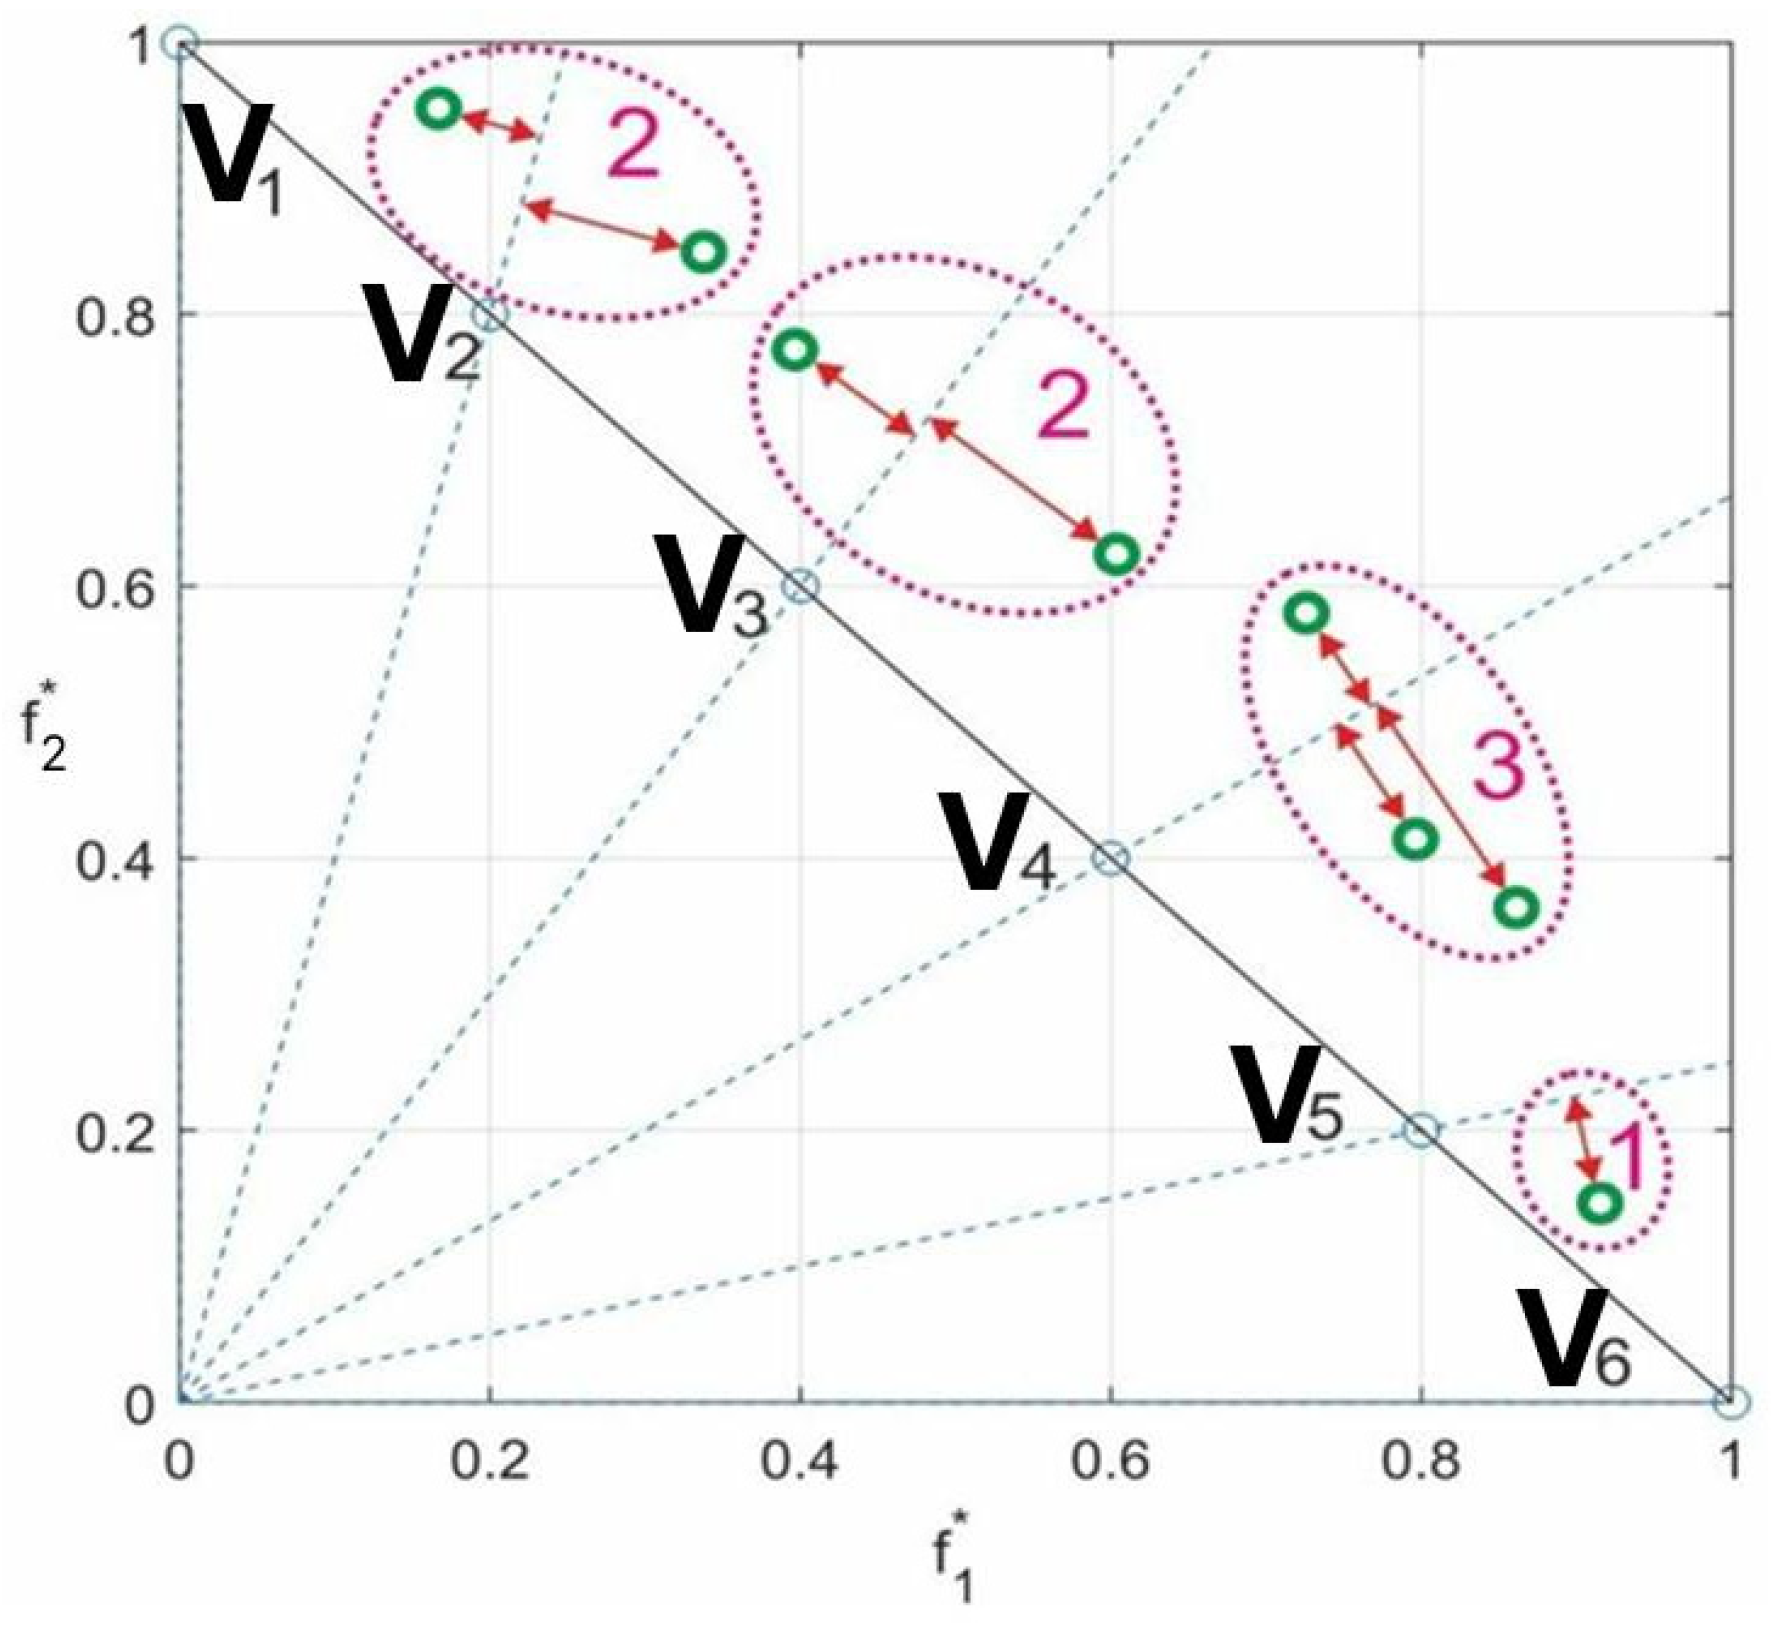
Figure 1. Determination of the reference point density value.
Sustainability 17 05541 g001
Figure 2. Orgraph of the transportation network in the task of planning intermodal container transportation.
Sustainability 17 05541 g002
Figure 3. The set of Pareto-front solutions obtained with the NSGA-III algorithm.
Sustainability 17 05541 g003
Figure 4. Results of ranking the population of solutions according to the values of the components of the target vectors during the execution of the NSGA-III algorithm.
Sustainability 17 05541 g004
Figure 5. Definition of stress function.
Sustainability 17 05541 g005
Figure 6. Nomogram of interdependence of the stress function and the value of the normalized target function at different values of the weight coefficient.
Sustainability 17 05541 g006
Figure 7. Distance between the decision point and the perfect point.
Sustainability 17 05541 g007
Figure 8. Optimal route of intermodal container transportation on the transport network graph.
Sustainability 17 05541 g008
Table 1. Results of calculations to determine the optimal route of intermodal container transportation.
Itinerary Total Distance C x ,   f 1 x
$ / c o n t
C x , f 2 x
Year
f 1 * ( x ) f 2 * ( x ) Q ( x )
11,24,33,37,38,4846044036.36169.57010.981615
21,3,9,32,35,42,4841164492.69153.880.03760.89670.430953
31,24,33,17,36,40,4829644818.74100.810.06450.54760.395761
41,11,7,25,41,47,4824075203.5257.860.09620.2656.906039
51,11,47,48414712,099.7017.840.66480.00181.534167
61,11,45,48445816,166.1317.571017.35612
Sources: authors’ calculations.
Disclaimer/Publisher’s Note: The statements, opinions and data contained in all publications are solely those of the individual author(s) and contributor(s) and not of MDPI and/or the editor(s). MDPI and/or the editor(s) disclaim responsibility for any injury to people or property resulting from any ideas, methods, instructions or products referred to in the content.