1. Introduction
Non-coal underground mines are one of the significant sources of risk for social casualties and property losses, and their disaster prevention and control have attracted widespread social attention. According to statistics, there are currently 8174 non-coal underground mines nationwide, accounting for only 25.6% of the total number of non-coal mines in the country [
1]. Underground mines, due to their underground engineering, face more safety risks and thus attract more scholarly attention. From 2018 to 2022, 1008 production safety accidents occurred in non-coal mines nationwide, resulting in 1237 fatalities. For example, in 2022, a major water inrush accident occurred at the Taoshuyu iron mine in Qianxi County, Hebei Province, on 2 September. The accident resulted in 14 deaths and 1 person missing, and direct economic losses of approximately CNY 35 million. In 2019, a tailings dam failure occurred at the Feijão iron mine in Brumadinho. The collapse of mud from the dam breach destroyed the office area of the mine, leading to 165 deaths and 226 people missing. In recent years, the safety production situation of non-coal underground mines in China has continued to improve. However, the prevention and control of disaster risks in underground mines remain a key task to ensure safe, efficient, and sustainable mining production and social stability.
Disasters exhibit cascading and clustering characteristics, which can lead to the expansion of their impacts and losses. The disaster chain is a concrete manifestation of this phenomenon. With the occurrence of a primary disaster, certain disasters, such as landslides, can affect the surrounding environment. Combined with interactions with other factors, this creates conditions for the occurrence of secondary and derivative disasters, leading to a chain reaction. The relationships between disasters can form complex chain-like or even network-like structures, which are referred to as disaster chains [
2].
Many scholars [
3,
4,
5,
6] have conducted research on disaster chains. Menoni [
7] first proposed replacing the simple concept of coupled disaster losses with the concept of the disaster loss chain. Delmonaco [
8] defined cascading failures as partial failures in a system triggering failures in other interconnected parts. In the context of natural disasters, this refers to the high likelihood of a specific disaster triggering secondary disasters. Qin [
9] viewed disaster chains as a domino effect resulting from the interaction between disaster events. Kappes [
10] noted that various disaster processes are interrelated in complex natural disaster systems. The occurrence of one disaster can alter the overall state of the disaster system, thereby influencing the occurrence of another disaster. Helbing [
11] investigated the interaction networks responsible for the cascade-like spreading of disasters and discussed why disasters occur more frequently and are more serious than expected according to a normal distribution.
In the 1980s, the concept of disaster chains was first introduced to China as a fundamental theoretical issue in disaster studies. Guo [
12] defined a disaster chain as a phenomenon where a series of disasters occur successively. Li [
13] considered a disaster chain to be the amplification process of a large system over a long cycle, including the natural and social amplification processes during disaster formation. Shi [
14] described a disaster chain as a phenomenon where one disaster triggers a series of subsequent disasters, leading to a complex process of disaster transmission and amplification. Ma [
15] viewed a disaster chain as a series of secondary disasters derived from the original disaster, forming a secondary disaster chain. Wen [
16] defined a disaster chain as a phenomenon where one disaster initiates another, emphasizing the interconnection between different types of disasters. Liu [
17] considered a disaster chain as a composite system comprising a set of disaster elements. Within the chain, there are a series of interactions between the disaster elements and subsystems that occur continuously and spontaneously, with the interaction intensity giving the set of disaster elements an overall nature.
Currently, the application of disaster chain theory to mining studies remains relatively rare. Liu [
18] conducted a comprehensive investigation into mining disaster chain issues, covering concepts, basic types, and mechanisms, and proposed practical chain-breaking disaster mitigation measures for specific cases. Zhang [
19] focused specifically on water-related disaster chains in mining, exploring the characteristics of water disasters, the theory and construction of water disaster chains, and targeted measures for chain-breaking disaster mitigation in mine water disaster chains.
In non-metallic mines, Guo [
20] studied geological disasters in gold mines. He explored geological disasters caused by both the mines themselves and human mining activities. He applied the concept of watershed system governance to propose improvement measures for mines from the perspective of disaster chain effects. Shao [
21] analyzed a series of subsequent disasters triggered by heavy rain and floods. By examining the connections between these disasters, he constructed a network model. Through analyzing this model, he identified key disaster events and proposed targeted chain-breaking disaster mitigation measures for non-metallic underground mines affected by heavy rain.
Complex network theory [
22,
23] is a methodology that abstracts the elements and relationships within complex systems and describes and analyzes them using network structures. It provides a way to model complex systems and analyze the topological structures of subsystems within these systems. This approach has been widely applied in risk assessment research.
P. Erdos and A. Renyi [
24] proposed the ER random graph model to describe the topological structure of networks, which is a foundational model in complex network theory. In their classic unweighted random network, the probability of edge connections is fixed, and the degree distribution follows a Poisson distribution. Watts and Strogatz [
22] introduced the WS small-world model, which exhibits small-world properties by combining the high clustering of regular networks with the short path lengths of random networks, and the edges are unweighted. Barabási [
25] proposed the BA scale-free model to explain why the degree distribution in real-world complex networks follows a power-law distribution. This model is characterized by generating unweighted networks with power-law degree distributions through mechanisms of growth and preferential attachment.
In terms of applications of complex network models, Gao [
26] collected all secondary disaster events derived from the landslide disaster chain, built an evolutionary network model that encompasses 31 distinct disaster nodes and 77 connecting edges, and assessed the inherent risks in the landslide catastrophe chain. Guo [
27] proposed a storm surge disaster chain analysis system based on complex networks and Bayesian networks. He used a complex network model to quantitatively analyze the vulnerability, key nodes, and critical transmission paths of the disaster chain complex network. Guo [
28] analyzed 87 rainstorm disasters worldwide, summarized secondary events across 15 urban lifeline systems, constructed a model of rainstorm disaster chains in urban lifeline systems based on complex network theory, and calculated quantitative node risk levels for different parts of the model.
Wang Zhigang [
29] proposed a complex network-based method for analyzing disaster chains caused by oil pipeline leaks. He constructed a disaster chain model, systematically analyzed the leakage disaster chain in a case study, and performed a risk assessment. Wu [
30] studied fire disaster chains in universities, derived disaster events from numerous documents, established a disaster chain model using complex network theory, and provided fire prevention recommendations. Liu [
31] analyzed the disaster chain of a severe rainstorm flood in Zhengzhou using complex network theory, constructing and analyzing a flood disaster network model based on the “7.20” rainstorm event. Lin [
32] quantitatively analyzed disaster chains in metro operations using complex network models.
The application of complex network models to mining disaster chains remains relatively rare. By combining disaster system theory with complex network theory, Feng [
33] built a network evolution model, including 45 distinct disaster nodes and 71 connecting edges through the analysis of a disaster-pregnant environment, disaster-causing factors, and disaster-bearing body of open-pit mine environmental geological, and then identified key nodes and connecting edges in the network according to the structural characteristics of the complex network. Shao [
21] had focused on disaster chains triggered by heavy rain and floods in mines. Wang [
2] had conducted studies on geological disaster chains in open-pit mining areas. Compared to the application of complex network-based disaster chain analysis in urban disaster research, its application in the mining sector remains to be further explored and developed.
In terms of mining safety frameworks and standards, many scholars have carried out relevant research [
34]. There are still gaps between Chinese standards and international standards. The main gaps lie in the completeness of regulatory standards, the systematic nature of risk management, and the depth of employee training [
35]. In the area of regulatory standards, international standards place greater emphasis on preventive measures and continuous improvement mechanisms, while China has gaps in the comprehensiveness and depth of regulatory enforcement. In terms of risk management mechanisms, international standards focus more on dynamic risk assessment and continuous improvement, whereas China still has deficiencies in the systematic and coherent nature of risk management. International standards place greater emphasis on the systematic nature of training and the influence of culture, while China has shortcomings in the depth of training and the promotion of a safety culture. As indicated by the preceding research, while studies on disaster chains and complex networks are extensive, their application to mining, particularly non-coal mining, is relatively limited. However, such research [
36,
37,
38] has begun to emerge in recent years. Most mining disasters are not isolated and often trigger other disasters, forming causal relationships. Therefore, future research on mining disaster chains, in both coal and non-coal mines, is expected to gradually increase.
Traditional mine disaster prevention and control focuses more on single disaster events. It has a less in-depth understanding of the joint prevention and control of upstream and downstream disasters. The disaster chain links possible disasters in the mine system. It forms a network structure through causal management. Quantitative analysis of this network structure identifies key disasters and critical links. These affect the entire network system. Disaster reduction can then be carried out from a global and systematic perspective. This approach is highly targeted, efficient, and significant. This study focuses on a non-coal underground mine in southern Jiangxi Province. It analyzes disaster events triggered by artificial mining activities. Through data collection and analysis, combined with the mine’s actual production conditions, it identifies relevant disaster events. Based on this, the study constructs an evolution model of mining disaster chains and transforms it into a complex network model using complex network theory. A quantitative analysis of this complex network model is performed to identify key nodes and edges, and targeted chain-breaking disaster mitigation measures are proposed. This research offers guidance for mine disaster prevention and control.
2. General Overview of the Mine
The mine is located in the adjacent area of Hunan Province and Jiangxi Province, China, belonging to the Middle Mountain area, where the mountains are steep and the terrain is cut strongly. The ground slope in this area is 20~30°, and the deposit is controlled by regional faults, granite strains, and surrounding rocks, and the mine is developed in the fault zone. The mining area is near the mountain in the north and the valley in the south. The highest elevation is +1100 m, standing in the north of the mining area. The lowest elevation is +220 m, and the terrain is high in the north and low in the south. The slope of the mountain is generally 35~55°, and the maximum can reach 70°. The overall terrain is high in the west and low in the east, high in the north and low in the south, and the minimum erosion base level is +216 m, which is conducive to the drainage of surface water.
The mining area is located in a subtropical humid climate zone, characterized by a mild and moist climate, abundant rainfall, and distinct seasons. The average annual temperature is 22 °C. The extreme highest temperature is 39.6 °C, and the extreme lowest temperature is −3.7 °C. The maximum daily precipitation is 183.9 mm, the average annual precipitation is 1555.4 mm, and the average annual evaporation is 1330.0 mm.
A series of underground workings were being excavated in the deep part of a mine to establish an integrated development system consisting of an adit, vertical shaft, and blind inclined shaft. Based on the occurrence conditions of the orebody and the mine’s production experience, the mine chose the shallow hole retaining method as the mining method. The waste rock was subsequently filled into the goaf. The mining blocks were arranged along the strike, with a length of 50 m, a height of 50 m in the middle section, and a width equal to the thickness of the orebody. The roof pillar height was 3 m, and the funnel structure at the bottom was 5 m high. The pillars between adjacent mining blocks were 6 m wide. Ventilation was achieved through draft ventilation. The ventilation route in the mining area was as follows: fresh air flew from the crosscut through the raise to the mining area, washed the working face, and then the contaminated air was exhausted through the return air raise in the middle of the mining area to the upper middle section along the drift and finally discharged into the return airway.
3. Methodology
3.1. Identification of Disaster Events and Construction of Disaster Chains
This paper employs literature research, event tree analysis, and expert surveys to identify the subsequent disaster events triggered by mining activities in the underground mine and to construct the disaster chains. Firstly, this paper uses the literature analysis method to index the disaster events studied by using the network platform with keywords, selects the relevant accident reports, news, periodical literature, and other materials, collects the disaster events contained in them, and preliminarily identifies various disaster events in non-coal underground mines. Specifically, 34 accident reports of the past 30 years from the emergency management department are collected. Meanwhile, 52 news reports related to non-coal underground mining disasters from industry websites, such as China Safety Data, are selected. In addition, 41 journal articles relevant to the subject are reviewed. The above-mentioned literature and materials provided the basis for the construction of the disaster chain.
Then, the disaster cases, accident reports, and related news of non-coal underground mines are collected. The disaster events contained in the cases, reports, news, and their causal sequence are extracted by the event tree analysis method, and the relevant disaster events are obtained. Finally, the above disaster events are classified and sorted out, combined with relevant experts’ opinions, and the disaster events are deleted, split, integrated, and added. The disaster events of the mine during mining activities are finally obtained. A flow chart of disaster chains construction is shown as
Figure 1.
(1) Literature Research Method
Disasters in non-coal underground mines are characterized by their diverse types and complex, variable disaster chains. The interaction of various disaster-causing factors keeps the entire disaster chain system in a state of continuous development and change, making the identification of disaster events challenging. Moreover, there is a lack of comprehensive statistical data on each disaster event. Therefore, literature analysis is employed to preliminarily identify disaster events in non-coal underground mines.
Keywords such as “mines with fault”, “underground mine risks”, “mine accident”, and “mine disaster” are used as indices to collect literature materials on disaster cases and lessons learned from underground mines both domestically and internationally through channels such as online news reports, government disaster reports, emergency management case libraries, and relevant documents. Disaster events of various types in underground mines are preliminarily identified from these sources.
(2) Event tree analysis Method
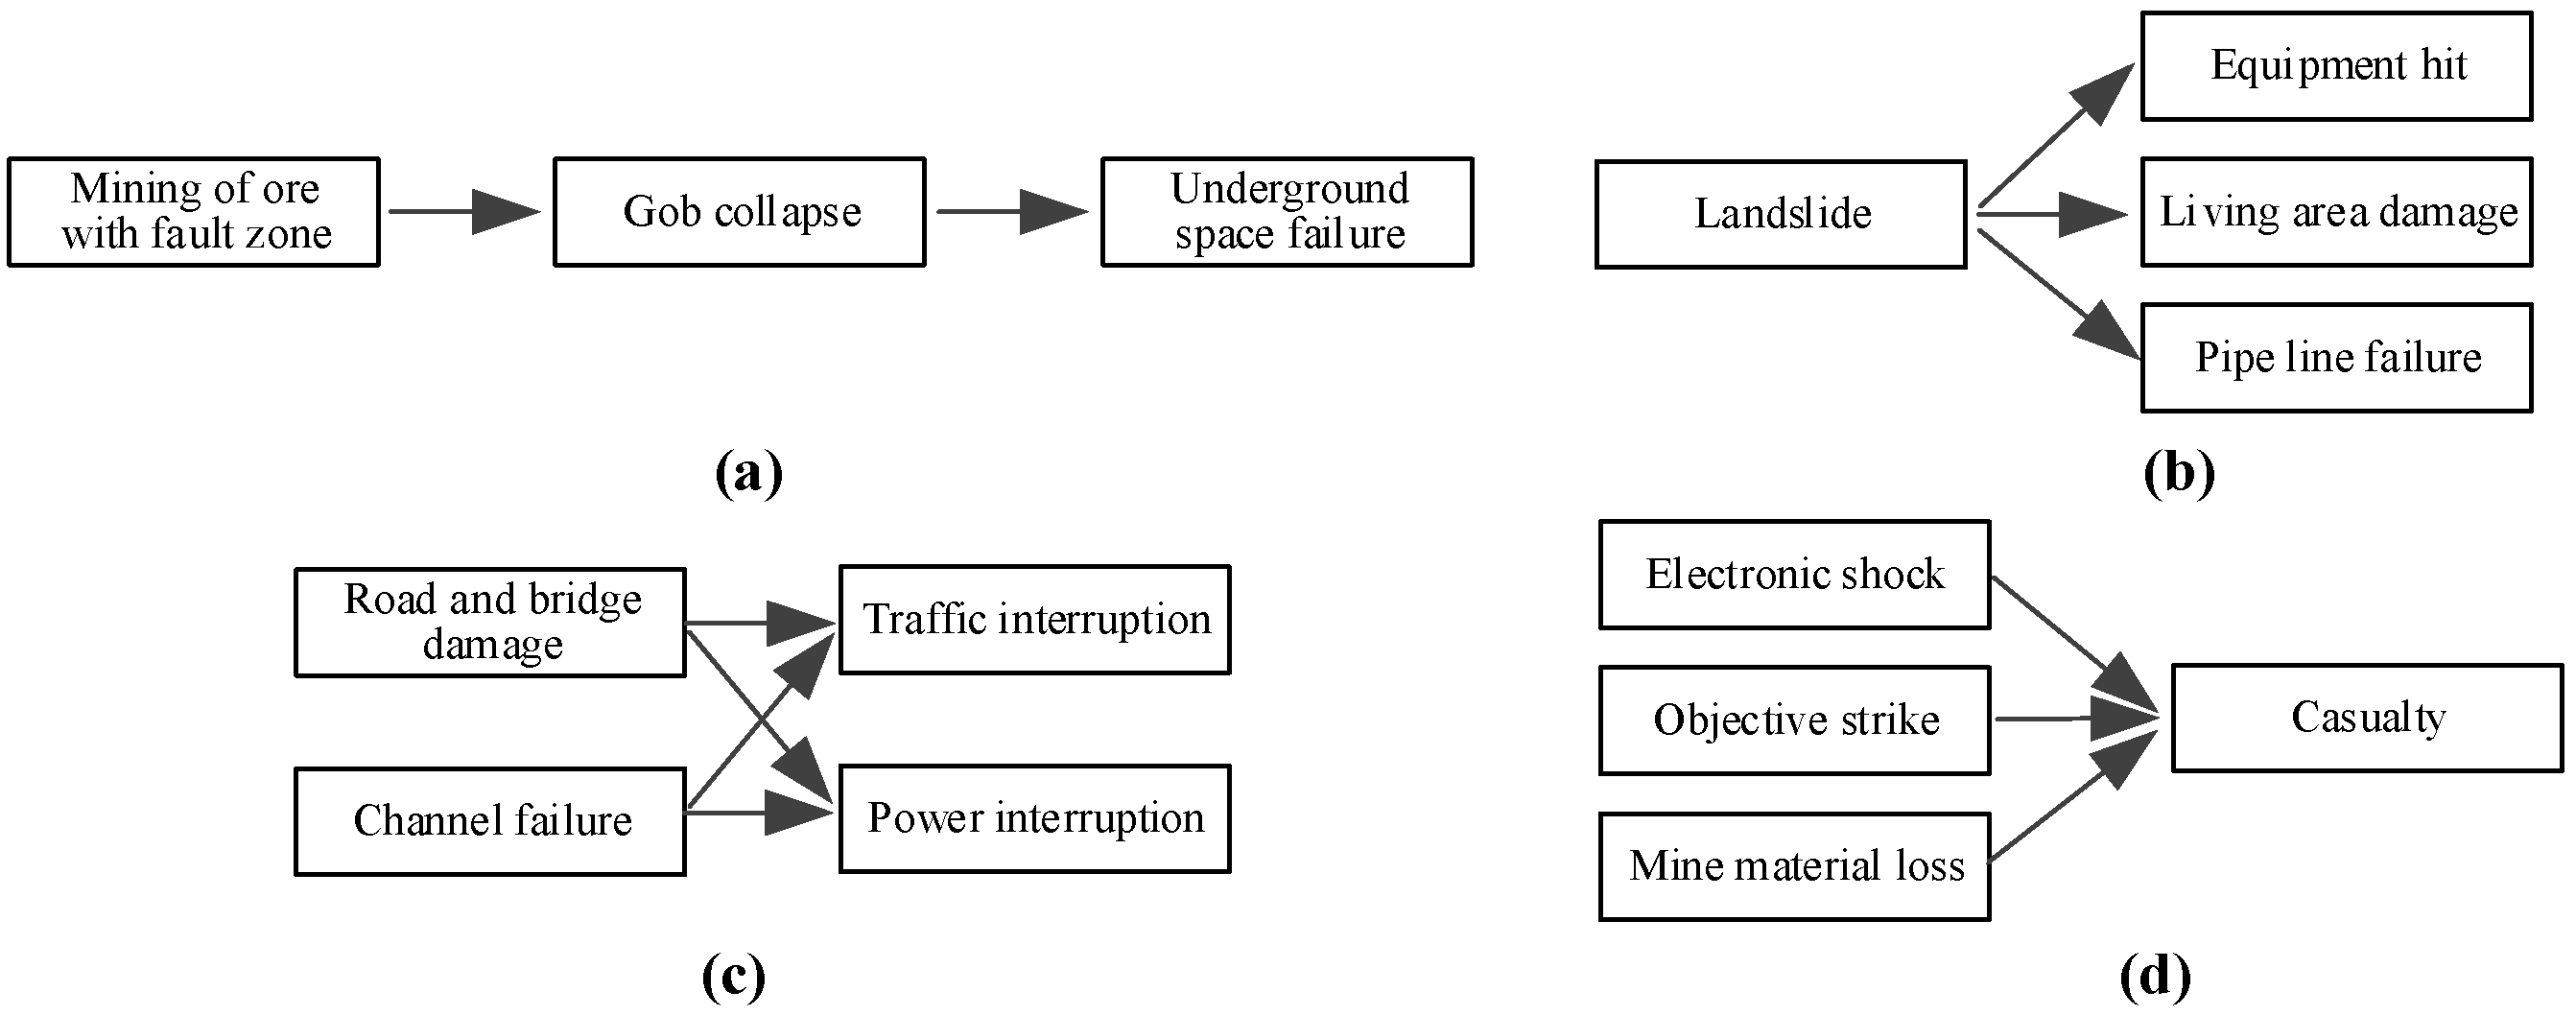
The event tree analysis is a method that infers possible consequences from an initial event in the sequence of accident development, thereby deducing subsequent disaster events [
21]. By applying the event tree analysis method, potential event chains can be identified from disaster cases, which in turn allows for the extraction of objective disaster chains. Using this method to extract disaster chains from case studies ultimately yields the disaster chains for each disaster event, which can supplement the disaster events identified through literature research. The event tree analysis procedure is shown as
Figure 2.
(3) Expert survey method
After the first two rounds of disaster event identification, a written list of disaster events is presented to the experts. In this study, a total of 10 experts are consulted. Among them, 6 experts are mine managers with over 5 years of experience in identifying and preventing mine disasters. The other 4 experts are disaster research experts with nearly 10 years of experience in studying mine disasters. In this study, the Delphi method is employed to integrate the opinions of experts. Through multiple rounds of opinion collection and iteration, the experts’ views gradually reach a consensus. The main issues surveyed among the experts contain 2 aspects:
① Whether the disaster events of existing underground mines are complete, and whether the disaster chain types of disaster events are reasonable.
② Experts are invited to combine their own existing mine risk experience to determine whether the current disaster chain events need to be split, integrated, and supplemented. The main opinions obtained from the experts include the following.
(a) Delete disaster events. For example, remove vehicle damage from disaster events.
(b) Split and integrate disaster events. For example, a landslide collapse in disaster events is divided into two different disaster events, surface collapse and landslide, and house damage and building damage are integrated into house damage.
(c) Add disaster events. For example, adding mine material loss to disaster events.
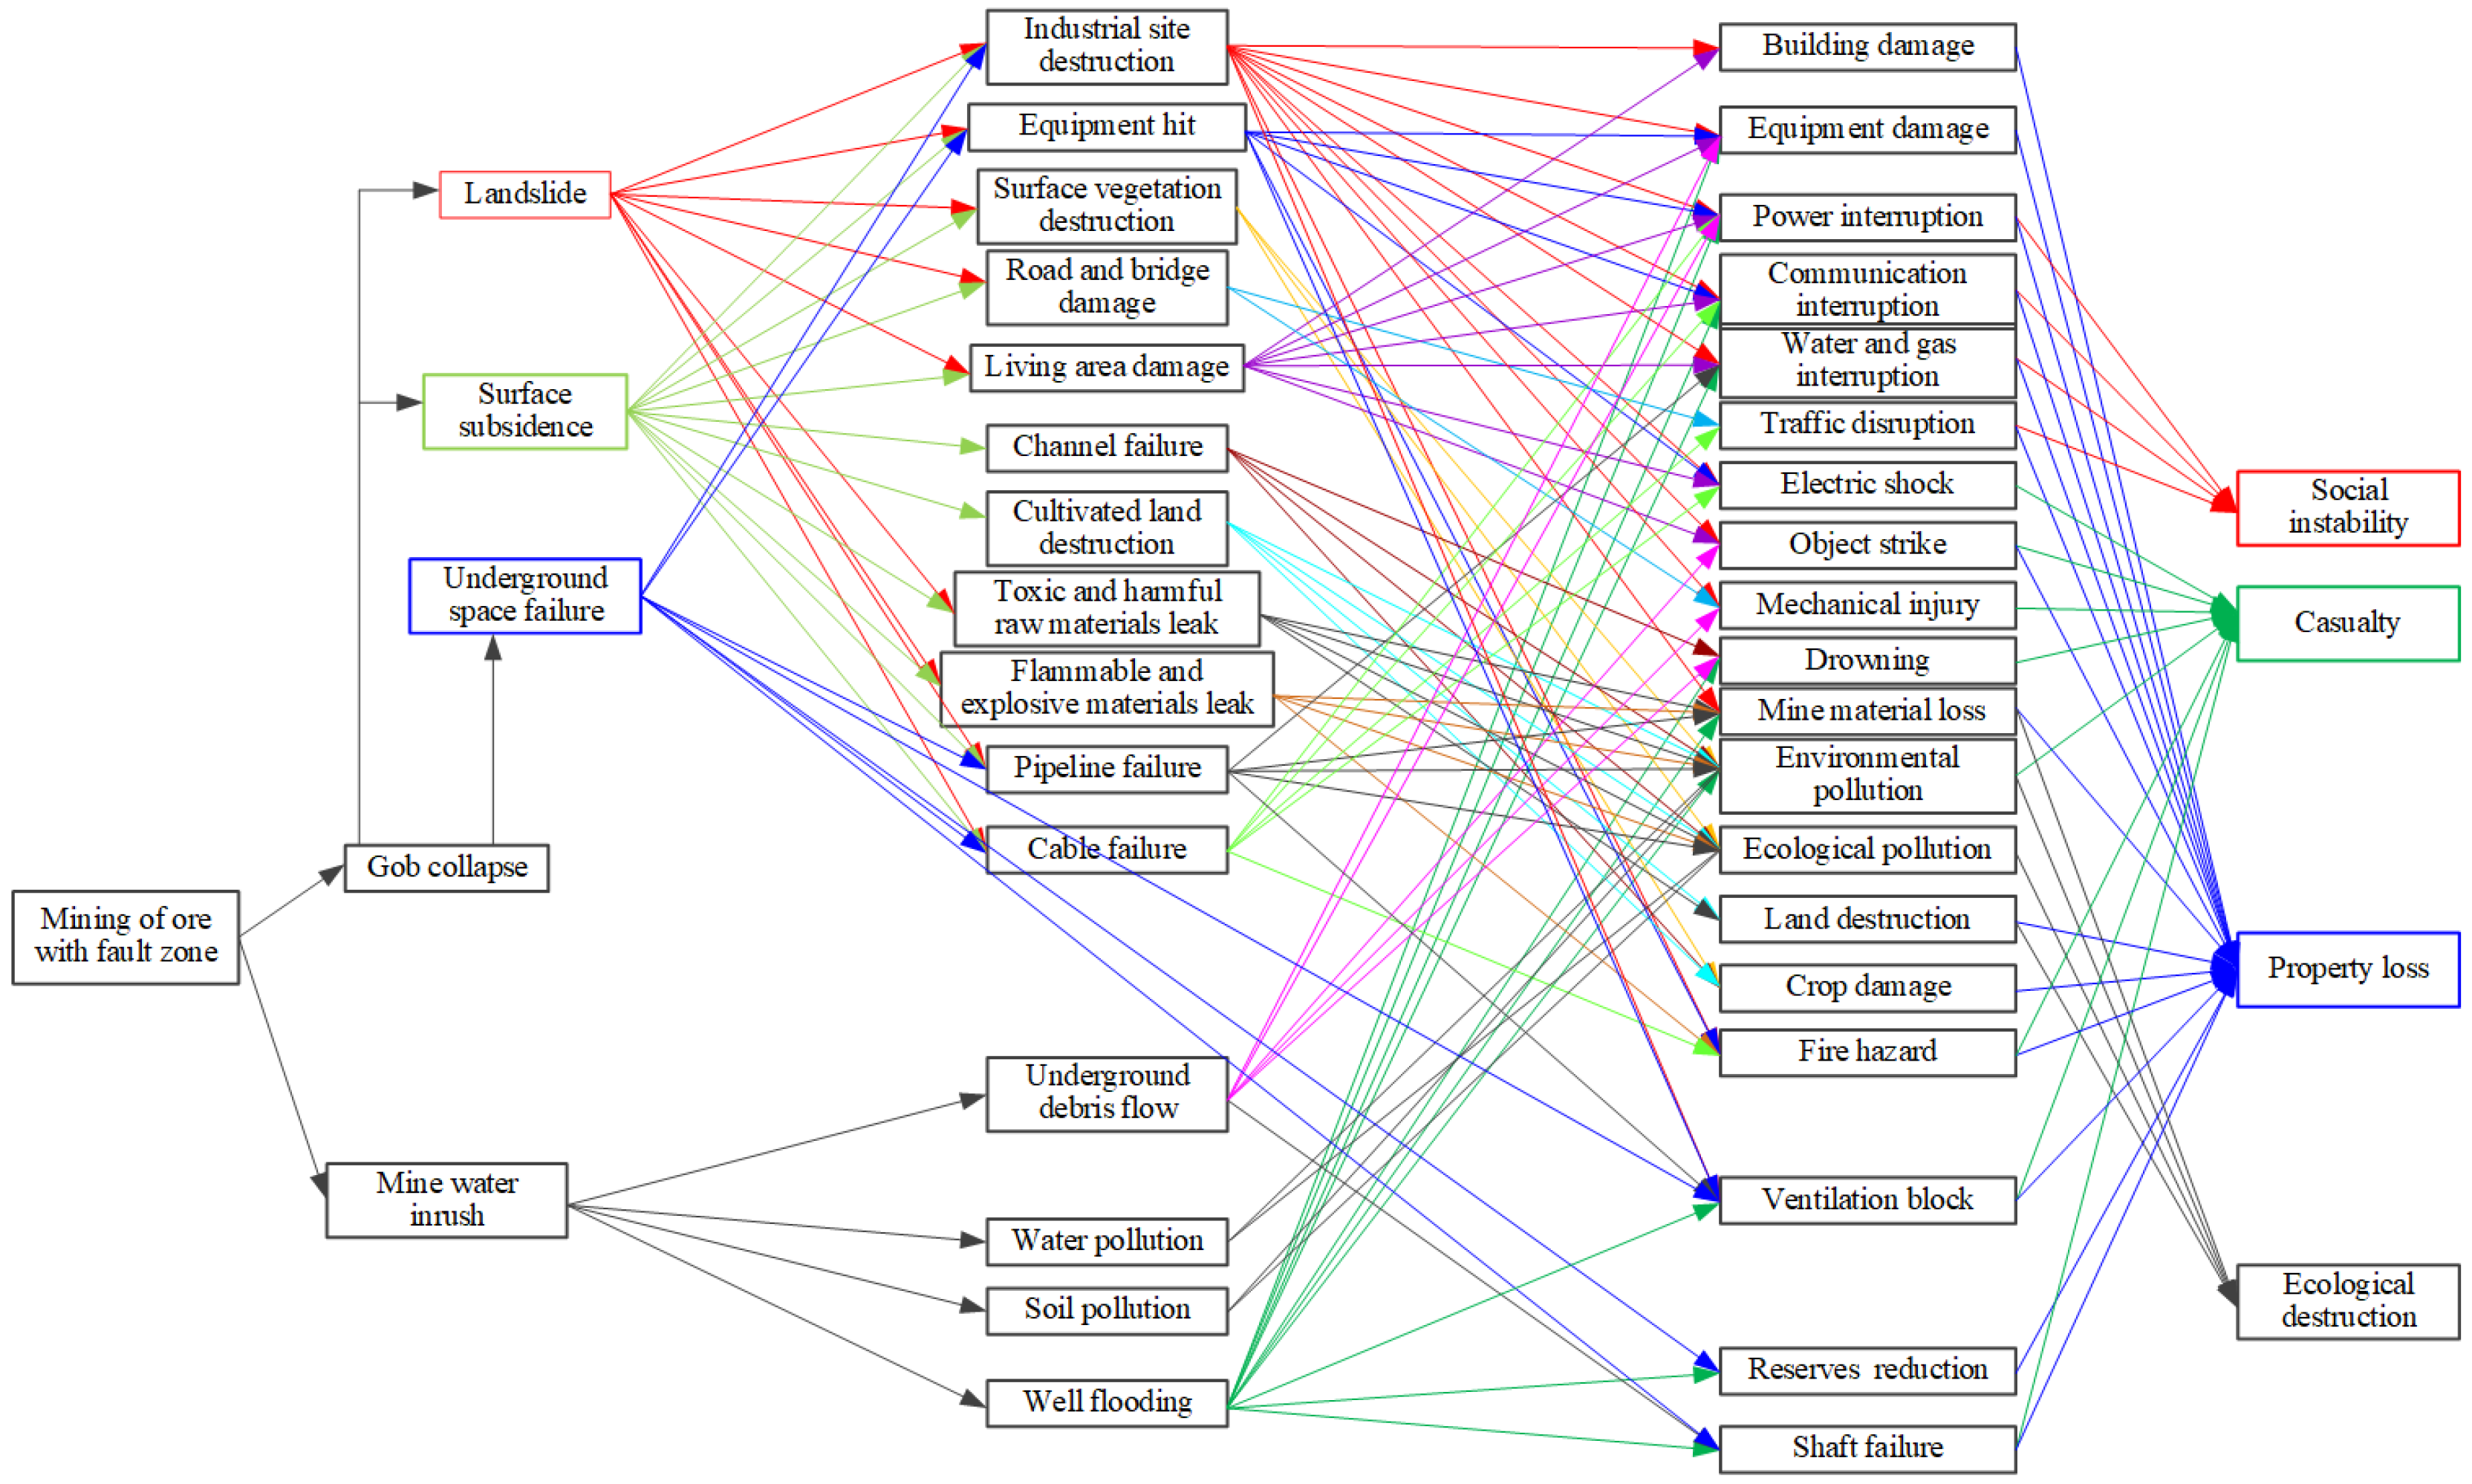
After the identification of disaster events is completed, according to the causal relationship between the events, the disaster events will form a directional connection relationship, so as to form a disaster chain.
3.2. Construction of Complex Network Models
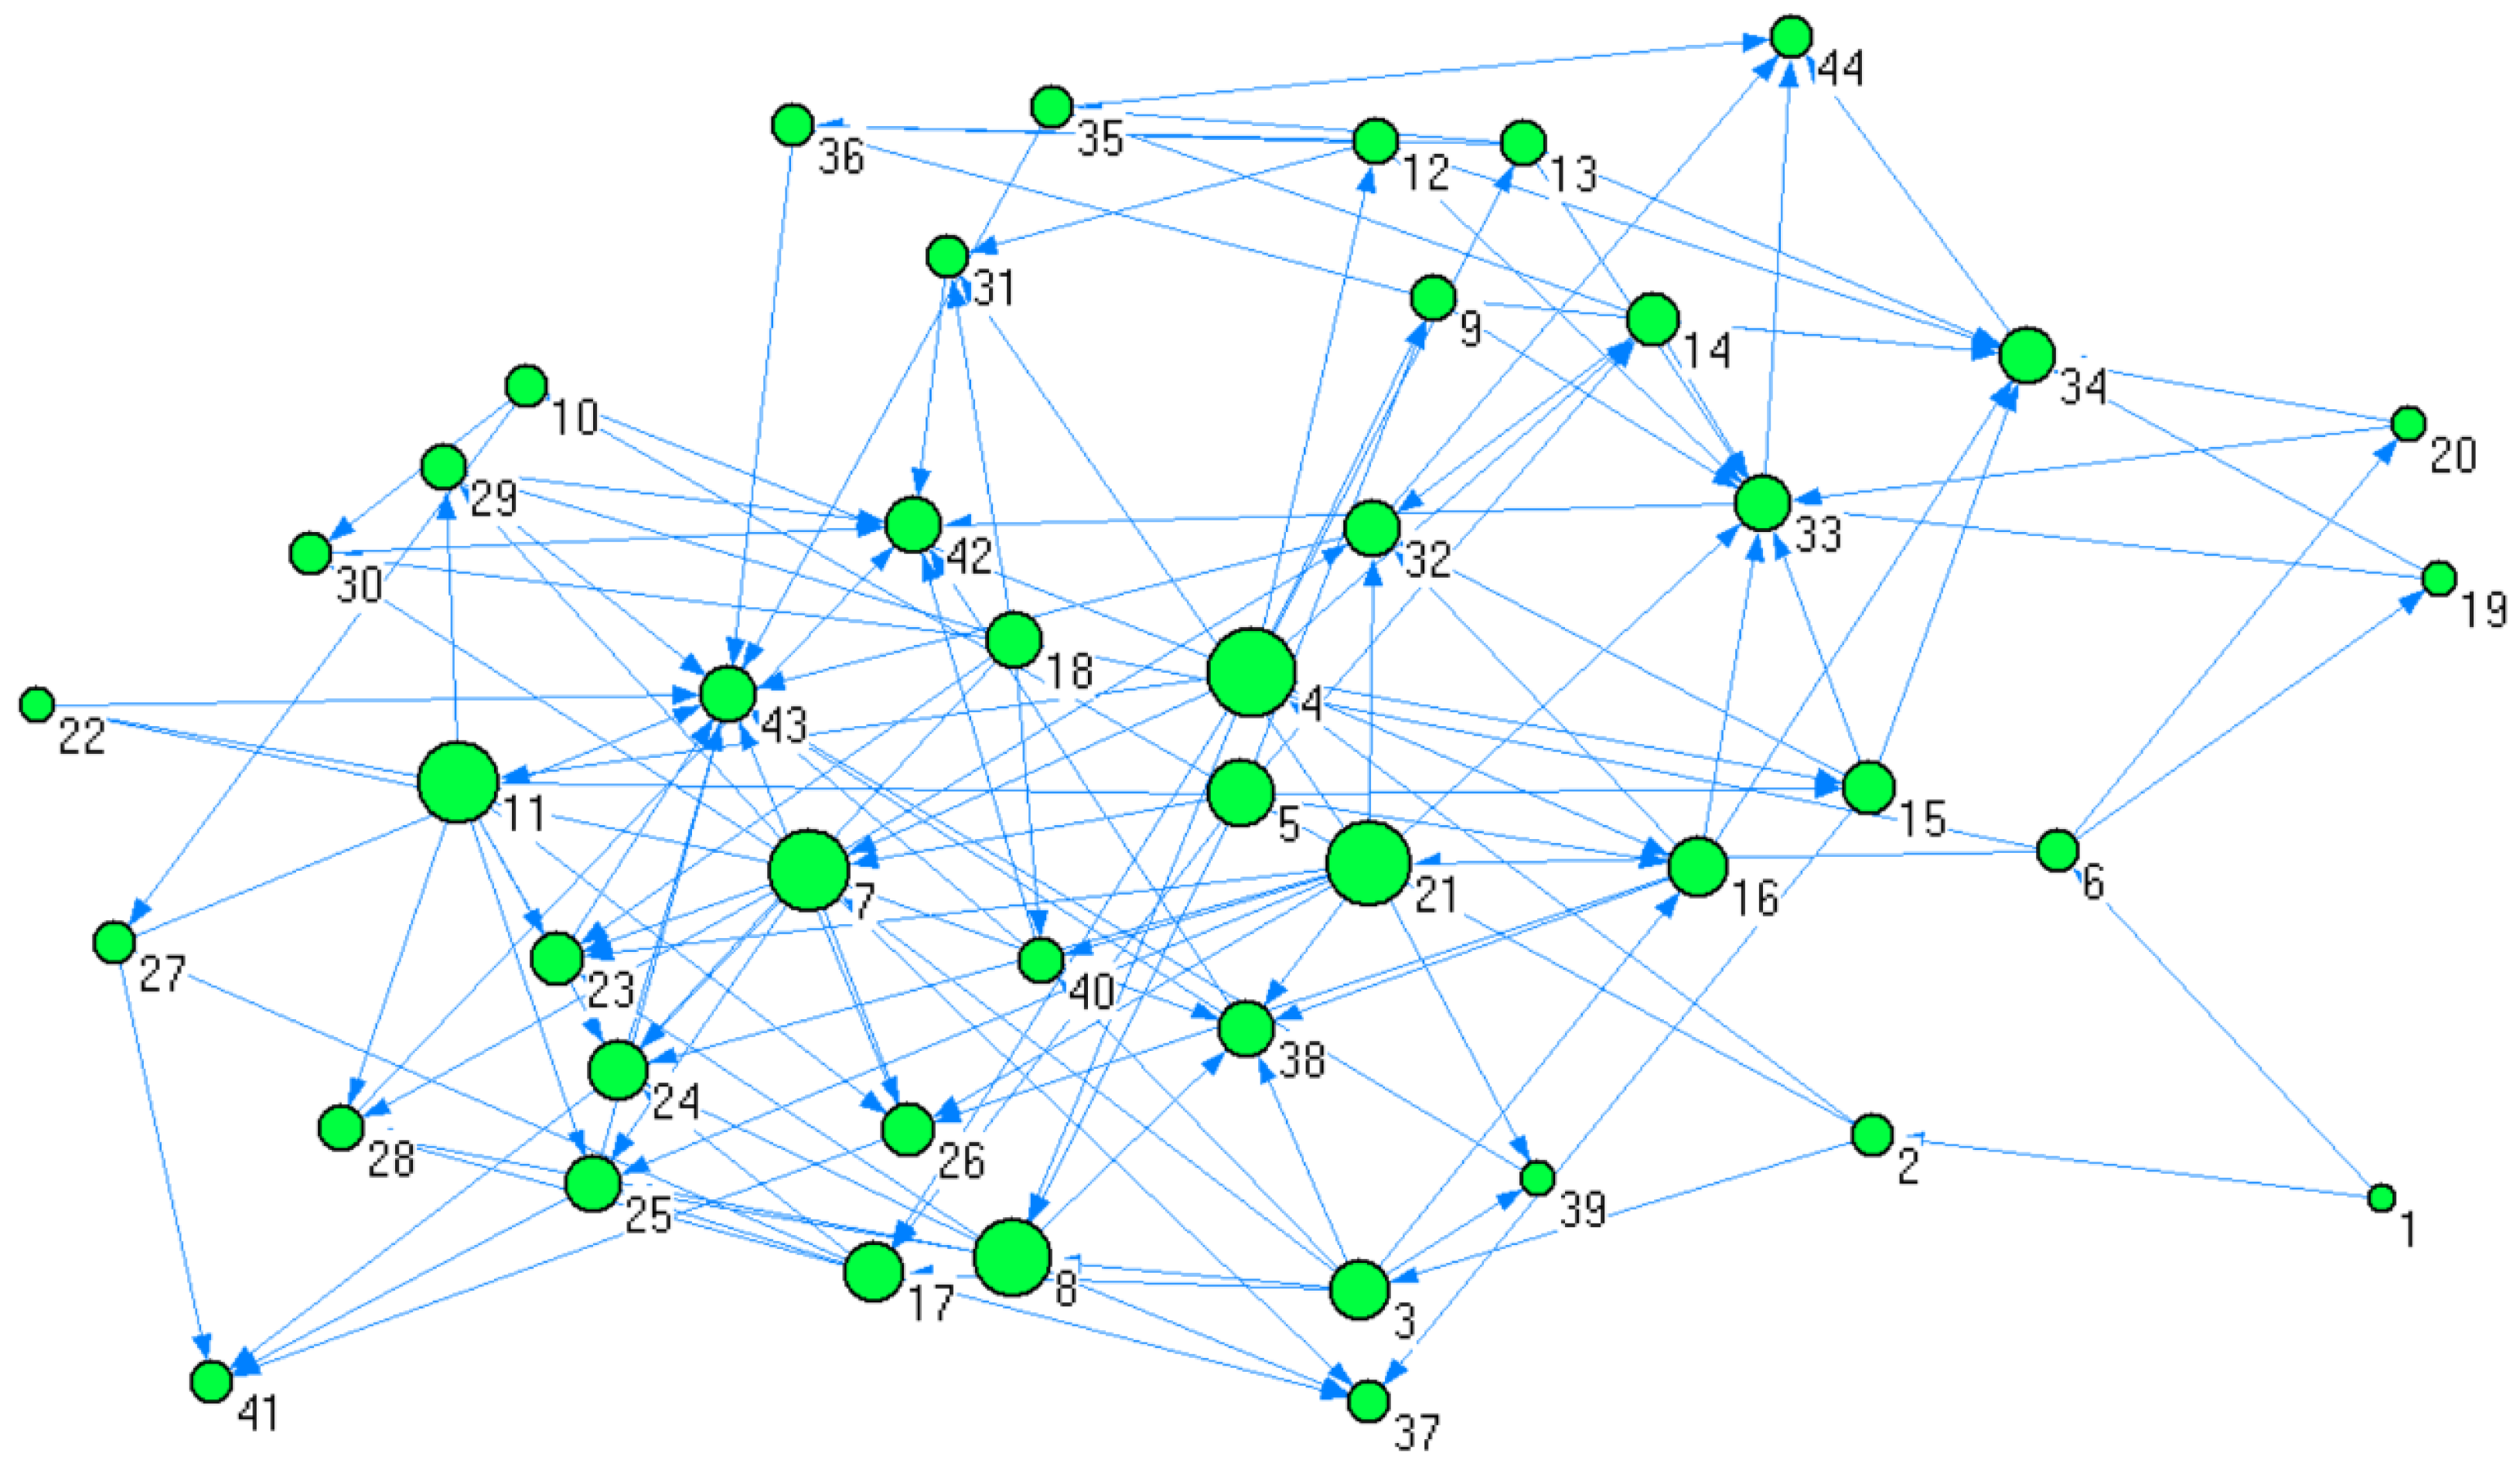
Based on the disaster chains constructed above, the disaster chain can be regarded as a network. The disaster events involved in the disaster chain are abstracted as nodes, and the evolutionary relationships between disaster events are abstracted as directed, with unweighted connecting edges between nodes, thereby constructing a complex network model diagram for each disaster chain. The schematic diagram of the mining disaster chain abstracted into a complex network model using Pajek 1.26 software is shown as
Figure 3.
3.3. Complex Network Analysis
The risk analysis of the complex network of disaster chains mainly targets the nodes and edges within it. The parameters related to complex networks used in the analysis and calculations are shown in
Table 1.
In the complex network of disaster chains, the analysis of nodes and edges is the focus of disaster chain risk analysis, and it is crucial for breaking the chain to reduce disasters. As shown in
Table 1, in the disaster chain network structure model, the main parameters for node analysis include three indicators, namely, node degree, number of subnets, and betweenness centrality. The primary parameter for edge analysis is edge vulnerability, which is influenced by three indicators, namely, edge betweenness, connectivity, and average path length. The detailed explanation and calculation of these parameters are as follows.
(1) Node parameters
The position of a disaster event in the disaster chain network structure varies, and so does its risk level and the extent of its impact on the evolution of the disaster system. These differences are reflected through the node degree, the number of node subnetworks, and the betweenness centrality.
In the disaster chain network model, the number of disaster events that trigger a particular disaster event is referred to as the in-degree of that event, while the number of disaster events triggered by it is its out-degree. The sum of the out-degree and in-degree of a disaster event is its degree value. The calculation method is shown in Equation (1) [
21,
26].
In Equation (1), Di represents the node degree, DRi represents the in-degree, and DCi represents the out-degree.
In terms of the number of node subnets, it is the number of different subnetworks (or connected components) that a node is connected.
In the disaster network, each pair of nodes forms a set of node pairs, and several shortest paths are formed between the node pairs. The expression of the betweenness centrality is shown in Equation (2).
In Equation (2), Bci is the betweenness centrality of node, δ(s,t) is the total number of shortest paths between node s and node t, and δ(s,t|v) is the number of shortest paths from node s to node t that pass through node v.
Based on the above definitions, it can be concluded that the greater the node degree value, the more critical the node is. The larger the number of node subnetworks, the higher the disaster-causing potential of the disaster event represented by that node. The higher the betweenness centrality, the more frequently the node appears on the shortest paths in the disaster chain network, indicating a stronger level of criticality.
However, the three indicators of the node reflect the importance of the node to the network in a certain aspect. A comprehensive consideration should be made by integrating these three indicators to determine the importance of the node in the network. Referring reference [
23], this paper determines the weights of the three indicators, namely, node degree, number of subnets, and betweenness centrality for the comprehensive importance of the node [
23]. After determining the weights of each factor, the comprehensive importance of the node is calculated according to the corresponding proportion. The calculation formula is shown in Equation (3).
In Equation (3), E represents the node importance, Ds represents the degree proportion, and Cs represents the subnetwork number proportion.
(2) Edge parameters
In disaster networks, the importance of edges is typically represented by their vulnerability. The vulnerability of an edge in the network is evaluated and influenced by three indicators, namely, edge betweenness, connectivity, and average path length.
The edge betweenness can be expressed as Equation (4).
In Equation (4), Bi is the edge betweenness of edge i, and n(j,k) is the number of paths between nodes j and k that pass through edge i.
The connectivity can be expressed as Equation (5).
In Equation (5), Hi is the connectivity, ni is the number of nodes that can be reached from node i, and n is the total number of nodes in the entire network.
The average path length can be expressed as Equation (6).
In Equation (6), Li represents the average path length, and di,j represents the shortest distance between nodes i and j.
The vulnerability of an edge is determined by the edge betweenness, connectivity, and average path length, and it can be expressed as Equation (7).
In Equation (7), is the vulnerability of edge i.
5. Disaster Prevention Recommendations
5.1. Prevention of Key Disaster Events
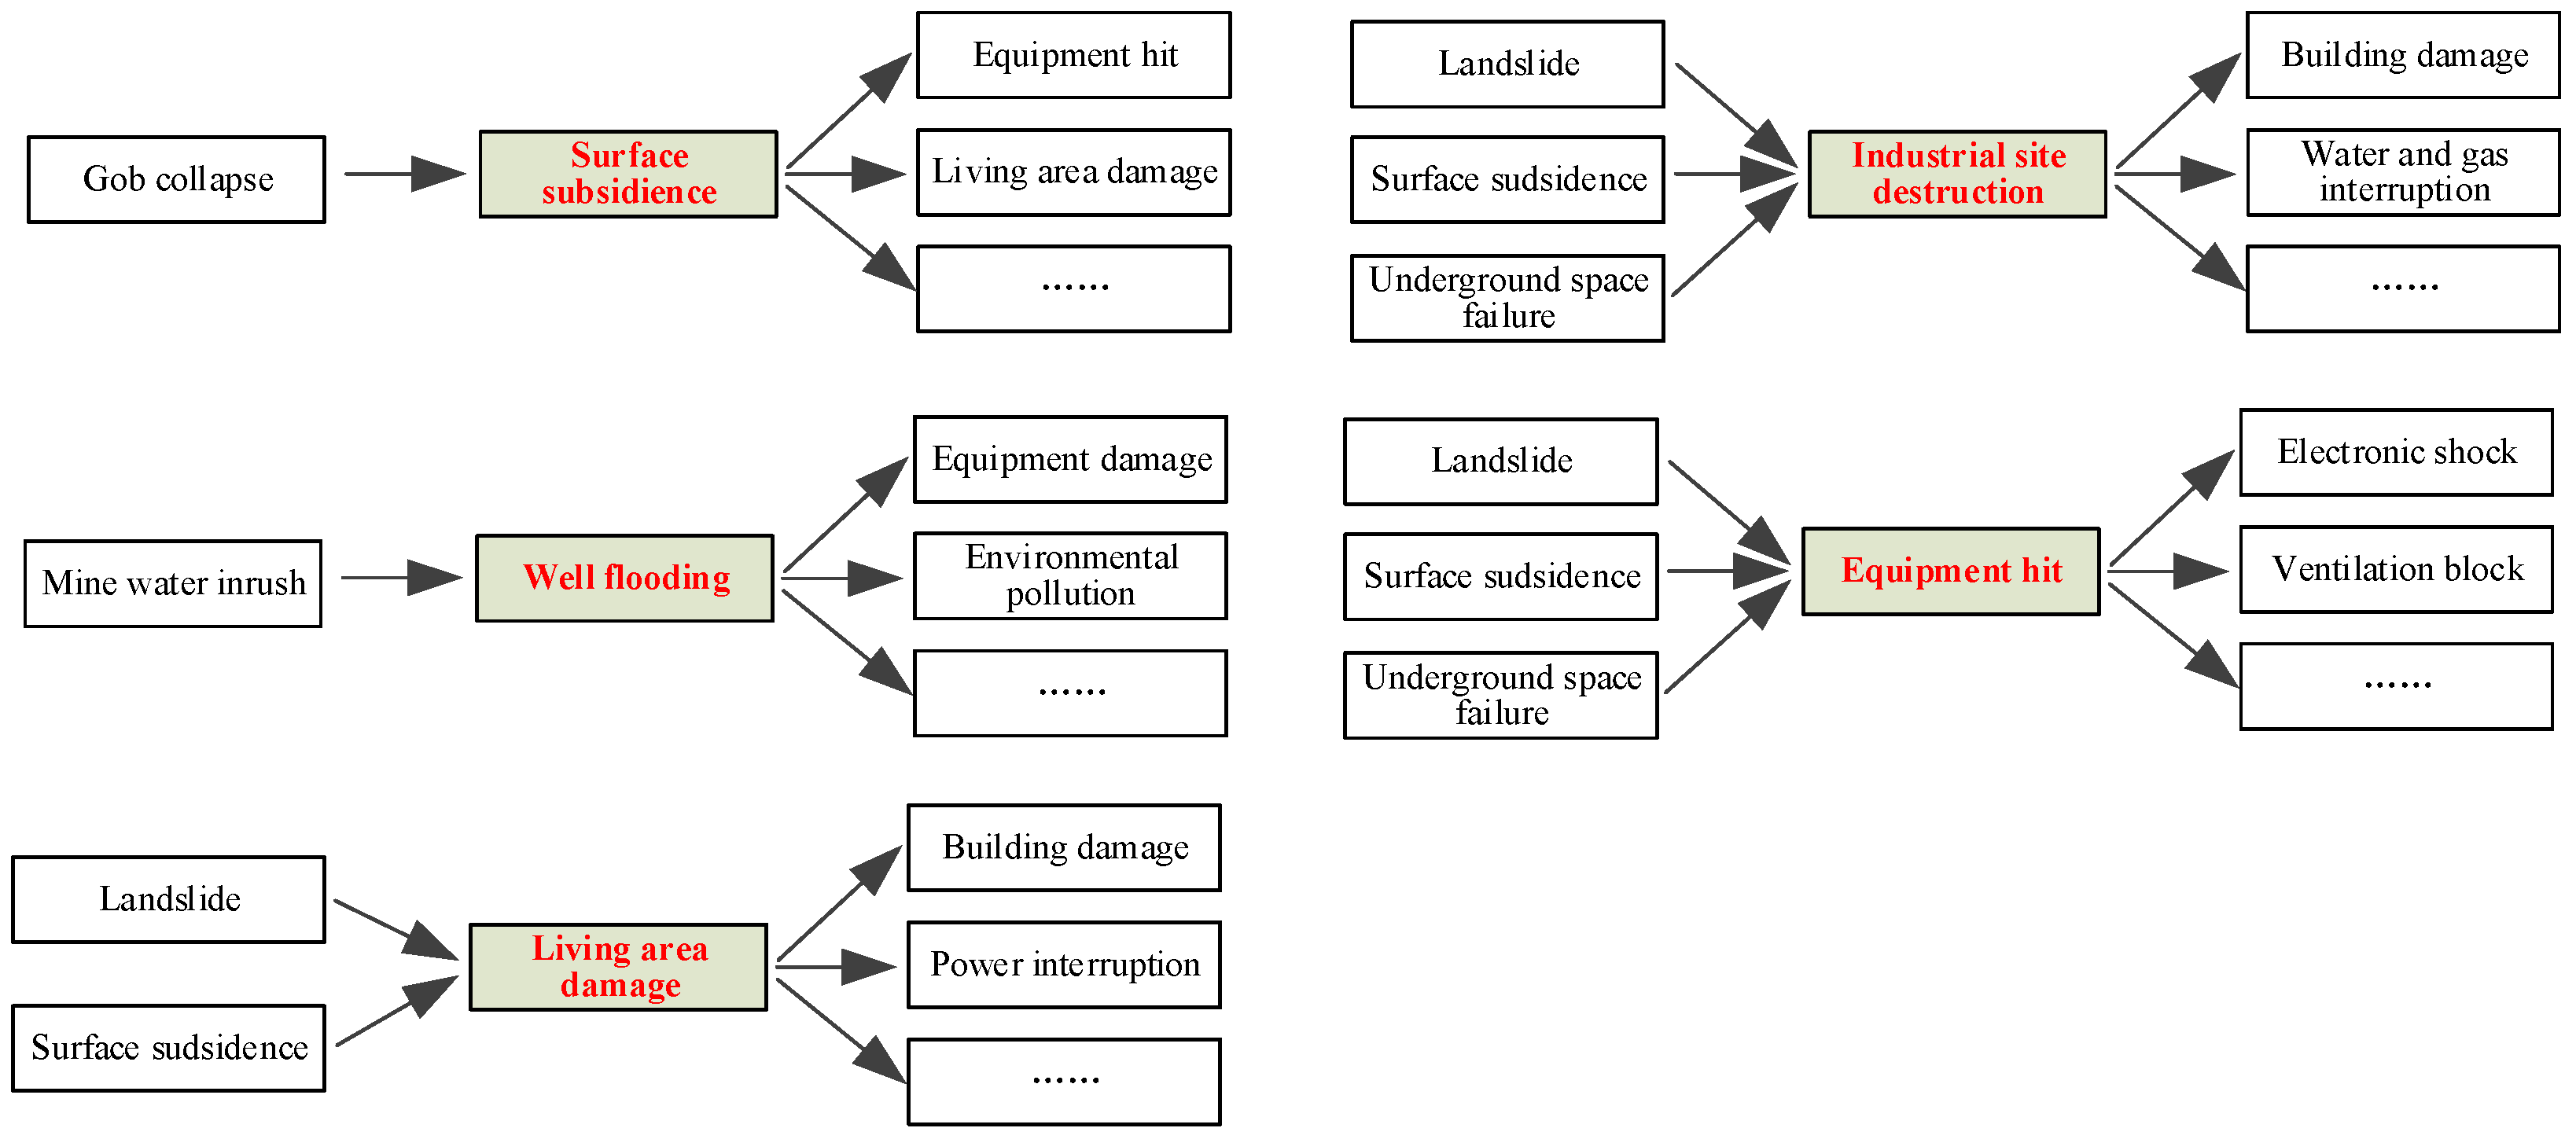
According to the analysis above, surface subsidence (H4), industrial site destruction (H7), well flooding (H21), equipment damage (H8), and living area damage (H11) are the top five key disaster events. For disaster prevention and control, it is recommended to focus on disaster reduction from these five disaster events. Some targeted suggestions are as follows.
(1) Surface subsidence prevention and control
On the one hand, advanced geological detection can be carried out in the mine, the formation stability assessment model can be established by using three-dimensional seismic exploration and other methods, or drilling can be implemented to peer into poor geological areas. On the other hand, a deformation monitoring network can be set up on the surface to monitor surface deformation. In addition, the goaf can be treated, the filling mining method can be adopted, and the goaf roof can be reinforced by grouting. Shotcrete, steel mesh, and other measures can be used to strengthen the rock mass near the fault zone.
(2) Industrial site destruction prevention and control
First of all, it is suggested to adopt a scientific mining design, design or optimize the pillar that plays a supporting role, and backfill the gob to prevent ground collapse and cracks. Secondly, the site structure should be reinforced and dynamically monitored, the foundation of the plant should be strengthened, and the key load-bearing structure should be reinforced with prestressed anchor cables. Thirdly, it is useful to establish an intelligent monitoring system, deploy distributed optical fiber monitoring, and install inclination sensors for real-time early warning. In addition, for new industrial sites, the mine should be located on flat terrain in a geologically stable area and avoid locations with landslides, debris flow, and other disasters.
(3) Well flooding prevention and control
Before mining, it is recommended to carry out detailed geological exploration to understand the hydrogeological conditions of the mine area. It is recommended to reasonably set up waterproof structures, such as anti-dam, waterproof walls, etc., to prevent water damage. It is suggested that in the area where water seepage may occur, grouting plugging technology should be used to block the seepage channel and reduce the risk of water damage. It is recommended to install water level monitoring equipment in the mine to monitor the change in underground water level in real time. It is suggested that the automatic monitoring system should be used to grasp the mine water situation in time. When the monitoring data exceeds the warning threshold, an early warning signal should be issued in time, and a perfect mine drainage system should be established to ensure that the water can be quickly discharged.
(4) Equipment damage prevention
It is recommended that key equipment should be protected, including over-coil protection for the main hoist, vibration monitoring for the ventilator, anti-collision system for the transport vehicle, life cycle management for the equipment, and redundancy configuration for important equipment.
(5) Living area damage prevention
It is recommended to avoid dangerous areas such as cliffs, collapses, floods, debris flow, caving areas, impact areas, and blasting danger areas. The living area should keep a sufficiently safe distance from industrial sites and ground buildings to avoid being affected by industrial activities. The structural strength of the living area, such as the seismic design of the structure, should be strengthened according to the high standard of seismic fortification, and frame–shear wall structures should be used. It is suggested to establish a safety monitoring and early warning system in the living area, install a crack monitor, establish a settlement observation point, and set up an automatic alarm system. It is recommended that residents in living areas be trained in safety knowledge to improve their safety awareness and emergency handling ability, including fire, shock, and lightning protection knowledge.
5.2. Prevention of Key Disaster Chains
The above research shows that mine water inrush (H6)→well flooding (H21), surface subsidence (H4)→industrial site destruction (H7), underground space failure (H3)→industrial site destruction (H7), gob collapse (H2)→surface subsidence (H4), and gob collapse (H2)→landslide (H5) are the top five disaster chains. Some targeted suggestions are as follows.
(1) Mine water inrush (H6)→well flooding (H21)
In view of this disaster chain, multiple ways can be adopted to reduce disasters by breaking the chain. First of all, it is recommended to use 3D geological modeling, borehole radar, and other advanced detection technologies to accurately locate aquifers, karst caves, goaf, and other potential water sources. Then, it is suggested that the high-pressure aquifer should be pre-drained by surface or underground drilling, and the hidden danger should be eliminated by the combination of drilling drainage and grouting sealing for closed goaf water. It is also suggested to use high-pressure grouting to form a water barrier curtain for fault and fissure zones. Thirdly, the capacity of the main drainage system of the mine needs to be 3 times greater than the normal water inflow and equipped with independent dual power supplies; it is recommended to set up emergency drainage silos in the bottom of the well and low-lying areas of the mining area, and configure large flow submersible pumps. Finally, it is suggested to build a multi-element monitoring network, including microseismic, visual, and hydrological components, to capture the precursors of water inrush in mines and implement early warning measures.
(2) Underground space failure (H3)→industrial site destruction (H7)
In view of this disaster chain, it is suggested to establish an underground space monitoring system to monitor the stability of underground space in real time. At the same time, it is suggested to adopt prestressed anchor rods, steel support, and other support measures to enhance the stability of underground space and prevent further expansion of collapse. In terms of the treatment of underground space, it is suggested that the underground space should be treated with grouting to seal the cracks and enhance the stability of rock strata. It is recommended to backfill and reinforce the collapsed area to restore the stability and function of the underground space. It is suggested that effective waterproofing and drainage measures should be taken to prevent groundwater infiltration from damaging the underground space. In terms of damage protection of industrial sites, it is suggested to strengthen the structural strength of industrial sites and strengthen the monitoring and early warning of land subsidence near industrial sites.
(3) Surface subsidence (H4)→industrial site destruction (H7)
The prevention and control of this disaster chain is similar to that of the previous disaster chain. On the one hand, it is necessary to backfill and reinforce the collapsed area to restore the stability and function of the underground space. On the other hand, it is necessary to strengthen the surface settlement observation around the site while strengthening the structural strength of the industrial site, which is also the focus of this work.
(4) Gob collapse (H2)→surface subsidence (H4)
In terms of this disaster chain, it is suggested to adopt support measures such as prestressed anchor rods and steel support to enhance the stability of the goaf and prevent further expansion of the collapse. At the same time, it is suggested to establish a goaf monitoring system to monitor surface subsidence and groundwater changes in real time, find the risk of collapse, and take measures in time. In addition, in terms of mining technology, it is suggested to reasonably control the mining speed, scope, and mode to reduce the damage to underground space. In terms of goaf treatment, it is suggested to carry out grouting treatment in the goaf, seal the cracks, enhance the stability of rock strata, backfill and reinforce the collapsed area, and restore the stability and function of the surface.
(5) Gob collapse (H2)→landslide (H5)
The disaster chain reduction caused by gob collapse in underground mines can start from the key links, such as gob stability control, surface deformation monitoring, and rock and soil reinforcement. First of all, in terms of mining methods, it is suggested to use the filling mining method and other methods to reduce underground stress concentration, reserve security pillars, or to grout the caving zone and fracture zone to enhance the stability of rock strata. Secondly, the method of surface displacement and stress monitoring is suggested to monitor the horizontal displacement, vertical settlement, and sudden strain change in the rock and soil mass of the slope, and adopt multi-parameters to warn of the slope landslide risk. Thirdly, it is suggested to optimize the drainage system of the slope, reduce the infiltration of rainwater into the slope, and carry out engineering reinforcement of the rock and soil body of the slope to strengthen the mechanical properties of the slope. In addition, it is recommended to develop a “sediment-landslide” linkage response process to clarify the evacuation route.
5.3. Other Suggestions
In light of the key nodes and edges discussed above, the disaster prevention for non-coal underground mines with faults hinges on maintaining the stability of underground spaces and the surface. The following suggestions from aspects of technology and regulation are put forward.
From a technological standpoint, it is crucial to enhance real-time monitoring and early warning. A comprehensive real-time monitoring system should be established. If conditions permit, a holistic detection system that includes microseismic monitoring, surface deformation monitoring, groundwater level monitoring, and other multi-faceted methods can be constructed to ensure the immediate capture of subtle changes in the geological structure of the mine. Additionally, research has indicated that the mutual verification of multiple monitoring methods can improve monitoring effectiveness [
40]. Therefore, it is recommended to cross-validate using various monitoring techniques to obtain deformation information and groundwater information of the mine from different perspectives, thereby enhancing the accuracy and reliability of monitoring data. Moreover, multi-source information fusion is an effective way to improve monitoring accuracy. It is suggested to integrate diverse information [
41] such as tectonic stress, displacement, and microseismic data to build an integrated information platform, providing more comprehensive data support for disaster analysis and decision-making.
From a regulatory perspective, key nodes and critical links in the mine disaster chain should be subject to focused regulation. Differential regulatory strategies and measures should be formulated for key regulatory targets, and regulatory resources should be allocated rationally to improve regulatory efficiency. Regular inspections and irregular patrols of key risk areas in mines, such as goafs, fault zones, and slopes, should be strengthened. A unified mine data regulatory platform should be established to upload real-time monitoring data, hazard investigation data, production activity data, and other relevant information to the platform, achieving data sharing and collaborative regulation. Regulatory authorities can use the platform to monitor the risk status of mines in real time, promptly grasp the safety production dynamics of mines, and ensure safe mine production.
6. Conclusions
This paper studied the disaster chain of a non-coal underground mine. It identified disaster events and creatively constructed a complex network model of disaster chains for a non-coal underground mine with faults induced by mining activity. Then, it performed a quantitative analysis of the complex network model and innovatively identified key nodes and key edges of the complex network. Finally, it proposed chain-breaking disaster mitigation measures. The conclusions can be drawn as follows.
(1) This paper constructs a complex network model of the disaster chain of an underground mine with fault zones triggered by mining activities, which contains 44 disaster nodes and 136 connecting edges.
(2) The top five key nodes of the disaster chain are surface subsidence (H4), industrial site destruction (H7), well flooding (H21), equipment damage (H8), and living area damage (H11).
(3) The top five key edges of disaster chain are mine water inrush (H6)→well flooding (H21), surface subsidence (H4)→industrial site destruction (H7), underground space failure (H3)→industrial site destruction (H7), gob collapse (H2)→surface subsidence (H4), and gob collapse (H2)→landslide (H5).
(4) This paper gives some targeted disaster prevention recommendations. Among them, enhancing the exploration of the geological structure of the mine, strengthening real-time monitoring of the surface, and grouting treatment of faults are particularly important.
This paper investigates the disaster chains of non-coal underground mines with faults using a simplified model. However, due to limitations in data availability and completeness, we have treated the edges representing the disaster chains in the complex network as equally weighted. This approach may lead to some discrepancies between the results and reality. In the future, we will further explore how to quantify the likelihood of different disaster chains occurring and assign weights to the edges of the disaster chain network model, thereby enhancing the accuracy of the disaster chain research outcomes.


