Article

The Influence of Customer ESG Performance on Supplier Green Innovation Efficiency: A Supply Chain Perspective

1
School of Economics and Management, Central South University of Forestry and Technology, Changsha 410004, China
2
Institute of Green Development of Hunan Province, Changsha 410004, China
3
Research Base for Ecological Civilization Construction of Hunan Province, Changsha 410004, China
4
School of Business and Creative Industries, University of the West of Scotland, Paisley PA1 2BE, UK
*
Author to whom correspondence should be addressed.
Sustainability 2025, 17(12), 5519; https://doi.org/10.3390/su17125519
Submission received: 2 May 2025 / Revised: 9 June 2025 / Accepted: 10 June 2025 / Published: 16 June 2025

Abstract

:
The present study examines the impact of customer firms’ environmental, social, and governance (ESG) performance on suppliers’ green innovation efficiency, grounded in stakeholder theory and innovation diffusion theory. The DEA-SBM model is employed to measure green innovation efficiency and analyze transmission mechanisms through knowledge spillovers, financing constraints, and the moderating roles of executives’ green cognition and digitization. This analysis is based on panel data from 3134 customer–supplier pairs of China’s A-share listed firms from 2014 to 2023. The findings indicate that high ESG performance by customer firms has a substantial impact on suppliers’ green innovation efficiency, with a 1% increase in customer ESG score resulting in a 1.38% improvement in supplier efficiency. The phenomenon under scrutiny is hypothesized to be precipitated by knowledge spillovers and mitigated by reduced financing constraints. The hypothesis further posits that supplier firm executives’ green cognition and customer digitization will amplify the effect. A heterogeneity analysis reveals stronger effects in technology-intensive firms and regions with higher governmental environmental oversight. These findings underscore the pivotal function of ESG-driven supply chain collaboration in propelling sustainable industrialization. It is imperative that policymakers prioritize cross-regional ESG benchmarking and digital infrastructure to amplify green spillovers. Conversely, firms must integrate ESG metrics into supplier evaluation systems and foster executive training on sustainability. This research provides empirical evidence for the optimization of green innovation policies and the achievement of China’s dual carbon goals through the coordination of supply chain governance.

1. Introduction

Accelerating the green transformation of the development mode and promoting the greening and decarbonization of the economy and society are key initiatives to achieve high-quality development, according to the report of the 20th Party Congress People’s Daily [1], 2022-10-26 (01). This aligns with the findings of the International Energy Agency (IEA, 2021) [2], which emphasizes the necessity of transitioning to sustainable energy systems to mitigate climate change impacts. In the 14th Five-Year Plan, China’s government explicitly proposes to build an ecological civilization system, and promotes the comprehensive green transformation of the economy and society as one of the key tasks. Enhancing the efficiency of enterprise green innovation is an important way to achieve the strategic goal of peak carbon and carbon neutrality, which is of great significance for accelerating the greening and low-carbonization of economic and social development. Therefore, accelerating the level of green technological innovation of enterprises has become the focus of attention of the academic community and at the decision-making level.
Environmental, social, and corporate governance (ESG) performance has become a key indicator for measuring corporate social responsibility and long-term development potential [3]. In recent years, with the deepening understanding of ESG performance by enterprises and society, enterprises have gradually integrated improving their ESG performance into their supply chain management systems to enhance their competitive advantages [4], solidify the foundation of their supply chains, and improve the robustness and resilience of their supply chains. With China’s “double carbon” goal of achieving peak carbon by 2030 and carbon neutrality by 2060, the urgency for enterprises to take green actions in supply chain management has been further emphasized [5], and the impact of ESG performance on promoting green innovation has become more and more important [6].
In order to promote green technological innovation, the state has issued a series of policy documents aimed at improving the market-oriented green technological innovation system, accelerating the research and development and popularization of energy-saving and carbon-reducing technologies, and proposing the goal of further strengthening the main body of green technological innovation in enterprises by 2025. It also puts forward the goal of realizing the further growth of enterprises’ green technology innovation by 2025 [7]. In light of these considerations, client companies are likely to transfer environmental pressures to upstream suppliers through supply chain management in order to meet compliance requirements, thereby promoting green innovation investment. Yu Fei [8] utilized Chinese manufacturing data to verify the hypothesis that corporate green innovation gains government support by enhancing organizational legitimacy. This, in turn, forms a virtuous cycle of “policy incentives—green innovation—new policy incentives”. Green innovation by enterprises has the double externality of a spillover effect and external environmental cost, which underpins its important role in the development of social greening. Therefore, the study of corporate green innovation should not only focus on its internal innovation activities, but should also extend to the upstream and downstream of the supply chain, and promote the diffusion of green technology through the synergistic effect of cross-fertilization, so as to obtain greater indirect benefits.
Nevertheless, while the emerging body of literature on the linkages between ESG and green innovation has yielded valuable insights, it remains predominantly confined to analyses at the level of individual firms or industries. This focus disregards a critical dimension—the potential for synergistic ESG effects within supply chains. While the significance of supply chains for sustainability is increasingly acknowledged, prevailing research largely adopts a client/core firm-centric perspective. Consequently, systematic investigations into how client ESG performance transmits to and influences supplier green innovation efficiency are notably scarce—a gap also reflected in international research. For instance, Akhtar’s study on clean technologies and environmental policy [9], while examining regulatory impacts on green innovation, did not account for supply chain interactions.
Addressing this critical gap, our study makes a distinct and original contribution by pioneering an investigation into the empowerment effect of client ESG performance on supplier green innovation efficiency through a dedicated supply chain interaction lens. Utilizing a dataset that encompasses Chinese A-share listed clients and their suppliers from 2014 to 2023, we transcend the prevailing intra-firm or client-centric focus in two pivotal ways that define the novelty of our research. First, the specific transmission mechanisms through which high-performing ESG clients actively empower their suppliers’ green innovation capabilities are revealed. These mechanisms include knowledge spillovers, financing constraint alleviation, executive cognition, and digitalization. This multi-mechanism perspective directly addresses the paucity of research on ESG-driven innovation dynamics across firm boundaries within supply chains, offering a more profound and systemic understanding of ESG’s cross-organizational influence. Secondly, and equally innovatively, the analytical focus is shifted from the sheer quantity of green innovation to its efficiency. By adopting green innovation efficiency as the core dependent variable, we can precisely capture a supplier’s ability to optimize resource utilization, control costs, and convert inputs into valuable green outputs during the sustainability transition. This methodological decision provides a more nuanced and performance-oriented measure, as well as actionable insights for policymakers seeking to design effective green incentives and for firms formulating sustainable supply chain strategies.
The paper’s framework is structured as follows: Section 2 reviews the extant literature on ESG and innovation, highlighting theoretical gaps in the existing body of work, with a particular focus on the supply chain and cross-organizational aspects. In Section 3, a model is constructed that is based on stakeholder and innovation diffusion theory. This model hypothesizes the existence of mediation effects, such as knowledge spillovers and financing constraints, as well as moderation effects, including executive green cognition and digitalization. These effects are believed to influence the relationship between client environmental, social, and governance (ESG) factors and supplier innovation efficiency. Section 4 utilizes DEA-SBM models to assess green innovation efficiency, employing A-share data from 2014 to 2023. The chapter designs baseline regression, mediation, and moderation tests. Section 5 provides substantiation for these hypotheses, addresses endogeneity through the use of instrumental variables and propensity score matching, and conducts heterogeneity analyses (firm type/government environmental concern). The Section 6 of this study offers a synopsis of the findings and puts forward a series of policies tailored to the specific needs of stakeholders. According to Section 7, future research should be directed toward cross-country comparisons, dynamic ESG evaluation, and digital collaboration. This end-to-end design integrates theoretical, methodological, and policy insights, thereby establishing a systematic analytical framework for green supply chain development.

2. Literature Review

2.1. Corporate ESG Performance

With the aggravation of global climate change, environmental protection has become a global consensus, and ESG, as a comprehensive concept of sustainable development, has become an important reference standard for corporate investment decisions, and an important indicator of corporate social responsibility and long-term development potential. Existing studies have mainly explored corporate ESG performance from two directions—first, the factors affecting corporate ESG performance, and second, the consequences of corporate ESG practices [10].
In terms of influencing factors, most of the studies focus on the internal characteristics of enterprises, such as executive pay gap [11], executive academic background [11], team heterogeneity [12], technological background [13], and political background [14], etc. These factors have been widely recognized as having a significant impact on firms’ ESG performance. These factors are widely recognized as having a significant impact on corporate ESG performance. As for the consequences of ESG practices, the findings can be categorized into two levels: internal and external. Internally, corporate ESG performance has a significant impact on financing costs [15], financial performance [16], enterprise value [17] and innovation ability [18] have significant impacts. In addition, ESG performance also has a profound impact on the external environment of enterprises, and related studies have shown that ESG has a significant impact on the digital transformation of enterprises [19]; tax reform [20], government subsidies [21], and other external factors are closely related, and these mechanisms also affect the ESG performance of enterprises.

2.2. Green Innovation Efficiency

Green innovation realizes a win–win situation between economic growth and environmental protection through changes in technology, products, and strategies, the core of which lies in greatly improving the ecological environment and generating significant positive externalities [22]. Green innovation efficiency not only emphasizes the environmental friendliness of innovation activities, but also pays attention to its efficiency in resource utilization and environmental performance, which is a key indicator for measuring the quality of green innovation. In recent years, with the depth of research, the concept of green innovation efficiency has gradually become clear, and has become a focus of attention for academics and policymakers.
Regarding the influencing factors of green innovation efficiency, studies mainly focus on both external and internal aspects. External factors include financial support, environmental regulation, industrial agglomeration, and digital finance. Studies have shown that the government can effectively improve the green innovation efficiency of enterprises through environmental regulation and R&D subsidy policies [23]. Industrial agglomeration also positively affects green innovation efficiency through technological spillovers and resource sharing [24], while the development of digital finance provides more financial support for enterprise innovation, which further contributes to the improvement of green innovation efficiency [25].
In terms of internal factors, the digital transformation of enterprises [26], R&D investment [27], and human capital [28] are regarded as important endogenous driving forces to promote the improvement of green innovation efficiency. In high-tech industries, the intensity of R&D investment in terms of green innovation efficiency shows a certain threshold effect [29], while the relationship between enterprise R&D investment and innovation efficiency tends to show an inverted “U” [30]. This implies that excessive or insufficient R&D investment will have a negative impact on green innovation efficiency, and that maintaining an appropriate investment intensity is the key to achieving the optimal effect.

2.3. Corporate ESG Performance and Green Innovation Efficiency

The results of existing studies on the relationship between firms’ ESG performance and green innovation efficiency have not yet been agreed upon. Some scholars believe that good ESG performance can significantly enhance the quality and quantity of the green innovation of enterprises, thus improving their competitiveness in green innovation. Studies have shown that by improving ESG performance, firms are able to enhance their investment in green innovation and leverage external resources such as government subsidies or financing support [31], further enhancing the effect of green innovation.
However, some studies have also found that in order to cater to the market’s preference for ESG, firms may formally increase the quantity of green innovations, but the actual quality of innovations may decline, a phenomenon known as the “green bubble” [32]. In addition, other studies have shown that there is a U-shaped relationship between ESG performance and green innovation, i.e., a firm’s ESG performance may have a dampening effect on its innovation efficiency after reaching a certain level [33]. This implies that although ESG performance has a facilitating effect on green innovation, over-reliance on ESG performance may have a negative effect. Therefore, in the process of promoting green innovation, enterprises should maintain a moderate emphasis on ESG performance to avoid affecting the quality of innovation by overemphasizing formalism.
In the study of enterprise performance, the relationship between green innovation and enterprise performance also shows a certain lag; in the short term, the impact of green technological innovation on enterprise performance may be more limited, or even show a negative effect, but in the long term, green innovation has a positive driving effect on enterprise performance. This finding provides an important theoretical basis for enterprises to formulate long-term innovation strategies.
In summary, the academic community has not yet reached a consensus on the relationship between ESG performance and green innovation efficiency due to the industry specificity of the research topics and the differences between ESG and green innovation measurement indicators. Existing research provides a solid theoretical foundation and empirical reference for this paper, but most of the literature focuses on the impact of companies’ ESG performance on their own green innovation, with few analyses from a supply chain perspective.
The marginal contributions of this paper are mainly reflected in the following aspects: First, most existing studies focus on ESG performance within the enterprise and its role in green innovation, and are less often extended to the level of the whole supply chain, especially upstream and downstream enterprises. This paper breaks through this limitation and delves deeper into the supply chain to reveal how ESG performance empowers the structure and resources of supply chain firms through mechanisms such as knowledge spillover effects, financing constraints, executive perceptions, and digitization, thus affecting suppliers’ green innovation efficiency. This not only fills the research gap on the relationship between ESG performance and green innovation at the supply chain level, but also provides new perspectives for understanding the role of customer firms in driving suppliers to engage in sustainable practices. Through this perspective shift, this paper more comprehensively assesses the diffusion effect of ESG practices across the business ecosystem and provides a theoretical foundation for the development of more effective sustainability strategies. Second, most existing studies have focused on the number of green innovation outputs, and few have explored the impact of ESG performance on green innovation efficiency [34]. In this paper, we take “green innovation efficiency” as a key variable to explore how ESG performance affects the green technology transformation of enterprises, especially their comprehensive capabilities in resource utilization, cost control, and technology transformation. The results of this paper not only provide a scientific basis for the government to formulate relevant policies, but also provide a reference for enterprises to formulate more effective sustainable development strategies and promote the transformation of industrial structure to a more efficient and low-carbon direction, thus making up for the lack of the current research on green innovation efficiency and enhancing the practical significance of the research.

3. Theoretical Analysis and Research Hypotheses

The 
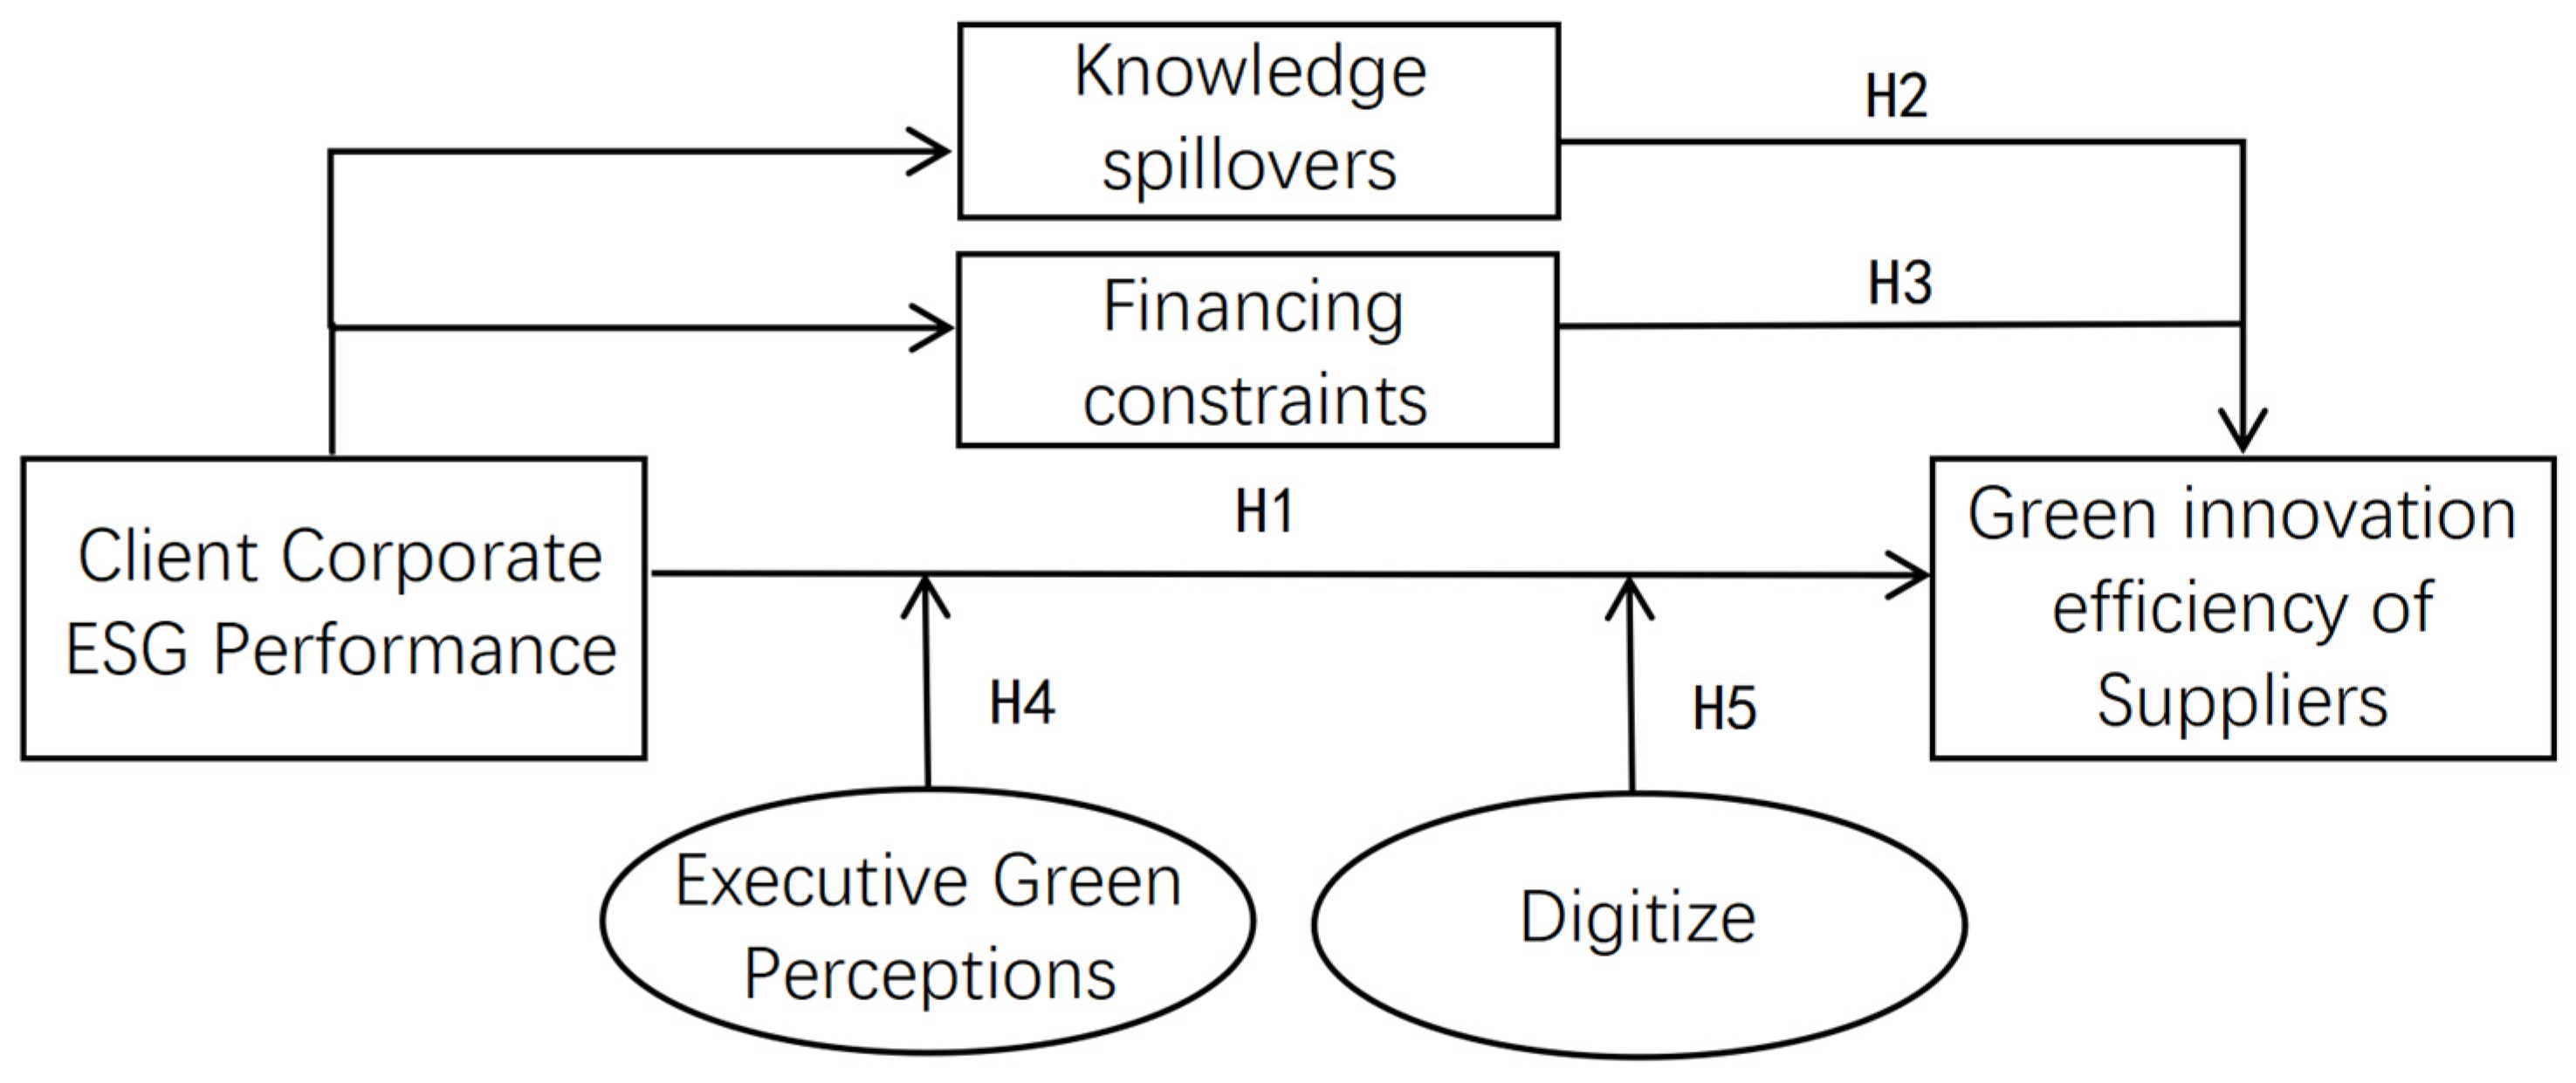
Section 3 employs a three-level progressive framework to construct a logical system (see Figure 1). Initially, the premise that customers’ environmental, social, and governance (ESG) performance directly affects suppliers’ green innovation efficiency is established (H1). Secondly, the propagation pathways of the effects of ESG are elucidated through the “knowledge spillover–financial constraint” dual channel (H2–H3). Finally, the reinforcement mechanism of senior management’s green perceptions (H4) and customers’ digitization level (H5) on the aforementioned relationship is revealed in the “firm characteristics–technology empowerment” dimension.
(i) Customer ESG performance and supplier green innovation efficiency
According to stakeholder theory, the decisions and behaviors of enterprises are not only influenced by shareholders, but also by other stakeholders (e.g., suppliers, customers, communities, etc.) [35]. The market incentive effect suggests that when the ESG performance of a client firm is better, the firm usually tends to choose a supplier whose ESG performance is in line with its own in order to maintain its own image and ensure the stability of its raw material supply. This change in market demand forces suppliers to adjust their strategies and increase investment in green innovation to adapt to new market trends and enhance competitiveness. It has been shown that suppliers tend to increase their investment in green technologies when faced with customer selection pressure, thus enhancing their innovation efficiency [36] to meet client firms’ requirements for ESG performance. Client companies with high ESG performance have a higher demand for green products and services, which directly affects suppliers’ strategic choices. In order to meet customers’ green purchasing criteria, suppliers must enhance the green performance of their products through technological innovation [37].
From the perspective of the diffusion of innovation, suppliers are often incentivized to follow in the footsteps of their client firms in green innovation when the client firms achieve significant economic and social benefits through green measures [38]. Client companies often encourage their suppliers to adopt more environmentally friendly production methods and technologies by establishing long-term partnerships. In addition, the ESG practice experiences of client companies are disseminated to supplier companies through annual reports, sustainability reports, and industry seminars, which help suppliers learn about the latest green technologies and management methods, thus accelerating their green innovation process [39].
Based on the above analysis, this paper proposes the following hypotheses:
Hypothesis 1.
The high ESG performance of customer firms has a significant positive effect on the green innovation efficiency of supplier firms.
(ii) Mechanisms of knowledge spillovers
The “knowledge spillover effect” refers to the phenomenon of new knowledge, skills, and innovative ideas being transferred from one organization to another through informal channels. Zhang, Y. et al. showed that there is a significant positive correlation between corporate social responsibility and green innovation [40]. Client companies with high ESG performance usually implement more stringent sustainable sourcing standards, which are not only reflected in the environmental performance of products, but also in the efficiency of resource utilization and the waste management level in the production process. In order to meet the sustainability requirements of customer companies, suppliers must improve their own green innovation efficiency. Supply chain collaboration based on trust and common goals can strengthen the knowledge spillover effect, thus promoting the realization of green innovation.
In the process of cooperation between client companies and suppliers, the environmental management knowledge and green technology experience accumulated by client companies are transferred to suppliers through training, technical support, and information sharing. Client firms with high ESG performance tend to be more willing to share their best practices in green technology and sustainable production [41], which helps suppliers to acquire the skills needed for green innovation more quickly, thus increasing the suppliers’ green innovation efficiency. This not only enables suppliers to adapt more quickly to changes in market demand, but also helps customer firms to acquire new products and technologies that meet their sustainability criteria.
Based on this, this paper proposes the following hypothesis:
Hypothesis 2.
Customer firms’ ESG performance strengthens suppliers’ green innovation efficiency through knowledge spillover effects.
(iii) Mechanism role of financing constraint
Financing constraints refer to the limitations that a firm encounters in the process of seeking capital to support its operations and development. First, financing constraints cause firms to be more cautious in their investment decisions [42]. Compared with the characteristics of ordinary innovation such as high input and long cycle, green innovation is subject to the higher possibility and risk of capital shortage and financing constraints [43]. When facing financial pressure, client companies will pay less attention to their own ESG performance, usually prioritize short-term return projects when making investment decisions, and take a more conservative attitude toward green technology investment. As a result, client companies, under financial constraints, will lower their green product requirements for suppliers to save costs, and at the same time reduce their support for suppliers’ green technology innovation. This will greatly dampen suppliers’ green innovation drive and affect their green innovation efficiency. Second, financing constraints also affect the timely availability of funds to suppliers by client firms. The availability of finance is an important driver for firms to innovate [44], financial support from client firms is critical for suppliers’ green innovation. When customer firms are unable to provide timely funding to suppliers due to financing constraints, suppliers have to reduce their investment in green innovation to save money, and the lack of funding will reduce the efficiency of suppliers’ green innovation. This series of mechanisms together lead to the decline of suppliers’ green innovation efficiency.
Based on this, this paper proposes the following hypothesis:
Hypothesis 3.
Financing constraints of customer firms play a negative mediating role between the ESG performance of customer firms (ESG) and the green innovation of supplier firms (GP).
(iv) Moderating effect of executives’ green cognition
Executive green cognition refers to the level of importance that corporate executives attach to environmental protection and social responsibility in their decision-making process. Executives’ backgrounds and perceptions directly affect their decision-making processes, and the level of executives’ green perceptions determines the depth of a firm’s understanding of the importance of ESG and further affects its strategic choices. Since green innovation is characterized by high investment, high risk, and long payback cycles [45], some enterprises exhibit weak willingness in terms of green innovation. However, executives with higher green perceptions tend to view external green orientation as an opportunity and actively tilt corporate resources toward green innovation to gain sustainable competitive advantage [46] and promote corporate performance in environmental protection and social responsibility.
When ESG becomes a strategic choice for supplier companies, the degree of suppliers’ understanding of their clients’ corporate ESG objectives will directly affect their response strategies. Studies have shown that the environmental awareness and values of executives play a crucial role in corporate sustainability strategy selection [47]. When supplier firm executives have a clear understanding of the ESG performance of their client companies, they are more likely to take the initiative to adjust their resource investment and strategic direction to meet the green needs of their clients by improving the efficiency of green innovation, and expect to establish a long-term and stable cooperative relationship with their client companies.
In addition, executives’ green perceptions also affect the quality of cooperation between client companies and suppliers. Highly cognizant executives can promote the sharing of and cooperation on green technology and knowledge between the two parties, which further strengthens the green innovation capability within the supply chain. Research has shown that a good cooperative relationship can improve the efficiency of knowledge dissemination and enhance the innovation capability of suppliers. When supplier firm executives have strong green cognition, suppliers are more willing to establish close cooperative relationships with client companies and enhance their green innovation capability through the exchange of green knowledge and technology.
Based on this, this paper proposes the following hypotheses:
Hypothesis 4.
The increased green knowledge of the supplier firm executives will strengthen the positive impact of the ESG performance of client companies on the supplier’s green innovation efficiency.
(v) Moderating effect of digitization
Digitization is a process by which an enterprise realizes business process reengineering, improves management efficiency, and promotes supply chain synergy through technological means. It is widely acknowledged that a higher level of digitization significantly enhances an enterprise’s dynamic capabilities, enabling client firms to perceive changes in the external environment more acutely, and quickly identify and capture green innovation opportunities. The enhanced dynamic capabilities enable client organizations to more effectively drive ESG practices and lay the foundation for their green transformation. The construction of digital platforms accelerates the sharing of green technologies and innovation experiences between client companies and suppliers, creating green synergies. Through digitalization, client companies are able to efficiently communicate environmental standards and sustainability requirements, enabling suppliers to respond to customer needs, adjust their strategic direction, and enhance their green innovation capabilities in a more timely manner. Digitization not only optimizes the operational efficiency and the ESG performance of customer companies, but also injects green innovation momentum for suppliers, promoting the overall sustainable development of the supply chain.
Based on this, this paper proposes the following hypotheses:
Hypothesis 5.
The digitization level of customer enterprises can strengthen the positive impact of their ESG performance on suppliers’ green innovation efficiency.

4. Research Design

4.1. Data Source and Sample

This study examines A-share listed companies from 2014 to 2023. The sample excludes ST, *ST, and Pt listed companies, companies listed for less than one year, and companies with missing relevant financial data, and applies a 1% winsorization on all continuous variables.
ESG data is sourced from the China Securities ESG rating database, green patent data from the State Intellectual Property Office, and financial data from the Cathay Pacific database and company annual reports. Statistical analyses were performed using Stata 17.0. A total of 3134 customer–supplier annual observations were obtained.
The research sample encompasses 42 secondary industries, ranging from agriculture, forestry, animal husbandry, and fisheries (Category A) to comprehensive industries (S90). Within the sample, the manufacturing sector (Category C) accounted for 53.17%, with a notable concentration in high-end manufacturing sectors such as computer communications, electrical machinery, and specialized equipment. This observation aligns with the structural trend of an increasing proportion of advanced manufacturing within China’s A-share market. Information transmission and finance, as representatives of modern services, form the second tier, while traditional industries such as mining, construction, and wholesale and retail trade exhibit a moderately dispersed distribution. From the perspective of enterprise scale, the median revenue of the sample companies was CNY 2.86 billion, with leading enterprises with revenue exceeding CNY 10 billion accounting for 19.3%, and the majority of enterprises in the CNY 10–100 billion revenue range accounting for 62.8%. This objectively reflects the typical characteristics of A-share listed companies, which are dominated by medium-sized enterprises while also including large enterprises. This sample structure, characterized by broad industry coverage and a complete scale gradient, ensures the explanatory power of the research conclusions for multi-tiered capital markets. It also provides an ideal experimental setting for observing the heterogeneity of ESG transmission effects across different industrial attributes.

4.2. Variable Selection and Definition

4.2.1. Explained Variables

The initial inputs selected, following Xiao et al. (2022) [48], include the number of R&D personnel and R&D expenditure. Intermediate outputs are defined as the number of green patent applications and the number of green patents licensed. Final outputs consist of sales revenue, the pollution emission index, and the energy consumption index, measured using the DEA-SBM model.
Data processing steps for green patents involve categorization according to the World Intellectual Property Organization (WIPO). The WIPO has identified seven major fields related to green technologies, such as alternative energy, transportation, and waste management, as per the United Nations Framework Convention on Climate Change (UNFCCC). This classification covers approximately 200 topics related to environmentally friendly technologies. Green patents are identified based on the WIPO’s 2010 indexed list, while industry divisions adhere to the National Economic Industry Classification Standard (GB/T 4754-2017) from the National Bureau of Statistics [49].
Energy consumption data includes water, electricity, coal, natural gas, gasoline, diesel, and centralized heating usage by listed companies. All consumption is converted into standard coal equivalents using appropriate energy conversion factors.
Pollution emission data covers metrics such as chemical oxygen demand, ammonia nitrogen emissions, total nitrogen, total phosphorus, sulfur dioxide, nitrogen oxides, soot, and dust. These pollution emission indices are calculated using the entropy value method, which standardizes units to ensure comparability.

4.2.2. Explanatory Variables

Corporate sustainability is measured using the CSI ESG rating score following Xie and Lv (2022) [50]. The CSI ESG ratings cover all A-share listed companies with quarterly ratings ranging from 1 (lowest) to 9 (highest). Each company’s annual ESG score is calculated as the average of its quarterly ratings.

4.2.3. Moderating Variables

Executives’ environmental perceptions are measured through textual analysis of annual reports following Li et al. (2022) [51]. Keywords are identified across three dimensions—green competitive advantage, corporate social responsibility, and external environmental pressure—with their frequency used to construct a metric of executives’ environmental cognition.
Digitization indicators are derived from text analysis and word frequency statistics in company annual reports, based on Yang et al. (2022) [52]. The relevant digitization terms are extracted from national policy documents to build a thesaurus. The word frequencies of digitization-related terms are then summed, and logarithmic processing is conducted on the total word frequencies.

4.2.4. Mechanism Variables

Knowledge spillover is measured by the number of supplier citations of customer firms’ green patents following Sun et al. (2024) [53]. To normalize data and approximate a normal distribution, the natural logarithm of citation counts is applied.
The SA index is used to measure financing constraints, following Hadlock and Pierce (2010) [54]. A higher SA index indicates more severe constraints faced by firms.

4.2.5. Control Variables

To control for firm-specific characteristics, several variables are included in the analysis. Return on assets (ROA) and operating cash flow (Cashflow) measure profitability and liquidity, respectively, while the fixed assets ratio (FIXED) and revenue growth rate (Growth) reflect asset structure and revenue performance. Tobin’s Q (TobinQ) assesses market valuation, and firm age (FirmAge) represents the maturity of supplier firms. Total asset turnover (ATO) evaluates operational efficiency. For client firms, the age of the client firm (CFirmAge) and number of employees (CEmploy) account for firm age and workforce size. All variables used in this study are presented in Table 1.

4.3. Model Design

4.3.1. Benchmark Regression Model

The benchmark regression model is specified as follows.
G I E i , t = α 0 + α 1 E S G j , t + α 2 X i t + η i + φ t + ε i , t
In the model, t denotes time, i represents supplier firms, and j represents customer firms. The terms η i and φ t capture industry and year fixed effects. X i t is a control variable and ε i , t the random error term.

4.3.2. Mediated Effects Model

To analyze how customers’ ESG performance influences suppliers’ green innovation efficiency through different mechanisms, this paper adopts the two-step method outlined by Jiang (2022) [55]. The mediated effects models are specified as follows:
K S i , t = β 0 + β 1 E S G j , t + β 2 X i , t + η i + φ t + ε i , t
F C i , t = γ 0 + γ 1 E S G j , t + γ 2 X i , t 1 + η i + φ t + ε i , t
In these models, K S i , t represents knowledge spillovers, while F C i , t denotes financing constraints. The variables Xi,t and Xi,t−1 are relevant control variables, and ηi and φ t capture fixed effects. Finally, ε i , t represents the error term.

4.3.3. Moderating Effect Model

To examine how customers’ ESG performance impacts suppliers’ green innovation efficiency under different conditions, this paper incorporates moderating effects into the analysis. The moderating effect models are specified as follows:
G I E i , t = κ 0 + κ 1 E S G j , t E C j , t + κ 2 X i t + η i + φ t + ε i , t
G I E i , t = λ 0 + λ 1 E S G j , t C D i , t + λ 2 X i t + η i + φ t + ε i , t
In these models, G I E i , t represents suppliers’ green innovation efficiency. The interaction terms E S G j , t E C j , t and E S G j , t C D i , t capture the moderating effects of supplier firm executives’ green cognition ( E C j , t ) and customer firms’ digitization levels ( C D i , t ), respectively. The variable X i t includes relevant control variables, while η i and φ t denote fixed effects. Finally, ε i , t represents the error term.

5. Analysis of Empirical Results

5.1. Descriptive Statistics

The descriptive statistics of the study variables are reported in Table 2. The mean value of supplier green innovation efficiency (GIE) is 0.5833, with a standard deviation of 0.183. The mean value of supplier firm executives’ green cognition (EC) is 1.3734, ranging from 0 to 4.2. The median value of EC is 1.39, suggesting that some executives place a high emphasis on environmental protection. The digitization level (CD) of client companies varies widely, with a maximum value of 311 and a minimum value of 0. Moreover, the mean ESG performance (ESG) score of client firms is 3.9336, with a standard deviation of 0.850 and a range of 1 to 7. This indicates a broad distribution of ESG ratings, with most firms attaining medium or higher scores.

5.2. Benchmarking Regressions

Table 3 reports the regression results for the impact of client firms’ ESG performance on suppliers’ green innovation efficiency. Specifically, column (1) displays the results of a univariate regression, examining the direct effect of client firms’ ESG performance on suppliers’ green innovation efficiency. Column (2) incorporates control variables into the regression, while column (3) further includes industry and year fixed effects. Across all models, the coefficients on ESG are significantly positive, with significance levels of at least 1%. These findings indicate that the high ESG performance of client firms positively influences suppliers’ green innovation efficiency, providing strong support for Hypothesis H1.

5.3. Endogeneity Issues

This paper addresses the potential issue of mutual causation, where supplier firms with higher ESG performance may be more likely to attract client firms with higher ESG performance, by employing a two-stage least squares (2SLS) instrumental variables approach. The average ESG value of firms within the same industry and province as the client firms is used as the instrumental variable (IV). The IV is constructed by calculating the mean ESG performance of firms in the same industry and province, representing the overall ESG level of the region. This approach ensures that the instrumental variable is strongly correlated with the ESG performance of client firms but has minimal impact on the green innovation efficiency of supplier firms, thereby satisfying the correlation and exclusivity requirements of an effective IV. The validity of the IV was further confirmed by the Cragg–Donald Wald F-value, which exceeded 10, meeting the necessary scientific standards. Retesting using the 2SLS method, as shown in columns (1) and (2) of Table 4, shows that the first-stage regression coefficient of the IV is significantly positive at the 5% level, confirming its relevance. The second-stage regression shows that the ESG coefficient remains significantly positive even after accounting for endogenous factors, indicating that client firms’ ESG performance significantly contributes to the green innovation efficiency of suppliers.
To address potential endogeneity caused by systematic differences in control variables between supply chain samples with higher and lower ESG performance, this paper adopts the propensity score matching (PSM) method (Li et al., 2022) [51]. Client firms are grouped based on the median ESG performance for the year and industry, creating high and low ESG groups. Control variables from the baseline regression are then used as covariates, and the 1:1 nearest-neighbor matching method with replacement and a caliper is applied to balance the samples. Post matching, the covariates in both groups show no significant differences, satisfying the balance assumption. Regression analysis on the matched samples, shown in column (3) of Table 4, demonstrates that the ESG coefficient remains significantly positive at the 5% level. These results confirm that the ESG performance of client firms continues to play a significant role in enhancing suppliers’ green innovation efficiency even after addressing endogeneity using the PSM method.

5.4. Robustness Tests

To test robustness, we replaced the original fixed industry effect of the supplier with the fixed industry effect of the customer, and replaced the original industry fixed effect with the supplier’s individual fixed effect. As shown in columns (1) and (2) of Table 5, the coefficients of ESG remain significantly positive at the 1% level. These results are consistent with the benchmark regression, confirming that the ESG performance of customer firms continues to significantly impact suppliers’ green innovation efficiency under different fixed effects models.
A robustness test is conducted by altering the calculation method of ESG rating scores, replacing the mean ESG score for the same company in the same year with the median. As shown in column (3) of Table 5, the coefficient of ESG remains significantly positive. This indicates that the change in measurement does not alter the effect of client firms’ ESG performance on suppliers’ green innovation efficiency, aligning with the benchmark results.
To account for the potential impacts of the COVID-19 pandemic during 2020–2022, we excluded data from this period and re-estimated the regression. The results, displayed in column (4) of Table 5, show that the coefficient of ESG remains significantly positive at the 1% level. This reaffirms the robustness of the benchmark regression results and demonstrates that the positive influence of client firms’ ESG performance on suppliers’ green innovation efficiency is unaffected by the exclusion of pandemic-era samples.

5.5. Mechanism Test

In order to further verify the path of ESG performance of client firms affecting suppliers’ green innovation efficiency through different mechanisms, this paper refers to Jiang (2022) [55] who used a two-step regression method for mechanism testing. First, a baseline regression was executed to verify the direct effect of the ESG performance of client firms on suppliers’ green innovation efficiency. Then, in the second step, the ESG performance of customer firms was included in the regression along with mechanism variables to test the mediating role of mechanism variables in the relationship.
Specifically, Hypothesis 2 proposes that the high ESG performance of client firms strengthens suppliers’ green innovation efficiency through knowledge spillovers. The empirical results support this hypothesis, and the regression analysis shows that the ESG performance of client firms has a significantly positive effect on the knowledge spillover effect (KS). Theoretically, the knowledge spillover effect, an important transmission mechanism, can directly promote suppliers’ green innovation efficiency. Through regular technical exchanges, standard-sharing, and cooperative innovation programs with client companies, suppliers can obtain the practical experience and technical resources of client companies in green technology, and can thus be inspired and assisted in their own green innovation activities. Therefore, the knowledge spillover effect can enhance suppliers’ understanding and application of green technologies and can directly promote their green innovation efficiency.
Hypothesis 3 proposes that the ESG performance of customer firms promotes their green innovation efficiency by mitigating the financing constraints of supplier firms. In Column (2), the coefficient of customer firms’ ESG performance on financing constraints (FC) is −0.0074 and is significantly negative at the 5% level, indicating that customer firms with a high ESG performance are able to mitigate suppliers’ financing constraints. Theoretically, green innovations often require large financial investments and are accompanied by high risks and long lead times. The high ESG performance of client firms reduces the cost of capital by enhancing suppliers’ reputation and credit limit, making it easier to obtain financing support in the capital market. The alleviation of financing constraints provides suppliers with more abundant resources to invest more boldly in green innovation activities, thus enhancing their green innovation efficiency. Therefore, the ESG performance of client firms directly promotes the green innovation development of suppliers by alleviating financing constraints. (See Table 6).

5.6. Moderating Effects Test

Table 7 demonstrates the regression results of the moderating effects test to verify whether the impact of the ESG performance of client firms on suppliers’ green innovation efficiency is moderated by the green perceptions of supplier firm executives and the digitization level of client firms. Specifically, Hypothesis 4 proposes that the level of supplier firm executives’ green perceptions strengthens the positive impact of customer firms’ ESG performance on suppliers’ green innovation efficiency, while Hypothesis 5 suggests that the digitization level of customer firms can further enhance the positive impact of customer firms’ ESG performance on suppliers’ green innovation efficiency. In the test of Hypothesis 4, the interaction term between supplier firm executives’ green cognition (EC) and customer firms’ ESG performance (ESG_EC) is introduced. The regression results show that the coefficient of the interaction term is significantly positive at the 1% level, indicating that the positive impact of customer firms’ ESG performance on suppliers’ green innovation efficiency is stronger when the level of supplier firm executives’ green cognition is higher. In the test of Hypothesis 5, the coefficient of the interaction term between the digitization level of the client firm (CD) and the ESG performance of the client firm (ESG_CD) is also significantly positive at the 1% level, indicating that higher digitization level of the client firm strengthens the positive impact of the ESG performance of the client firm on the supplier’s green innovation efficiency.

5.7. Heterogeneity Test

5.7.1. Heterogeneity by Firm Type

This paper argues that there may be heterogeneity in the role of different firm types on the ESG performance of client firms in promoting suppliers’ green innovation efficiency, depending on the firms’ degree of intensity in terms of technology, assets, or labor. Based on this, this paper classifies supplier firms and customer firms into technology-intensive, asset-intensive, and labor-intensive for the regression analysis in order to explore the differential impact of the ESG performance of customer firms on the green innovation efficiency of different types of supplier firms.
The regression results are shown in Table 8. Among the technology-intensive supplier firms (column (1)), the coefficient of ESG performance of client firms on green innovation efficiency is 0.0167 and significant at the 1% level. This indicates that the high ESG performance of client firms has a significant contribution to the green innovation efficiency of technology-intensive suppliers. Technology-intensive suppliers rely on innovation-driven, and their internal structure and innovation resources are more likely to absorb the green technologies and knowledge provided by client firms, so they can respond quickly in the ESG requirement transmission process, thus enhancing their green innovation efficiency. For technology-intensive customer firms (column (4)), the coefficient of ESG is 0.0118, which is also significantly positive at the 1% level. This suggests that technology-intensive customer firms, which are more stringent in terms of environmental requirements and green technology support, will transmit their high ESG performance more effectively through the supply chain to their suppliers, thus promoting their green innovation efficiency.
Among asset-intensive supplier firms (column (2)), the coefficient of the ESG performance of customer firms is 0.0114, but it does not pass the test of the significance level. This suggests that the ESG performance of client firms has a weak impact on the green innovation efficiency of asset-intensive suppliers. Asset-intensive suppliers have a large proportion of fixed assets and low production and innovation flexibility, which makes it difficult to adjust their resources in the short term to respond to the ESG requirements of customer firms, resulting in a limited ESG performance transmission effect. Among asset-intensive customer firms (column (5)), the coefficient of ESG is positive but not significant, which further illustrates that asset-intensive firms are relatively weak in terms of adapting to the green innovation transition, and such firms are limitedly affected in the transmission of green technology requirements.
Among labor-intensive supplier firms (column (3)), the coefficient of the ESG performance of client firms is 0.0109 and is significantly positive at the 5% level. This suggests that the high ESG performance of client firms contributes to their green innovation efficiency despite the fact that labor-intensive firms have fewer resources for technology absorption and innovation. This may be due to the fact that labor-intensive firms, when confronted with the environmental requirements of their client firms, usually take more direct measures to meet the requirements, such as enhancing resource conservation and environmental management. For labor-intensive customer firms (column (6)), the ESG coefficient is 0.0225 and is significantly positive at the 1% level, indicating that labor-intensive customer firms have a stronger influence on suppliers’ green innovations, and that such customer firms may be more inclined to convey green technology requirements to suppliers due to their own higher concern for environmental protection, thus promoting the development of suppliers’ green innovations.

5.7.2. Differences in Government Environmental Concerns Between the Cities of Client Firms and Supplier Firms

This paper argues that when there is a difference between the governmental environmental concern in the city where the client firm is located and the governmental environmental concern in the city where the supplier firm is located, the role of the client firm in promoting the supplier’s green innovation efficiency may be different. Referring to the study of Cheng Hua et al. (2023) [56], this paper adopts the number of sentences and word frequency of keywords about promoting ecological civilization construction in the government work report of the prefecture-level city where the enterprise is located to measure the government environmental concern. The main regression sample is divided into two groups—the government environmental concern of customer enterprises is higher than the government environmental concern of supplier enterprises (the high environmental concern group) and the government environmental concern of customer enterprises is lower than the government environmental concern of supplier enterprises (the low environmental concern group), and empirical regressions are carried out on the two groups, respectively.
The regression results in Table 9 show that when the government environmental concern in the city where the client firm is located is higher than the government environmental concern in the city where the supplier firm is located (columns (1) and (3)), the high ESG performance of the client firm significantly contributes to the supplier’s green innovation efficiency. Specifically, the coefficient of ESG is 0.0181 (column (1)), which is significantly positive at the 1% significance level, when the environmental concern of the city where the client firm is located is high, indicating that client firms are more inclined to impose higher green standards on their suppliers in order to ensure the environmental compliance of their supply chains in the face of stringent environmental regulatory pressure. This pressure may motivate client firms to empower their suppliers by strengthening supply chain management, passing on green technology requirements, or even by supporting green innovation in the form of ensuring that their suppliers’ green innovation capabilities meet high environmental standards. The same trend is validated in the case where the supplier firm is located in a city with high environmental concerns (column (3)). The coefficient of the ESG performance of customer firms is 0.0199 and significant at the 1% level when the supplier firm is located in a city with a higher level of government environmental concern. Higher local government environmental concern reflects stricter environmental regulatory requirements, and supplier firms are already under some environmental pressure in this case, so when client firms make higher green innovation requirements, suppliers can respond to these requirements more easily, thus enhancing their green innovation efficiency. In this case, the supplier firms themselves may already have a certain green technology base or resource allocation, so that the high ESG performance of the client firms can be more effectively transmitted through the supply chain and directly promote their green innovation development.
However, when the government environmental concern of the customer firm’s city is lower than that of the supplier firm’s city (columns (2) and (4)), the promotion effect of the customer firm’s high ESG performance on the supplier’s green innovation efficiency is weakened, and in some cases is no longer significant (the ESG coefficient in column (4) is 0.0026 and fails the significance test). This suggests that in regions with lower environmental concerns, client firms face less environmental regulatory pressure and therefore require relatively less green innovation from their suppliers. This may lead to a lack of strong incentives for client firms to empower suppliers’ green innovation, and thus does not significantly promote suppliers’ green innovation efficiency.

6. Discussion and Conclusions

6.1. Conclusion of the Study

This study employs an empirical approach to analyze supply chain data from Chinese A-share listed companies from 2014 to 2023, systematically elucidating the mechanism through which the ESG performance of client firms influences the green innovation efficiency of suppliers. The study methodically explores the three fundamental inquiries posed in the introduction: the transmission effect of ESG performance within vertical supply chain relationships, the operational mechanisms of intermediary pathways, and the boundary conditions under heterogeneous contexts. The findings of the present study yield significant theoretical and practical implications for sustainable supply chain management.
The findings demonstrate the efficacy of stakeholder theory in collaborative innovation scenarios in supply chains and extend the application domains of resource dependency theory. Specifically, for every increase of one standard deviation in the ESG performance of client firms, the green innovation efficiency of suppliers increases by an average of 13.8% (see Table 3). This finding remains robust after addressing endogeneity issues using instrumental variable methods and PSM methods (Table 4), confirming that the spillover effects of ESG practices by supply chain leading firms have significant economic significance. This theoretical framework establishes a novel paradigm for understanding cross-organizational ESG transmission mechanisms, thereby challenging the firm-centric analytical frameworks that predominate in the extant literature.
In terms of theoretical contributions, this study advances the field by overcoming the limitations of traditional ESG research focusing on individual enterprises and constructing a theoretical framework for vertical transmission in supply chains for the first time. The present study contributes to the extant literature on the green innovation-driven mechanism by offering a novel theoretical framework that enhances the existing theoretical framework. This outcome is attained by identifying the dual mediating effects of knowledge spillover (β = 0.0815, Table 6) and financing constraint relief (β = −0.0074, Table 6). The findings of this study demonstrate that customer firms can enhance suppliers’ green technology absorption capacity by 21.7% through knowledge-sharing mechanisms such as technology collaboration agreements and patent citations. This finding provides new evidence for the application of the knowledge base perspective in sustainable supply chain management. Moreover, the study demonstrates that enhancing customer ESG performance leads to an improvement in suppliers’ credit ratings, resulting in a 7% reduction in their financing costs. These mechanisms serve to validate institutional theory by revealing the manner in which formal knowledge is transferred and market-based financial incentives (β = 0.0007, Table 7) are employed in conjunction to shape ESG-driven innovation ecosystems.
The analysis reveals the moderating effects of senior executives’ environmental awareness and client digitalization levels, with moderation coefficients of 0.0099 and 0.0007, respectively (Table 7). These findings underscore the pivotal role of the “cognition-technology” dual capability in dynamic capability theory. Future research should explore cross-country comparisons of these mechanisms and dynamic ESG synergy models to advance global supply chain sustainability governance.

6.2. Countermeasures and Recommendations

Government level: The government should appropriately expand the coverage of the pilot low-carbon city policy, especially in areas where SMEs with high potential for green innovation are concentrated, in order to form a wider demonstration effect. Pilot policies can incentivize companies to upgrade their ESG performance and further improve their green innovation level, which will have positive effects on companies’ green and innovative activities [57]. The demonstration effect will encourage other enterprises to actively disclose ESG reports and guide the development of ESG disclosure in the direction of standardization. On the one hand, the government and relevant regulatory authorities should provide policy support and financial subsidies, such as tax breaks and other policy incentives, to enterprises participating in the low-carbon pilot program, in order to reduce the cost of green innovation for client enterprises. This will not only help client companies improve their own ESG performance, but will also promote the role of client companies in driving green innovation among their suppliers. On the other hand, the government should actively build an information-sharing platform to promote experience exchange and cooperation between low-carbon pilot enterprises and other enterprises, and to encourage collaborative green innovation among supply chain enterprises, prevent the fragmentation of the supply chain, and enhance the green innovation capability of the entire supply chain through information sharing. Lastly, the government could pilot the implementation of the “leading enterprise ESG certification system” in technology-intensive industrial clusters such as the Yangtze and Pearl River deltas. This system would incorporate customer ESG ratings and supplier green patent output into innovation evaluation indicators and provide a value-added tax refund for those who meet the standards [58].
Client enterprise level: Client enterprises must deeply recognize the important impact of ESG performance on enterprise development. First, client companies should incorporate ESG performance into their performance evaluation indexes to motivate them to pay more attention to environmental protection and social responsibility in their daily operations, actively explore the path of sustainable development, raise awareness of green innovation, and continuously optimize product design, production, sales, and other aspects to promote the implementation of green innovation. Secondly, client companies should actively establish long-term cooperative relationships with suppliers that emphasize green innovation, and commit to jointly carry out green technology research and development and project innovation through technology sharing, resource integration, and information interoperability to improve their own green innovation efficiency and to realize a win–win situation for both the customer and the supplier. Finally, client companies should regularly assess their ESG performance with the help of digital tools. Monitoring and analyzing their ESG performance in real time, as well as evaluating and providing feedback, enables them to identify problems and take remedial measures in a timely manner. Client companies should not only provide feedback to their executives, but also to their suppliers in a timely manner, so that they can jointly seek improvement and enhancement measures for green innovation and form a favorable green innovation industry ecology [59].
Supplier level: Supplier companies should establish active contact with customer companies with good ESG performance to promote the improvement of their own green innovation efficiency. On the one hand, supplier companies should take the initiative to maintain close communication with client companies to understand their expectations and requirements in terms of ESG and to emphasize the role of stable customer relationships in helping enterprises obtain external resources to play a signaling role, enhance customer confidence in the development of supplier enterprises, and create an external environment conducive to the development of green innovation. At the same time, relying on the resource advantages of the customer enterprise, they should take the initiative to learn and utilize the green knowledge and experience of the customer enterprise, and actively carry out green innovation. On the other hand, supplier enterprises should establish a feedback mechanism. While improving their own green innovation level according to the requirements of customer enterprises, they could regularly evaluate their own performance in green innovation. And through the collection of feedback from customer enterprises, they can continuously improve and optimize their own green innovation strategies to ensure that their own development is consistent with the needs of customers [41].

7. Directions for Future Research

7.1. Cross-Country Comparative Study

Considering supply chain management in the context of globalization, future research could be extended to cross-country comparisons to analyze the impact of ESG performance on suppliers’ green innovation efficiency in different countries and regions. This will help to understand how culture, policy, and market environments shape corporate sustainability practices [6]. Cross-country studies can also reveal best practices and lessons learned from different countries in promoting green innovation.

7.2. Dynamic Perspective of ESG Performance

Future research can adopt a dynamic perspective to examine how the ESG performance of client firms affects suppliers’ green innovation efficiency over time. By constructing a dynamic panel data model, the time-lagged effect of ESG performance and its long-term impact on suppliers’ innovation capability can be analyzed [5]. Such research will help in the understanding of how firms adjust their ESG strategies to promote green innovation at different stages of development.

7.3. Synergistic Effects of Digital Transformation and Green Innovation

As digital transformation accelerates, future research could delve into how digital technologies can synergize with ESG performance to further drive suppliers’ green innovation efficiency. Research could focus on the specific application of digital tools in enhancing green innovation capabilities and how these technologies can help companies better meet ESG standards [52].

Author Contributions

Methodology, S.H.; Software, S.H.; Formal analysis, S.H.; Resources, Y.Z. and X.G.; Data curation, S.H.; Writing—original draft, S.H.; Writing—review & editing, S.H. and T.C. All authors have read and agreed to the published version of the manuscript.

Funding

This research received no external funding.

Institutional Review Board Statement

Not applicable.

Informed Consent Statement

Not applicable.

Data Availability Statement

The original contributions presented in this study are included in the article. Further inquiries can be directed to the corresponding author.

Conflicts of Interest

The authors declare no conflict of interest.

References

  1. Xi, J.P. Hold High the Great Banner of Socialism with Chinese Characteristics and Unite for the Comprehensive Construction of a Modernized Socialist Country--Report at the 20th National Congress of the Communist Party of China, BeiJing, China, Oct. 16, 2022. People’s Daily, 2022-10-26(01). Available online: https://www.idcpc.org.cn/english2023/tjzl/cpcjj/20thPartyCongrssReport/ (accessed on 9 June 2025).
  2. International Energy Agency (IEA). World Energy Outlook 2021; IEA: Paris, France, 2021. [Google Scholar]
  3. Eccles, R.G.; Ioannou, I.; Serafeim, G. The Impact of Corporate Sustainability on Organizational Processes and Performance. Manag. Sci. 2014, 60, 2835–2857. [Google Scholar] [CrossRef]
  4. Porter, M.E.; Kramer, M.R. Creating Shared Value. Harv. Bus. Rev. 2011, 89, 62–77. [Google Scholar]
  5. Wang, Y.; Zhang, Y.; Liu, H. The Role of ESG Performance in Promoting Green Innovation: Evidence from China. J. Clean. Prod. 2021, 278, 123456. [Google Scholar] [CrossRef]
  6. Li, S.; Chen, Y.; Zhang, L. ESG Performance and Green Innovation: Evidence from Chinese Enterprises. Sustainability 2022, 14, 1234. [Google Scholar] [CrossRef]
  7. National Development and Reform Commission, Ministry of Science and Technology. Implementation Plan for Further Improvement of Market-Oriented Green Technological Innovation System. Available online: https://news.eeworld.com.cn/newenergy/ic629934.html (accessed on 9 June 2025).
  8. Yu, F.; Xiao, C.; Zhang, M.W. The Impact of Green Innovation in Manufacturing Enterprises on Government Support: The Mediating Role of Legal Compliance. J. Sci. Technol. Policy 2021, 38, 90–99. [Google Scholar]
  9. Akhtar, S.; Tian, H.; Iqbal, S. Environmental regulations and government support drive green innovation performance: Role of competitive pressure and digital transformation. Clean Technol. Environ. Policy 2024, 26, 4433–4453. [Google Scholar] [CrossRef]
  10. Luo, S.Q.; Yin, Y.C. ESG Practices, Green Innovation and High-Quality Development of Enterprises—Empirical Evidence Based on China’s High-Tech Enterprises. Financ. Econ. 2024, 6, 57–70. [Google Scholar] [CrossRef]
  11. Ni, Z.X. Research on the Impact of Executive Compensation Gap on Corporate ESG. Ph.D. Thesis, Yunnan University of Finance and Economics, Kunming, China, 2024. [Google Scholar] [CrossRef]
  12. Wang, D. Research on the Impact of Executive Team Heterogeneity on ESG Performance. Ph.D. Thesis, Shandong University of Finance and Economics, Jinan, China, 2024. [Google Scholar] [CrossRef]
  13. Wu, Z.X. Research on the Impact of Executive Technology Background on Corporate ESG Performance. Master’s Thesis, Beijing Institute of Petrochemical Technology, Beijing, China, 2024. [Google Scholar] [CrossRef]
  14. Li, R.T. Research on the Impact of Executives’ Political Background on Corporate ESG Performance. Ph.D. Thesis, Chongqing University of Technology, Chongqing, China, 2024. [Google Scholar] [CrossRef]
  15. Guo, C.X. Research on the Impact of ESG Performance on Debt Financing Cost of Pharmaceutical Manufacturing Companies. Master’s Thesis, Sichuan Normal University, Chengdu, China, 2022. [Google Scholar] [CrossRef]
  16. Yu, H.B. Research on the Impact of Corporate ESG Performance on Financial Performance. Ph.D. Thesis, Southwest University of Finance and Economics, Chengdu, China, 2023. [Google Scholar] [CrossRef]
  17. Wang, L. Research on the Impact and Mechanism of ESG Performance on Corporate Value. Ph.D. Thesis, Jilin University, Changchun, China, 2024. [Google Scholar] [CrossRef]
  18. Zhang, X. Research on the Impact of ESG Performance on Corporate Innovation. Ph.D. Thesis, Lanzhou University of Finance and Economics, Lanzhou, China, 2024. [Google Scholar] [CrossRef]
  19. Zhang, Y.J.; Zhai, J.Q.; Zhu, Y.X. How digital transformation affects corporate ESG performance. J. China Univ. Geosci. (Soc. Sci. Ed.) 2023, 23, 126–141. [Google Scholar] [CrossRef]
  20. Shu, T.I.; Zhao, T.T.; Wan, S.P.Y. Green tax reform affects corporate ESG performance—Based on corporate cost perspective. Ind. Technol. Econ. 2024, 43, 61–70. [Google Scholar]
  21. Xu, J.K.; Jiang, K.W. Research on the impact mechanism of government subsidies on corporate ESG performance. Sci. Ind. 2023, 23, 73–78. [Google Scholar]
  22. Zhang, Y.G. Path Selection for Green Development of Harmonious Coexistence between Humanity and Nature. Soc. Sci. J. 2023, 181–189. [Google Scholar]
  23. Cao, J.Y. Research on the Impact of Environmental Regulation and Government R&D Subsidies on Green Innovation Efficiency. Master’s Thesis, Hebei Normal University, Shijiazhuang, China, 2022. [Google Scholar] [CrossRef]
  24. Zhao, P.J. Manufacturing Agglomeration, Environmental Regulation and Green Innovation Efficiency. Ph.D. Thesis, Southwest University, Chongqing, China, 2020. [Google Scholar] [CrossRef]
  25. Lu, S.H. The impact of digital finance on green innovation efficiency and its convergence—A case study of cities in the Yangtze River Economic Belt. Product Res. 2024, 1, 145–149. [Google Scholar] [CrossRef]
  26. Ni, L.K.; Wang, B.G.; Deng, L. The impact of digital transformation on corporate green innovation in the context of green development--Taking listed companies in the construction industry as an example. Financ. Account. J. 2024, 36–39+79. [Google Scholar] [CrossRef]
  27. Li, X.X.; Tang, X.H. Research on the role mechanism of digital transformation on green innovation efficiency of manufacturing enterprises. Financ. Econ. 2024, 4, 85–94. [Google Scholar] [CrossRef]
  28. Qin, T.R.; Kang, L. Research on the influence effect of human capital on regional green low-carbon innovation efficiency. J. Taiyuan Univ. Technol. (Soc. Sci. Ed.) 2019, 37, 70–76. [Google Scholar]
  29. Liu, W.Q. The impact of R&D investment on green innovation efficiency of high-tech industries under the perspective of industrial agglomeration. Jiangxi Soc. Sci. 2019, 39, 65–75. [Google Scholar]
  30. Shen, X.Y. The impact of corporate R&D investment on technological innovation efficiency--a study based on government R&D funding and equity concentration. China Market 2023, 11, 9–13. [Google Scholar] [CrossRef]
  31. Dong, Y.C. Can ESG rating disclosure promote corporate green innovation?--Evidence from A-share listed manufacturing companies. Financ. Dev. Rev. 2024, 5, 44–58. [Google Scholar] [CrossRef]
  32. Liu, B.; Lu, J.R. Does the number of ESG disclosures reduce the cost of corporate debt financing? Int. Financ. Res. 2024, 87–96. [Google Scholar]
  33. Li, H.Y.; Liu, Q.Y.; Li, S.Y. Environmental, social and governance disclosure and corporate green innovation performance. Stat. Res. 2022, 39, 38–54. [Google Scholar] [CrossRef]
  34. Peng, B.C.; Zhang, Y.; Wang, Z. Research on the impact of corporate ESG performance on green innovation efficiency. Stat. Decis. Mak. 2024, 40, 172–176. [Google Scholar] [CrossRef]
  35. Freeman, R.E. Strategic Management: A Stakeholder Approach; Pitman: Boston, MA, USA, 1984. [Google Scholar]
  36. González-Benito, J.; González-Benito, O. The role of stakeholder pressure in the adoption of environmental practices. J. Bus. Res. 2006, 59, 457–465. [Google Scholar] [CrossRef]
  37. Frederickson, H.; Pateman, R. The role of public sector organizations in stimulating environmental innovation. Public Adm. 2007, 85, 681–702. [Google Scholar] [CrossRef]
  38. Brown, C.E.; Lenox, M.J. Sustainability: The role of competitive interaction. Strateg. Manag. J. 2005, 26, 1099–1118. [Google Scholar] [CrossRef]
  39. Dahlsrud, A.; Nykvist, B.; Lamberton, C. Mapping corporate sustainability: Results from an extensive literature review. J. Clean. Prod. 2018, 197, 1654–1668. [Google Scholar] [CrossRef]
  40. Zhang, Y.; Zhao, X. The impact of corporate social responsibility on green innovation: The mediating role of knowledge spillover. Sustainability 2021, 13, 1234. [Google Scholar] [CrossRef]
  41. Kumar, V.; Singh, R.K.; Gupta, S. Impact of green supply chain management practices on performance: A study of Indian manufacturing firms. J. Clean. Prod. 2021, 244, 118–130. [Google Scholar]
  42. Baker, M.; Wurgler, J. Market Timing and Capital Structure. J. Financ. 2002, 57, 1–32. [Google Scholar] [CrossRef]
  43. Ding, T.; Gao, Y.T. The impact of corporate social responsibility fulfillment on green innovation under the perspective of financing constraints. Bus. Account. 2024, 2, 94–97. [Google Scholar]
  44. Hall, B.H. The Financing of Research and Development. Oxf. Rev. Econ. Policy 2002, 18, 35–51. [Google Scholar] [CrossRef]
  45. Liang, M.; Cao, H.J.; Wang, S.J. Executive Environmental Perception, Dynamic Capability and Corporate Green Innovation Performance—The Moderating Effect of Environmental Uncertainty. Sci. Technol. Manag. Res. 2022, 42, 209–216. [Google Scholar]
  46. Peng, X.L.; Liu, Y. The effects of industry visibility, innovation capability and executive cognition on corporate eco-innovation behavior. Res. Dev. Manag. 2015, 27, 68–77. [Google Scholar]
  47. Cao, H.; Chen, Z. The driving effect of internal and external environment on green innovation strategy—The moderating role of top management’s environmental awareness. Nankai Bus. Rev. Int. 2019, 10, 342–361. [Google Scholar] [CrossRef]
  48. Xiao, R.Q.; Chen, X.T.; Qian, L. Heterogeneous environmental regulation, government support and firms’ green innovation efficiency—Based on a two-stage value chain perspective. Financ. Trade Res. 2022, 33, 79–93. [Google Scholar] [CrossRef]
  49. GB/T 4754-2017; Industrial Classification for National Economic Activities. Standardization Administration of China: Beijing, China, 2017.
  50. Xie, H.J.; Lv, X. Responsible international investment: ESG and China’s OFDI. Econ. Res. 2022, 57, 83–99. [Google Scholar]
  51. Li, Y.B.; Xia, Y.; Zhao, Z. The impact of executive green perceptions on corporate performance in heavy pollution industries: A moderated mediation effect model. Sci. Technol. Prog. Countermeas. 2023, 40, 113–123. [Google Scholar]
  52. Yang, J.Y.; Peng, Q.P.; Ge, Z.T. Customer Contagion Effect of Digital Transformation—A Supplier Innovation Perspective. China Ind. Econ. 2022, 8, 156–174. [Google Scholar] [CrossRef]
  53. Sun, Y.N.; Wu, X.H.; Bu, M.W. Analysis of the spillover effect of customer ESG performance on supplier green innovation. J. Dalian Univ. Technol. (Soc. Sci. Ed.) 2024, 45, 49–60. [Google Scholar] [CrossRef]
  54. Hadlock, C.J.; Pierce, J.R. New Evidence on Measuring Financial Constraints: Moving Beyond the KZ Index. Rev. Financ. Stud. 2010, 23, 1909–1940. [Google Scholar] [CrossRef]
  55. Jiang, T. Mediating and Moderating Effects in Empirical Studies of Causal Inference. China Ind. Econ. 2022, 5, 100–120. [Google Scholar] [CrossRef]
  56. Cheng, H.; Fan, Q.Y.; Gong, Q. Local Government Environmental Attention, Media Supervision and Emission Reduction Performance of State-owned Enterprises. Econ. Sci. 2023, 183–198. [Google Scholar]
  57. Sun, T.G. Research on the Impact of ESG Performance on Corporate Green Innovation. Ph.D. Thesis, Shandong University of Finance and Economics, Jinan, China, 2024. [Google Scholar] [CrossRef]
  58. Huang, W. Low-carbon City Pilot Policy and Corporate ESG Performance. Energy Policy 2021, 158, 112535. [Google Scholar]
  59. Kim, J.; Kim, R.; Kim, S. Does financial statement comparability mitigate delayed trading volume before earnings announcements? J. Bus. Res. 2020, 107, 552–565. [Google Scholar] [CrossRef]
Figure 1. A three-level progressive framework to construct a logical system.
Sustainability 17 05519 g001
Table 1. Definitions of study variables.
Variable TypeVariable NameVariable SymbolVariable Definition
Explanatory variablesSupplier green innovation efficiencyGIEDEA-SBM model measurements
Moderator variableSupplier firm executives’ green perceptionsECSupplier firm-related word frequency synthesis
Customer digitization levelCDLogarithm of relevant word frequency
Mechanism variableKnowledge spilloverKSNumber of supplier citations of green patents of customer firms
Financing constraintFCSupplier firm financing constraint, SA index
Explanatory variablesCustomer ESG performanceESGCustomer firm Huazheng ESG score
Control variablesFirm sizeSizeNatural logarithm of total assets of supplier firms
Gearing ratioLevTotal liabilities/total assets of supplier firms
Return on AssetsROANet profit of supplier/total assets
Operating cash flowCashflowNet cash flow from operating activities of supplier/total assets
Fixed Assets RatioFIXEDNet fixed assets of supplier/total assets
Revenue growth rateGrowthSupplier’s (current period’s revenue—previous period’s revenue)/previous period’s revenue
TobinQTobinQSupplier company (market capitalization of outstanding shares + number of non-outstanding shares X net assets per share x book value of liabilities)/total assets of the supplier company
FirmAgeFirmAgesupplier company 1n(current year—year of establishment + 1)
Total Asset TurnoverATOSupplier Firm Operating Income/Average Total Assets
Age of client firmCFirmAgeClient firm 1n(current year—year of establishment + 1)
Employee size of the client enterpriseCEmployEnterprise total number of employees employed by the client enterprise in the current year taken as a natural logarithm
Table 2. Descriptive statistics of variables.
VarNameObsMeanSDMinMedianMax
GIE31340.58330.1830.270.571.00
EC31341.37340.9440.001.394.20
CD313411.876526.6700.003.00311.00
KS31342.37132.4250.002.209.22
FC3134−3.75560.444−4.65−3.84−2.09
ESG31343.93360.8501.004.007.00
Size313423.82111.71620.2223.5928.64
Lev31340.51990.1890.040.531.05
ROA31340.04660.065−0.380.040.84
Cashflow31340.05350.068−0.340.050.47
FIXED31340.21360.1670.000.170.83
Growth31340.44914.474−0.770.1187.48
TobinQ31341.69261.3490.641.3121.30
FirmAge31343.02090.2901.793.093.66
ATO31340.96781.0090.030.6910.64
CFirmAge31343.02090.2861.793.043.81
CEmploy31347.59621.2334.137.5912.61
Table 3. Benchmark regression: customer firms’ ESG performance and green innovation efficiency.
(1)(2)(3)
VARIABLESGIEGIEGIE
ESG0.0178 ***0.0245 ***0.0138 ***
(5.1643)(7.5936)(4.3711)
Size 0.0145 ***0.0038 *
(6.4692)(1.6907)
Lev 0.00490.0059
(0.2357)(0.2854)
ROA −0.0961 *−0.0295
(−1.6502)(−0.5669)
Cashflow 0.1986 ***0.0089
(3.5721)(0.1691)
FIXED −0.0877 ***−0.0102
(−4.1405)(−0.3961)
Growth −0.0011−0.0002
(−1.5495)(−0.4941)
TobinQ 0.00450.0008
(1.4018)(0.2784)
FirmAge 0.1314 ***0.0349 ***
(12.5421)(3.0787)
ATO 0.0154 ***0.0032
(4.3067)(0.8962)
CFirmAge 0.1036 ***0.0249 **
(9.1621)(2.4030)
CEmploy −0.0209 ***−0.0035
(−8.1308)(−1.3649)
Constant0.5134 ***−0.4209 ***0.2796 ***
(37.3246)(−6.4287)(3.8840)
Observations313431343131
R-squared0.0070.1400.404
YearNONOYES
IndNONOYES
Note: The t-statistics of the coefficient estimates are shown in parentheses below the coefficient estimates, where ***, **, and * indicate significance at the 1%, 5%, and 10% significance levels, respectively.
Table 4. Endogeneity treatment: results from the instrumental variable and PSM methods.
(1)(2)(3)
Phase1Phase2PSM
VARIABLESESGGIEGIE
IV0.9801 ***
(44.9963)
ESG 0.0195 ***0.0232 ***
(3.8655)(5.0067)
Size0.01550.00360.0027
(1.5403)(1.5508)(0.8515)
Lev−0.1987 **0.0090−0.0560 *
(−2.1650)(0.4314)(−1.9074)
ROA0.6230 **−0.0294−0.1652 **
(2.5722)(−0.5361)(−2.0693)
Cashflow−0.5684 **0.01230.0588
(−2.5553)(0.2439)(0.7339)
FIXED−0.0464−0.0094−0.0820 **
(−0.4103)(−0.3676)(−2.1869)
Growth−0.0018−0.0003−0.0006
(−0.6767)(−0.4530)(−1.2121)
TobinQ−0.0426 ***0.00100.0054
(−4.0966)(0.4416)(1.0503)
FirmAge−0.1088 **0.0359 ***0.0331 **
(−2.1904)(3.1717)(2.1982)
ATO−0.0272 *0.00310.0130 *
(−1.7570)(0.8846)(1.6955)
CFirmAge−0.2015 ***0.0272 ***−0.0079
(−4.4921)(2.6353)(−0.5765)
CEmploy0.0298 ***−0.00390.0001
(2.8115)(−1.6229)(0.0345)
Constant0.68350.12730.3777 ***
(1.4469)(1.1816)(3.7068)
Anderson canon. corr. LM statistic 1249.403
Cragg–Donald Wald F statistic 2024.664
Observations313431341541
R-squared 0.4040.446
YearYESYESYES
IndYESYESYES
Note: The t-statistics of the coefficient estimates are shown in parentheses below the coefficient estimates, where ***, **, and * indicate significance at the 1%, 5%, and 10% significance levels, respectively.
Table 5. Robustness tests: fixed effects, changing the measure of explanatory variables, and shifting samples.
(1)(2)(3)(4)
Replacement Fixed EffectsReplace the Explanatory VariablesReplacement of Sample Ranges
VARIABLESGIEGIEGIEGIE
ESG0.0135 ***0.0091 ** 0.0125 ***
(4.3342)(2.0851) (3.8277)
ESG1 0.0122 ***
(4.0784)
Size0.0036 *−0.01570.0039 *0.0044 *
(1.7149)(−0.9677)(1.7288)(1.9436)
Lev0.0199−0.05320.0050−0.0106
(1.0291)(−0.8472)(0.2391)(−0.5022)
ROA−0.0357−0.2155 **−0.0294−0.0228
(−0.6830)(−2.5525)(−0.5650)(−0.4320)
Cashflow0.03040.05940.0082−0.0247
(0.5913)(0.8864)(0.1563)(−0.4674)
FIXED−0.0548 ***0.0930−0.0111−0.0053
(−2.7172)(1.1728)(−0.4304)(−0.1981)
Growth−0.0004−0.0008 **−0.0002−0.0004
(−0.9815)(−2.4786)(−0.4598)(−1.0738)
TobinQ0.00280.00150.0007−0.0013
(0.9833)(0.2587)(0.2458)(−0.4858)
FirmAge0.0200 **0.02610.0347 ***0.0385 ***
(1.9701)(0.3034)(3.0611)(3.3550)
ATO0.0098 ***−0.01730.00310.0061 *
(3.0574)(−1.3433)(0.8812)(1.7019)
CFirmAge0.0186 *0.0265 *0.0238 **0.0209 **
(1.7383)(1.7411)(2.3000)(1.9679)
CEmploy−0.0042−0.0041−0.0033−0.0017
(−1.5332)(−1.2395)(−1.2815)(−0.6413)
Constant0.3478 ***0.8259 **0.2873 ***0.2568 ***
(5.1387)(1.9725)(3.9890)(3.5206)
Observations3131283531312836
R-squared0.4080.6280.4040.415
FirmNOYESNONO
YearYESYESYESYES
IndNONOYESYES
CIndYESNONONO
Note: The t-statistics of the coefficient estimates are shown in parentheses below the coefficient estimates, where ***, **, and * indicate significance at the 1%, 5%, and 10% significance levels, respectively.
Table 6. Knowledge spillover effect and financing constraint effect mechanism test results.
(1)(2)
VARIABLESKSFC
ESG0.0815 **−0.0074 **
(2.2698)(−2.3231)
Size0.9212 ***0.1658 ***
(36.5651)(50.8760)
Lev−0.6415 ***−0.2346 ***
(−2.6729)(−10.4430)
ROA−1.3497 **−0.5143 ***
(−2.2148)(−8.9311)
Cashflow2.0317 ***0.0341
(3.6681)(0.8299)
FIXED−1.5436 ***−0.0801 ***
(−5.3457)(−3.8535)
Growth−0.00380.0001
(−1.4741)(0.4881)
TobinQ0.0903 **0.0185 ***
(2.3243)(5.2114)
FirmAge−0.3895 ***−0.8985 ***
(−2.8263)(−60.9764)
ATO−0.0794 **−0.0041
(−2.1969)(−1.5843)
CFirmAge0.1124−0.0038
(0.9380)(−0.3736)
CEmploy−0.0328−0.0098 ***
(−1.1776)(−3.9728)
Constant−18.2670 ***−4.7425 ***
(−22.2779)(−50.2233)
Observations31313131
R-squared0.5880.912
YearYESYES
IndYESYES
Note: The t-statistics of the coefficient estimates are shown in parentheses below the coefficient estimates, where ***, ** indicate significance at the 1%, 5% significance levels, respectively.
Table 7. Moderating effect test of supplier firm executives’ green perceptions and customer firms’ digitization level.
(1)(2)
VARIABLESGIEGIE
ESG_EC0.0099 ***
(2.9962)
EC0.0096 ***
(2.7171)
ESG_CD 0.0007 ***
(4.8608)
CD −0.0003 ***
(−2.6461)
ESG0.0136 ***0.0165 ***
(4.3610)(5.2714)
Size0.00300.0034
(1.3244)(1.5130)
Lev0.01110.0036
(0.5368)(0.1729)
ROA−0.0128−0.0355
(−0.2453)(−0.6866)
Cashflow0.00530.0147
(0.1017)(0.2812)
FIXED−0.0201−0.0154
(−0.7758)(−0.5956)
Growth−0.0002−0.0000
(−0.4680)(−0.0716)
TobinQ0.00140.0012
(0.4574)(0.4017)
FirmAge0.0325 ***0.0339 ***
(2.8487)(2.9801)
ATO0.00300.0035
(0.8515)(0.9954)
CFirmAge0.0262 **0.0235 **
(2.5421)(2.2621)
CEmploy−0.0034−0.0035
(−1.3293)(−1.3752)
Constant0.2872 ***0.2893 ***
(3.9693)(4.0120)
Observations31313131
R-squared0.4070.407
YearYESYES
IndYESYES
Note: The t-statistics of the coefficient estimates are shown in parentheses below the coefficient estimates, where ***, ** indicate significance at the 1%, 5% significance levels, respectively.
Table 8. Heterogeneity test results of enterprise types.
(1)(2)(3)(4)(5)(6)
Technology-Intensive Supplier CompaniesAsset-Intensive Supplier CompaniesLabor-Intensive Supplier CompaniesTechnology-Intensive Client CompaniesAsset-Intensive Client CompaniesLabor-Intensive Client Companies
VARIABLESGIEGIEGIEGIEGIEGIE
ESG0.0167 ***0.01140.0109 **0.0118 ***0.00030.0225 ***
(3.4685)(1.5406)(2.1125)(2.6993)(0.0321)(3.5220)
Size−0.00050.00560.00390.0051−0.00830.0084 **
(−0.1385)(0.9464)(1.1252)(1.3839)(−1.3119)(2.0232)
Lev0.04130.0468−0.0410−0.01250.1003 *−0.0253
(1.2361)(0.9968)(−1.1184)(−0.4227)(1.7737)(−0.6191)
ROA0.0942−0.0947−0.1017−0.0838−0.1162−0.1001
(1.1568)(−0.7412)(−1.1786)(−1.0159)(−0.8337)(−1.1325)
Cashflow0.02400.13800.01480.01290.3162 ***−0.1543
(0.2991)(1.0313)(0.1776)(0.1736)(2.6043)(−1.4816)
FIXED−0.1254 ***0.0372−0.0023−0.04200.03050.0088
(−2.7248)(0.7264)(−0.0478)(−1.1271)(0.4992)(0.1551)
Growth0.0078−0.0107−0.0000−0.0007 ***0.00020.0027 ***
(0.8403)(−0.7975)(−0.0812)(−3.1168)(0.0985)(4.4637)
TobinQ0.00340.0133−0.0125 ***−0.00210.00720.0270 ***
(1.0068)(1.5868)(−3.0436)(−0.6211)(0.8599)(3.8281)
FirmAge0.01400.00960.0541 ***0.0354 **0.05090.0264
(0.7261)(0.3572)(3.0564)(2.0917)(1.6007)(1.1152)
ATO−0.0252 **−0.00800.00470.00420.01200.0005
(−2.2780)(−0.5032)(1.1869)(0.8212)(1.2792)(0.0719)
CFirmAge0.01610.01040.0320 *0.0295 **0.00650.0240
(1.0131)(0.4441)(1.8692)(2.0469)(0.2058)(1.0943)
CEmploy−0.0018−0.0015−0.0087 **−0.0070 *0.0033−0.0027
(−0.3961)(−0.2774)(−2.2516)(−1.6650)(0.4757)(−0.6355)
Constant0.4486 ***0.27410.3134 ***0.2882 ***0.4758 **0.1508
(3.8085)(1.5338)(2.7325)(2.7367)(2.2369)(1.0225)
Observations1239598128915285571031
R-squared0.3980.3620.4460.4140.4950.450
YearYESYESYESYESYESYES
IndYESYESYESYESYESYES
Note: The t-statistics of the coefficient estimates are presented in parentheses below the coefficient estimates, where ***, **, and * indicate significance at the 1%, 5%, and 10% significance levels, respectively.
Table 9. The heterogeneity test results of government environmental concern in the city where the firms are located.
(1)(2)(3)(4)
High Level of Attention to the Governmental Environment in the City Where the Client’s Business Is LocatedLow Attention to the Governmental Environment in the City Where the Client’s Business Is LocatedHigh Level of Attention to the Governmental Environment in the City Where the Supplier’s Business Is LocatedLow Attention to the Governmental Environment in the City Where the Supplier’s Business Is Located
VARIABLESGIEGIEGIEGIE
ESG0.0181 ***0.0099 **0.0199 ***0.0026
(4.1306)(2.0940)(5.1523)(0.4418)
Size0.0067 **−0.00160.00200.0125 **
(2.2947)(−0.4353)(0.7365)(2.5040)
Lev0.0261−0.00770.0311−0.0569 *
(0.9180)(−0.2412)(1.1439)(−1.6584)
ROA0.0070−0.1695 *0.0501−0.2460 ***
(0.1088)(−1.8029)(0.7061)(−3.1540)
Cashflow−0.1556 **0.2383 ***−0.06360.2179 ***
(−2.1768)(3.0916)(−0.9670)(2.6251)
FIXED0.0227−0.04500.0017−0.0388
(0.6564)(−1.1276)(0.0506)(−0.8919)
Growth0.0000−0.0014 ***−0.00020.0127 ***
(0.0345)(−3.4869)(−0.6023)(5.1146)
TobinQ0.00130.0025−0.00270.0091 **
(0.4005)(0.4491)(−0.6420)(2.4038)
FirmAge0.01840.0562 ***0.02200.0537 **
(1.2439)(3.0674)(1.6075)(2.5733)
ATO0.00040.0056−0.0128 ***0.0125 **
(0.0977)(0.9564)(−3.0600)(2.0719)
CFirmAge0.0234 *0.00300.01710.0356 *
(1.7923)(0.1783)(1.3409)(1.9057)
CEmploy−0.0056 *0.0001−0.0046−0.0071
(−1.7977)(0.0296)(−1.5014)(−1.3837)
Constant0.2760 ***0.3739 ***0.3801 ***0.0600
(3.0099)(3.1528)(4.2511)(0.4458)
R-squared0.4310.3970.4080.485
YearYESYESYESYES
IndYESYESYESYES
Note: The t-statistics of the coefficient estimates are shown in parentheses below the coefficient estimates, where ***, **, and * indicate significance at the 1%, 5%, and 10% significance levels, respectively.
Disclaimer/Publisher’s Note: The statements, opinions and data contained in all publications are solely those of the individual author(s) and contributor(s) and not of MDPI and/or the editor(s). MDPI and/or the editor(s) disclaim responsibility for any injury to people or property resulting from any ideas, methods, instructions or products referred to in the content.

