Article

Characterisation of Waste Textiles from Mixed MSW and Separate Collection—A Case Study from Vienna, Austria

Christian Doppler Laboratory for a Recycling-Based Circular Economy, Institute of Chemical, Environmental and Bioscience Engineering, TU Wien, Getreidemarkt 9, 1060 Wien, Austria
*
Author to whom correspondence should be addressed.
Sustainability 2025, 17(12), 5484; https://doi.org/10.3390/su17125484
Submission received: 30 April 2025 / Revised: 6 June 2025 / Accepted: 11 June 2025 / Published: 13 June 2025
(This article belongs to the Special Issue Recycling Materials for the Circular Economy—2nd Edition)

Abstract

Textile recycling approaches require input material streams of defined purity. Establishing sorting facilities and defining viable sorting fractions for efficient subsequent recycling necessitates knowledge on the composition and material content of the textiles to be processed. Subsequently, this information is crucial for the implementation of a sustainable circular economy for textiles. This study presents the results of a comprehensive waste textile sampling and characterisation along with data on the quantities and composition of waste textiles in Vienna in 2022. The data reveals that only 28% of the 19,975 t of waste textiles generated end up in separate collection, of which a significant amount goes to the international market. However, the results regarding the fibre composition show that textiles from mixed municipal solid waste and separate collection are very similar. Cotton fibres accounted for approx. half of the fibre mass from non-complex textiles, with 9328 t overall (6776 t in the mixed municipal solid waste and 2522 t in separate collection). A further analysis regarding fibre blends found that a total of 6275 t of single-fibre materials and 5132 t of two-fibre materials were present. This reveals great potential for using this waste stream in fibre-to-fibre recycling processes. Collecting accurate data on this waste stream enables sorters and recyclers to tailor their processes to the expected input material. By increasing the amount of recycled materials, the share of incinerated or landfilled textiles will decrease, which in turn will have a positive impact on the environment. However, further research in textile identification and material separation as well as regulations to keep these materials in a sustainable closed loop are required.

Graphical Abstract

1. Introduction

The consumption of apparel has experienced massive growth over the past decades. This growth can be attributed to the population increase and, more recently, to the rise of fast fashion [1,2]. This elevated consumption results in an overall increase in the impact of the textile industry on the environment. Textile processing demands significant energy input and resources, while generating emissions to air, water, and soil, and ultimately the produced articles will become textile waste [3,4]. Adding to that, and contrary to many other commodities, these adverse effects for the environment are not only generated in primary material production, but accumulate along each step of the textile processing chain [5]. One central approach to meet these challenges is the implementation of a circular economy (CE) [6,7].
To promote a CE in the textile industry, the European Commission (EC) has started to take measures and present various strategies. Through the amendment of the Waste Framework Directive 2018/851, textiles were explicitly defined as part of municipal solid waste (MSW) and are required to be collected separately as of 2025 [8]. Additionally, the EU strategy for sustainable and circular textiles published in 2022 introduced strategies for eco-design, an extended producer responsibility system, and regulations for textile export from Europe, among other things [9]. As a consequence, it can be expected that substantial amounts of waste textiles presently disposed of in mixed MSW collections will end up in separate collected waste textile collections. This must be taken into account by any prospective analysis of the material flows of waste textiles.
With respect to management options for separately collected waste textiles, reusable waste textiles should be reused, while non-reusable waste textiles should be recycled, preferably by fibre-to-fibre recycling. This recycling path would keep the textiles in a closed loop for as long as possible, conserving primary resources and reducing emissions [10,11,12]. However, according to the Ellen MacArthur Foundation [13], the majority of recycled textiles end up in open-loop processes for use in lower-value applications, like the production of cleaning rags, insulation materials, etc. In addition, other options and laboratory approaches for open-loop processes are described in the literature. Among others, these include the utilization of waste textiles for the production of platform chemicals, the synthesis of metal–organic frameworks, and electrotechnical applications [14,15,16,17,18,19]. In order to effectively close the loop, appropriate separate collection sorting and pre-treatment steps are required to facilitate a defined and predictable input stream for fibre-to-fibre recycling. However, due to the complexities within the textile recycling chain, this is not easily facilitated, as McKinsey & Company [11] highlighted. Today, textiles are primarily sorted by hand; only recently has sorting via sensor-based technologies been introduced on an industrial scale [20]. Although the detection of pure materials already shows promising results, challenges persist in the correct identification of materials in multi-layered textiles or textiles with a multitude of additional components, as well as materials in small quantities in blends [21]. Correct identification and sorting are particularly important, as recycling processes need to be engineered to cope with the entire range of materials in a sorting fraction. A well-established and comparatively simple recycling process is mechanical recycling, which can handle a wide range of materials, but preferably single-fibre materials [22,23]. As fibre producers require a very pure input stream, fibre blends must be (chemically) processed first and the fibre types separated from each other. Tailored processes are required for each blend, which present technical challenges, as the recovered fibres must also have sufficiently high quality for subsequent fibre spinning processes. The more fibre types a textile is comprised of, the more complex the technical implementation and the higher the costs [24]. Although such processes already exist for certain materials, for example for cotton/polyester or polyester/elastane blends [22,25,26,27], further research is still necessary to be able to exploit the entire potential of textile recycling.
This further research must first establish a comprehensive understanding of the quantities and composition of textile waste in both separate collection and mixed MSW, in order to efficiently design sorting and recycling plants. Material flow analysis (MFA) is a well-suited tool for preparing such data. It is commonly used to model specific waste streams, but has not yet been often applied to waste textiles. While there are various reports on textile waste volumes in the EU [11,20,28], there are only a few studies that have investigated these material flows in more detail. Dahlbo et al. [29] carried out an MFA of waste textiles in Finland based on literature data from 2012, and assessed the environmental impact of several recovery/recycling scenarios. In 2021, they also published a report on the textile flows in Finland for 2019 [30]. Koligkioni et al. [31] conducted a similar study for Denmark for the reference year 2018, and Malinverno et al. [32] analysed the mass flows of workwear in Switzerland in 2019. At the EU level, Amicarelli et al. [33] and Napolano et al. [34] carried out MFAs on waste textiles based on literature data for the reference years 2018 and 2019, respectively. Among other things, these two publications also address waste flows relating to fibre materials, but the volumes are either based on consumption rates or have been assumed/estimated. As there was hardly any detailed information about the composition of waste textiles at the national level, Nørup et al. developed a quality assessment method for textiles and applied it to textile waste from MSW and small combustibles in Denmark [35,36]. This was one of the first studies to analyse these waste streams according to type, processing method, reusability, and recyclability, and it also provided an overview of their composition. A more recent report from Refashion [37] described in detail the composition and the types of textiles found in the non-reusable fraction from selected sorting plants in France. Furthermore, Weber et al. [38] published the results of their waste textile assessment regarding textile types, quality, and general composition from the mixed MSW in Ontario.
In order to contribute to the database on textile waste, this article presents the results of the sampling and characterisation of waste textiles, using the Austrian capital of Vienna for the case study. Waste samples were collected from mixed MSW and from the container collection of a charitable organisation in the public area of Vienna, in this article referred to as separate collection (SC). By analysing these two sources, an in-depth comparison of therein found waste textiles is enabled and can in turn provide information about the disposal behaviour of consumers. This large-scale waste textile analysis enables the description of recycling-relevant characteristics in a hitherto unique level of detail for the City of Vienna. The results in this article will be presented using material flow analysis (MFA).
Considering the reference year 2022, the following research questions were investigated:
(1)
What are the amounts of waste textiles in mixed MSW (WT-MW) and in separate collection (WT-SC) in Vienna?
(2)
What are the properties of those textiles, particularly in regard to material composition and textile type?
(3)
How do the material flows of WT-MW and WT-SC relate to the analysed properties?

2. Materials and Methods

The data used for calculating the fundamental structure of the MFA presented here originates from the current status report in the federal Waste Management Plan [39] as well as the current Vienna waste analysis [40]. It applies to the year 2022 and the city of Vienna. All mass values refer to dry mass and all percentages refer to percentage in weight by mass, if not stated otherwise. Waste textiles are defined in this article as end-of-use clothing, footwear, and household textiles (e.g., towels, bed linen, etc.).

2.1. MFA of Waste Textiles in Vienna

2.1.1. Methodological Background

MFA is defined by Brunner and Rechberger [41] as “a systematic assessment of the state and changes of flows and stocks of materials within a system defined in space and time” and can be used, among other things, to estimate the potential of certain materials for subsequent recycling processes. It is a commonly used tool in waste management to model and calculate material flows (F) in complex systems consisting of technical or economical processes (P), based on the principal of mass conservation. The basic principle for this can be seen in the mass balance equation shown in Equation (1). The formula determines that the sum of all material flows going into a process ( k I m ˙ i n p u t ) equals the sum of all output flows ( k 0 m ˙ o u t p u t ) while also taking into account the material flows entering or exiting a storage ( m ˙ s t o c k ).
k I m ˙ i n p u t = k 0 m ˙ o u t p u t + m ˙ s t o c k
Equation (2) shows the calculation of the mass transfer coefficient ( T C i ) for a specific material flow i, which describes the distribution of the sum of all material flows going into a process ( k I m ˙ i n p u t ) into the specific material flow output stream.
T C i = m ˙ o u t p u t , i k I m ˙ i n p u t
To calculate the material flows of specific sub-goods or substances, the material flows of the goods must be combined with the proportion of the therein contained sub-goods or substances, as shown in Equation (3).
m i j = m i × c i j
The mass of the material flow i in relation to the sub-goods or substances j is m i j , m i is the total mass of the material flow i, and c i j is the content in weight percent by mass of the sub-good or substance j in the material flow i. The sub-goods and substances are described in detail in Section 2.2.2.

2.1.2. Textile Waste Management in Vienna

In Vienna, clothing and household textiles can generally be collected in two different ways, namely in mixed MSW (waste code SN 91101) or in SC, which includes collection containers and drop-off points at second-hand shops (waste code SN 58107). Further sources containing waste textiles, such as business waste, bulky waste—which mainly contains mattresses, rugs and furniture fabrics [42]—as well as technical textiles (e.g., medical textiles, agro textiles, industrial textiles, etc.), are of lower relevance for fibre-to-fibre recycling and were therefore not considered. Bernhardt et al. [42] showed, for Vienna in 2018, that 83% of the textiles in the mixed MSW consisted of clothing and household textiles, 16% were technical textiles, and 1% came from production waste. In general, textiles in mixed MSW made up 62% of all the textiles in MSW, 23% came from bulky waste, 13% from medical waste, and 2% from mineral and other fibres. The SC is handled by municipalities (12% of the total collection), charitable organizations (57%), and commercial collectors (31%) [42]. The City of Vienna has a general guideline on which textiles should be disposed of in which collection stream [43]. Currently, collection containers for charitable and commercial collectors are available in public areas, and containers for municipal collectors are located at Vienna’s waste disposal and recycling centres. The target fractions for the SC depend on the collector but are in principle clean, usable clothing and household textiles suitable for reuse [44,45,46,47]. The separately collected waste textiles are either processed in Vienna for the domestic waste textiles market or exported to the international market. In both cases, the textiles are processed by sorting and then prepared for reuse, recycled, or treated in waste incineration plants for thermal recovery [42]. Even though other forms of disposal, including landfilling or open dumping, for instance, are reported for exported textiles in general, there is no information on whether this also applies to waste textiles from Vienna. The majority of textile waste in Vienna can still be found in mixed MSW. Currently, the mixed MSW generated in Vienna is incinerated in the city [48].
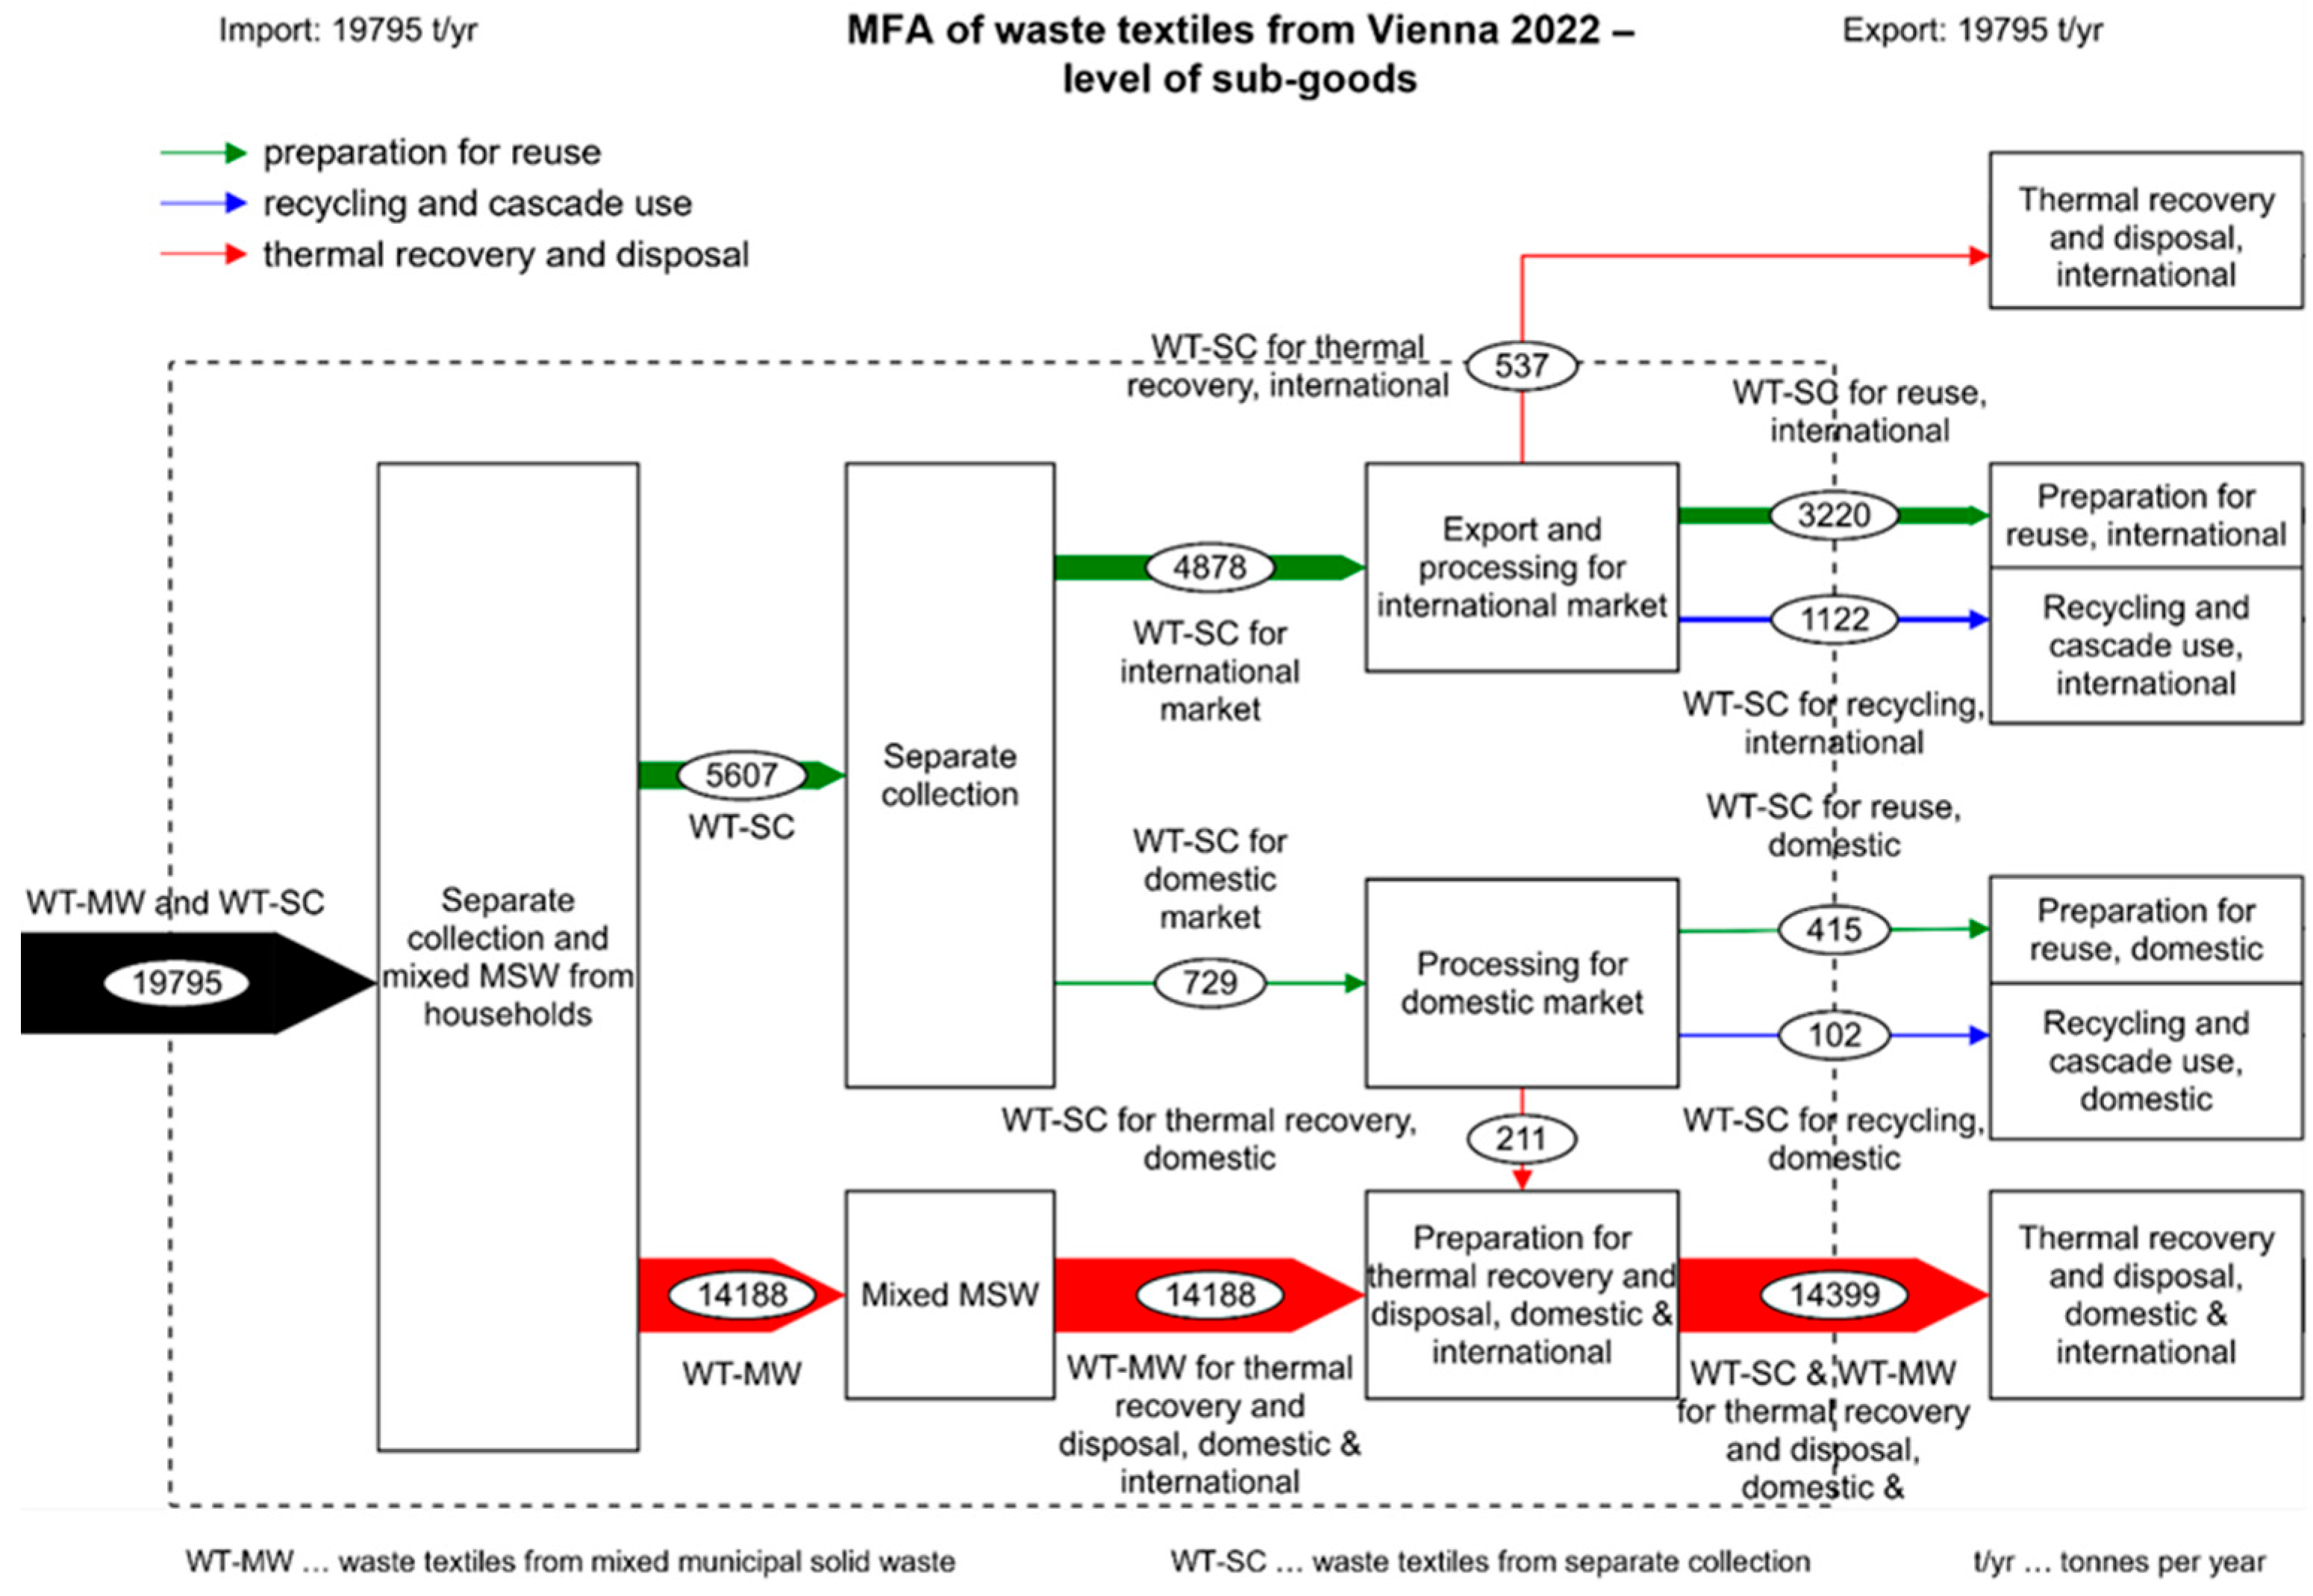
Based on this information, the MFA model for waste textiles in Vienna in 2022 was defined as shown in Figure 1. Material flows (F) are consecutively numbered and highlighted by colour depending on the management strategy, with green for reuse (second-hand clothing), blue for material recycling, and red for thermal recovery by waste incineration. Only the input of waste textile containing wastes into the system is shown in black. Recycling and cascade use hereby describes all textiles that are not included in preparation for reuse and thermal recovery. This includes fibre-to-fibre recycling, the production of cleaning rags and insulation materials, etc.

2.1.3. Material Flows of Goods and Transfer Coefficients

In MFA, material flows are first modelled for goods, namely tradeable materials such as mixed MSW, separately collected waste textiles, and the resulting produced and diverted material flows [41]. In 2022, separately collected textile waste (F2) in Vienna amounted to 5607 t [39]. According to [42], in 2018 more than 99% of this collection consisted of scraps, cuttings, and trimmings of fabrics and end-of-use textiles (waste code number 58107) [49]. This distribution was also applied to the year 2022, based on the premise that there was no significant increase in cellulose fibres, other fibres, and glass fleece in the SC in Vienna over the following years. The amount of mixed MSW in Vienna in 2022 was 506,698 t [50], 3.7% of which comprised waste textiles [40]. However, these waste textiles had a moisture content of 17% and contaminants of non-textile origin of 8%, resulting in a dry mass content of 2.8% of waste textiles in mixed MSW. Accordingly, there were 14,188 t of waste textiles in this stream (F3). The sum of these two streams gives a total mass flow (F1) of waste textiles from mixed MSW, from households and from separate collections for Vienna, of 19,795 t. Since there is no data available for Vienna for the distribution of these mass flows into the respective domestic and international processes (F4, F5 and F7–F12), the data at the federal level for the year 2022 from [39] was used (see Supplementary File S1 for the calculations).

2.2. Sampling and Characterisation

2.2.1. Sampling of Mixed MSW and Separate Collection

After modelling the material flows of goods, the second step in MFA is the modelling of the material flows of sub-goods and other contents of goods [41]. Sub-goods are materials contained in the material flows of goods that can be distinguished and categorized according to specific properties, in the present case fibre materials. To determine the content of sub-goods in a material flow, samples have to be collected and analysed. Samples from the mixed MSW for this study were obtained from MA 48, as part of a MSW sampling campaign in Vienna in 2022. The collection of samples and sample analysis was conducted by an engineering company according to the Austrian technical guidelines for waste sampling [51]. The sampling campaign was carried out in two phases, one in spring and one in autumn [52]. A total of 7800 kg of mixed MSW was collected from 600 random samples and the respective daily collection volume of 240 litres was sorted on the same day. During this campaign, approximately 290 kg of waste textiles were found. Before our analysis, the samples were air-dried for one week, reducing their mass to approximately 240 kg, and subsequently characterized according to the sorting scheme described in Section 2.2.2. Samples for the separate collection were taken from the collection container of the charitable organization “Caritas der Erzdiözese Wien”. A total of 77 of the 114 containers located in Vienna (as of 2024, [53]) were sampled; these were evenly distributed across the city, ensuring representative sampling (see Figure S1 in Supplementary File S1). This was carried out in summer over a period of one week, with approximately 300 kg of samples being taken from the collection vehicle on each day of the sampling week, resulting in a total of 1460 kg. As these samples were all dry, they were characterized without an additional drying step.

2.2.2. Characterisation and Fraction Descriptions

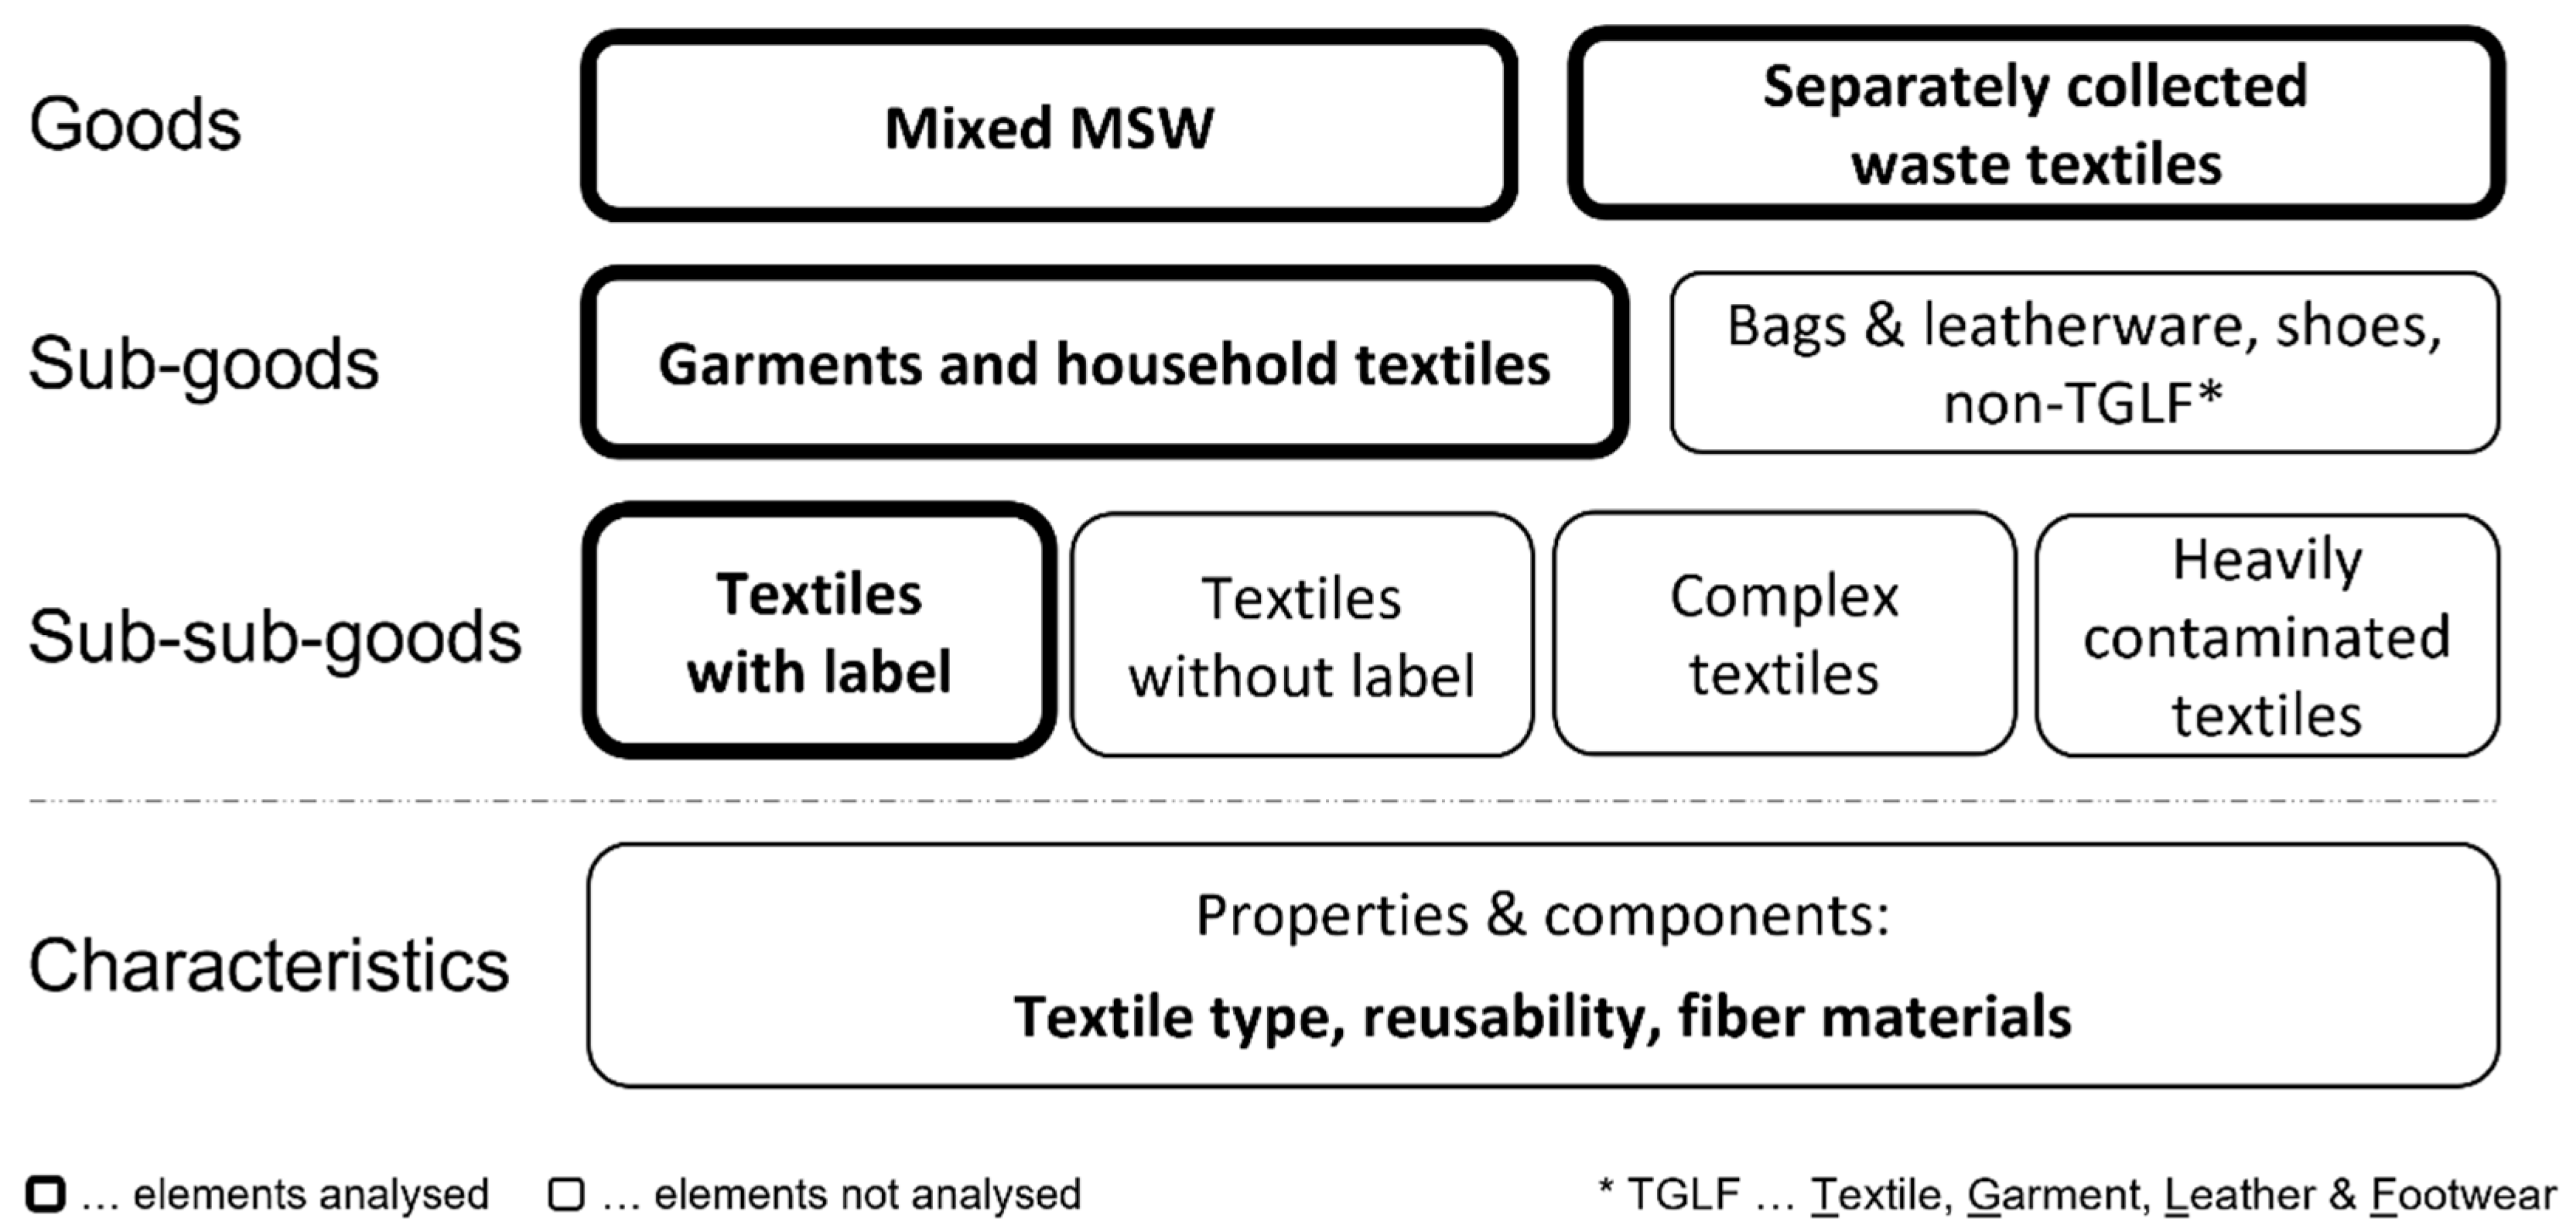
The primary focus of this characterisation was to assess the potential of waste textiles for processing in fibre-to-fibre recycling. Therefore, for the first step, all sub-goods that could not be used for this purpose were sorted out, which included bags and leatherware, shoes, and all sub-goods that do not belong to the categories of textiles, garments, leather, or footwear (non-TGLF). Each fraction was weighed separately to calculate the respective contents. Only the mass of footwear from WT-MW was taken from the Vienna waste analysis [40]. The remaining garments and household textiles were subdivided into four categories: textiles with labels, textiles without labels, complex textiles, and heavily contaminated textiles. Prioritisation was applied right to left, e.g., textiles categorized as complex but also bearing a label were assigned to the complex fraction. Heavily contaminated textiles include all those that would not meet the cleanliness requirements for a fibre-to-fibre recycling process even after a washing step. In our analysis, this included contaminants such as oil stains, paint, mould, etc. Complex textiles refer to all sub-sub-goods with multiple layers, filling materials, and/or a variety of accessories (such as buttons, sequins, patches, etc.), as these characteristics hinder the generation of pure sorting fractions. Afterwards, all remaining sub-sub-goods were individually weighed and selected properties and components—namely textile type, reusability, and fibre materials—were documented. Textile type specifies the product category of each respective textile, such as T-shirts, pants, or bed linen. A detailed overview can be found in Supplementary File S1. Reusability refers to whether the textile meets the quality requirements for resale in a second-hand shop. For a textile to be resold at a second-hand shop from Caritas, it has to be in at least very good condition. This means that no buttons were allowed to be loose, the colours were not washed out, there were no holes in the textile, etc. This information was obtained from Caritas and, for our research, we conducted our assessment according to these requirements. When compared to the study from Weber et al. [38], this would correspond to a textile grade of “B” and above. This characteristic refers only to WT-SC, because it was assumed that textiles from the mixed MSW would not be resold. Fibre material information was derived from the labels (see limitations in Section 3.4). Information on the following fibre types was acquired: cotton (CO), polyester (mostly polyethylene terephthalate; PET), elastane (EL), lyocell (CLY), viscose (CV), polyamide (PA), polyacrylonitrile (PAN), aramid (AR), linen (LI), silk (SE), wool (WO), and other fibre types (e.g., metallic fibres, acetate fibres, polypropylene fibres). An overview of the overall sorting scheme is shown in Figure 2.
Figure 2 also displays the classification of material flows across different calculation levels. In this study, the first level represents goods, which covers the flows containing waste textiles, in this case mixed MSW and SC. The second level is sub-goods, and it defines specific waste textile categories—namely garments, household textiles, bags and leatherware, shoes, and non-TGLF items—contained in both material flows of goods. Level three, the sub-sub-goods, contains the fractions textiles with labels, textiles without labels, complex textiles, and heavily contaminated textiles generated from garments and household textiles. The fourth level consists of characteristics, and it describes the selected properties of textile type and reusability of the fraction textiles with labels as well as the composition at the substance level. In addition, a distinction is made here between single and multi-fibre materials. To calculate the material flows for each level, the material flows at the level of goods (Section 3.1) are combined with the results of the characterisation (Section 3.2.2) according to Equation (3).

3. Results and Discussion

3.1. Material Flows of Waste Textiles in Vienna

While the material flows at the level of goods that contain waste textiles is shown in Figure S2 in Supplementary File S1, the material flows of waste textiles at the sub-goods level, which were calculated as described in Section 2.1.3, are illustrated in Figure 3. The overall mass of waste textiles amounted to 19,795 t in Vienna in 2022. Considering that Vienna had a population of 1,931,593 at the beginning of 2022 [54], this results in 10.2 kg of waste textiles per capita in 2022. Similar values for the per capita volume were described by Dahlbo et al. [29], with 13.2 kg per capita for Finland in 2012 (with a waste textile volume of 71,300 t) and by Malinverno et al. [32], with 12.5 kg per capita for Switzerland in 2019 (waste textile volume of 107,400 t). At 116,492 t, Denmark’s waste textile volume in 2016 was similar to that of Switzerland, but the per capita volume was almost twice as high at 20 kg. The quantity of WT-MW was approximately three times that of WT-SC, which results in a collection rate of 28% in relation to these two collections. Based on Napolano et al. [34], this collection rate is slightly above the EU average of 22.4% for 2019. However, this number is much lower compared to Switzerland (52%) and Denmark (62%) [31,32]. Furthermore, the data for Vienna indicates that 87% of WT-SC was exported and subsequently mainly reused or recycled. This export rate is noticeably high also when compared to the rates of Finland (66%) and Denmark (62%) [30,31]. In comparison to domestically handled textiles, there is a lack of transparency regarding the exact pathway of exported textiles, e.g., whether textiles exported for reuse are actually offered for sale again after preparation for reuse or disposed of elsewhere. For a truly circular textile economy, more transparency about those pathways is needed. Of the WT-SC remaining on the domestic market, 57% was directed towards reuse, 29% towards thermal recovery, and 14% was distributed between recycling and cascade use. The majority of the latter is going into the production of cleaning rags and insulation materials [39]. In contrast, textiles in the mixed MSW are completely directed towards thermal recovery by waste incineration [48].

3.2. Composition of Waste Textiles in Vienna

3.2.1. Sub-Goods and Sub-Sub-Goods

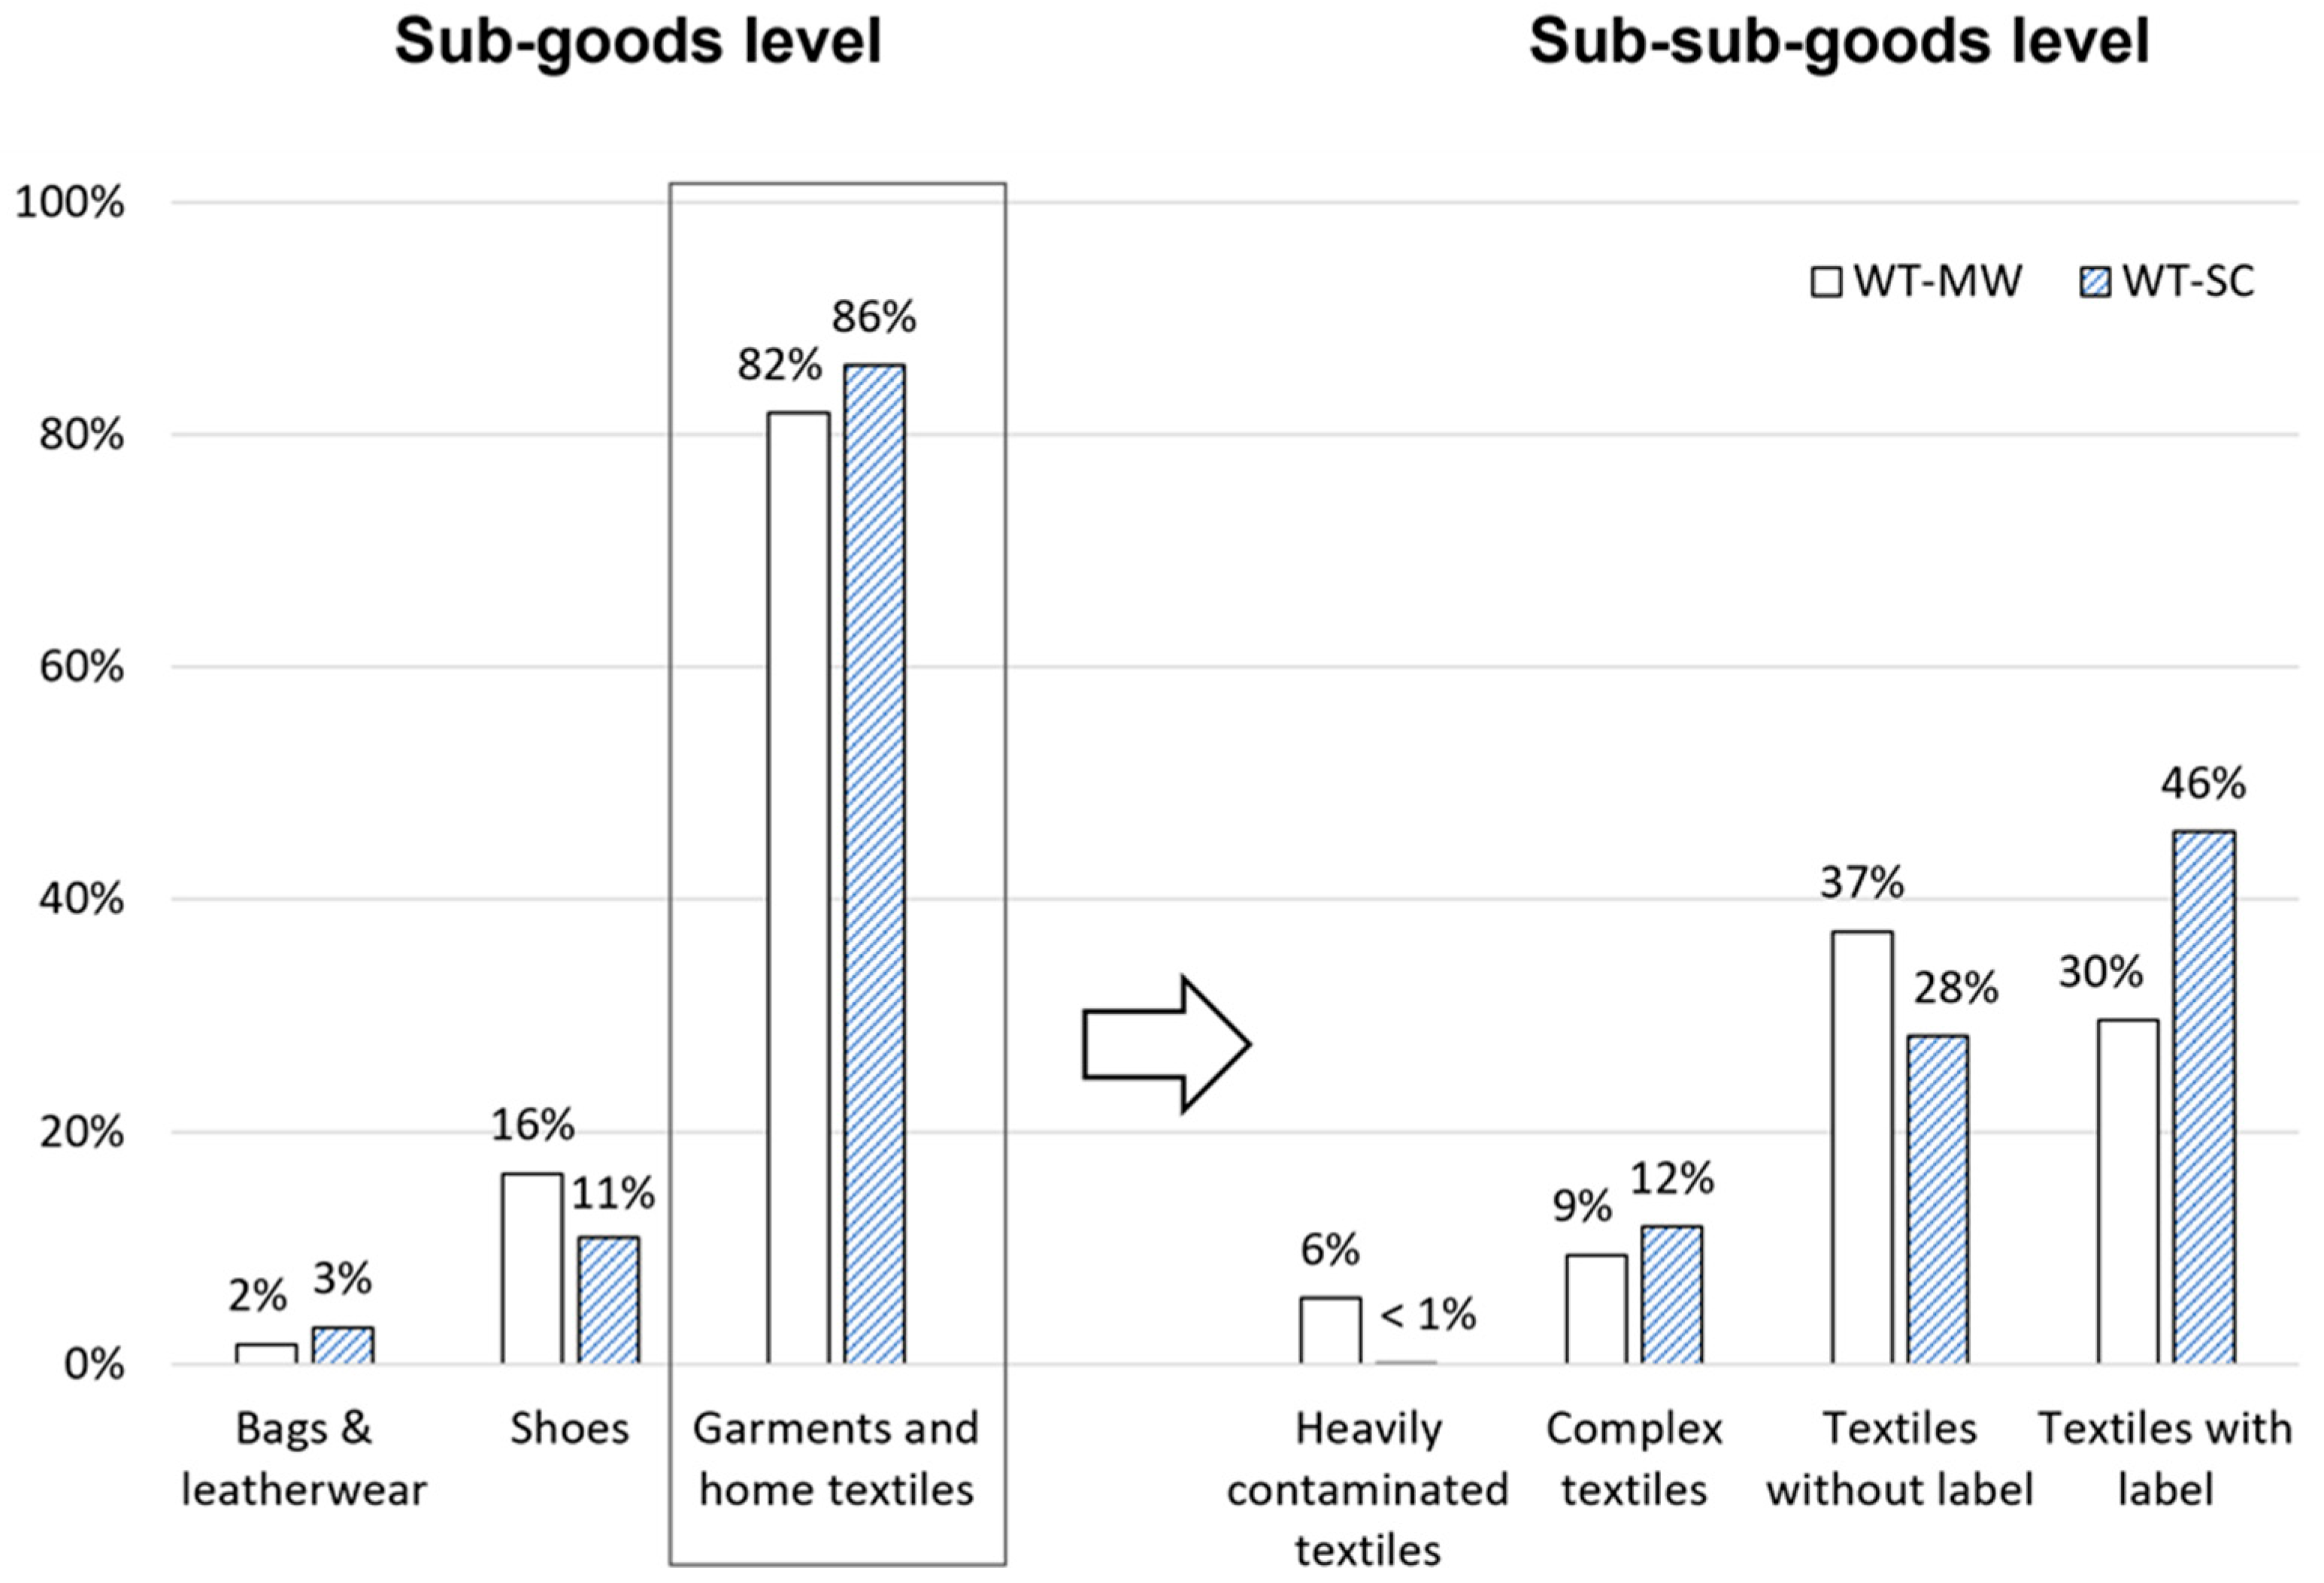
Figure 4 shows the contents of the waste textile sampling and characterisation at the sub-goods and sub-sub-goods level. The proportion of non-TGLF items from the SC (which accounted for 5% of the total analysed mass from the SC) was excluded from this presentation in order to enable a direct comparison between the two sources. The left-hand side of the graph, representing the level of sub-goods, shows a high proportion of garments and household textiles in both sources; 82% for WT-MW and 86% for MW-SC. Footwear was the second largest fraction, accounting for 16% and 11%, respectively [40]. These results align closely with the findings of the Refashion report mentioned in Section 1. In their study, a 10.5% share of footwear and an 89.5% share of garments and household textiles were found in the SC [37].
Based on the results from the level of sub-goods, the majority of the waste textiles would be accessible for fibre-to-fibre recycling, and this finding is also evident at the level of sub-sub-goods. As can be seen on the right-hand side of Figure 4, 67% of garments and household textiles in the WT-MW and 74% in the WT-SC consist of non-complex and clean textiles (textiles with labels and textiles without labels), which again would be easily accessible for recycling processes. Complex textiles and heavily contaminated textiles, 9% and 6%, respectively, of WT-MW, and 12% of WT-SC, pose significant challenges for sorting and recycling, as mentioned in Section 2.2.2.

3.2.2. Characteristics

The following section focuses exclusively on textiles with labels, representing 30% of the total analysed mass of WT-MW and 46% of WT-SC. Unless stated otherwise, all further percentages refer to these fractions and are scaled to 100%.
Textile Types
Overall, the analysed textiles were divided into three main categories, namely upper garments, undergarments, and household textiles. Undergarments refer to textiles in direct and/or close contact with the body, while upper garments are typically worn over undergarments. Household textiles encompass textiles designated predominantly for indoor use. A detailed list of all textile types in the respective main categories, as well as their percentage shares in terms of mass and quantity, can be found in Table S2 in Supplementary File S1. Table S3 in Supplementary File S1 shows that upper garments account for the majority of labelled textiles in WT-MW and WT-SC at 78% and 91%, respectively, followed by household textiles and undergarments (in terms of mass). By quantity, undergarments outnumber household textiles in both sources (18% compared to 14% in WT-MW and 9% to 4% in WT-SC). To a certain extent, this was expected, as undergarments are replaced more frequently than other textiles and also have a comparatively low mass. Additionally, undergarments and household textiles were generally more prevalent in WT-MW than in WT-SC. This could be due to the fact that textiles, which are in close contact with the body, are more likely to be disposed of in the mixed MSW by consumers, even if they are to some extent advertised for separate collection.
Figure 5 illustrates these findings, highlighting the most common textiles by mass and quantity for each source. In both sources, the four most common textile types by mass are pants, T-shirts, pullovers, and vests. This is consistent with the results of the study conducted by Refashion [37] but not with the results from Napolano et al. [34]. Regarding garments and household textiles, their study concluded that the most common textile types in the EU in 2019 were jackets, jumpers, carpets, non-woven items, cleaning articles, and only then pants [34]. While pants and T-shirts were the most frequently represented textile types overall in this study, underpants (by quantity) and household textiles were particularly prominent in WT-MW. The quantity of undergarments and household textiles is likely higher in the fraction textiles without labels compared to those with labels. These textiles either inherently have no label—such as socks—or it has been removed by the consumer. It was also found that some articles are preferably disposed of in only one of the two sources. For example, in our analysis there were no bathrobes found in the WT-MW, while they accounted for 1% of the mass of labelled textiles in the WT-SC.
Fibre Types
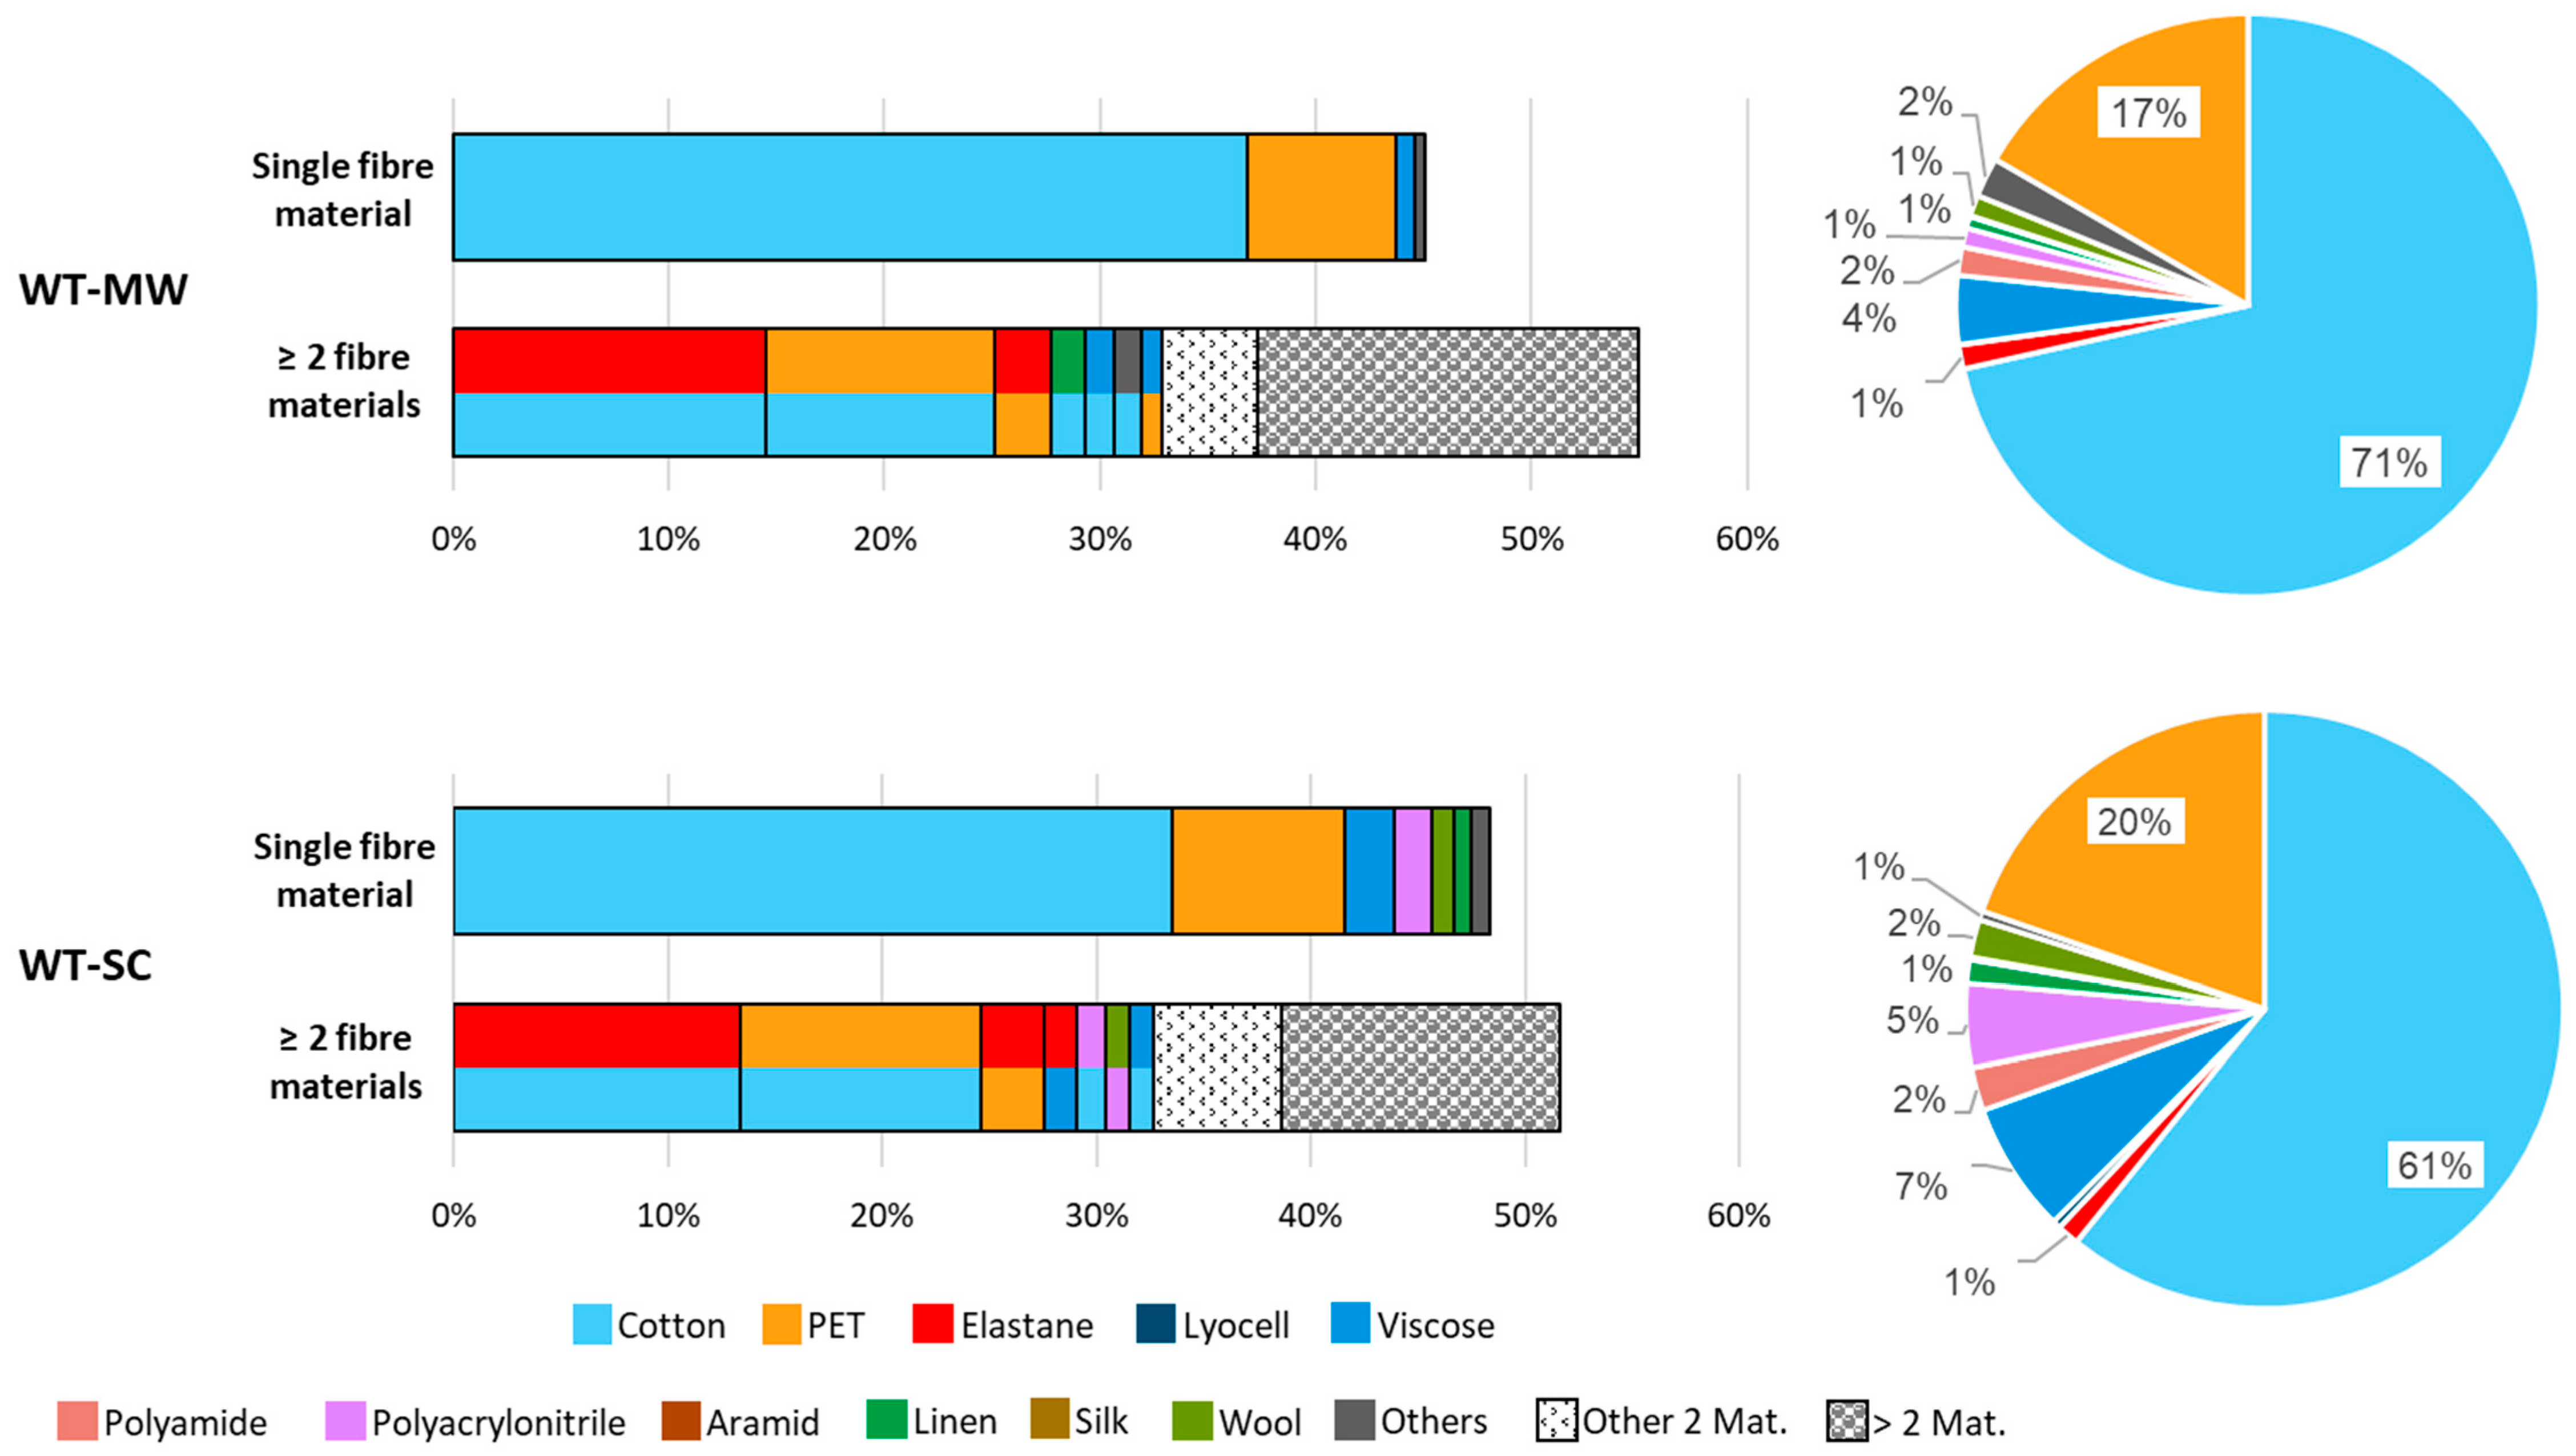
Figure 6 shows the proportions of fibre materials in textiles with labels from WT-MW and WT-SC according to the fibre types specified in Section 2.2.2. The pie charts show the total mass of fibre materials from the respective source; the bar charts represent the distribution by mass into single-fibre materials and ≥2 fibre materials. Single-fibre materials refer to textiles which, according to the label, consists of only one fibre type, while ≥2 fibre materials refer to textiles containing two or more fibre types. It should be noted that the sewing yarn was excluded from this analysis, since it is not listed on the labels (see also limitations in Section 3.4). The most common two-fibre material blends in terms of mass are highlighted and are represented in the respective two-coloured segments of the bar charts (e.g., textiles containing cotton and elastane are coloured light blue and red). This representation does not reflect the proportional distribution of the materials in the blend. The fraction Other 2. Mat. summarises the remaining two-fibre material combinations, each of which accounted for <1% of the total mass of textiles with labels. > 2 Mat. refers to textiles with three or more different textile types. A list of the mass percentages of the respective fractions referring to the bar charts in Figure 6 can be found in Table S4 in Supplementary File S1.
The results of this analysis show that both WT-MW and WT-SC contain a high share of cotton fibres. Cotton fibres accounted for 71% in WT-MW and 61% in WT-SC of the total fibre mass of textiles with labels. PET fibres were the second most common with 17% and 20% respectively, followed by viscose fibres (4% and 7%) and PA (2% in WT-MW) and polyacrylonitrile (5% in WT-SC). The proportion of PET fibres is noticeably low here, especially when these values are compared to the data on global fibre production volumes. According to the annual Preferred Fiber & Materials Market Report [55], 54% of all fibres produced in 2022 were PET fibres, while cotton fibres only accounted for 22%. One reason for why this ratio is not reflected in the results could be that technical textiles were not included in this analysis, as they are not normally disposed of in mixed municipal solid waste or placed in a charitable separate collection. PET, PA and polypropylene are the three most common conventional fibre types found in technical textiles [56] and these textiles accounted for approx. 29% of all textiles produced in the EU in 2021 [57]. Another and possibly more significant reason for this discrepancy could be that PET fibres may be used more frequently in clothing and household textiles outside Central Europe. The proportion of CO and PET in the present study is noticeably high also when compared to the results of other studies. Napolano et al. [34] describe a CO content of 37% and a PET content of 32% for the EU for 2019, but this also includes footwear and technical textiles. The results from Refashion [37] state a content of 43% and 19% for CO and PET respectively of non-reusable garments and home textiles.
The distribution of single-fibre materials and ≥2 fibre materials is very similar in both sources. In WT-MW, 45% of textiles with labels consisted of one fibre type and 55% of two or more fibre types. In WT-SC, 48% were single-fibre materials and 52% ≥2 fibre materials. The high proportion of single-fibre materials suggests that fibre-to-fibre recycling is highly promising, as no fibre-material separation steps are required. However, the presence of additional components (both textile or non-textile components) can hinder the exact material identification via NIR-Spectroscopy or interfere with recycling processes and therefore also has to be considered (also see limitations in Section 3.4). The classification according to the defined main categories shows that household textiles consist largely of only one fibre type (see Table 1). For WT-MW, 71% of household textiles were single-fibre materials, compared to 91% in WT-SC. However, in relation to the total mass of all textiles with labels, these only accounted for 12% and 6% of the mass respectively, since they are not represented as much in terms of mass as upper garments in particular. Accordingly, the most frequently found textile types here were T-shirts, pants, jackets as well as pullovers in WT-SC and beddings in WT-MW. A total of 40% (WT-MW) and 46% (WT-SC) of upper garments consisted of single-fibre materials, while undergarments comprised 32% and 41%, respectively. It is also shown in Table 1 that all three main categories predominantly feature CO as their main material.
The composition of the two-fibre materials, regarding upper garments and undergarments, in the mixed MSW and the separate collection, is very similar here as well (see Table S5 in Supplementary File S1). A total of 43% (WT-MW) and 41% (WT-SC) of the upper garments consisted of two-fibre materials, and although the main materials were CO and PET, the most common fibre combination was CO/EL, followed by CO/PET, in both sources. A similar result was found for undergarments, where the two-fibre materials accounted for 45% (WT-MW) and 43% (WT-SC) of the respective mass. Even though the two main materials here were CO and PA, the main fibre combination was again CO/EL followed by PA/EL. It can already be deducted that elastane fibres, despite making up only 1% of the total fibre mass, are present in numerous textiles. This also applied to the textiles with >two fibre materials (see Table S4 in Supplementary File S1), which made up 18% (WT-MW) and 13% (WT-SC) of textiles with labels and consisted largely of pants, T-shirts, vests, pullovers, and blankets. While the main fibre types in both sources were CO, PET, and CV, over 70% of the fibre combinations of these textiles contained EL. In summary, it was determined that approx. one third of all textiles with labels contained elastane fibres.
As mentioned in Section 1, only a small number of fibre blends are currently available for material separation, with many of these processes being on a laboratory scale. In order to make all textile blends accessible to closed-loop recycling, intensive research in this field is required, whereby it is advisable to focus on the most common fibre blends. Of course, this raises the question of economic efficiency, especially for textiles with three or more different fibre types, as these require more elaborate separation processes. Establishing a concept for textile recycling design, such as regulating the variety of fibre materials in a single textile and the simple separability of all materials used, would facilitate these processes.

3.3. MFA Based on Defined Textile Characteristics

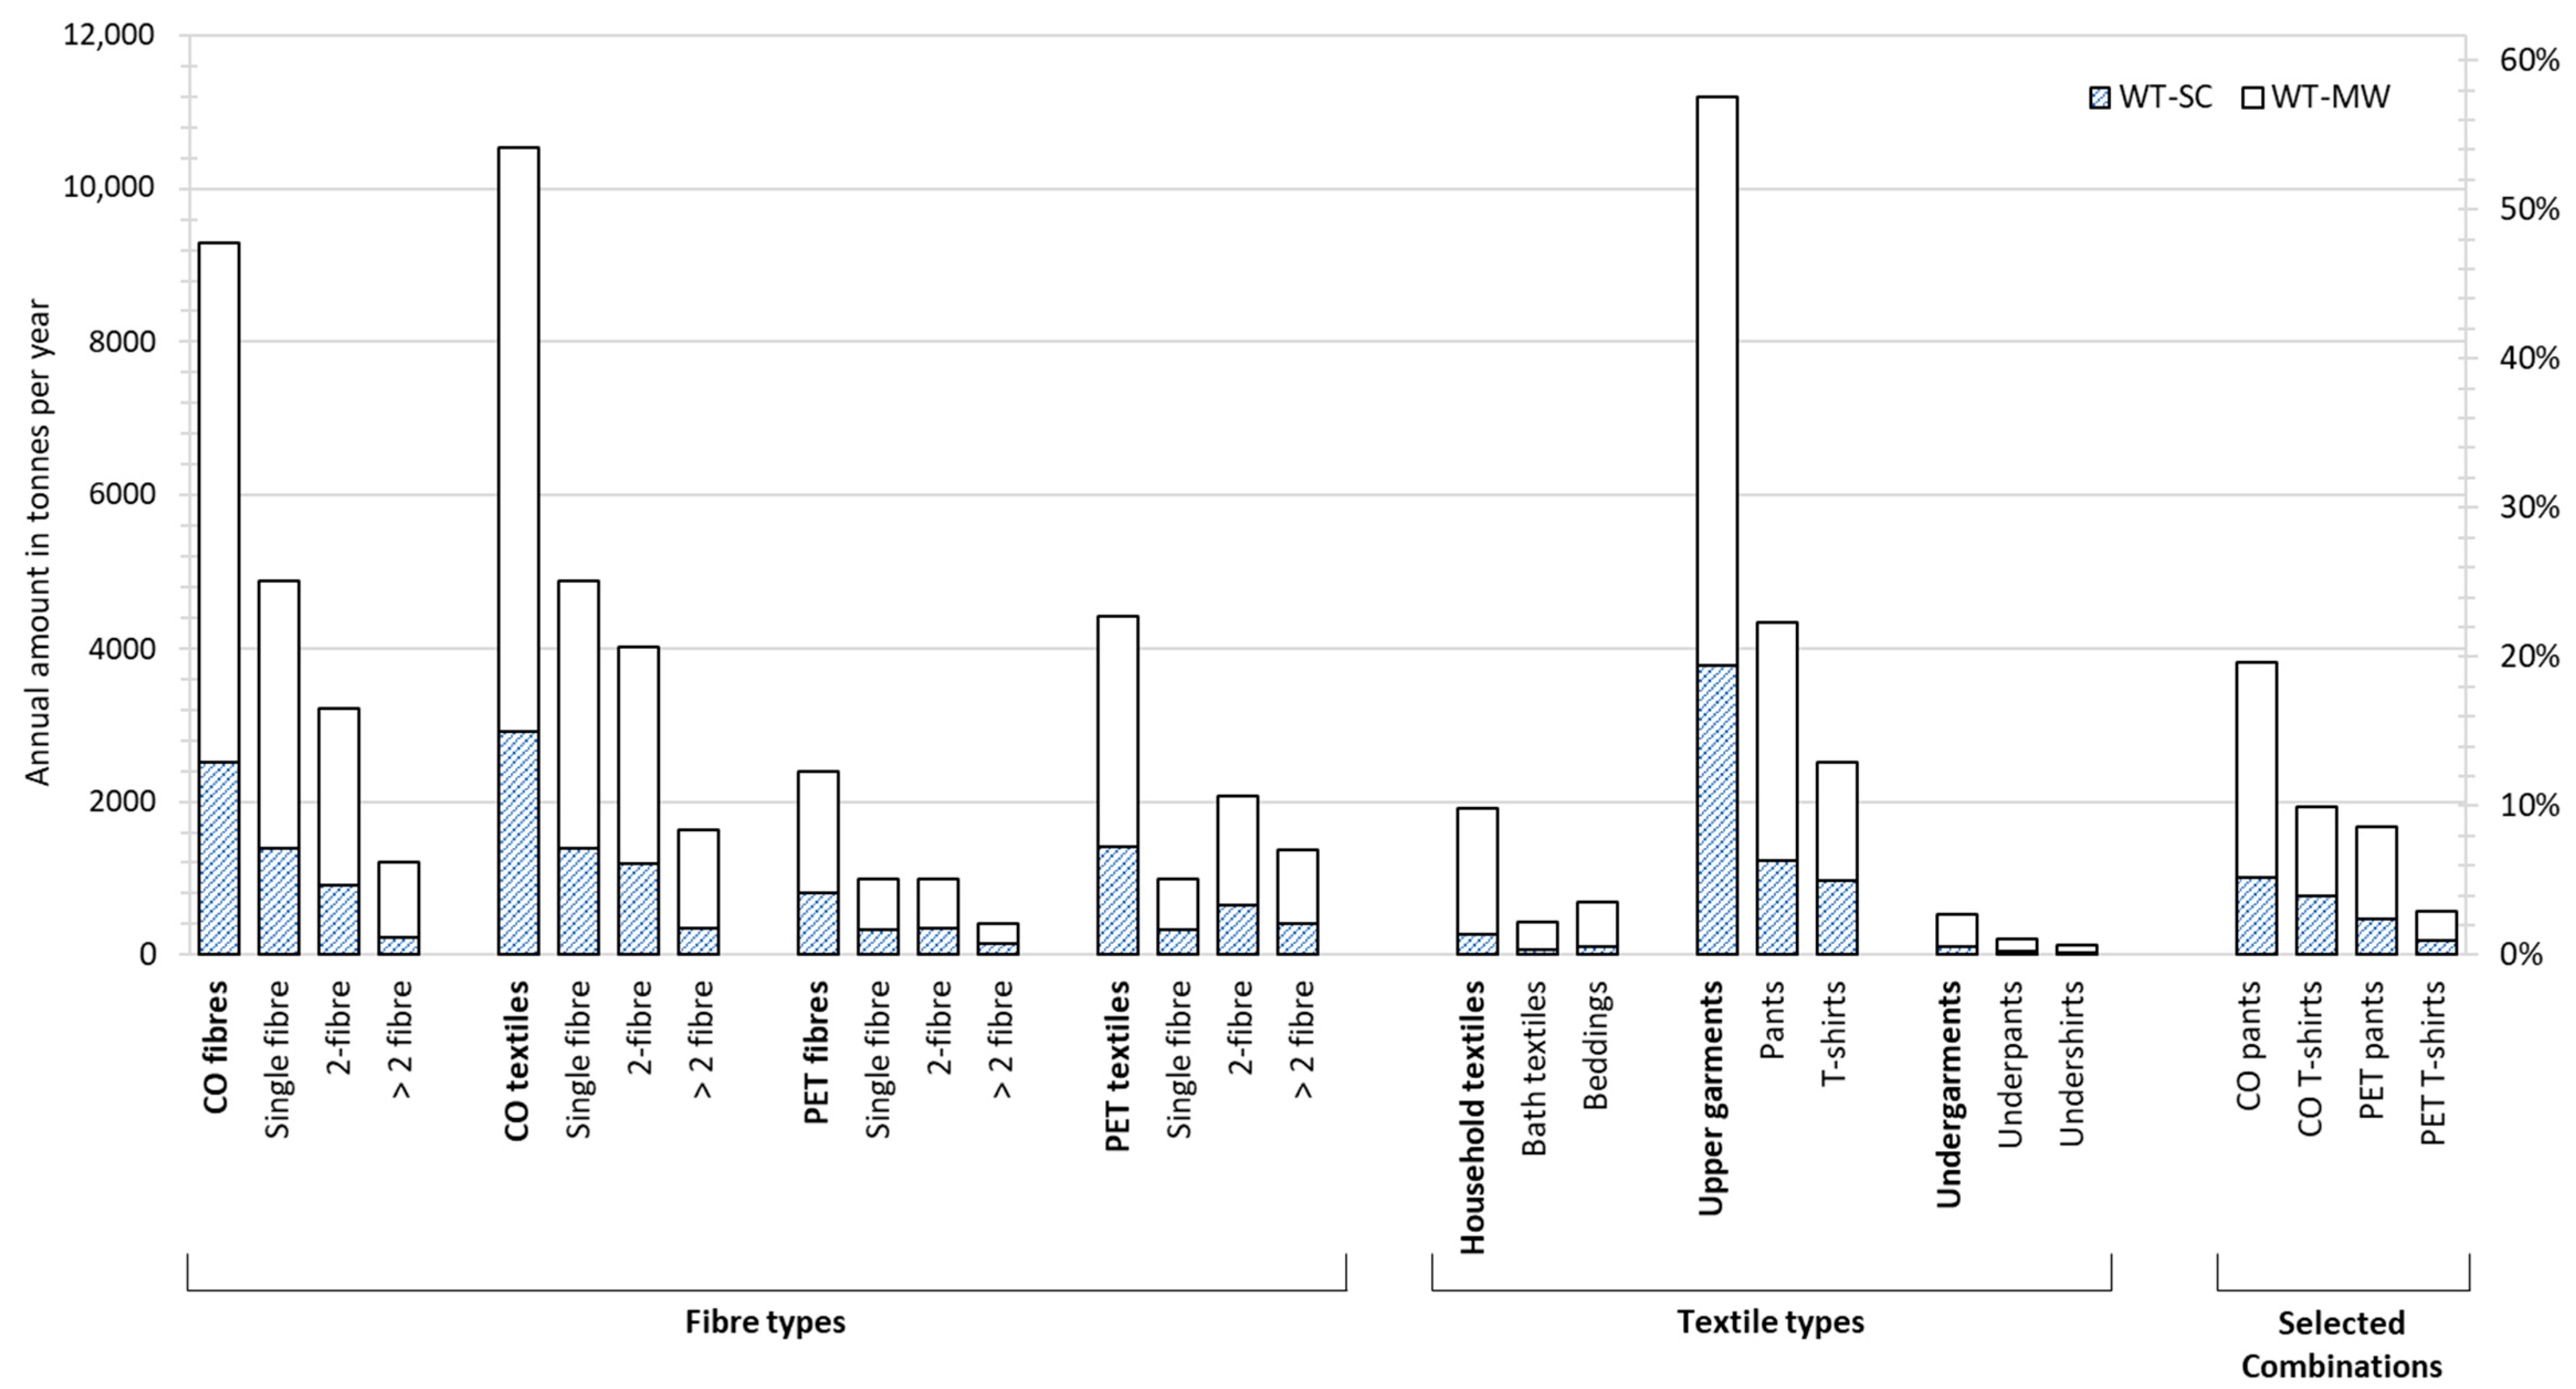
In Vienna in 2022, the amount of waste textiles was approx. 19,795 t/yr, of which a total of 13,621 t/yr was attributed to the sub-sub-goods textiles with labels and textiles without labels (9477 t/yr from WT-MW and 4144 t/yr from WT-SC). All further data in this chapter refers to these sub-sub-goods. As stated in the Textile Types Section, undergarments (especially socks) are more frequently found in the fraction of textiles without labels. However, it is still assumed that these sub-sub-goods have a similar mass composition. Figure 7 shows the quantities of selected fibre types and textiles in 2022 in Vienna that were available for reuse or recycling/recovery pathways (see also Table S6 in Supplementary File S1). This study found that 34% of textiles with and without labels from WT-SC (equivalent to approximately 1410 t/yr) were suitable for reuse, which is preferable to recycling according to the waste hierarchy [58]. However, whether an article is offered in a second-hand shop depends not only on its condition, but also on seasonal and general demand trends.
According to the results of the cotton material flows, a total of 9297 t/yr of pure fibre material was identified, with 6776 t/yr in the mixed MSW and 2522 t/yr in separate collection. More than half of this was found in single-fibre materials. The MFA methodology outlined in Section 2.1 was applied to show the further distribution of this material (see Figure S3 in Supplementary File S1). According to this distribution, only 328 t/yr CO fibres (representing 3% of the total CO fibre mass) remained for the domestic market for processing. The amount of textiles which contained CO fibres was 10,529 t/yr, of which 7615 t/yr was in WT-MW and 2914 t/yr in WT-SC. Analysis of the composition shows, for one, that a large proportion of the fibre mass is present in single-fibre material textiles, and also, that CO is often the main component in textile blends. A total of 4418 t/yr of CO fibres were found in 5650 t/yr of textile blends that contained CO fibres, which corresponds to a ratio of 80/20 of CO/other fibre types. In contrast, the results of the PET material flows deviate significantly. A total of 2394 t/yr of PET fibres are distributed over 4426 t/yr of PET-containing textiles, of which only 985 t/yr were single-fibre materials. Furthermore, the ratio of 40/60 of PET fibres to other fibre types (1409 t/yr/3440 t/yr) in textile blends containing PET also shows that it is not the predominant material. The quantities according to the main categories of the textile types reveal that 1908 t/yr household textiles, 11,190 t/yr upper garments, and 523 t/yr undergarments were collected in Vienna in 2022. Figure 7 illustrates the comparatively high separate collection of upper garments. A total of 3774 t/yr (34%) of upper garments were collected separately compared to 114 t/yr (22%) of undergarments and only 257 t/yr (13%) household textiles. It can also be seen here (see also the Textile Types Section) that some textile types are more frequently found in one of the two sources for waste textiles. For example, a similar amount of pants and T-shirts were found in WT-SC (1224 t/yr and 964 t/yr, respectively), whereas WT-MW showed a markedly higher quantity of pants compared to T-shirts (3117 t/yr and 1555 t/yr).
The present study additionally enables the determination of the material flows of fibre and textile type combinations, illustrated by the quantities of the four most common combinations in Figure 7 (see also Table S6 in Supplementary File S1). Compared with the quantities of overall T-shirts and pants, the data shows that a high proportion of these textile types contains CO fibres. A further breakdown reveals a relatively high proportion of single-fibre materials in CO T-shirts. A total of 1263 t/yr of the 1935 t/yr of CO T-shirts were single-fibre materials, compared to only 976 t/yr out the 3826 t/yr of the CO pants. This is partly due to the fact that CO pants often occur in combination with EL fibres; 2267 t/yr of CO pants contained EL as the secondary or tertiary fibre. Exact values for all possible fibre and textile type combinations can be calculated from the Excel file in Supplementary File S2.

3.4. Methodical Limits of the Study and Further Research

MFAs are usually subject to uncertainties, as is the case in this study. These uncertainties stem from limitations in data availability and from compromises made in characterisation due to the large number of samples analysed.
Data relating to the quantities in Vienna in 2022 was used for the modelling of the waste textile material flows from separate collection (F2) and from mixed MSW (F3) [39,40]. All subsequent material flows were based on existing data from 2022 at the federal level and adjusted for Vienna using transfer coefficients. The calculations are therefore carried out on the assumption that the distribution of these mass flows at the federal level is similar to that for the city of Vienna.
In this study, the information on the material composition of the analysed textiles was taken solely from the label. This information is not always accurate, as shown by a study from Bäck [59] in which the results of near infrared spectroscopy were compared with the composition stated on the labels. However, with the current state of near infrared technology, it is not possible to reliably determine the exact composition of every textile type and fibre combination. Challenges exist, among others, in the correct detection of blends, especially when a material is present in low proportions or in the identification of the fibre material in black-dyed textiles [60,61]. Accordingly, chemical analyses would be necessary to accurately determine the exact composition. As this was not realistically possible due to the high sample quantity, the information on the labels was used.
The presence of additional components such as buttons, metal parts, prints, and embroideries, as well as sewing yarn, which is not necessarily made of the same material as the main fabric, were not taken into account in this analysis. Although these components do not make up a large proportion of the total mass of waste textiles, the amount of pure fibre material is slightly lower than indicated in Section 3.3. Furthermore, they could interfere with various recycling processes and have to be removed beforehand in these cases. For future analyses, it would be advisable to include these components in a characterisation scheme, to determine their quantity and their impact on the circularity of textiles.

4. Conclusions

The work presented here analyses two distinct textile waste streams, mixed MSW and separate collection, and provides data about textile waste in Vienna in 2022 as well as specific characteristics of those textiles. To implement a circular economy in the textile sector, a solid foundation of data regarding material quantities and properties is required. The findings of this study contribute significantly to this by providing the potential for recovering fibre material from these waste textiles. In order to exploit this potential more easily, there should be an even stronger emphasis on separate collection, as cross-contamination from mixed MSW can be avoided. The high proportion of exported reusable goods also indicates economic potential, as preparation for reuse does not require complex sorting and recycling processes and is naturally preferable to recycling. Textiles that cannot be reused should subsequently be recycled; the smaller the number of materials processed in a textile, the easier it is to use in fibre-to-fibre recycling processes. Of the 19,795 t of waste textiles, around 6275 t consisted of single-fibre material, of which CO fibres were the most prominent, with 4879 t. A total of 5132 t were simple two-fibre material blends, which could also be suitable for fibre production after a material separation step. For CO/PET, the second most common material blend, there are already practicable approaches for separating the fibre materials. CO/EL textiles, the most common blend, with 1925 t, currently lack a feasible process based on current technology. Further research into fibre material separation is therefore needed to make as many fibre blends accessible as possible. In addition, regulatory incentives will be needed to promote the use of recycled fibres, such as a mandatory amount of recycled fibres from waste textiles for new textiles. The introduction of an extended producer responsibility system is also a suitable approach to increase the recycling rate. By shifting the disposal costs of textiles to the producers, they have more incentive to minimize textile waste. Possible approaches can be extending business models, such as textile leasing and repair services, or strengthening design for recycling. This would support a circular textile economy and reduce environmental impacts through less new production. Even though research is still needed in the areas of textile identification and recycling, the results of this study show that there is great potential for fibre-to-fibre recycling.

Supplementary Materials

The following supporting information can be downloaded at https://www.mdpi.com/article/10.3390/su17125484/s1, Figure S1: Locations of the sampled containers in Vienna. The routes of the collection vehicles are also shown; one route was covered each day of the sampling week. The samples were taken evenly from all five routes. Source used for the map of Vienna: Stadt Wien—ViennaGIS http://www.wien.gv.at/viennagis. Table S1: Precise locations of the sampled containers in Vienna in 2022. Figure S2: Material flows of waste textiles from mixed MSW and separate collection at the level of goods in Vienna in 2022. The flows presented contain the total mass of the mixed MSW and the separate waste textile collection. Table S2: Percentage by mass and by quantity of all defined textile types of textiles with labels in WT-MW and WT-SC. Table S3: Percentage by mass and quantity of textiles found in mixed MSW and separate collection classified into upper garments, undergarments, and household textiles. Table S4: Detailed summary of all fibre types and main fibre combinations based on Figure 6 for WT-MW and WT-SC. Table S5: Mass percentages of the two-fibre materials from the categories “upper garments” and “undergarments” in WT-MW and WT-SC. Household textiles are not included, as they make up only 9% of the two-fibre materials. The percentages outside the brackets are scaled to 100% for the respective category; the percentages in the brackets refer to the entirety of textiles with labels (both single-fibre and ≥2 fibre materials). Table S6: Mass flows of selected fibre and textile types in Vienna in 2022 from WT-MW and WT-SC based on Figure 7. The values summarise the two fractions “textiles with labels” and “textiles without labels”, assuming that these fractions have a similar composition. The numbers outside the brackets depict the volumes in tonnes per year, the values in the brackets show the proportion in mass percentage to the overall mass of textiles with labels and without labels. Figure S3: Material flows of waste textiles at the characteristics level from mixed MSW and separate collection in Vienna 2022—results for the distribution of pure CO fibres. The flows presented contain the fractions “textiles with labels” and “textiles without labels”. Figure S4: Material flows of waste textiles at the characteristics level from mixed MSW and separate collection in Vienna 2022—results for the distribution of cotton fibres from single-fibre materials. The flows presented contain the fractions “textiles with labels” and “textiles without labels”. Figure S5: Material flows of waste textiles at the characteristics level from mixed MSW and separate collection in Vienna 2022—results for the distribution of cotton fibres from two-fibre materials. The flows presented contain the fractions “textiles with labels” and “textiles without labels”. Figure S6: Material flows of waste textiles at the characteristics level from mixed MSW and separate collection in Vienna 2022—results for the distribution of cotton fibres from >2 fibre materials. The flows presented contain the fractions “textiles with labels” and “textiles without labels”. Figure S7: Material flows of waste textiles at the characteristics level from mixed MSW and separate collection in Vienna 2022—results for the distribution of textiles containing cotton fibres. The flows presented contain the fractions “textiles with labels” and “textiles without labels”. Figure S8: Material flows of waste textiles at the characteristics level from mixed MSW and separate collection in Vienna 2022—results for the distribution of textiles containing only cotton as the main fibre material. The flows presented contain the fractions “textiles with labels” and “textiles without labels”. Figure S9: Material flows of waste textiles at the characteristics level from mixed MSW and separate collection in Vienna 2022—results for the distribution of textiles containing cotton and one additional fibre type as the main fibre materials. The material flows presented contain the fractions “textiles with labels” and “textiles without labels”. Figure S10: Material flows of waste textiles at the characteristics level from mixed MSW and separate collection in Vienna 2022—results for the distribution of textiles containing cotton and two or more additional fibre types as the main fibre materials. The flows presented contain the fractions “textiles with labels” and “textiles without labels”. Figure S11: Material flows of waste textiles at the characteristics level from mixed MSW and separate collection in Vienna 2022—results for the distribution of pure PET fibres. The flows presented contain the fractions “textiles with labels” and “textiles without labels”. Figure S12: Material flows of waste textiles at the characteristics level from mixed MSW and separate collection in Vienna 2022—results for the distribution of PET fibres from single-fibre materials. The flows presented contain the fractions “textiles with labels” and “textiles without labels”. Figure S13: Material flows of waste textiles at the characteristics level from mixed MSW and separate collection in Vienna 2022—results for the distribution of PET fibres from two-fibre materials. The material flows presented contain the fractions “textiles with labels” and “textiles without labels”. Figure S14: Material flows of waste textiles at the characteristics level from mixed MSW and separate collection in Vienna 2022—results for the distribution of PET fibres from >2 fibre materials. The material flows presented contain the fractions “textiles with labels” and “textiles without labels”. Figure S15: Material flows of waste textiles at the characteristics level from mixed MSW and separate collection in Vienna 2022—results for the distribution of textiles containing PET fibres. The flows presented contain the fractions “textiles with labels” and “textiles without labels”. Figure S16: Material flows of waste textiles at the characteristics level from mixed MSW and separate collection in Vienna 2022—results for the distribution of textiles containing only PET as the main fibre material. The flows presented contain the fractions “textiles with labels” and “textiles without labels”. Figure S17: Material flows of waste textiles at the characteristics level from mixed MSW and separate collection in Vienna 2022—results for the distribution of textiles containing PET and one additional fibre type as the main fibre materials. The material flows presented contain the fractions “textiles with labels” and “textiles without labels”. Figure S18: Material flows of waste textiles at the characteristics level from mixed MSW and separate collection in Vienna 2022—results for the distribution of textiles containing PET and two or more additional fibre types as the main fibre materials. The flows presented contain the fractions “textiles with labels” and “textiles without labels”. Figure S19: Material flows of waste textiles at the characteristics level from mixed MSW and separate collection in Vienna 2022—results for the distribution of household textiles. The flows presented contain the fractions “textiles with labels” and “textiles without labels”. Figure S20: Material flows of waste textiles at the characteristics level from mixed MSW and separate collection in Vienna 2022—results for the distribution of bath textiles from household textiles. The flows presented contain the fractions “textiles with labels” and “textiles without labels”. Figure S21: Material flows of waste textiles at the characteristics level from mixed MSW and separate collection in Vienna 2022—results for the distribution of beddings from household textiles. The flows presented contain the fractions “textiles with labels” and “textiles without labels”. Figure S22: Material flows of waste textiles at the characteristics level from mixed MSW and separate collection in Vienna 2022—results for the distribution of upper garments. The flows presented contain the fractions “textiles with labels” and “textiles without labels”. Figure S23: Material flows of waste textiles at the characteristics level from mixed MSW and separate collection in Vienna 2022—results for the distribution of pants from upper garments. The flows presented contain the fractions “textiles with labels” and “textiles without labels”. Figure S24: Material flows of waste textiles at the characteristics level from mixed MSW and separate collection in Vienna 2022—results for the distribution of T-shirts from upper garments. The flows presented contain the fractions “textiles with labels” and “textiles without labels”. Figure S25: Material flows of waste textiles at the characteristics level from mixed MSW and separate collection in Vienna 2022—results for the distribution of undergarments. The flows presented contain the fractions “textiles with labels” and “textiles without labels”. Figure S26: Material flows of waste textiles at the characteristics level from mixed MSW and separate collection in Vienna 2022—results for the distribution of underpants from undergarments. The flows presented contain the fractions “textiles with labels” and “textiles without labels”. Figure S27: Material flows of waste textiles at the characteristics level from mixed MSW and separate collection in Vienna 2022—results for the distribution of undershirts from undergarments. The flows presented contain the fractions “textiles with labels” and “textiles without labels”. Figure S28: Material flows of waste textiles at the characteristics level from mixed MSW and separate collection in Vienna 2022—results for the distribution of pants containing cotton fibres. The flows presented contain the fractions “textiles with labels” and “textiles without labels”. Figure S29: Material flows of waste textiles at the characteristics level from mixed MSW and separate collection in Vienna 2022—results for the distribution of T-shirts containing cotton fibres. The flows presented contain the fractions “textiles with labels” and “textiles without labels”. Figure S30: Material flows of waste textiles at the characteristics level from mixed MSW and separate collection in Vienna 2022—results for the distribution of pants containing PET fibres. The flows presented contain the fractions “textiles with labels” and “textiles without labels”. Figure S31: Material flows of waste textiles at the characteristics level from mixed MSW and separate collection in Vienna 2022—results for the distribution of T-shirts containing PET fibres. The flows presented contain the fractions “textiles with labels” and “textiles without labels”. References [39,41] are cited in Supplementary Materials.

Author Contributions

Conceptualization, P.K. and J.L.; methodology, P.K. and W.I.; validation, P.K.; formal analysis, P.K.; investigation, P.K.; writing—original draft preparation, P.K.; writing—review and editing, P.K., W.I., A.B., and J.L.; visualization, P.K. and W.I.; supervision, P.K., A.B., and J.L.; project administration, J.L.; funding acquisition, J.L. All authors have read and agreed to the published version of the manuscript.

Funding

This research was funded by the Austrian Federal Ministry of Economy, Energy, and Tourism, the National Foundation for Research, Technology, and Development, and the Christian Doppler Research Association.

Data Availability Statement

The data is included in this article, the Supplementary Materials, or other articles cited, particularly references [30,31].

Acknowledgments

The financial support from the Austrian Federal Ministry of Economy, Energy, and Tourism, the National Foundation for Research, Technology, and Development, and the Christian Doppler Research Association is gratefully acknowledged. Furthermore, we greatly acknowledge the financial and non-financial support of our company partners, which are, in alphabetical order: Abfallbehandlung Ahrental GmbH, Altstoff Recycling Austria AG, Brantner Österreich GmbH, Holding Graz—Kommunale Dienstleistungen GmbH, Lenzing Aktiengesellschaft, Linz Service GmbH, MM Board & Paper, Wien Energie GmbH, and Wopfinger Transportbeton Ges.m.b.H. In addition, we thank Magistratsabteilung 48, the municipal waste management provider of the City of Vienna and Caritas der Erzdiözese Wien, a Vienna-based charitable organization for providing the samples for this waste textile sampling and characterisation. We would also like to thank our student assistants Debora Zöchling, Julia Reiterer, and Gabriela Tikvić who were crucial in the practical realisation of this study.

Conflicts of Interest

The authors declare no conflicts of interest. The funders had no role in the design of the study; in the collection, analyses, or interpretation of data; in the writing of the manuscript; or in the decision to publish the results.

Abbreviations

The following abbreviations are used in this manuscript:
ARAramid (short for aromatic polyamide)
CECircular Economy
CLYLyocell
COCotton
CVViscose
ELElastane (elastic fibres made from polyurethanes, also known as Spandex)
LILinen
MA48Magistratsabteilung 48 (Vienna’s Municipal Department for Waste Management, Street Cleaning, and Vehicle Fleet)
MFAMaterial flow analysis
MSWMunicipal solid waste
PAPolyamide
PANPolyacrylonitrile
PETPolyester (mostly polyethylene terephthalate)
SCSeparate collection
SESilk
TCTransfer coefficients
TGLFTextile, garment, leather, footwear
WOWool
WT-MWWaste textiles from mixed municipal solid waste
WT-SCWaste textiles from separate collection

References

  1. Bartl, A.; Ipsmiller, W. Fast fashion and the Circular Economy: Symbiosis or antibiosis? Waste Manag. Res. J. A Sustain. Circ. Economy 2023, 41, 497–498. [Google Scholar] [CrossRef] [PubMed]
  2. Niinimäki, K. From Disposable to Sustainable—The Complex Interplay between Design and Consumption of Textiles and Clothing. Ph.D. Thesis, Aalto University, Espoo, Finland, 2011. [Google Scholar]
  3. Niinimäki, K.; Peters, G.; Dahlbo, H.; Perry, P.; Rissanen, T.; Gwilt, A. The environmental price of fast fashion. Nat. Rev. Earth Environ. 2020, 1, 189–200. [Google Scholar] [CrossRef]
  4. Fonseca, A.; Ramalho, E.; Gouveia, A.; Henriques, R.; Figueiredo, F.; Nunes, J. Systematic Insights into a Textile Industry: Reviewing Life Cycle Assessment and Eco-Design. Sustainability 2023, 15, 15267. [Google Scholar] [CrossRef]
  5. Ipsmiller, W.; Bartl, A. Sourcing and re-sourcing end-of-use textiles. In Polluting Textiles: The Problem with Microfibres; Taylor and Francis: Abingdon, UK, 2022; pp. 214–244. [Google Scholar] [CrossRef]
  6. Fellner, J.; Lederer, J. Recycling rate—The only practical metric for a circular economy? Waste Manag. 2020, 113, 319–320. [Google Scholar] [CrossRef]
  7. Chen, X.; Memon, H.A.; Wang, Y.; Marriam, I.; Tebyetekerwa, M. Circular Economy and Sustainability of the Clothing and Textile Industry. Mater. Circ. Econ. 2021, 3, 12. [Google Scholar] [CrossRef]
  8. EC. DIRECTIVE (EU) 2018/851 of the European Parliament and of the Council of 30 May 2018 Amending Directive 2008/98/EC on waste (Text with EEA Relevance). Off. J. Eur. Union2018, 61, 109–140. Available online: https://eur-lex.europa.eu/legal-content/EN/TXT/?uri=CELEX%3A32018L0851 (accessed on 30 June 2023).
  9. EC. Communication from the Commission to the European Parliament, the Council, the European Economic and Social Committee and the Committee of the Regions. EU Strategy for Sustainable and Circular Textiles. 2022. Available online: https://eur-lex.europa.eu/legal-content/EN/TXT/?uri=CELEX%3A52022DC0141 (accessed on 30 June 2023).
  10. Zamani, B.; Svanström, M.; Peters, G.; Rydberg, T. A Carbon Footprint of Textile Recycling: A Case Study in Sweden. J. Ind. Ecol. 2014, 19, 676–687. [Google Scholar] [CrossRef]
  11. McKinsey & Company. Scaling Textile Recycling in Europe-Turning Waste into Value; McKinsey & Company: New York, NY, USA, 2022. [Google Scholar]
  12. Solis, M.; Tonini, D.; Scheutz, C.; Napolano, L.; Biganzoli, F.; Huygens, D. Contribution of waste management to a sustainable textile sector. Waste Manag. 2024, 189, 389–400. [Google Scholar] [CrossRef]
  13. Ellen MacArthur Foundation. A New Textiles Economy: Redesigning Fashion’s Future; Ellen MacArthur Foundation: Isle of Wight, UK, 2017. [Google Scholar]
  14. Ko, Y.; Tamer, U.; Hinestroza, J.P. UiO-66 Inspired Superhydrophobic Coatings Fabricated from Discarded Polyester/Spandex Textiles. ACS Appl. Mater. Interfaces 2024, 16, 53163–53176. [Google Scholar] [CrossRef]
  15. Ko, Y.; Azbell, T.J.; Milner, P.; Hinestroza, J.P. Upcycling of Dyed Polyester Fabrics into Copper-1,4-Benzenedicarboxylate (CuBDC) Metal–Organic Frameworks. Ind. Eng. Chem. Res. 2023, 62, 5771–5781. [Google Scholar] [CrossRef]
  16. Vashishth, E.; Raulo, A.; Srivastava, R.K.; Nandan, B. Waste-cotton-cloth-derived sustainable and flexible high-performance supercapacitor. ACS Sustain. Resour. Manag. 2024, 1, 548–562. [Google Scholar] [CrossRef]
  17. Amini, S.; Ahmed, R.F.S.M.; Kumar, S.; Ankanathappa, S.M.; Sannathammegowda, K. Electrifying waste textiles: Transforming fabric scraps into high-performance triboelectric nanogenerators for biomechanical energy harvesting. Waste Manag. 2024, 190, 477–48524. [Google Scholar] [CrossRef] [PubMed]
  18. Yang, X.; Fan, W.; Wang, H.; Shi, Y.; Wang, S.; Liew, R.K.; Ge, S. Recycling of bast textile wastes into high value-added products: A review. Environ. Chem. Lett. 2022, 20, 3747–3763. [Google Scholar] [CrossRef]
  19. Cho, E.J.; Lee, Y.G.; Song, Y.; Kim, H.Y.; Nguyen, D.-T.; Bae, H.-J. Converting textile waste into value-added chemicals: An integrated bio-refinery process. Environ. Sci. Ecotechnology 2023, 15, 100238. [Google Scholar] [CrossRef] [PubMed]
  20. Köhler, A.; Watson, D.; Trzepacz, S.; Löw, C.; Liu, R.; Danneck, J. Circular Economy Perspectives in the EU Textile Sector Final Report. Publications Office of the European Union: Luxembourg, 2021. [Google Scholar] [CrossRef]
  21. Terra for Eco TLC. Technical Monitoring on Optical Sorting and Textile Recognition Technologies at a European Level Summary. 2020. Available online: https://refashion.fr/pro/sites/default/files/fichiers/Terra_summary_study_on_textile_material_sorting_VUK300320.pdf (accessed on 30 June 2023).
  22. European Commission: Directorate-General for Internal Market, Industry, Entrepreneurship and SMEs; Duhoux, T.; Maes, E.; Hirschnitz-Garbers, M.; Peeters, K.; Asscherickx, L.; Christis, M.; Stubbe, B.; Colignon, P.; Hinzmann, M.; et al. Study on the Technical, Regulatory, Economic and Environmental Effectiveness of Textile Fibres Recycling: Final Report; Publications Office of European Union: Brussels, Belgium, 2021. [Google Scholar]
  23. Refashion. Mechanical Recycling of Textiles. 2025. Available online: https://recycle.refashion.fr/wp-content/uploads/2025/04/REFASHION_Mechanical-recycling-of-textiles.pdf (accessed on 6 June 2025).
  24. Baloyi, R.B.; Gbadeyan, O.J.; Sithole, B.; Chunilall, V. Recent advances in recycling technologies for waste textile fabrics: A review. Text. Res. J. 2023, 94, 508–529. [Google Scholar] [CrossRef]
  25. Piribauer, B.; Bartl, A.; Ipsmiller, W. Enzymatic textile recycling–Best practices and outlook. Waste Manag. Res. 2021, 39, 1277–1290. [Google Scholar] [CrossRef]
  26. Palme, A.; Peterson, A.; de la Motte, H.; Theliander, H.; Brelid, H. Development of an efficient route for combined recycling of PET and cotton from mixed fabrics. Cloth. Sustain. 2017, 3, 4. [Google Scholar] [CrossRef]
  27. Boschmeier, E.; Archodoulaki, V.M.; Schwaighofer, A.; Lendl, B.; Ipsmiller, W.; Bartl, A. New separation process for elastane from polyester/elastane and polyamide/elastane textile waste. Resour. Conserv. Recycl. 2023, 198, 107215. [Google Scholar] [CrossRef]
  28. European Environment Agency. Management of Used and Waste Textiles in Europe’s Circular Economy (Briefing No. 03/2024); European Environment Agency: Copenhagen, Denmark, 2024. [Google Scholar] [CrossRef]
  29. Dahlbo, H.; Aalto, K.; Eskelinen, H.; Salmenperä, H. Increasing textile circulation—Consequences and requirements. Sustain. Prod. Consum. 2017, 9, 44–57. [Google Scholar] [CrossRef]
  30. Dahlbo, H.; Rautiainen, A.; Savolainen, H.; Oksanen, P.; Nurmi, P.; Virta, M. Textile Flows in Finland 2019. 2021. Available online: https://www.turkuamk.fi/en/publication/textile-flows-in-finland-2019/ (accessed on 10 June 2025).
  31. Koligkioni, A.; Parajuly, K.; Sørensen, B.L.; Cimpan, C. Environmental Assessment of End-of-Life Textiles in Denmark. Procedia CIRP 2018, 69, 962–967. [Google Scholar] [CrossRef]
  32. Malinverno, N.; Schmutz, M.; Nowack, B.; Som, C. Identifying the needs for a circular workwear textile management—A material flow analysis of workwear textile waste within Swiss Companies. Resour. Conserv. Recycl. 2022, 189, 106728. [Google Scholar] [CrossRef]
  33. Amicarelli, V.; Bux, C. Quantifying textile streams and recycling prospects in Europe by material flow analysis. Environ. Impact Assess. Rev. 2022, 97, 106878. [Google Scholar] [CrossRef]
  34. Napolano, L.; Foschi, J.; Caldeira, C.; Huygens, D.; Sala, S. Understanding textile value chains: Dynamic Probabilistic Material Flow Analysis of textile in the European Union. Resour. Conserv. Recycl. 2024, 212, 107888. [Google Scholar] [CrossRef]
  35. Nørup, N.; Pihl, K.; Damgaard, A.; Scheutz, C. Development and testing of a sorting and quality assessment method for textile waste. Waste Manag. 2018, 79, 8–21. [Google Scholar] [CrossRef] [PubMed]
  36. Nørup, N.; Pihl, K.; Damgaard, A.; Scheutz, C. Quantity and quality of clothing and household textiles in the Danish household waste. Waste Manag. 2019, 87, 454–463. [Google Scholar] [CrossRef]
  37. Refashion. Characterisation Study of the Incoming and Outgoing Streams from Sorting Facilities. April 2023. Available online: https://pro.refashion.fr/sites/default/files/rapport-etude/Overview_Characterisation_study_Refashion_2023_EN.pdf (accessed on 13 December 2023).
  38. Weber, S.; Weber, O.; Habib, K.; Dias, G.M. Textile waste in Ontario, Canada: Opportunities for reuse and recycling. Resour. Conserv. Recycl. 2022, 190, 106835. [Google Scholar] [CrossRef]
  39. Bernhardt, A.; Brandstätter, C.; Broneder, C.; Gold, C.; Neubauer, C.; Oliva, J.; Roll, M.; Schaffernak, A.; Stoifl, B.; Tesar, M.; et al. Die Bestandsaufnahme der Abfallwirtschaft in Österreich—Statusbericht 2024 für das Referenzjahr 2022. 2024. Available online: https://www.bmluk.gv.at/service/publikationen/klima-und-umwelt/die-bestandsaufnahme-der-abfallwirtschaft-in-oesterreich-statusbericht-2024-fuer-das-referenzjahr-2022.html (accessed on 10 June 2025).
  40. MA 48-Magistratsabteilung MA 48 City of Vienna. Wiener Restmüll- und Altstoffanalysen 2022/23. Available online: https://www.pulswerk.at/projekte/restmuell-und-altstoffanalyse-wien-2022-23/ (accessed on 10 June 2025).
  41. Brunner, P.H.; Rechberger, H. Handbook of Material Flow Analysis: For Environmental, Resource and Waste Engineers; GRC Press: Boca Raton, FL, USA, 2017. [Google Scholar]
  42. Bernhardt, A.; Brandstätter, C.; Karigl, B.; Neubauer, C.; Stoifl, B.; Van Eygen, E. Aufkommen Und Behandlung Von Textilabfällen in Österreich-Materialien zum Bundes-Abfallwirtschaftsplan. 2022. Available online: https://www.umweltbundesamt.at/fileadmin/site/publikationen/rep0788.pdf (accessed on 21 June 2023).
  43. Stadt Wien. Das Mist-ABC–Müll Richtig Entsorgen. Available online: https://www.wien.gv.at/umwelt/ma48/beratung/muelltrennung/mistabc.html (accessed on 18 July 2024).
  44. Humana People to People. Deine Kleiderspende. Available online: https://humana.at/deine-kleiderspende/ (accessed on 24 July 2024).
  45. Caritas der Erzdiözese Wien. Kleidung und Textilien. Available online: https://www.caritas-wien.at/spenden-helfen/sachspenden/kleidung (accessed on 24 July 2024).
  46. Öpula Rohstoff-Recycling Ges.m.b.H. Neues Leben für alte Kleider. Available online: https://www.oepula.at/containersammlung (accessed on 24 July 2024).
  47. Stadt Wien. Wohin Mit Gebrauchten Textilien? Available online: https://www.wenigermist.at/wohin-mit-gebrauchten-textilien (accessed on 18 July 2024).
  48. Gritsch, L.; Lederer, J. A historical-technical analysis of packaging waste flows in Vienna. Resour. Conserv. Recycl. 2023, 194, 106975. [Google Scholar] [CrossRef]
  49. BMK. Verordnung der Bundesministerien für Klimaschutz, Umwelt, Energie, Mobilität, Innovation und Technologie über ein Abfallverzeichnis (Abfallverzeichnisverordnung 2020). BGBl. II Nr. 409/2020, Anhang 1 Abfallverzeichnis. 2020. Available online: https://www.ris.bka.gv.at/eli/bgbl/II/2020/409 (accessed on 27 August 2024).
  50. Huber, F. Strategische Umweltprüfung zum Wiener Abfallwirtschaftsplan (Wr. AWP) 2025–2030 und zum Wiener Abfallvermeidungsprogramm (Wr. AVP) 2025–2030 Anhang I Ist-Zustand der Wiener Abfallwirtschaft 2023. Available online: https://www.wien.gv.at/umwelt/ma48/service/pdf/awp-avp-25-30-anhang1.pdf (accessed on 24 January 2025).
  51. Beigl, P.; Happenhofer, A.; Salhofer, S. Technische Anleitung für die Durchführung von Restmüll-Sortieranalysen (Technical Instructions for the Performance of Residual Waste Sorting Analysis); BIMI: Vienna, Austria, 2017. [Google Scholar]
  52. Gritsch, L.; Breslmayer, G.; Rainer, R.; Stipanovic, H.; Tischberger-Aldrian, A.; Lederer, J. Critical properties of plastic packaging waste for recycling: A case study on non-beverage plastic bottles in an urban MSW system in Austria. Waste Manag. 2024, 185, 10–24. [Google Scholar] [CrossRef]
  53. Caritas der Erzdiözese Wien. Kleidercontainer der Caritas Erzdiözese Wien-Stand 06.02.2024. Available online: https://www.carla-wien.at/fileadmin/storage/wien/shops-services/carla/aktuell/20240206_Containerliste_kompakt.pdf (accessed on 27 February 2025).
  54. Team Demographie. Demographisches Jahrbuch 2022; Team Demographie: Vienna, Austria, 2023. [Google Scholar]
  55. Textile Exchange. Preferred Fiber & Materials Market Report; Textile Exchange: Lamesa, TX, USA, 2023. [Google Scholar]
  56. Matsuo, T. Fibre materials for advanced technical textiles. Text. Prog. 2008, 40, 87–121. [Google Scholar] [CrossRef]
  57. Euratex. Facts & Key Figures 2024 of the European Textile and Clothing Industry. 2024. Available online: www.euratex.eu (accessed on 28 February 2024).
  58. EC. Directive 2008/98/EC of The European Parliament and of the Council of 19 November 2008 on Waste and Repealing Certain Directives (Text with EEA Relevance). 2008. Available online: http://data.europa.eu/eli/dir/2008/98/oj (accessed on 13 December 2024).
  59. Bäck, T. Sensorgestützte Sortierung von Alttextilien Mittels NIR. [Masterarbeit, Montanuniversität Leoben (000)]. Master’s Thesis, Montanuniversität, Leoben, Austria, 2023. [Google Scholar] [CrossRef]
  60. Refashion. Technical Monitoring of Optical Sorting, Recognition and Disassembly Technologies for Textiles at European Scale. 2023. Available online: https://refashion.fr/pro/sites/default/files/rapport-etude/240428_Synth%C3%A8se_Veille-technos-tri-d%C3%A9lissage_VF-EN.pdf (accessed on 8 January 2024).
  61. Tischberger-Aldrian, A.; Stipanovic, H.; Kuhn, N.; Bäck, T.; Schwartz, D.; Koinig, G. Automatisierte Textilsortierung–Status quo, Herausforderungen und Perspektiven. Österr Wasser-Abfallw 2024, 76, 63–79. [Google Scholar] [CrossRef]
Figure 1. Calculation model for the flows of waste textiles from mixed MSW (WT-MW) and from separate collection (WT-SC) in Vienna in 2022.
Sustainability 17 05484 g001
Figure 2. Schematic illustration of the waste textile sampling and characterisation. The highlighted elements of each level were analysed in the next level according to the listed properties.
Sustainability 17 05484 g002
Figure 3. Material flows of waste textiles at goods level from mixed MSW and separate collection in Vienna 2022.
Sustainability 17 05484 g003
Figure 4. Contents of the defined fractions at the level of sub- and sub-sub-goods for WT-MW and WT-SC for Vienna in 2022.
Sustainability 17 05484 g004
Figure 5. Distribution of the 10 most common textile types found during our analysis from the fraction “Textiles with labels”. The white columns on the left-hand side depict the results of the WT-MW; the columns on the right-hand side with blue colouring show those of WT-SC. Columns with solid borders represent the results in percentage by mass; columns with dotted borders show the number of articles in relation to the total number of articles.
Sustainability 17 05484 g005
Figure 6. Results of the analysis of textiles with labels from WT-MW (upper diagrams) and WT-SC (lower diagrams) by fibre types. The respective pie charts display the total amounts of each fibre type from these sources; the bar charts represent the distribution into single-fibre material (the top bar in each diagram) and ≥2 fibre materials (the lower bar in each diagram). A detailed summary can be found in Table S4 in Supplementary File S1.
Sustainability 17 05484 g006
Figure 7. Mass in tonnes of selected fibre and textile types in Vienna in 2022. The bars summarise the two fractions “textiles with labels” and “textiles without labels”, assuming that these fractions have a similar composition. The white sections of the bars represent the quantities from WT-MW, while the blue bars correspond to WT-SC. Fibre types: CO or PET fibres refer to the pure fibre mass; CO or PET textiles to the overall mass of textiles containing CO or PET fibres. Each column is further subdivided into single-fibre, two-fibre and >2 fibre materials. Textile types: The mass of the defined main categories with two textile type examples each. Selected combinations: Exemplary combinations of the most common fibre and textile types. For the tabular values and the MFA images of all materials shown in this figure, see Table S6 as well as Figures S3–S31 in Supplementary File S1.
Sustainability 17 05484 g007
Table 1. Mass percentages of single-fibre materials across the three main categories in WT-MW and WT-SC. The percentages outside the brackets are scaled to 100% for the respective category; the percentages in the brackets refer to the entirety of textiles with labels (both single-fibre and ≥two fibre materials).
WT-MWWT-SC
Household Textiles
Single-fibre materials71.3% (12.4%)90.7% (5.6%)
CO67.1% (11.7%)75.6% (4.7%)
PET3.1% (<1%)15.1% (<1%)
Others1.1% (<1%)<1% (<1%)
Upper garments
Single-fibre materials40.0% (31.3%)45.7% (41.6%)
CO30.4% (23.8%)30.7% (27.9%)
PET8.1% (6.3%)7.6% (6.9%)
CV1.1% (<1%)2.5% (2.3%)
Others<1% (<1%)4.9% (4.4%)
Undergarments
Single-fibre materials31.7 (1.4%)41.2% (1.1%)
CO31.7 (1.4%)31.6% (<1%)
PET-8.0% (<1%)
PA-1.6% (<1%)
Disclaimer/Publisher’s Note: The statements, opinions and data contained in all publications are solely those of the individual author(s) and contributor(s) and not of MDPI and/or the editor(s). MDPI and/or the editor(s) disclaim responsibility for any injury to people or property resulting from any ideas, methods, instructions or products referred to in the content.