Article

Predictive Modeling for Sustainable Tire Retreading and Resource Optimization in Public Transport System

by
Arun Navin Joseph
1,*,
Nedunchezhian Natarajan
2,
Murugesan Ramasamy
3 and
Pachaivannan Partheeban
4
1
Department of Mechanical Engineering, Anna University, Chennai 600025, India
2
Department of Automobile Engineering, Annapoorana Engineering College, Salem 636308, India
3
Department of Civil Engineering, Nandha Engineering College, Erode 638052, India
4
Department of Civil Engineering, Chennai Institute of Technology, Chennai 600069, India
*
Author to whom correspondence should be addressed.
Sustainability 2025, 17(12), 5480; https://doi.org/10.3390/su17125480 (registering DOI)
Submission received: 18 May 2025 / Revised: 9 June 2025 / Accepted: 10 June 2025 / Published: 13 June 2025

Abstract

:
Retreading is a cornerstone in the remanufacturing process of tires, facilitating the extraction of maximum kilometers (Km) from a tire carcass. Tire remanufacturing plays a crucial role in conserving raw materials, reducing environmental impacts, and lowering the overall operating costs. This study employs predictive modeling techniques to forecast tire performance and optimize resource allocation, departing from traditional approaches, for a bus transport system in India. Machine learning models, including linear regression, ensemble boosted trees, and neural network models, were used. Two scenarios were devised: Scenario I addressed premature failures and optimizing performance to reduce tire procurement and Scenario II used targeted interventions, such as eliminating new tire condemnations and optimizing retread (RT) strategies, and could potentially salvage 169 tires from premature retirement. The results achieved R2 values of 0.44, 0.51, and 0.45 and improved values for the test datasets of 0.46, 0.52 and 0.44. By leveraging these models, decision-makers can substantially improve tire mileage, reduce premature condemnations, increase tire production, and drive cost savings in fleet operations. Notably, this approach contributes to enhanced operational efficiency and promotes sustainability by cutting costs by 15–25%, improving tire mileage by 20–30%, and reducing environmental impacts by up to 25%. These results demonstrate the broader implications of predictive modelling as a decision-support tool, highlighting its capacity to drive economic and environmental benefits across industrial logistics and sustainable development.

1. Introduction

Retreading evolved its identity around 1912. From then on, the retreading industry has come a long way [1]. India’s retreading sector was valued at around USD 1 billion in 2016. It had roughly 20,000 retreaders scattered in the organized and unorganized sectors [2]. In an automobile, the pneumatic tire is the only component that makes direct contact with the road surface and wears out rapidly. Hence, tires need frequent replacement during the life of an automobile. This hurts the environment and the operational economy [3]. The tread portion of the tire alone contacts the road, and hence, the tread only wears, and the remaining portion of the carcass remains intact [4]. Retreading is a remanufacturing process that replaces the worn-out tread of the tire with a new tread to extract more mileage from it [5]. In the case of heavy-duty vehicle (HDV) tires, there is a possibility of increasing the mileage derived from a tire carcass [6,7].
A well-managed tire may be retreaded at least twice, lasting 600,000 miles (960,000 km) under US conditions [8,9]. However, under Indian conditions, large fleet operators like the Tamil Nadu State Transport Corporation Ltd. (TNSTC) get less than 225,000 km/tire on average (Table 1). Numerous elements, like material quality, technology, process, and operating conditions, could cause this vast difference in mileage [10]. Moreover, ordinary road utility affects a tire body’s properties, affecting its age [11]. On this score, the two countries must be on a level platform for comparing performance. Yet, with all conditions remaining unaltered, the possibility of obtaining more mileage from an HDV tire casing under Indian conditions needs to be studied. Road transport accounts for 90 percent of passenger movement and 50 percent of cargo movement in India. The technologies for retreading tires need to be updated in markets in Europe and the USA [7]. Therefore, even if the tire is fit for a retread, a decision needs to be made regarding whether it is economical to retread beyond a certain number of times.
Existing tire retreading strategies primarily rely on human expertise and a manual assessment, which introduce inconsistencies and inefficiencies in decision-making [9,12]. The lack of standardized, data-driven frameworks often leads to premature condemnations or excessive retreads, both of which result in unnecessary costs and resource wastage. Decision-making in traditional retreading is highly dependent on individual experience, which varies across locations and personnel, making large-scale implementation unreliable. In contrast, the proposed machine-learning-driven approach provides a systematic, automated, and objective framework for assessing tire retread viability. By leveraging predictive models, it ensures consistent, error-free decision-making across fleets, optimizing the number of retreads while maximizing tire mileage. This approach not only enhances operational efficiency but also minimizes procurement costs and environmental impacts, making it a superior alternative to conventional, experience-driven methods.
The significance of this study extends beyond the tire industry to the broader field of sustainable research. The findings have substantial implications for sustainability in logistics systems, particularly regarding resource optimization and sustainability. Through an exhaustive analysis, this study quantifies the potential improvements in sustainable efficiency by optimizing tire retreading practices. This research represents a valuable contribution to scholars across various domains within sustainability research, as it provides insights into the integration of predictive modeling techniques into resource management, an area of growing importance for industries aiming to achieve SDG goals. Future research could explore expanding this model to other sustainability systems and further refining the methodologies for even greater accuracy and practical applicability in diverse industrial contexts.

2. Literature Review

While research in the field of retreading is sparse, a handful of literature reviews have made notable contributions [13,14]. These reviews underscore the significance of the retreading process. For instance, Sharma (2013) highlights that only 20% of a tire is used for treading, leaving 80% for carcass material and thus presenting an opportunity to salvage the entire tire body [15]. Furthermore, Sharma (2013) distinguishes between traditional hot retreading and cold or procured methods [15]. Ferrer (1997) observes that retreaded tires are more cost-effective to produce than new ones [16]. Various articles discussed the benefits of tire retreading, emphasizing its role in recycling and enabling tires with intact sidewalls to be refurbished and reintegrated into service [17]. Additionally, case studies have shed light on the practical implications of retreading. For example, a study conducted in a state transport workshop revealed the potential to extend the tire lifespan by reutilizing old tires [6]. Similarly, Mondal and Mukherjee (2012) present a simulation of the tire retreading process using an Indian case study as a reference [18].
Additionally, tire retreading is a crucial solution to ecological and economic concerns [19]. Notably, the substantial savings in new tire purchases and the positive environmental impact of retreads, attributed to reduced crude oil consumption, underscore the significance of retreading [20]. In recent years, the integration of circular economy principles in the automotive sector has gained significant momentum. Studies are evolving in the automotive industry to create a circular economy; one study used a combination of two-stage methods—crowdsourcing and Delphi approaches—to prioritize tire circular economy strategies, emphasizing multi-stakeholder engagement in policy and industry [21]. Another study explored the use of tire-derived aggregates in railway transportation infrastructure as a sustainable reuse model, thereby extending the lifecycle of tire materials through industrial symbiosis [22]. Furthermore, machine learning has emerged as a pivotal enabler of this transition, with recent frameworks demonstrating how ML integrated within intelligent circular economy (ICE) systems can optimize material recovery, predict wear patterns, and extend product lifespans [23]. These advancements signal a broader shift toward intelligent remanufacturing systems that align with global sustainability and resource optimization goals.
Transport operators often need help with whether to retread or purchase new tires, necessitating access to comprehensive tire history information. Researchers have endeavored to facilitate informed decision-making in this regard. The application of predictive modeling in tire retreading has been an area of growing interest, particularly with the integration of machine learning techniques. Notably, decision tree-based machine learning models have been introduced in retreading technology, as exemplified by Marangoni retreading technology [24]. This highlights the potential of data-driven decision-making in optimizing the retreading process. Additionally, a regression-based analysis has been utilized to establish the relationship between rubber specimen stress and deformation using the Arruda–Boyce model [24,25]. Such models provide valuable insights into tire behavior post-retreading, facilitating mileage predictions and lifecycle assessments. In broader applications of predictive modeling in tire maintenance, research has focused on truck fleets. For example, one study [26] introduced a tire life prediction framework incorporating historical inspection, telematic data, and FEM modeling to optimize truck tire retreading decisions. The framework demonstrated an improved prediction accuracy by employing a global sensitivity analysis and an advanced dataset balancing method (VR-SMOTE), which enhanced model robustness through Bayesian-optimized Random Forest models (F-1 score of 0.88). Another study [27] proposed a machine learning-based regression model to estimate the remaining useful life of commercial vehicle tires, utilizing factors such as the current non-skid depth, standard NSD, road conditions, and wear patterns per kilometer. However, this model was limited to truck tires, with no expansion to bus fleets or varied operating conditions.
Despite the advancements in predictive modeling for tire maintenance, existing studies have predominantly neglected the unique operational challenges of Indian bus transportation. Bus tires experience frequent braking, higher passenger load variability, and depot-specific maintenance schedules, all of which significantly influence tire wear patterns. Additionally, previous models have not incorporated parameters such as the depot, retread stage, seasonal variations, and tire condition—factors that are crucial for accurately predicting bus tire mileage and optimal retreading strategies. To address this gap, the present study evaluates a machine learning framework to enhance mileage extraction and optimize retreading decisions. By applying these advanced techniques to a case study in a State Transport Corporation, this research offers a scalable, data-driven solution for improving fleet-level tire management, cost efficiency, and sustainability.

3. Methodology

This study employs a comprehensive approach to optimizing tire performance and mileage strategies, integrating data-driven and mathematical methods. The methodology begins with data collection on key factors such as casing integrity, depot conditions, injuries, seasons, and retread stages. A thorough data preprocessing phase ensures consistency and prepares the data for further analysis. An exploratory data analysis is conducted to uncover underlying patterns, and key variables are identified through feature selection techniques. The study utilizes two primary approaches: mathematical modeling and machine learning, with a regression analysis to predict tire performance. The model’s efficacy is assessed using R-squared metrics, which provide valuable insights into tire longevity and operational efficiency within transportation systems. Figure 1 visually illustrates the overall methodology.
The proposed methodology can be directly applied to real-world sustainable systems, particularly within tire retreading and fleet management operations. By leveraging predictive modeling to optimize tire retreading decisions, this research offers a scalable solution for improving tire mileage, reducing premature condemnations, and enhancing the efficiency of tire usage across fleets. This approach is relevant not only for bus and commercial vehicle fleets but also for the broader logistics and transportation sectors, enabling measurable improvements in fleet performance, cost reduction, and sustainability.

3.1. Case Study

Tires of vehicles in the private sector are retreaded in plants or small-scale industries. The retreaters are not the owners of the commercial fleets. The required data for a study are unavailable as the operators who own the tires and retreads are different entities. The State Transport Undertakings operate hundreds of buses under varying road conditions. TNSTC operates a large fleet and conducts tire retreading in its own plants using the cold pressure process. To ensure systematic documentation, tire history cards are maintained, facilitating data-driven decision-making. The state’s fleet of 21,744 buses has shown consistent improvements in tire mileage before condemnation, as outlined in Table 1. To generalize the findings, the selected variables and parameters encompass a wide range of operational conditions, making the study applicable to other TNSTC regions and the broader industry. The case study was conducted in Viluppuram, Tamil Nadu, India, selected for its extensive availability of tire performance and retreading records, which provided a robust dataset essential for reliable model training, validation, and evaluation. Additionally, its accessibility for on-site study, clarifications, and inquiries further supports its selection. The study area map is presented in Figure 2, and the data in Table 1 are sourced from the Transport Policy Note, TN Legislative Assembly (2018–2019), while the other tables are derived from TNSTC’s Transport Department Policy Note.
Tires are rejected at several points during retreading. An analysis of condemned tires in the TNSTC region for a consecutive period of six years was undertaken to find if there is any definite pattern in condemnation. If so, it can be assumed that the same pattern will continue in the future years, and the aim is to study whether changes in numerical values of the distribution can improve the mileage per condemned tire with due interventions. All the tires condemned in 2018–2019 were chosen for a critical study. The mileage obtained at various stages of retread was analyzed to find whether the number of times a tire got retreaded was relevant to the mileage obtained and the possibility of optimizing the number of retreads on a casing ascertained.
To increase the mileage from a tire, two scenarios are developed with certain assumptions and the km expected from a simulated tire. Operating the same scheduled distance with increased mileage per tire would lead to a reduced requirement for new tires. It will benefit both the corporation and the principles of sustainability. It can be seen from Table 2 that there is a reduction in the overall cost/paisa/km that is conspicuous. The radial cost per km is lower than bias tires for the period under study. It is less by 2.9 ps/km in 2016–2017, 3.53 ps/km in 2017–2018, and 3.38 ps/km in 2018–2019. Considering this advantage and in line with the global trend, TNSTC (Viluppuram) switched to cent percent radial tires in mid-2019. Hence, the study is confined to radial tires.

3.2. Data Collection and Preliminary Data Analysis

The source of the data collection is the tire history card. From that, a six-year trend analysis of the population of radial tires condemned at various stages is undertaken and inferences are made. This is performed annually for six successive financial years from 2013 to 2014. Table 3 shows the increase in the condemned tire population during the study period. Based on the corporation policy decision, this is due to the increased radial tire population in the region under study.
The data in Table 3 are pictorially displayed in Figure 3 for ease of understanding. This reveals a similarity in the pattern of condemnation concerning the stages of retread. Irrespective of the total number of tires scrapped, the maximum condemnation occurs at the second retread stage in all six years. This is the highest in 2018–2019. In the same period, the number of new and first retread stage condemned tires is reduced compared to previous years. This reduction is gradual and continuous. It is seen that very few tires have been retreaded for the fifth time or above.

3.3. Evaluation of the Kilometer Yield and Contribution Across Retread Stages

Specific km are yielded from the original casing and subsequent retreads in each retread. When a tire is condemned, its cumulative km yield is calculated by adding all the km yielded at each retread stage and the original casing. An analysis of the km yielded at various stages of tire scrapping and the contribution to that yield through different retread stages within that stage is shown in Table 4. It reveals that these tires were retreaded up to six times. Tires condemned at the first RT stage gave 230,000 km and the tires condemned at the sixth RT yielded 292,000 km. A study of the actual km extracted out of different stages of retreads in the life of a tire reveals that for the sixth retread, the kilometer yield is less than 104 km. In Table 4, the average km yielded is 2.9 and 2.92 lakh km in the fifth and sixth RT stages, respectively. The sixth RT yielded an average of only 2000 km. As the cost of retreading is the same, it is not worth the expenditure to retread for a sixth time for a mere gain of 2000 km. However, the population of tires in the sixth RT stage is small, and if at all resorted to, it can be for an internal study and research. Figure 4 shows a stacked histogram of the total tire life in km run derived from Table 4. The sixth RT yield is too low for a visual display, and so it is merged with the fifth RT km. Table 5 is derived from the information in Table 4.
It reveals the percentage contribution of total km by various retreads in different stages of tire condemnation. Table 5 shows that irrespective of the number of times a tire casing gets retreaded, the maximum percentage of km is obtained from the original casing.
Studying the retreaded tires reveals that the original casing yielded between 58% of the gross km in the fourth RT and 79% in the first RT. The original casing yield is about 50% in the higher RT stages.
The next higher percentage yield contribution is from the first RT, which ranges from 20% to 15% up to the third RT stage. After that, it is reduced from 12% to 10% from the fourth RT onwards. From the third to sixth RT stages, the contribution is 11% to 14% of the gross yield. Figure 5 shows a stacked histogram depicting the percentage share concerning the total km yield from a condemned tire for each stage.
For example, 32 tires were scrapped as original. These tires were never retreaded. Hence, the first histogram from the left shows a 100% yield from the original casing. The second histogram from the left analyzes the average km yielded from 476 tires condemned after the first RT. Here, the original casing yielded 79% of the total 230,000 km and 20% from the first RT. Out of all the eight tires condemned in the sixth RT stage, the original casing yielded 48% of the gross average of 292,000 km. It can be seen that the more retreads there are, the lower the percentage yield from the original casing. In all stages, the original casing yield is the highest both in terms of percentage and km run, which is always more than 1.25 lakh km. This is because retreaded and new tires cannot be equivalent products. The X-axis represents different stages of tire retreading, ranging from the original casing to the sixth retread. Drawing from the insights gained and discussions held, two distinct scenarios have been conceptualized and developed to enhance the mileage obtained from retreaded tires. The potential savings in new tire procurement have also been calculated for each scenario. Furthermore, this paper delves into the prediction model constructed using machine learning algorithms and compares various algorithms in subsequent sections.

4. Model Development

Developing a data-driven approach is integral to making informed decisions regarding tire retreading, replacement, and resource allocation, thereby fostering significant cost savings and operational improvements. By integrating predictive models, decision-makers can enhance tire performance forecasting, minimize premature condemnations, and optimize procurement costs. This approach empowers industry leaders to balance cost efficiency and sustainability, promoting financial and environmental benefits across tire management practices. Tires are condemned at different stages of their lives. They will get retreaded once, twice, thrice or even more depending upon the fitness of the casing. When found unfit for further use, they are condemned. Certain tires are condemned in each stage, and an average km run per tire is derived. The overall population average km is derived through the weighted average method. When a tire is retreaded for the first time, it yields about 47,000 km on average. When retreaded for the second time, the second retread produced around 42,000 km on average; after that, the yield kept going down for every retread. Figure 6 shows the average for the respective population. Some tires in the population will yield higher and some low km than the average.
Table 6 shows the number of tires with low km yields at different RT stages. For this purpose, a low yield is calculated as 104 km. There were 339 tires in this category. This table excludes the 77 tires that failed in RT and the 32 new tires condemned, as the focus is on performing RT tires. The 77 RT failures in the population are undesirable events. There are two ways of looking at this. If only the failure had been predicted, they would not have resorted to retreading these tires. This would have saved the effort and money. The other way of looking at this is that if these tires yielded the average performance in terms of km yielded relevant to the RT stage; they would have gained additional km per tire.
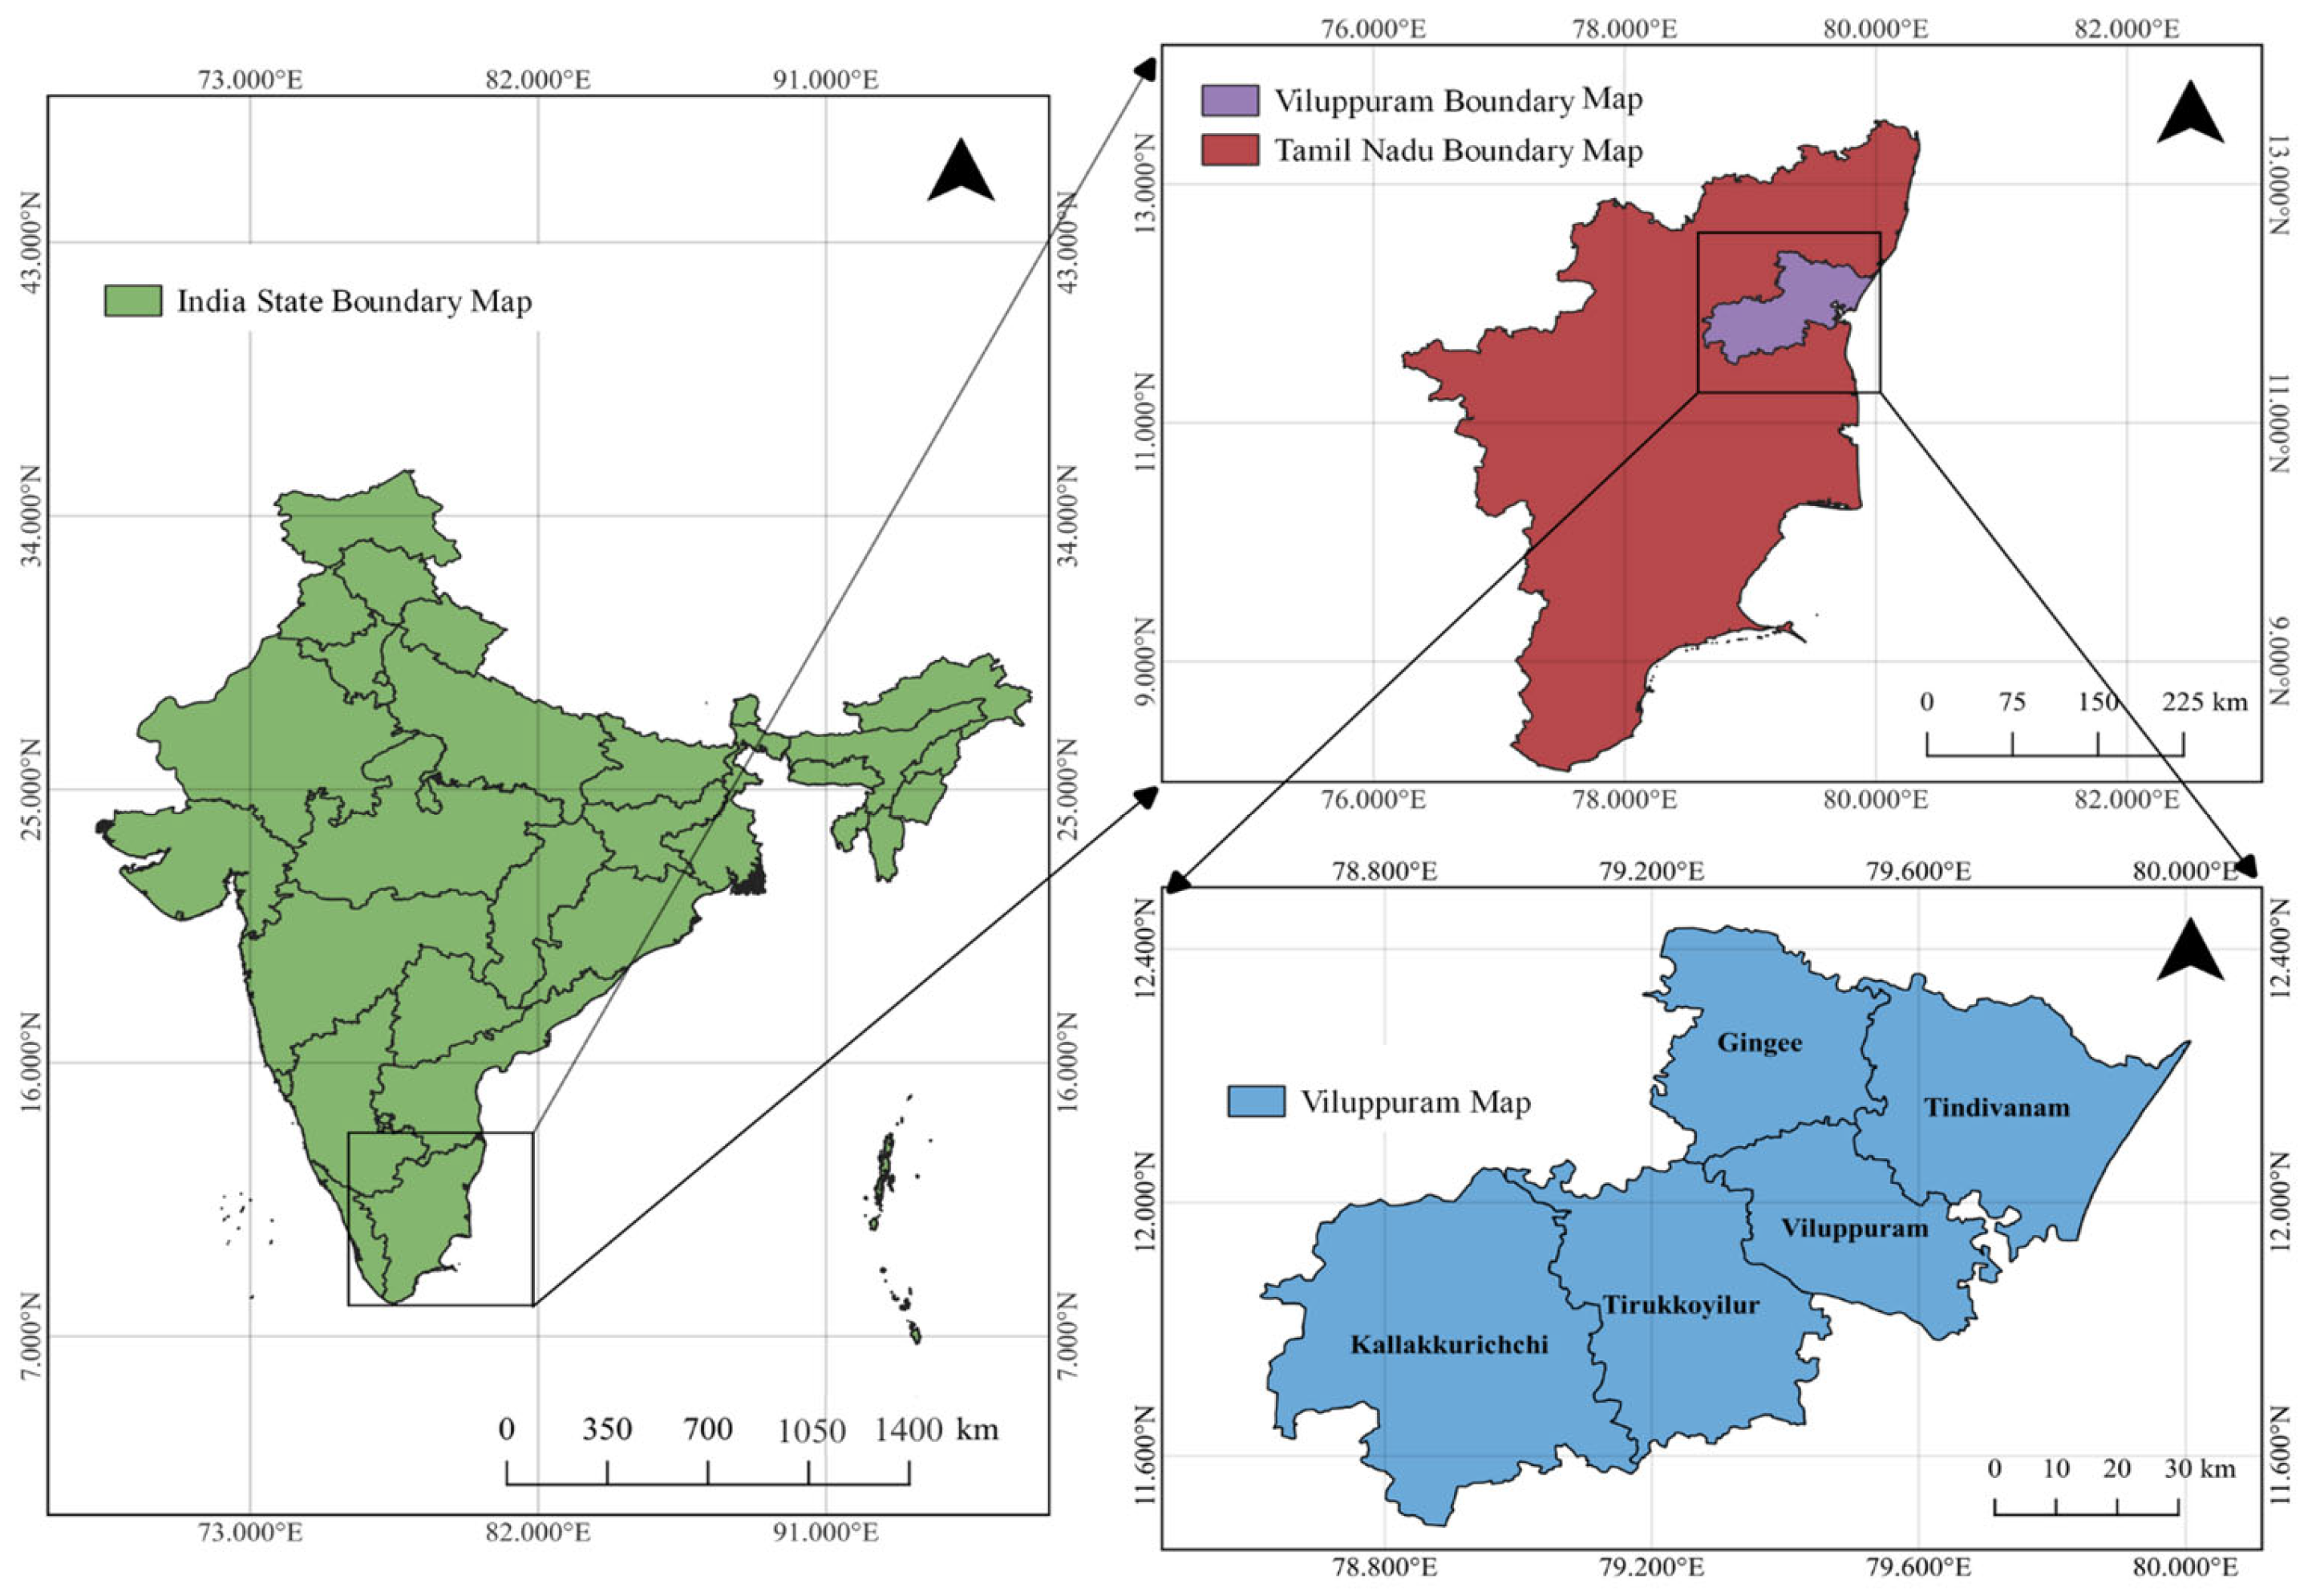
The inspection stage in tire retreading is crucial, traditionally relying on worker expertise rather than scientific methods. Developing mathematical and machine learning prediction models incorporating lifespan-affecting variables is crucial to improving this process. These models aim to supplement manual inspection with scientific tools. This study focuses on 900 × 20 radial tires manufactured by JK Tyres in Chennai and retreaded in Viluppuram. It examines factors influencing the tire lifespan, excluding tread rubber quality due to its guaranteed performance and thus neutralizing its impact.
i.
Casing life: A tire casing or carcass can yield a total life. It will be obtained as the sum of all the life it has yielded from different stages, namely, new, first retread, second retread, and so on, until it is scrapped. It will not go beyond a specific maximum limit. This limit can be assessed from the historical data. In other words, if one tire gives a maximum life of x km as new, another tire y km in the first retread, and z km in the third retread, it cannot be assumed that a tire will cover x + y + z km in total. It can yield somewhere around the maximum from a carcass in that batch. But over time, the total mileage can be increased due to product improvement, improved maintenance standards, and so on.
ii.
Depot: The depot or branch assigned to a tire can significantly impact its performance. External factors such as road and load conditions also play crucial roles in the tire lifespan. Certain depots have excellent roads, while others may require better road infrastructure. For instance, buses operating on village or unpaved roads face different conditions affecting tire life. Tire longevity is closely tied to operating conditions. Depots vary in road quality based on their geographic location, and their historical tire performance can be used to grade them. As roads improve over time, appropriate correction factors can be applied.
iii.
Casing injuries: A retreaded tire can achieve optimal mileage if its casing is robust and without flaws. Injuries, such as stone cuts and metal penetration, compromise tire integrity. Even with quality repairs, damaged casings are weakened and cannot match the mileage of undamaged tires. The number and size of injuries directly impact yield: more injuries result in lower mileage, and larger patches reduce the yield further.
iv.
Season: Tires damaged during the rainy season may experience water seepage through the injury cleavages, weakening the casing and potentially causing failure at the repair sites. Consequently, retreaded tires with repaired injuries in the casing may exhibit reduced mileage, particularly if the injury size is substantial, increasing the risk of immediate failure.
v.
Age of the fleet in the depot: A young fleet is expected to have minimum suspension, nearing, and steering linkage problems. A depot with a young fleet is likely to obtain a retreaded tire that may not wear out rapidly due to mechanical issues in the vehicle. If this is true, the converse is also true.

Building a Mathematical Model

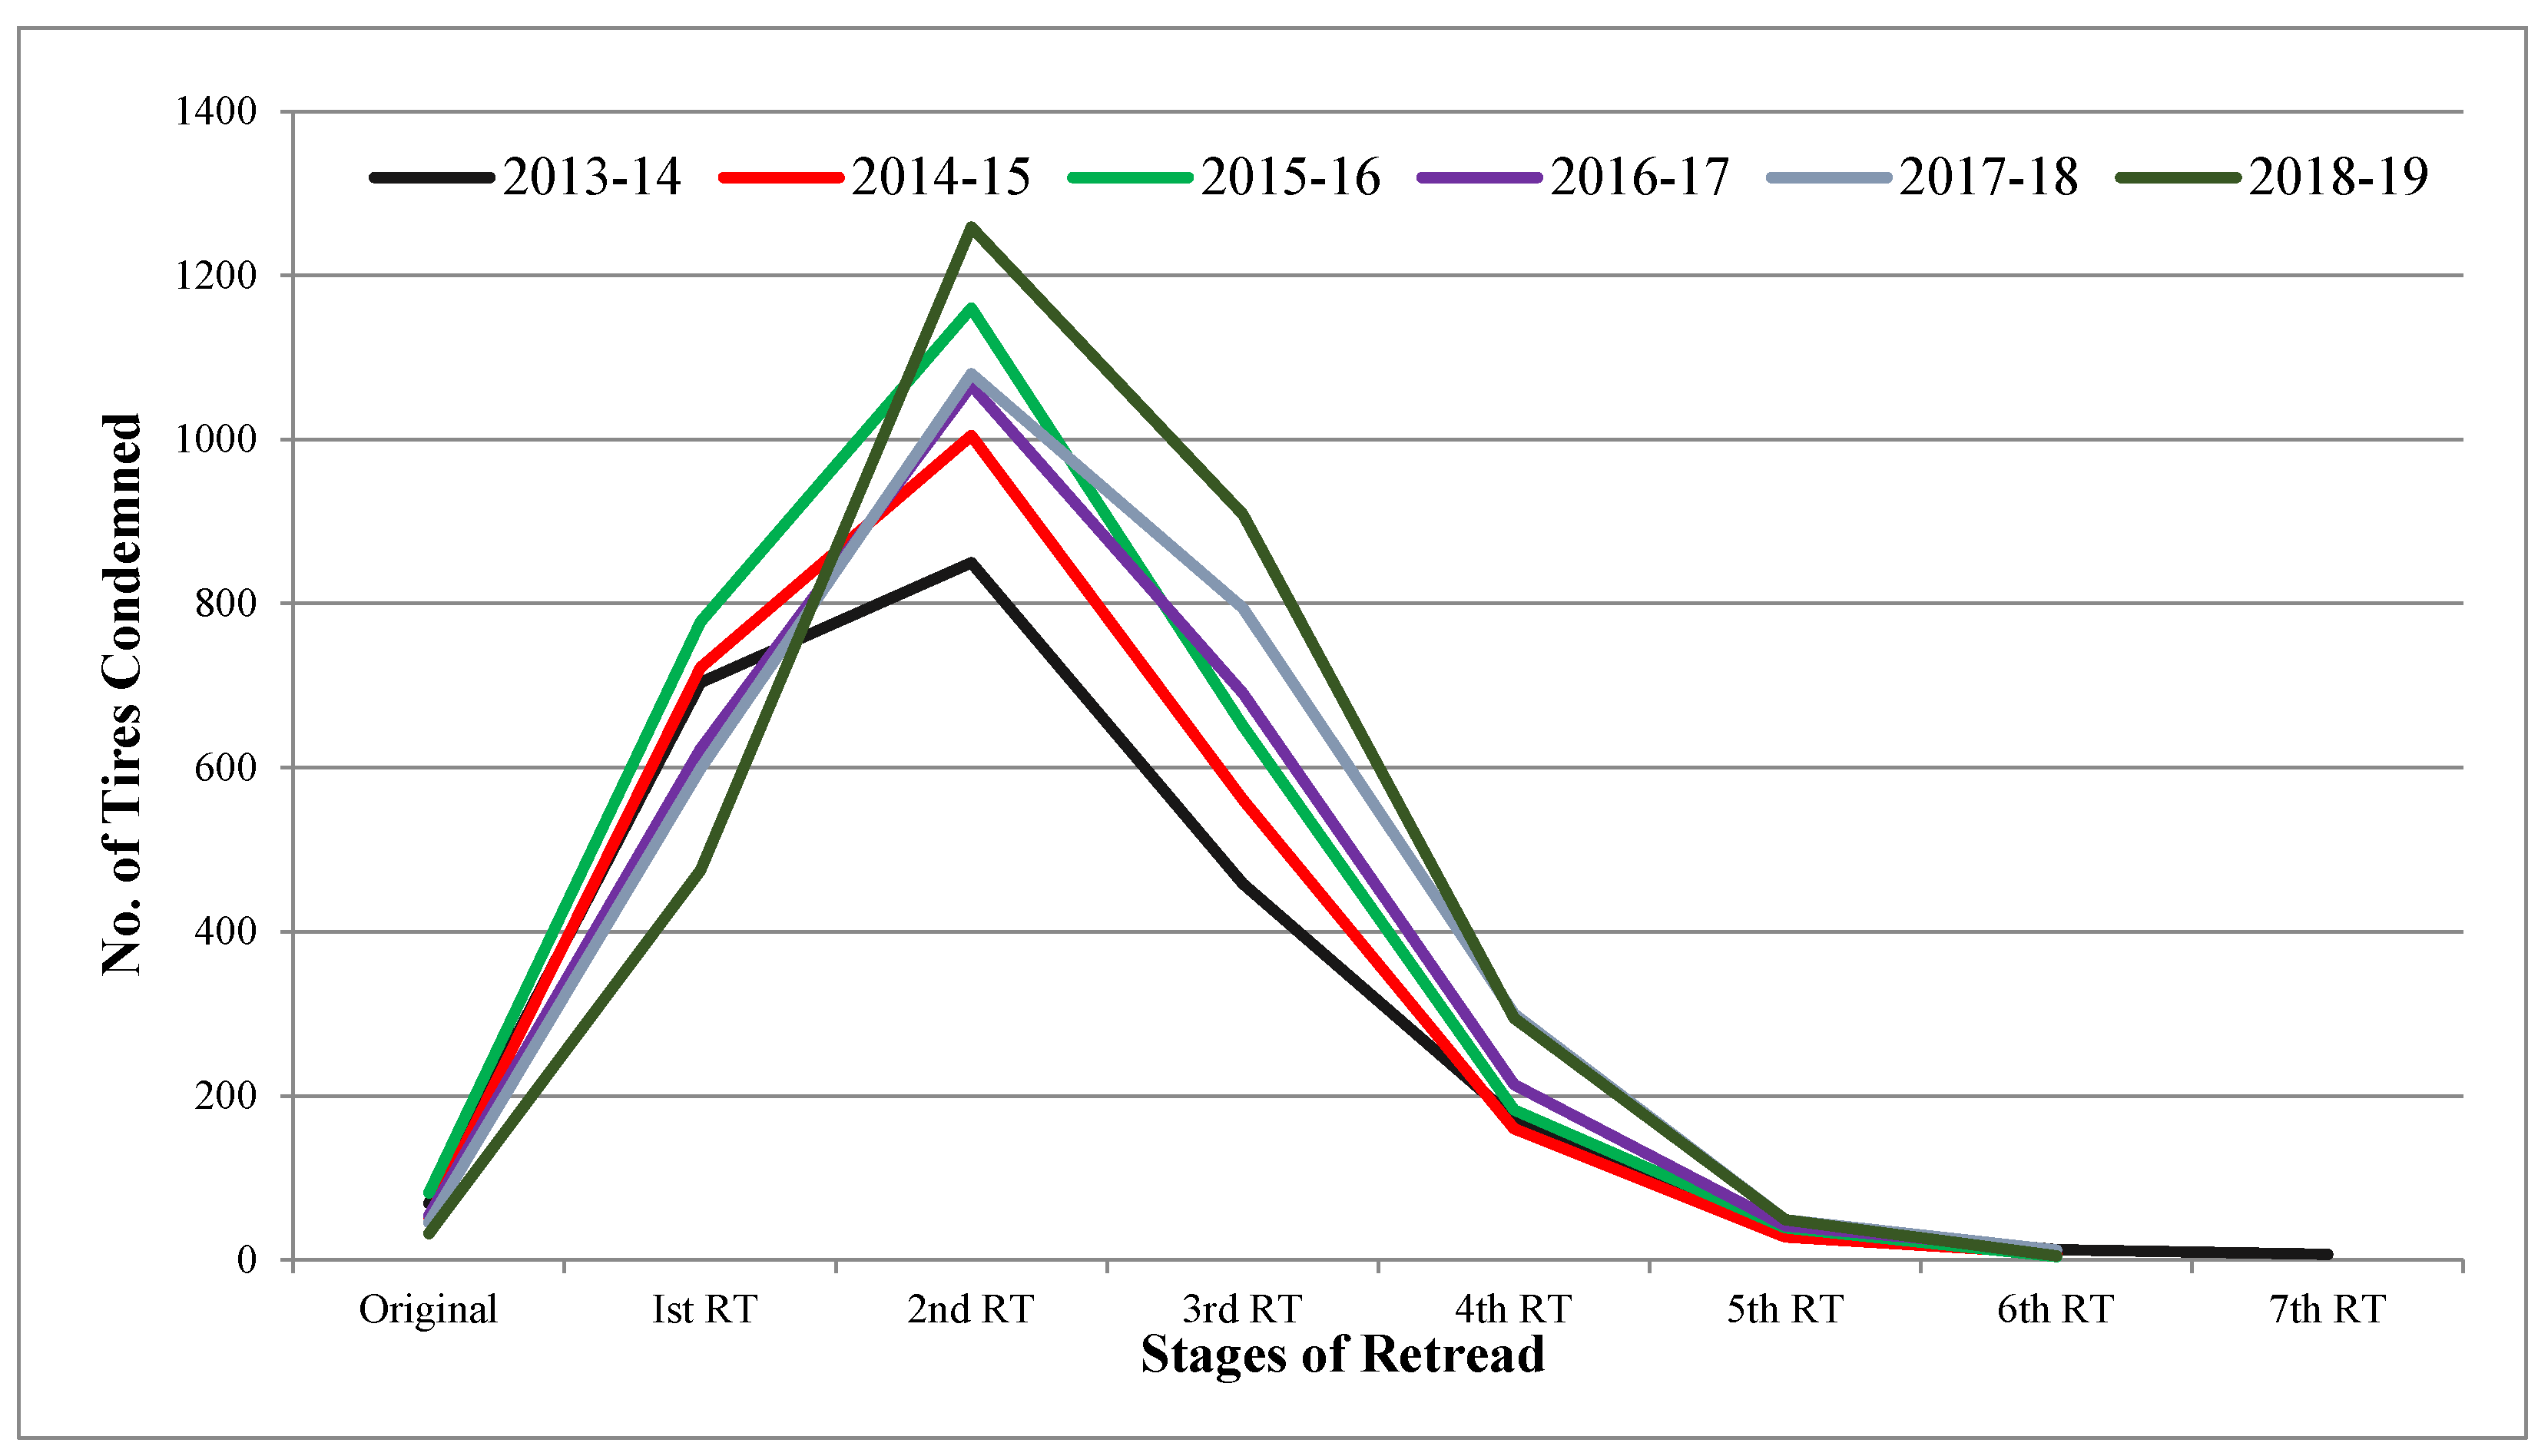
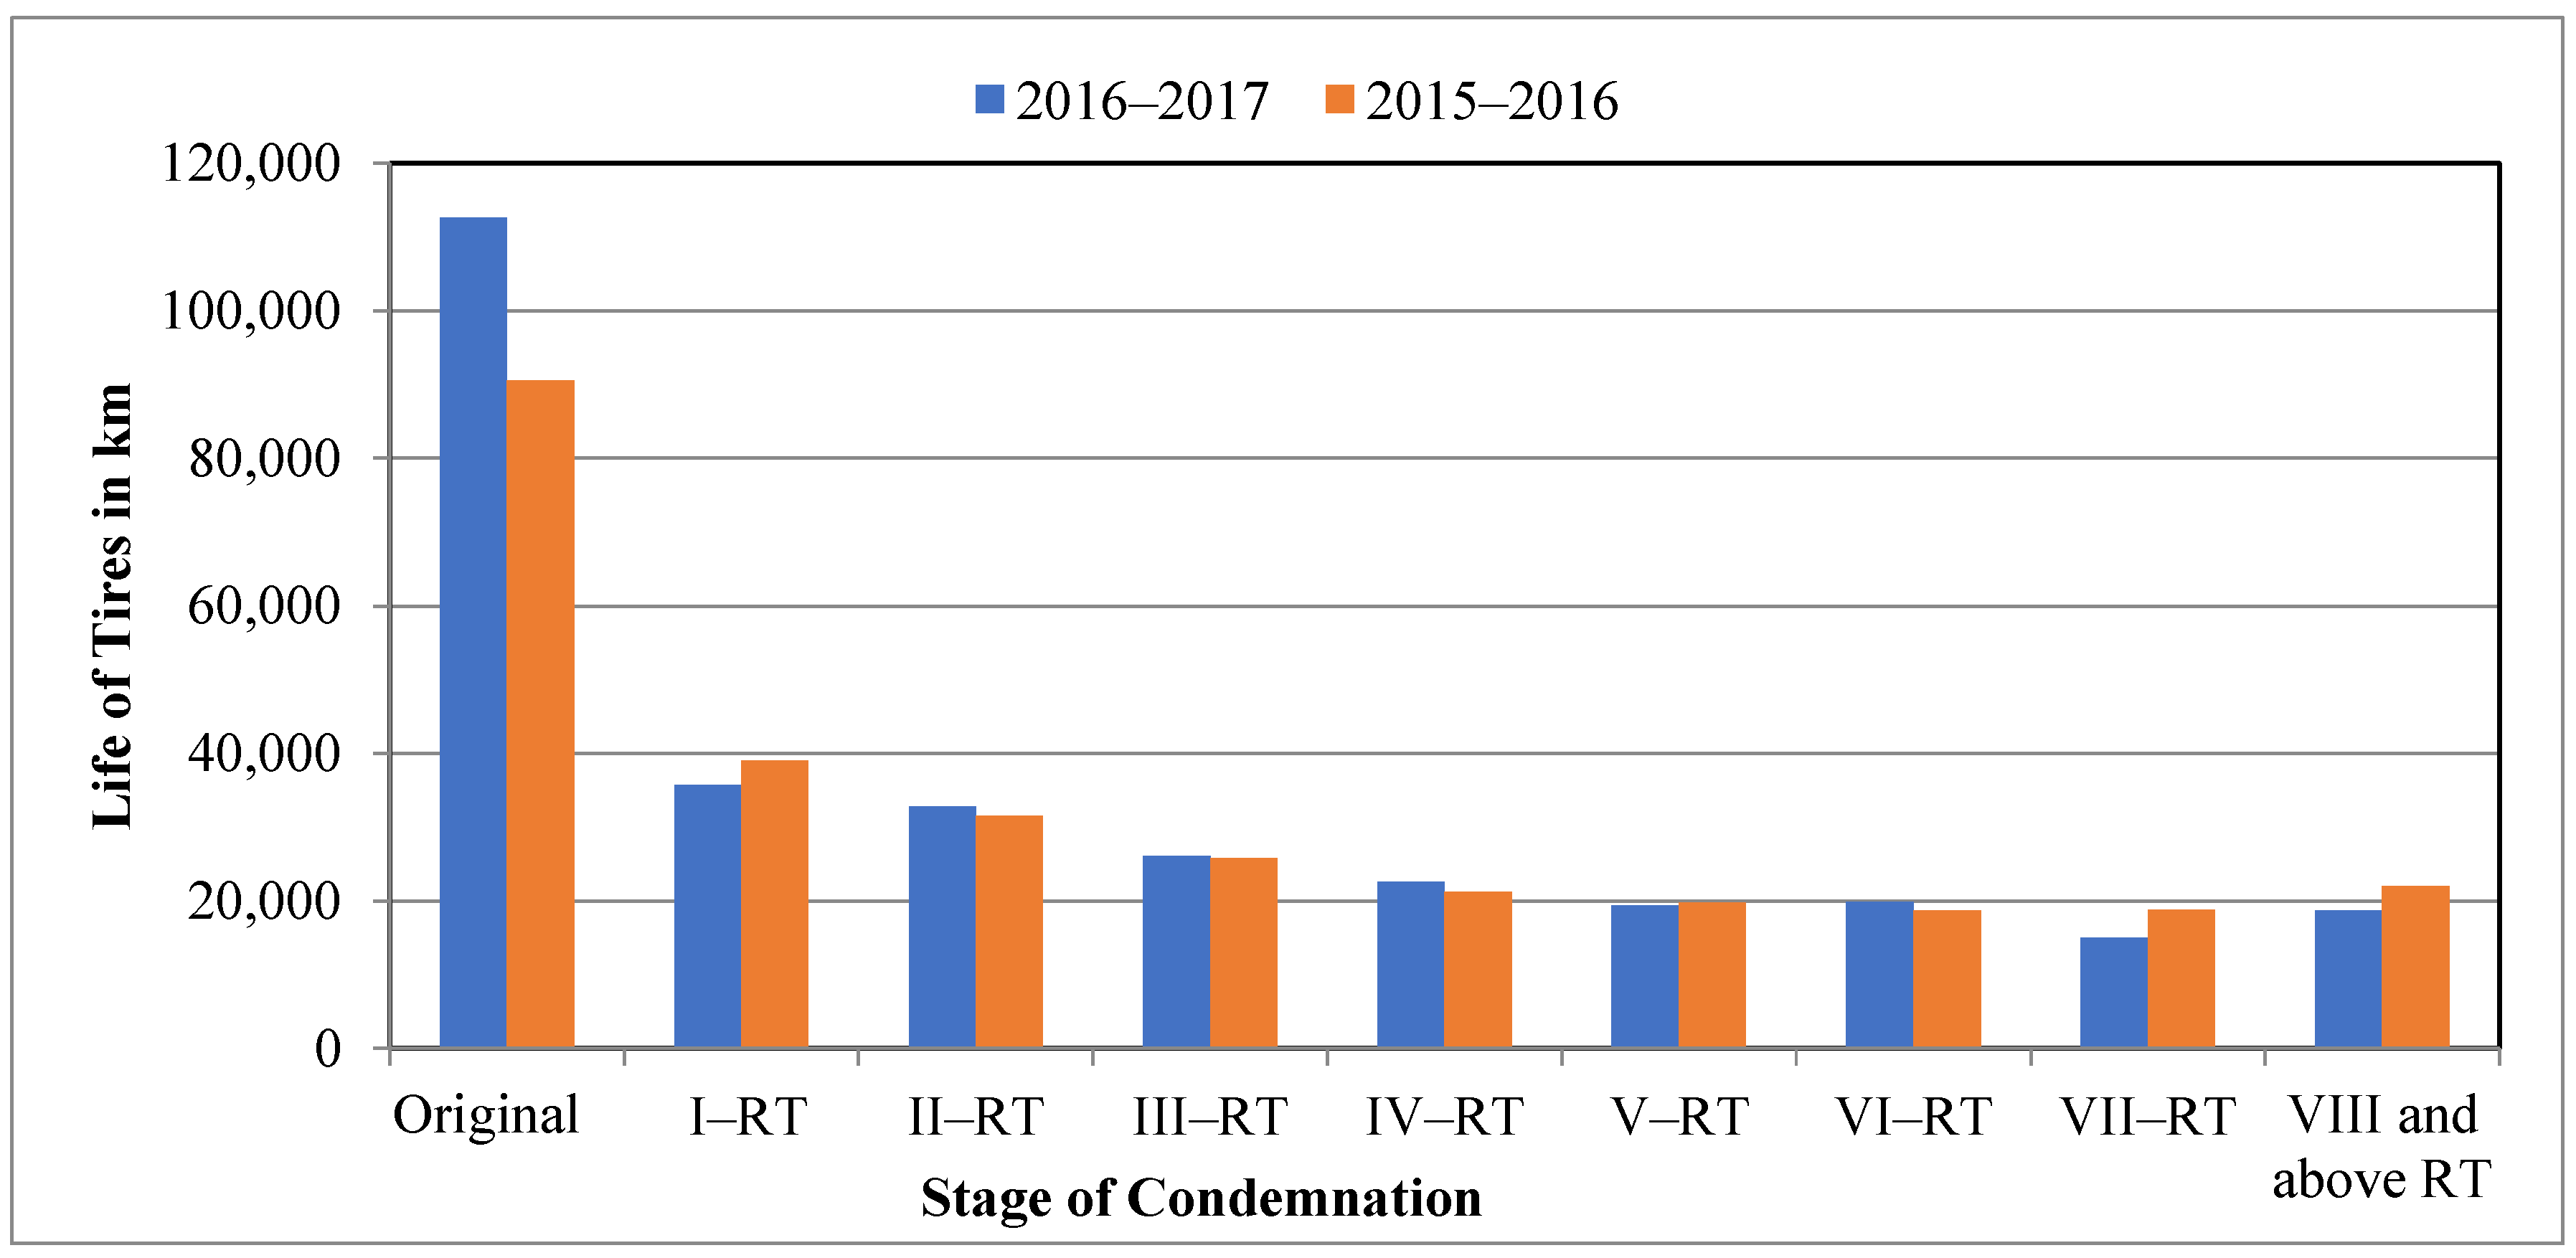
The dataset spans six consecutive years of tire usage in the Viluppuram region. Over time, the mileage extracted from condemned tires has shown a gradual and continuous increase, possibly due to advancements in product development, process refinement in retreading, or maintenance practices. The mileage that could be extracted from each year’s tire casing was analyzed. This involved considering a statistical distribution of all condemned tires, excluding extremely low values indicative of new tire scrapping, and calculating the average (mean) kilometers obtained from the remaining tires. This average is denoted as M1, with ‘1’ representing the earliest year of data. Based on these considerations, two hypotheses were formulated to guide the development of our mathematical and predictive model. These hypotheses serve as foundational concepts for understanding mileage limitations and the impact of injuries on tire performance. Subsequently, two distinct scenarios were created based on these hypotheses, and their effects on the average kilometers yielded from condemned tires were evaluated.
Hypothesis 1.
This can be assumed as the maximum mileage obtained from a tire casing for that year. If a tire yielded this or near this mileage from its new casing, even with zero injuries, it may fail in its first retread.
Hypothesis 2.
This hypothesis suggests that the total mileage accumulated from new tires and retreads with new casings should not exceed Mn, where ‘n’ represents the year of data. In other words, if the mileage obtained from new tires is low, the cumulative mileage from retreads should be sufficiently high to avoid exceeding Mn. However, injuries to a tire casing can reduce the potential mileage, with the extent of the reduction depending on the number and size of injuries. More significant injuries and higher injuries result in a decreased mileage yield from retreads.
Scenario 1 Assumptions
(a)
New tire failures are eliminated, and they achieve the population’s average mileage.
(b)
Tires that gave 104 km or below get the respective retread stage average mileage.
(c)
RT failures are eliminated to obtain the average mileage of the respective retread stage.
a.
New Tire Failure Eliminated
If the number of new tires condemned is N 0 , the average km obtained for the N 0 population is x o , and the overall population’s average mileage of x is achieved by N 0 , the impact of a tire on the overall population will be
N 0 x x o N
The total tire population condemned is N . In this case, it is 32 (260,000 − 84,000)/3027 = 1861 km/tire. Let us denote it as A1.
b.
Tires That Gave 104 or Lower
The total number of tires that gave 104 and fewer km is denoted by N L . The suffix L indicates the low-mileage population; in this study, it is 339 tires. Along with the suffix L, if a number is denoted, it means the stage of retreading. For example, N L 1 will indicate the number of tires that gave 104 and fewer km in the first retread stage. The km obtained from each retread are denoted by x , with a suffix number indicating the number of times that tire was retreaded. For example, x 3 shows the km obtained through the third retread. For the purposes of calculations, it is assumed that all tires are given 104 km. The additional km obtained are calculated using the following formula:
i = 1 n 1 N N L 1 ( x 1 10 4 ) + N L N ( x n 10 4 )
where n is the maximum number of retreads. In this case, eight sixth RT tires with an average of 9600 km, less than 104 kms, are excluded. This equals 140,000/3027 = 3279 kms/tire. It is called B1.
c.
Retread Failures
N F denotes the number of tires that encountered a retread failure. In the case under study, it is 77 tires. In the suffix along with the letter, if a number is affixed, it indicates the stage of the retread. For example, N F 4 denotes the number of tires that failed at the fourth retread. It was assumed that these tires did not encounter a retread failure and had obtained the average kilometer yield in their respective stages of retread. The additional mileage obtained is calculated as follows:
i = 1 n 1 N N F 2 ( x 2 ) + N F 3 ( x 3 ) + + N F 6 ( x 6 )
In this case, it equals 2,054,400/3027 = 679 kms/tire, which is C1. Scenario I net benefit: The net additional km in Scenario I will be A1 + B1 + C1 = 1861 + 3279 + 679 = 5819 kms/tire, and the average condemned tire km will be 265,819 km. The tire requirement would have been (260,000/265,819) × 3027 = 2961 tires instead of 3027. Therefore, the resulting savings was 66 tires.
  • Scenario II Assumptions
(a)
New tire failures are eliminated and they achieve the first retreaded tires’ average mileage.
(b)
It is assumed that tires capable of undergoing retreading can sustain one additional retread cycle.
(c)
Retread failures are eliminated to obtain the respective RT stage mileage.
(d)
Fifth and sixth retread tires remain unaltered in the redistribution as in these stages, RT failures occur, and the population needs to be higher.
a.
New Tire Failure Eliminated
The additional mileage obtained is obtained using the following formula:
N 0 X X o N
where X 1 is the average first retreaded mileage, and the other notations are defined in Scenario I. It equals an additional 1543 km/tire, (W).
b.
Population Redistribution
The letter capital X will indicate the mileage, and the suffix of X will show the retread stage. Thus, X 1 will show the average mileage for the first retread stage. It includes the new tire mileage. Similarly, X 2 will reveal the average mileage of the second retread tire population, including those new tires and first retread mileage. All other notations will be as in Scenario I. The additional mileage per tire is obtained from the following formula. Given the high retread failures and low volume, the redistribution is stopped with the third RT stage. The number of tires condemned in the fifth and sixth RT stages remains the same. This equals 13,134 additional kms/tire. Let us call it Y.
N 1 ( X 2 X 1 ) + N 2 ( X 3 X 2 ) + + N 3 ( X 4 X 3 ) N
c.
Elimination of Retread Failures
The assumptions and procedures are the same as those outlined in Scenario I. This equates to 679 kms/tire. In Scenario I, this value was denoted as C1. Therefore, the additional average expected is W + Y + C1, which is 1543 + 13,134 + 679 = 15,356 kms/tire. Consequently, the expected average mileage will be 260,000 + 15,356 = 275,356 kms/tire, denoted as X I I . Upon assessing the net benefit of Scenario II and considering the predicted average condemned tire mileage of 275,356 km, the tire requirement is calculated as follows:
X X I I × N
which is (260,000/275,356) × 3027 = 2858 tires. This means there is a saving of 169 tires (3027 − 2858).
  • Developing a Machine Learning Framework
The framework begins with data collection on key factors such as the casing integrity, depot conditions, injuries, seasons, and retread stages. The data, sourced from official records over a six-year period, undergo a rigorous preprocessing phase to ensure consistency and reliability. First, the independent variables are structured and categorized based on the predictor notations outlined in Table 7, facilitating a standardized dataset. Missing values were carefully reviewed and removed only when they were found to occur randomly to avoid introducing bias through incorrect assumptions during imputation. Categorical variables were encoded using one-hot encoding to ensure compatibility with machine learning models. Outliers were identified using domain knowledge and the interquartile range method, and were handled accordingly to maintain the quality of the dataset. No data augmentation was applied so that the model could learn from real operating conditions. After manual checks for accuracy and completeness, the dataset was standardized using feature scaling and split into training, testing, and validation sets using stratified sampling to maintain class balance and ensure reliable model performance.
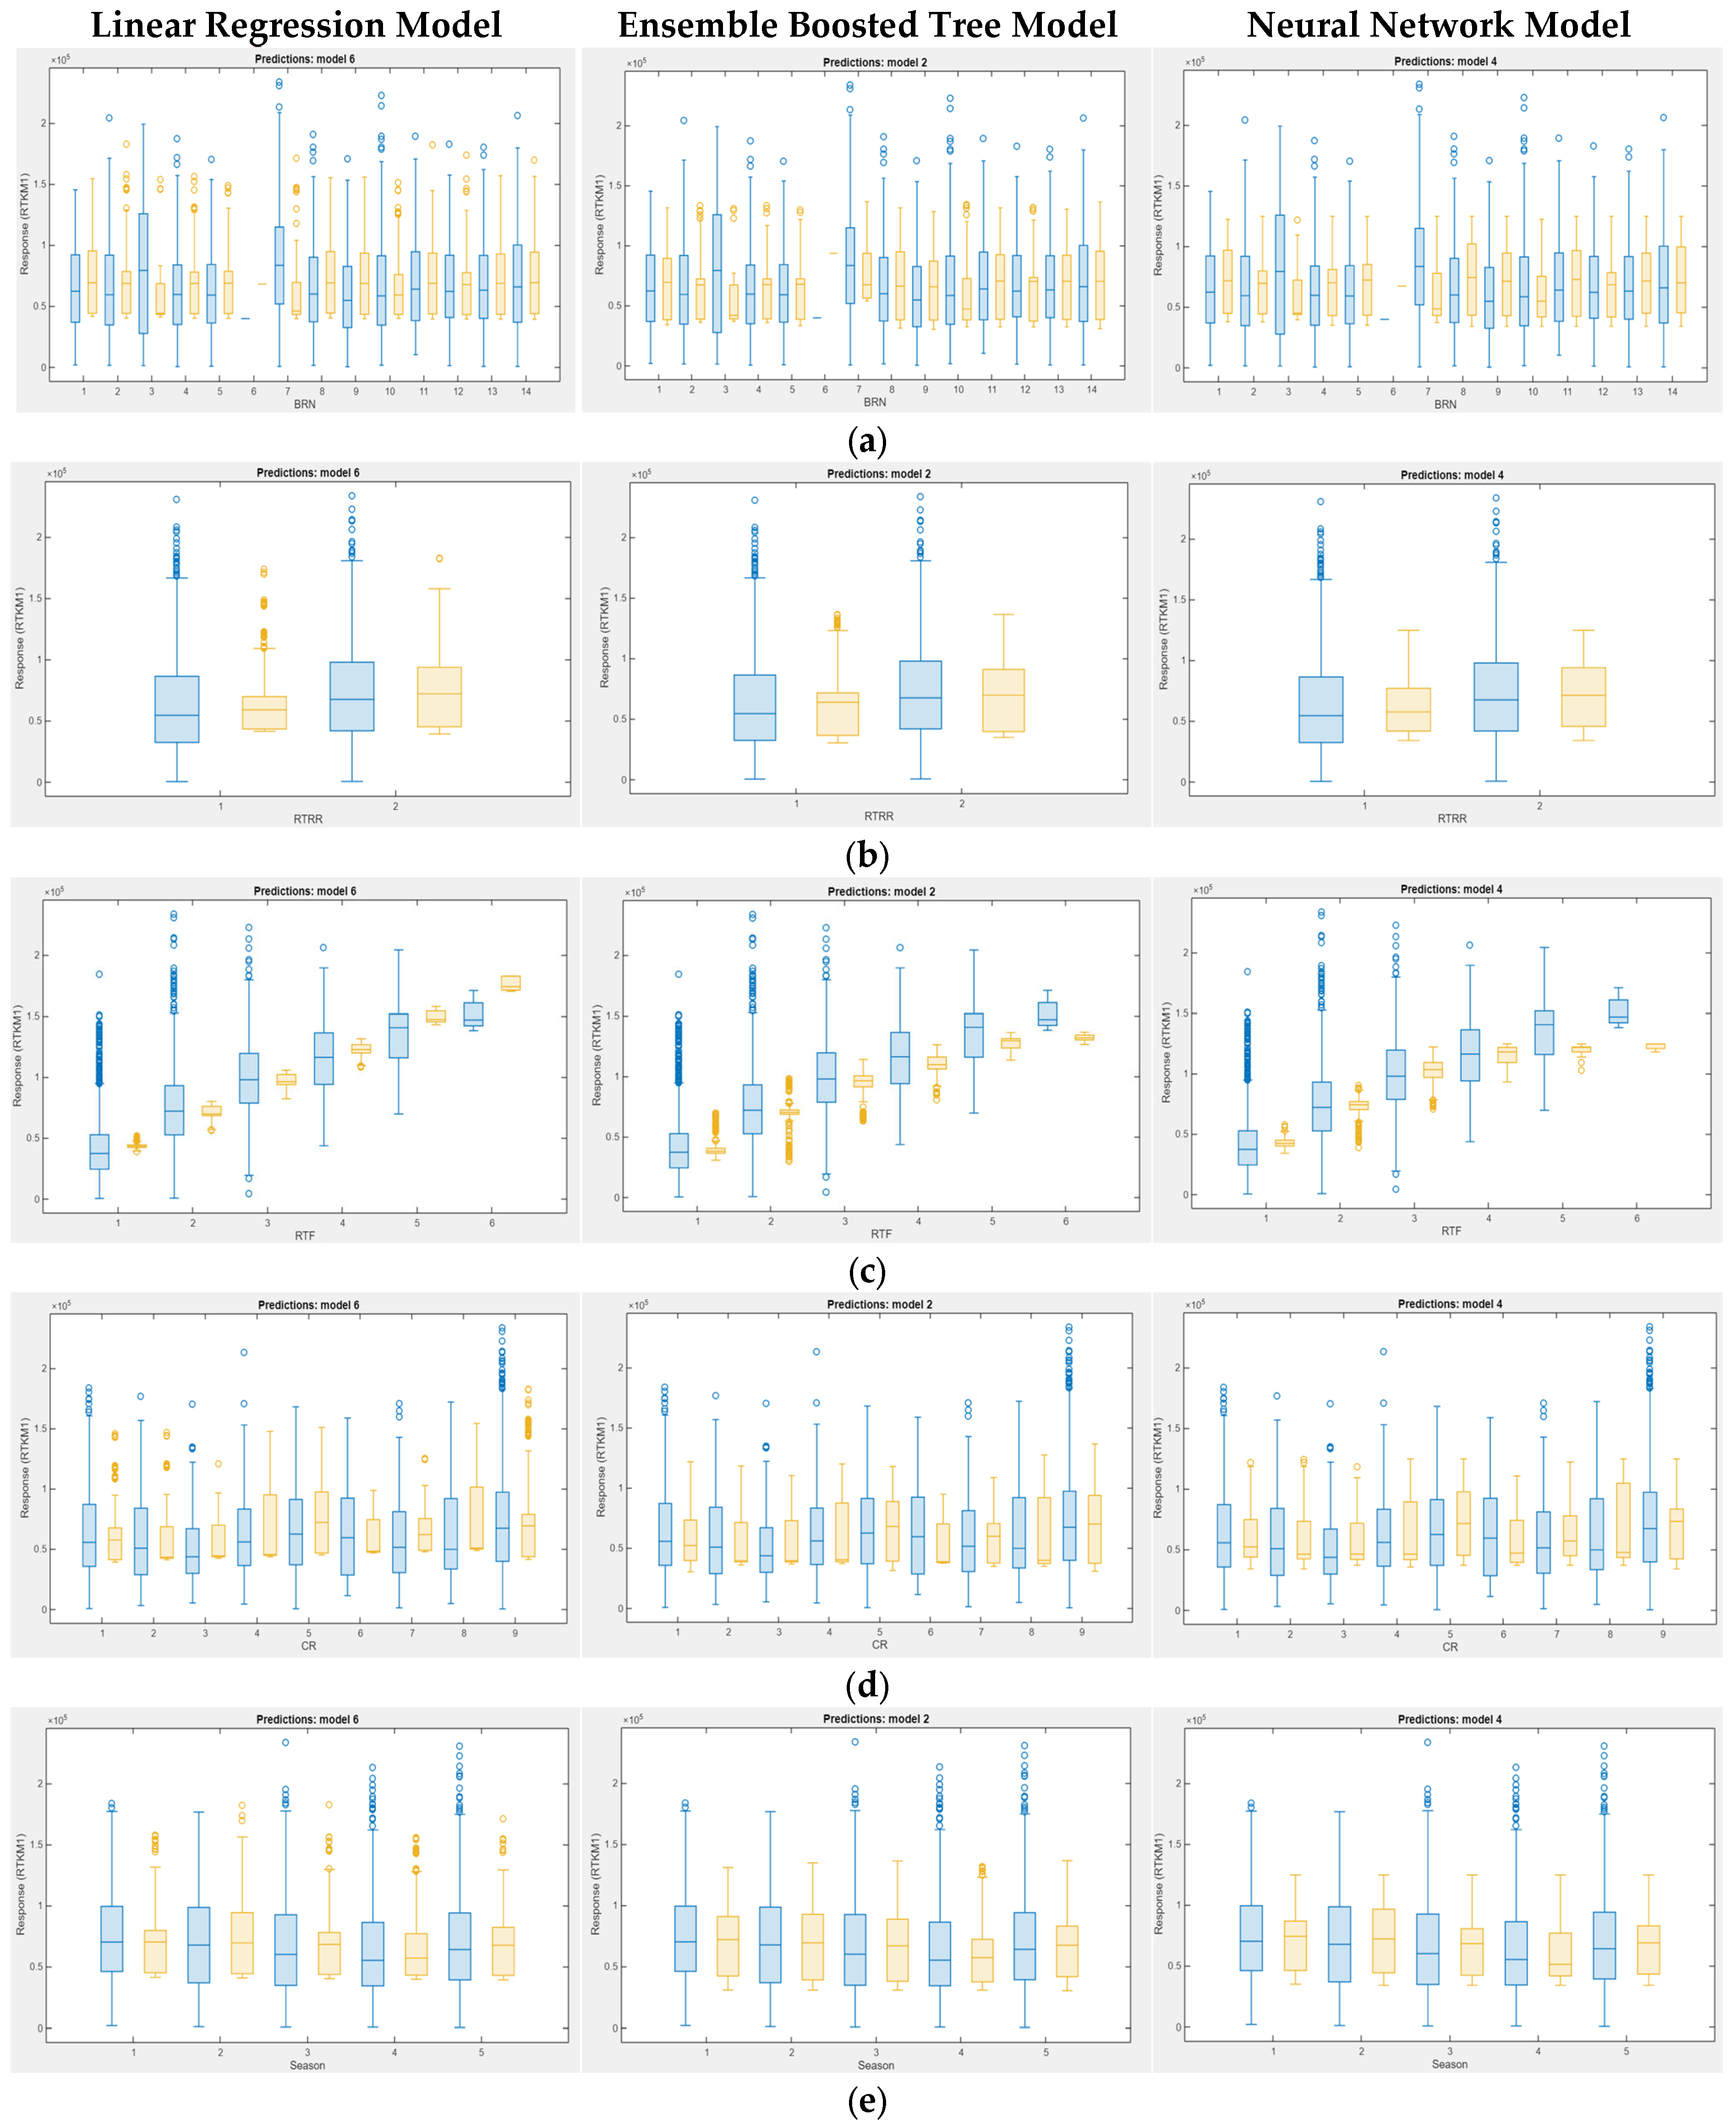
The depot or branch number (BRN) encompasses 14 distinct continuous values, each representing a different depot within the Viluppuram study area. The RT condition, denoted as RTRR, assumes 2 numeric variables for two conditions: WO and WR. WO signifies “without injury,” while WR encompasses all other conditions. The retread condition is numerically categorized as 1 or 2, indicating the absence or presence of injury. The third variable, retread stage (RTF), ranges from one to six, reflecting the maximum of six achieved retread stages observed in our study. The influence of different seasons on the situation was also noted, with the five most prevalent seasons in the study area represented by the numerical values one to five. Lastly, the retreading tire condition or tire status (CR) is categorized into 10 categories. These categories denote various conditions of the tire, ranging from KO1 for a one-inch patch to CO8 for a run-flat or shoulder injury. A serviceable tire is classified under CO9, while those without injuries receive a numeric value of 10. The road condition, vehicle load variation, and driver behavior were not explicitly included in the model for several reasons. Road conditions in Tamil Nadu are relatively consistent due to standardized road infrastructure development, resulting in minimal variability across depots. Vehicle load variation is not a critical factor for bus operations, as buses have dynamic passenger loading, unlike trucks with fixed cargo weights. Similarly, driver behavior, though relevant for a broader maintenance analysis, does not significantly impact the prediction of retread maintenance, which primarily depends on the tire condition, depot practices, and retread history. Therefore, the selected variables provide a robust framework for accurately predicting retread performance without the need for these dynamic factors.
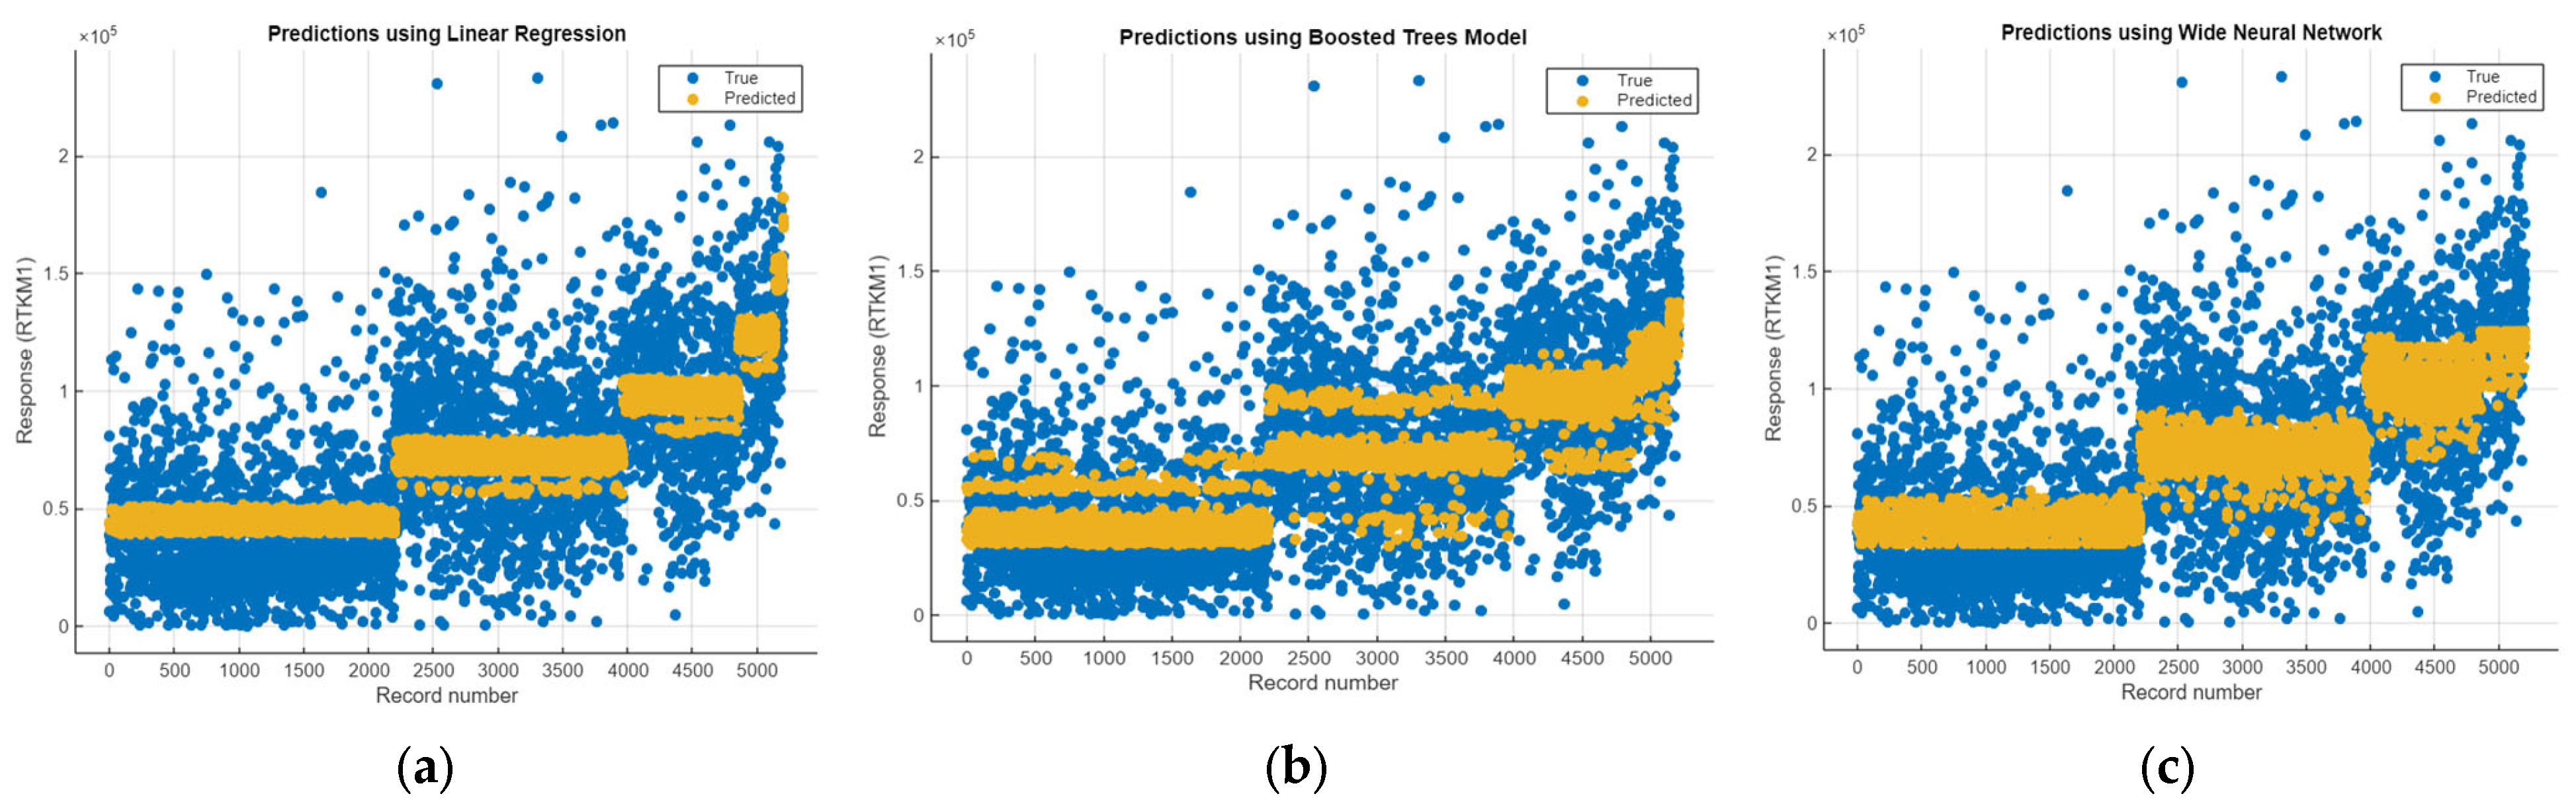
Among these 6 variables, the first 5 are independent variables, while RTKM1 (retreaded kilometers) is the dependent variable for developing the machine learning model. The dataset is divided into three subsets: 70% for training, 15% for validation, and 15% for testing. The cross-validation method was employed to systematically evaluate multiple machine-learning algorithms for prediction. Using MATLAB’s version R2023b Regression Learner App from the Statistics and Machine Learning Toolbox, the dependent and independent variables were inputted, and various regression models were trained and compared. This app facilitates automated model selection by assessing performance metrics such as RMSE, R2, and MAE across multiple models. Based on these evaluations, the most suitable models—linear regression, ensemble (boosted trees), and neural network regression—were chosen. All model training and evaluations were conducted on a system equipped with an Intel Core i7 (11th Gen, 2.80 GHz) processor and 16 GB of RAM, running Windows 10, ensuring computational efficiency during model development.
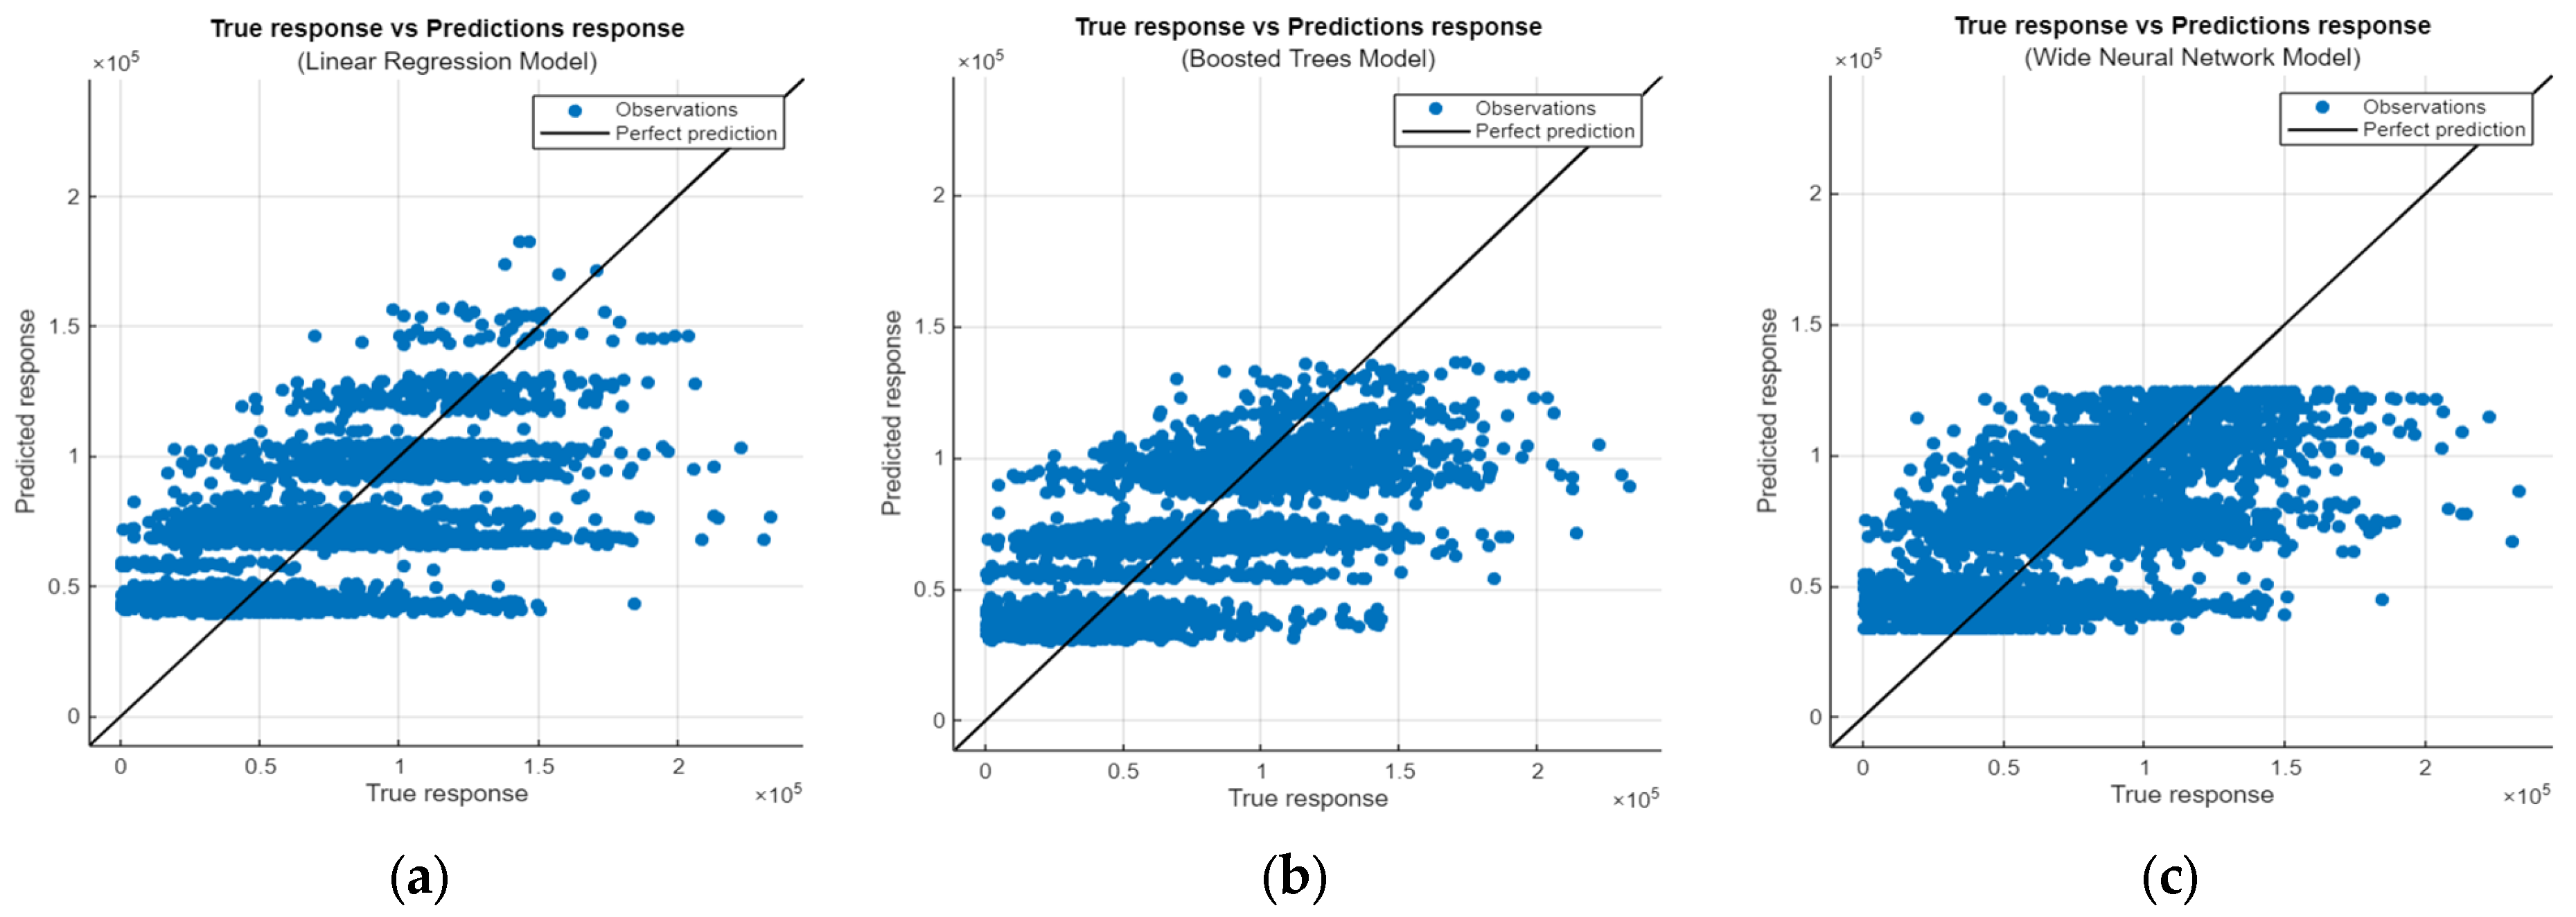
The selection was driven by the interpretability, computational efficiency, and predictive accuracy observed in the dataset. Random Forest (RF), while effective at handling non-linearity, was found to be computationally intensive for large-scale deployment in this context. Support Vector Machines (SVMs) were tested, but they exhibited longer training times and lacked a significant performance improvement over the selected models. Deep Learning (DL) models, despite their ability to capture complex patterns, require extensive data and computational resources, making them less practical for this specific predictive task. Therefore, the chosen models strike a balance between accuracy, interpretability, and computational feasibility, ensuring robust and scalable predictions. To assess the model’s accuracy and compare its outcomes with both the predicted and actual values, the coefficient of determination (R2) was utilized. This metric evaluates the linear model’s goodness of fit and quantifies the model’s explained variation, commonly employed in a regression analysis [28]. The R2 value is calculated from the following equation:
R 2 = 1 S S R e s i d u a l s S S T o t a l
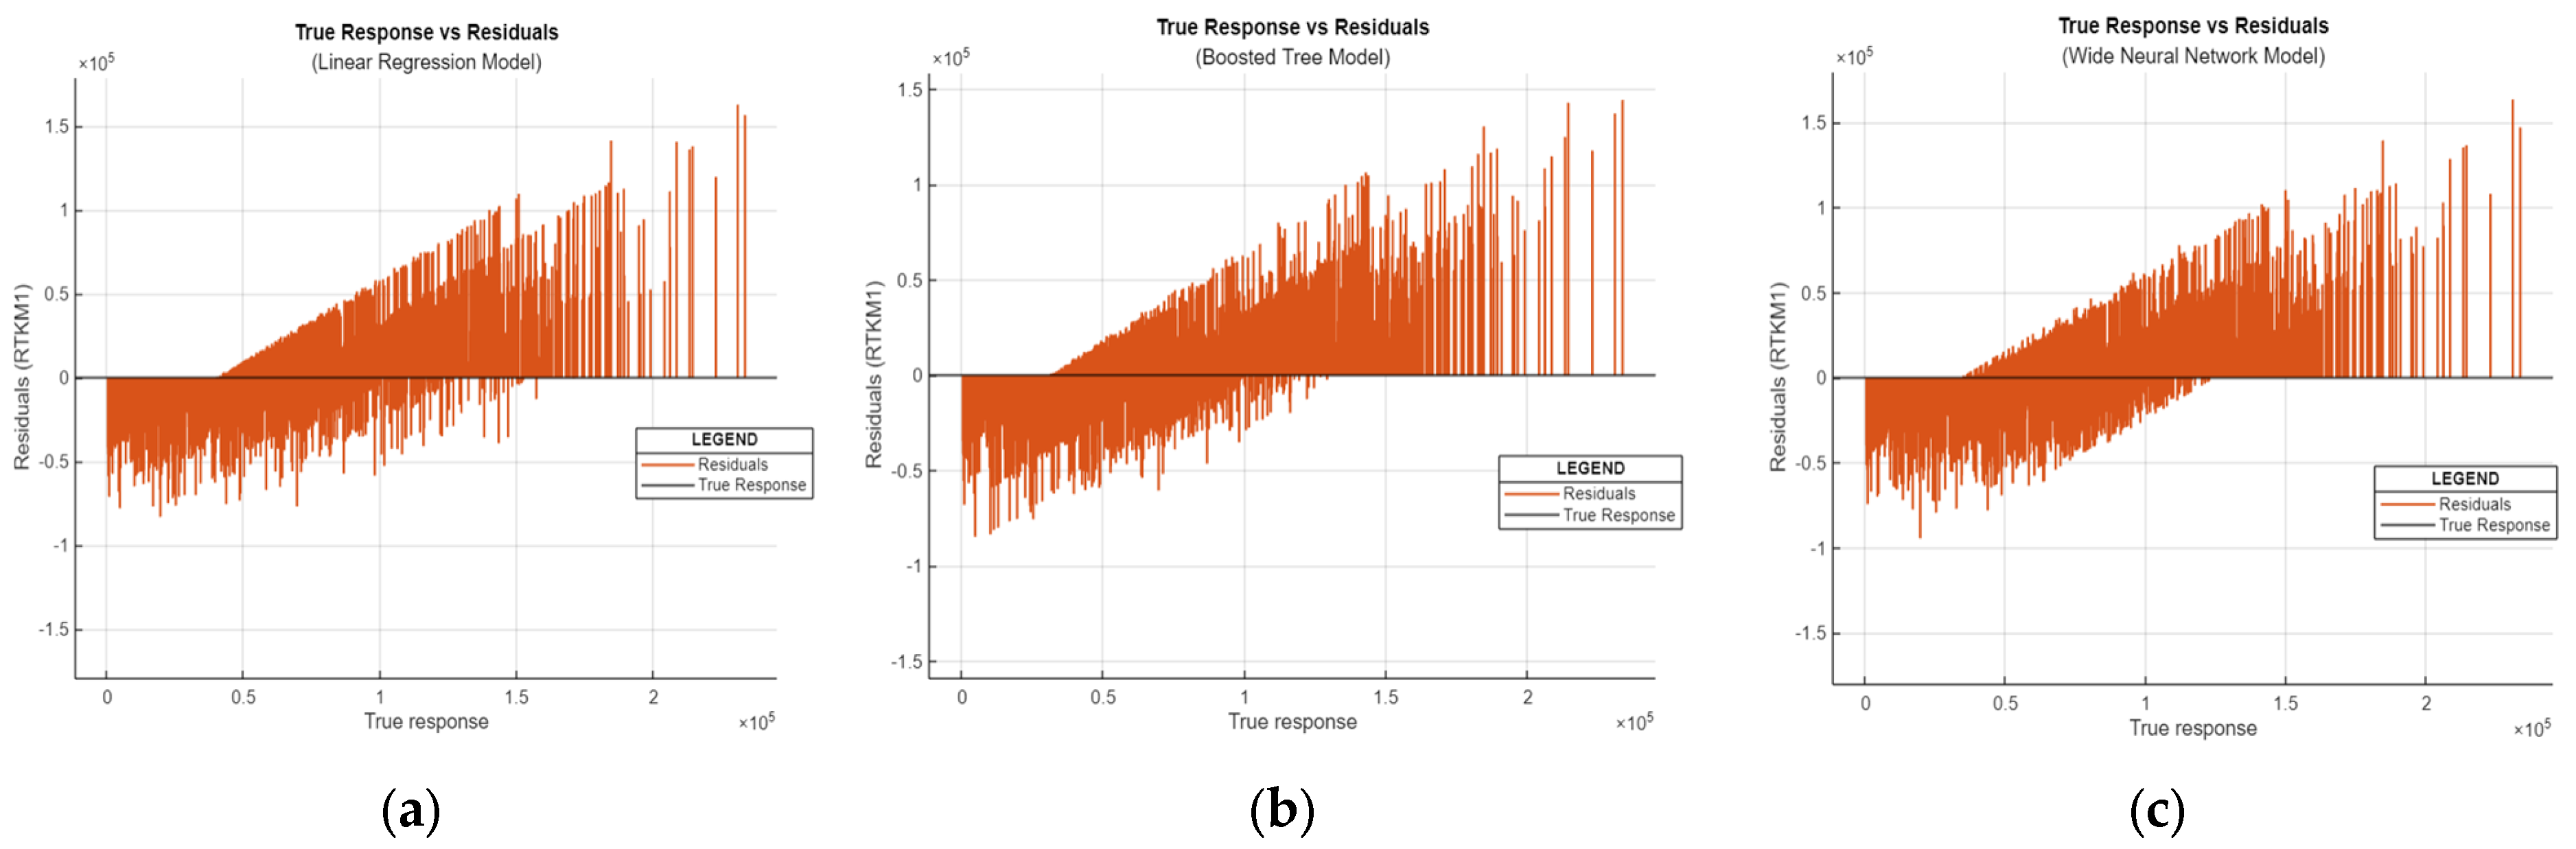
Certainly, R2 is a statistical metric indicating the proportion of variance explained by one or more independent variables in a regression model. Its typical range is from 0 to 1 ( 1 R 2 1 ) , with higher values, suggesting a better fit of the model to the data. A detailed comparison of the performance of the three models utilized in this study is presented hereafter.

5. Results

5.1. Analysis of Response Plots Across Different Machine Learning Models

The dataset comprises 5204 data points collected over several years, divided into training, testing, and validation subsets, adhering to a 70-15-15 split. Specifically, 3642 data points were allocated for training, while 781 were reserved for testing and validation. This partitioning strategy ensures a robust evaluation of the models. Our predictors included the depot, RT condition, RT stage, season, and CR, serving as independent variables, while RTKM1 was designated as the response variable. Utilizing these specifications, three distinct machine learning algorithms were employed to facilitate a comprehensive analysis and comparative investigation. Employing the cross-validation method, the selection of these algorithms aimed to ensure the robustness and reliability of the findings. This analysis was conducted using the regression learner tool in MATLAB, providing a robust platform for a rigorous evaluation and comparison of the models. Linear regression, recognized as one of the most fundamental machine learning algorithms, was employed in this study. Upon training the model, the R-squared value (validation) was determined to be 0.44, indicating the proportion of variance in the dependent variable explained by the independent variables. Subsequently, during testing, the R-squared value (test) was found to be 0.46, affirming the model’s predictive capability for unseen data. Further insights into the regression model’s performance can be seen from the post-training response plots presented in Figure 7a. Notably, the training process for this model was completed in 3.6 s, demonstrating its efficiency in handling the dataset and conducting the requisite computations.
The ensemble regression algorithm utilized in this study employed boosted trees with tailored hyperparameters such as the minimum leaf size, number of learners, and learning rate for optimal performance. The minimum leaf size parameter, set to eight, governs the smallest sample size required for leaf node formation, which is crucial for mitigating overfitting by ensuring ample data representation in each leaf. With several learners set at 30, the algorithm sequentially constructs decision trees during boosting, enabling the iterative refinement of model performance by learning from the predecessor’s errors. Meanwhile, the learning rate parameter, set at 0.1, modulates the impact of each tree on the final predictions, with higher rates bolstering individual tree contributions but potentially increasing overfitting risks. Conversely, lower rates promote smoother convergence and mitigate overfitting. Training the model with these specifications took 4.5 s, yielding an R-squared (validation) value of 0.51 and signifying the model’s explanatory power; the prediction response plot is presented in Figure 7b. Subsequent testing showed a slight enhancement, with the R-squared (test) value reaching 0.52, underscoring the boosted trees ensemble algorithm’s effectiveness in discerning underlying data patterns.
In the neural network model, a single fully connected layer was employed with a specified first layer size of 100. The activation function Sigmoid was utilized, with an iteration limit set to 1000 and regularization strength configured at 0. Following data standardization, the model required 22.2 s to train the datasets. The post-training evaluation revealed an R-squared (validation) value of 0.45, indicating the proportion of variance explained by the model. Similarly, the R-squared (test) value was observed to be 0.44, affirming the model’s performance on unseen data. Figure 7c presents the response plot of the neural network model comparing the predicted response with the actual value, facilitating a visual assessment of the model’s predictive capabilities. Furthermore, Figure 7 illustrates the response plots of all three models for comparative analysis, while Table 8 compares the R-squared values obtained from each model.

5.2. Comparative Analysis of Independent Factors Using Box Plots

A box plot is a powerful visualization tool that provides insights into the data distribution, shedding light on typical values and potential outliers. In this graphical representation, the central mark represents the median, offering a measure of the central tendency. Meanwhile, the edges of the box delineate the interquartile range, with the bottom edge denoting the 25th percentile and the top edge representing the 75th percentile. Vertical lines, called whiskers, extend from the boxes to the most extreme data points that are not considered outliers. Outliers, which are data points that fall outside this range, are individually marked with “o” symbols, providing visibility into any data points that deviate significantly from the norm.
Figure 8 in our study showcases box plots for each predictor variable, including the depot (BRN), retread condition (RTRR), retread stage (RTF), retreading cycle (CR), and season, across different models. Each of these independent variables is plotted against the dependent variable RTKM1, which represents the retreaded kilometers and serves as our response variable. In the box plots, the blue color represents data from the training set, while the orange color represents data from the testing set. Examining these plots provides valuable insights into the relationship between each predictor variable and the response variable. Specifically, the impact of variations in each predictor variable on retreaded kilometers can be discerned, providing crucial information for understanding the factors influencing tire performance.
This comprehensive analysis aims to uncover patterns and trends in the data that can inform decision-making and optimize predictive models. In evaluating outliers across the test data, distinct patterns emerged among the three machine learning models. Notably, in the branch variable (depot), the linear regression model exhibited a higher incidence of outliers than the ensemble boosted trees and neural network models, as shown in Figure 8a. Similarly, for the retread condition (RTRR), Figure 8b illustrates a notable reduction in outliers in the test data for the neural network model relative to the linear regression model. Conversely, in the retread stage (RTF) analysis depicted in Figure 8c, the linear regression model showcased fewer outliers in the test data compared to the boosted trees model.
In contrast, the neural network model maintained consistency with minimal outliers. The ensemble boosted trees model demonstrated superior outlier management for the retreading cycle (CR), as illustrated in Figure 8d, with no outliers observed in the test data. Finally, when considering the season variable, as shown in Figure 8e, the neural network model exhibited superior outlier control relative to the linear regression and boosted trees models. These nuanced insights highlight the differential performance of each model in outlier detection across various predictor variables, underscoring the importance of selecting an appropriate machine learning approach tailored to the specific characteristics of the dataset. The data distribution across various models allows the identification of common trends and distinctive factors linked to each predictor variable through a visual inspection. This holistic approach to data analysis enhances our understanding of the complex relationships within the dataset and enables us to make informed decisions based on comprehensive insights.

5.3. Model Evaluation: Predicted vs. Actual Responses and Residual Plot Evaluation

The predicted vs. actual plot is a pivotal tool for assessing the performance of machine learning models. This visual representation gives insights into the regression model’s efficacy in predicting diverse response values. Each model’s predicted response is plotted against the actual, accurate response across the dataset, as depicted in Figure 9. In an ideal scenario, a perfect regression model would yield predicted responses perfectly aligned with the proper responses, resulting in all data points falling precisely along a diagonal line. Deviation from this ideal line signifies the prediction error for each data point, with more minor errors indicating superior model performance in real-life datasets.
In our case, the linear regression model (Figure 9a) demonstrated proficiency in predicting higher response values compared to other models, but at the same time, there were more overall outliers. Conversely, the boosted trees ensemble model (Figure 9b) exhibited fewer outliers, suggesting enhanced robustness. However, the neural network model (Figure 9c) displayed observations capped above a specific limit. Typically, a well-performing model exhibits data points symmetrically scattered around the diagonal line, indicating balanced predictive accuracy. While analyzing the plot, discernible patterns emerged, hinting at potential avenues for model enhancement and thereby delineating the future research scope of this study.
The residual plot is a crucial tool for assessing the model’s performance. It illustrates the disparity between the predicted and actual responses, providing valuable insights into the model’s accuracy. Ideally, a well-performing model would exhibit symmetrically scattered residuals around zero, indicating minimal bias in the predictions. By examining the residual plot, depicted in Figure 10, the model’s effectiveness in capturing inherent data patterns and detecting potential systematic errors or trends requiring further exploration can be assessed.

6. Discussion

6.1. Enhancing Mileage Extraction from Radial Tires: Insights and Challenges

Retreading enables the extraction of higher mileage from tire carcasses, reducing the need for new tires and promoting sustainable development and operational efficiency. While in the USA, tires can yield an average of around 960,000 km [9], Indian fleet operators, such as TNSTC, struggle to surpass 225,000 km. This paper proposed methods to enhance mileage extraction from radial tires, as illustrated through a case study of TNSTC in the Viluppuram region. Over six years, an analysis of condemned tires reveals consistent condemnation patterns across various retread stages. Most tires (98%) are condemned by the fourth retread stage. In 2018–2019, the average yield of the 3027 condemned tires was 259,113 km per tire, with a maximum of 395,902 km from a fourth retread tire. The cost of retreading remains constant regardless of the number of retreads. Of the 2995 tires retreaded, only 150, including 77 retread failures, failed to surpass 200,000 km. While 95% of retreaded tires exceeded 200,000 km, the impact of higher retread stages on overall mileage was minimal. Although eight tires reached the sixth retread stage, four experienced retread failures, suggesting diminishing returns beyond the fourth retread. Retread failures were highest in the third retread stage. Furthermore, the existing retreading plant lacked the ability to predict these failures beforehand. In response, this paper proposes developing both a mathematical model and a machine learning model framework to address this critical issue.

6.2. Yield of km in Various Stages of Tire Life

The sixth RT yielded an average of only 2000 additional km compared to the fifth RT. The first RT contribution range is 29,000 (in a V RT tire) to 49,000 km (in an II RT tire). Generally, approximately 50% of the total yield is from the original casing. The next higher contribution is from the first RT. After that, it reduces from 12% to 10% from the fourth RT stage onwards. A yield of 11% to 14% of km is obtained from the third to sixth RT stages. From the third RT stage onwards, the last RT kilometer yield is 11% and less. A total of 339 tires yielded less than 104 km in the study population. Apart from that, 77 RT failed tires had zero yields. A description of the two scenarios developed is briefly described below.
Scenario I: The 32 tires condemned without retreading are assumed to get retreaded once and obtain the population’s average mileage. The 339 retreaded tires that had yielded less than 104 km in different stages of retread are assumed to obtain their respective retread stage mileage. The 77 retread failure tires obtained the average retread kms of the stage in which they failed. The net benefit is an additional 5819 km/tire and a saving of 66 tires.
Scenario II: The 32 failed new tires are assumed to achieve first RT average mileage. Tires in the first three retread stages get retreaded once more to obtain the average life of the stage to which they are taken. No changes are assumed for the fifth and sixth retread stages. Regarding RT failed tires, the assumptions are the same as Scenario I. A total of 169 tires will be saved due to the gain of 15,356 km/tire.

6.3. Limitations and Future Scope

This study presents a data-driven approach to optimizing tire retreadability through predictive modeling, yet it is essential to recognize its inherent limitations and areas for further enhancement. One of the key challenges lies in the moderate predictive power of the developed models. While the ensemble boosted trees model achieved the highest R2 value of 0.52 on test data, this level of performance, though not exceptionally high, reflects the complex and noisy nature of real-world retreading operations. Retread performance is influenced by a wide range of qualitative and operational factors—such as technician skill, depot practices, and inconsistencies in inspection—that are difficult to encode as model features. Moreover, the absence of advanced sensor data (e.g., tire pressure or temperature logs), combined with the manual and subjective elements involved in RT decision-making, impose further constraints on model accuracy.
Despite these limitations, an R2 of 0.52 indicates that more than half the variance in retread performance is explained by the modelled features, offering a considerable improvement over intuition-based or purely manual processes. In practical fleet operations, where decisions are often based on limited or inconsistent data, this level of model performance can still serve as a valuable decision-support tool, providing structured insights for tire condemnation, retread planning, and inventory control.
Future work could enhance model robustness by incorporating sensor-based telematics, tire wear monitoring systems, and image-based inspection data from automated scanning tools. Additionally, a lifecycle analysis and sensitivity testing—currently beyond the scope of this study—could quantify the broader cost and environmental benefits more rigorously. Integrating such high-resolution data streams may significantly increase model accuracy beyond the current threshold and contribute to developing a more holistic, intelligent retreading ecosystem.

6.4. Practical Application of Predictive Models for Tyre Retreading and Fleet Optimization

The proposed approach has significant real-world applications in production systems, particularly in tire retreading and fleet management. The predictive models developed in this study can be seamlessly integrated into fleet operators’ workflows through digital monitoring systems, real-time analytics, and automated decision-making tools. By leveraging IoT-enabled tire pressure monitoring systems (TPMSs) and onboard telematics, fleet operators can continuously collect real-time tire performance data, feeding them into the predictive model to assess wear patterns and estimate optimal retread timing. Automated alerts can notify maintenance teams when a tire is approaching its optimal retreading threshold, preventing unnecessary downtime and ensuring timely intervention. Additionally, interactive decision dashboards can provide fleet managers with data-driven insights, visualizing tire performance trends, cost savings, and retread effectiveness across the fleet. The model optimizes the entire tire lifecycle, from procurement to final retirement, by predicting the most cost-effective retread strategy, reducing the need for new tires while maximizing the return on investment. Scalable across various fleet types, from public bus transport to long-haul trucking, this predictive framework enables data-driven resource optimization, enhances operational efficiency, and supports sustainable tire management practices.
Based on findings reported in the existing literature [19,29], predictive modeling approaches in tire lifecycle management have demonstrated the potential to reduce tire procurement costs by approximately 15–20%, contingent on fleet size and operating conditions. Studies also suggest that an enhanced tire lifespan and reduced retread waste could contribute to a reduction of up to 25% in carbon emissions per fleet, thereby supporting sustainability objectives and improving environmental performance. Furthermore, operational efficiency improvements ranging from 10 to 15% have been observed due to better scheduling of tire maintenance, timely retreading interventions, and optimized resource allocation. These literature-backed estimates provide a valuable foundation for managers aiming to adopt data-driven, cost-effective, and environmentally responsible strategies in fleet management.
After implementing the predictive model, fleets can expect up to a 20–30% improvement in the total mileage extracted from each tire, reducing the frequency of tire replacements. The number of premature tire condemnations can be reduced by 10–15% through the more accurate prediction of tire lifespan, leading to fewer tires being discarded unnecessarily. In terms of overall cost savings, it is estimated that fleets could reduce total tire-related costs by 15–25% annually due to better decision-making and optimized retread strategies [30,31].

7. Conclusions

This comprehensive investigation has revealed promising avenues for optimizing tire longevity and operational efficiency within the fleet management domain. By strategically mitigating new tire condemnations and retread failures, our study demonstrates the potential to substantially increase the average kilometer yield per tire. Notably, the observed drop in kilometer yield with successive retreads underscores the importance of establishing a prudent cutoff point, such as the fourth retread, to balance tire performance and minimize retread failures. Leveraging scientific methodologies, including advanced machine learning algorithms such as linear regression, ensemble boosted trees, and neural network models, has enabled the prediction of retread failures, thus enhancing tire performance optimization efforts.
Our findings, which were validated through cross-validated machine learning models, highlight both the potential and limitations of predictive techniques in tire retreading decision-making.
  • The coefficients of determination (R2) for the validated datasets were 0.44, 0.51, and 0.45 for linear regression, ensemble boosted trees, and neural networks, respectively, while for the test datasets, the values were 0.46, 0.52, and 0.44.
  • Further analyses, including response plots and box plots of independent variables against the dependent variable, were conducted to understand how various factors influence the predictions.
  • Additionally, the residual analysis helped assess model performance, revealing that ensemble boosted trees performed best, with R2 values of 0.51 for the training set and 0.52 for the test set, outperforming other models.
While these R2 values indicate room for improvement, this study demonstrates the feasibility of integrating machine learning into tire retreading decisions. Despite the current limitations, this approach provides a structured framework that reduces the reliance on human judgment and paves the way for further advancements to enhance industry-wide applicability and practicality.
Furthermore, creating two distinct scenarios has illuminated the potential additional kilometer yield per tire and the resultant cost savings in new tire procurement.
  • Scenario I suggests a minimum saving of 66 tires;
  • Scenario II presents the opportunity for even more significant savings, up to a maximum of 169 tires.
The findings of this research emphasize the significant advantages of adopting a systematic approach to tire management, demonstrating the potential for notable improvements in operational efficiency and sustainability within fleet operations. By integrating predictive models and optimized tire management strategies, decision-makers can achieve up to 20–30% improvements in tire mileage, reduce premature condemnations by 10–15%, and cut costs by 15–25%. Furthermore, the environmental impact can be reduced by up to 25%, highlighting the benefits of implementing these strategies. This study provides robust evidence that, through continued research and application, the tire retreading industry and fleet management can realize substantial cost savings, operational gains, and environmental benefits, contributing to a more sustainable future in sustainability.

Author Contributions

A.N.J. contributed to the literature collection, problem identification, data collection and analysis, model development, and manuscript preparation. N.N. was involved in problem identification, data collection, manuscript preparation. M.R. contributed to problem identification, data collection, data analysis, and the interpretation of the results. P.P. contributed to data collection, analysis, model development, and manuscript preparation. All authors have read and agreed to the published version of the manuscript.

Funding

This research received no external funding.

Institutional Review Board Statement

Not Applicable.

Informed Consent Statement

Not Applicable.

Data Availability Statement

The data supporting this study’s findings are available upon request from the corresponding author (A.N.J.). However, the data are not publicly available due to regulation by the government of Tamil Nadu State Transport Corporation of the study area.

Conflicts of Interest

The authors declare no conflict of interest.

References

  1. Roberts, F. We’ve Come a Long Way: The History of Retread Tires; Tire Recappers: Nashville, TN, USA, 2016. [Google Scholar]
  2. Singh, S. Indian Tyre Retreading Association Established. Retreading Business. 2017. Available online: https://www.retreadingbusiness.com/indian-tyre-retreading-association-established/ (accessed on 20 March 2025).
  3. Mayer, P.M.; Moran, K.D.; Miller, E.L.; Brander, S.M.; Harper, S.; Garcia-Jaramillo, M.; Carrasco-Navarro, V.; Ho, K.T.; Burgess, R.M.; Thornton Hampton, L.M.; et al. Where the Rubber Meets the Road: Emerging Environmental Impacts of Tire Wear Particles and Their Chemical Cocktails. Sci. Total Environ. 2024, 927, 171153. [Google Scholar] [CrossRef] [PubMed]
  4. Rødland, E.S.; Heier, L.S.; Lind, O.C.; Meland, S. High Levels of Tire Wear Particles in Soils along Low Traffic Roads. Sci. Total Environ. 2023, 903, 166470. [Google Scholar] [CrossRef] [PubMed]
  5. Gaidhane, J.; Karadbhajane, A.; Khalatkar, A.; Ullah, I. An Application of Quality Tools to Improve the Tyre Remanufacturing Process. IOP Conf. Ser. Mater. Sci. Eng. 2022, 1259, 012033. [Google Scholar] [CrossRef]
  6. Divyesh, M.; Sachin, S.G.; Amit, A.S.; Vipul, V.P. A Case Study on Tyre Retreading Of S.T. Workshop. IJSRD—Int. J. Sci. Res. Dev. 2015, 3, 131–134. [Google Scholar]
  7. Malik, J.; Karpate, Y.; Datta, A.; Sharma, S.; Sharpe, B. Tire Technologies and Their Impact on Heavy-Duty Vehicle Fuel Efficiency in India; Shakti: Coulsdon, UK, 2016. [Google Scholar]
  8. Kamal, T. Latest Innovations in Retread Tyres; Work Truck: Northbrook, IL, USA, 2017. [Google Scholar]
  9. Lutsey, N.P.; Regnier, J.; Burke, A.; Melaina, M.W.; Bremson, J.; Keteltas, M. Assessment of Tire Technologies and Practices for Potential Waste and Energy Use Reductions; Institute of Transportation Studies: Davis, CA, USA, 2006. [Google Scholar]
  10. Work Truck. How to Select the Best Retread Truck Tire; Work Truck: Northbrook, IL, USA, 2018. [Google Scholar]
  11. Balderstone, P.; Livadeas, A.; Wilson-Law, A. Tyre Ageing—Its Effect on Material Properties and Structural Integrity; Department for Transport (DfT): London, UK, 2019. [Google Scholar]
  12. Dabić-Miletić, S. Decision Tree As a Tool for Decision Making in Retreading Tire Technology. In Quantitative Methods in Logistics; Univerzitet u Beogradu: Belgrade, Serbia, 2020; pp. 87–104. [Google Scholar]
  13. Bharat, V.; Dipak, G. A Literature Review on Life Cycle Analysis of Tyre Retreading. IJSRD—Int. J. Sci. Res. Dev. 2014, 2, 46–50. [Google Scholar]
  14. Valentini, F.; Pegoretti, A. End-of-Life Options of Tyres. A Review. Adv. Ind. Eng. Polym. Res. 2022, 5, 203–213. [Google Scholar] [CrossRef]
  15. Sharma, A. Retreading of Tyres. Int. J. Eng. Adv. Technol. 2013, 2, 2249–8958. [Google Scholar]
  16. Ferrer, G. The Economics of Tire Remanufacturing. Resour. Conserv. Recycl. 1997, 19, 221–255. [Google Scholar] [CrossRef]
  17. Banerjee, B. Manufacturing Technology for Tyre Retreading. In Tyre Retreading; De Gruyter Brill: Berlin, Germany, 2019; pp. 47–74. [Google Scholar] [CrossRef]
  18. Mondal, S.; Mukherjee, K. Simulation of Tyre Retreading Process—An Indian Case Study. Int. J. Logist. Syst. Manag. 2012, 13, 525–539. [Google Scholar] [CrossRef]
  19. Kumar, D.; Pei, Y.; Han, B.; Khoo, S.Y.; Norton, M.; Adams, S.D.; Kouzani, A.Z. Comparative Analysis of Waste Tyre Treatment Technologies: Environmental and Economic Perspectives. Renew. Sustain. Energy Rev. 2025, 216, 115691. [Google Scholar] [CrossRef]
  20. Narra, M.M.; Gbiete, D.; Agboka, K.; Narra, S.; Nelles, M. Tracing the EoL Tyre Management Chain in Togo with Focus on Implementing a Tyre Recycling Plant. Sustainability 2024, 16, 9193. [Google Scholar] [CrossRef]
  21. Wurster, S. Creating a Circular Economy in the Automotive Industry: The Contribution of Combining Crowdsourcing and Delphi Research. Sustainability 2021, 13, 6762. [Google Scholar] [CrossRef]
  22. Farooq, M.A.; Nimbalkar, S.; Fatahi, B. Sustainable Applications of Tyre-Derived Aggregates for Railway Transportation Infrastructure. Sustainability 2022, 14, 11715. [Google Scholar] [CrossRef]
  23. Lin, K.; Wei, S. Advancing the Industrial Circular Economy: The Integrative Role of Machine Learning in Resource Optimization. J. Green Econ. Low-Carbon Dev. 2023, 2, 122–136. [Google Scholar] [CrossRef]
  24. Gudsoorkar, U.; Bindu, R. Computer Simulation of Hyper Elastic Re-Treaded Tire Rubber with ABAQUS. Mater. Today Proc. 2020, 43, 1992–2001. [Google Scholar] [CrossRef]
  25. Gudsoorkar, U.; Bindu, R. Fatigue Crack Growth Characterization of Re-Treaded Tire Rubber. Mater. Today Proc. 2020, 43, 2303–2310. [Google Scholar] [CrossRef]
  26. Karkaria, V.; Chen, J.; Siuta, C.; Lim, D.; Radulescu, R.; Chen, W. A Machine Learning–Based Tire Life Prediction Framework for Increasing Life of Commercial Vehicle Tires. J. Mech. Des. 2024, 146, 020902. [Google Scholar] [CrossRef]
  27. Sharma, N.; Kalra, M. Predictive Maintenance for Commercial Vehicles Tyres Using Machine Learning. In Proceedings of the 2022 13th International Conference on Computing Communication and Networking Technologies (ICCCNT), Kharagpur, India, 3–5 October 2022. [Google Scholar] [CrossRef]
  28. Momin, M.M.; Lee, S.; Wray, N.R.; Lee, S.H. Significance Tests for R2 of Out-of-Sample Prediction Using Polygenic Scores. Am. J. Hum. Genet. 2023, 110, 349–358. [Google Scholar] [CrossRef]
  29. Maga, D.; Aryan, V.; Blömer, J. A Comparative Life Cycle Assessment of Tyre Recycling Using Pyrolysis Compared to Conventional End-of-Life Pathways. Resour. Conserv. Recycl. 2023, 199, 107255. [Google Scholar] [CrossRef]
  30. Van Beukering, P.J.H.; Janssen, M.A. A Dynamic Integrated Analysis of Truck Tires in Western Europe. J. Ind. Ecology. 2000, 4, 93–115. [Google Scholar] [CrossRef]
  31. Li, X.; Xu, H.; Gao, Y.; Tao, Y. Comparison of End-of-Life Tire Treatment Technologies: A Chinese Case Study. Waste Manag. 2010, 30, 2235–2246. [Google Scholar] [CrossRef] [PubMed]
Figure 1. Comprehensive framework of the proposed research.
Sustainability 17 05480 g001
Figure 2. Study area map for the TNSTC of Viluppuram (India).
Sustainability 17 05480 g002
Figure 3. Population distribution of condemned radial tires at various stages.
Sustainability 17 05480 g003
Figure 4. Contribution of the total tire life in km in various RT stages of the tire life.
Sustainability 17 05480 g004
Figure 5. Percentage share of the km yield at various stages of the tire life.
Sustainability 17 05480 g005
Figure 6. Average life derived in various stages of condemnation.
Sustainability 17 05480 g006
Figure 7. Response plots of the different ML models. (a) Linear regression. (b) Boosted trees ensemble model. (c) Wide neural network.
Sustainability 17 05480 g007
Figure 8. Box plots of the response values for predictors. (a) Box plots of the response values for BRN in different models. (b) Box plots of the response values for RTRR in different models. (c) Box plots of the response values for RTF in different models. (d) Box plots of the response values for CR in different models. (e) Box plots of the response values for season in different models.
Sustainability 17 05480 g008
Figure 9. True response versus predicted response of different ML models. (a) Linear regression. (b) Boosted trees ensemble model. (c) Wide neural network.
Sustainability 17 05480 g009
Figure 10. Residual plots of different ML models. (a) Linear regression. (b) Boosted trees ensemble model. (c) Wide neural network.
Sustainability 17 05480 g010
Table 1. Continuous improvement in tire life of the TNSTU.
S. No.Financial YearTire Life (lakh km)Percentage Improvement (over the Base Year 2011–2012)
12011–20121.65Not applicable
22012–20131.809.1
32013–20141.8210.3
42014–20151.9216.36
52015–20162.0121.82
62016–20172.0826.1
72017–20182.2234.55
Table 2. Comparison of the costs between bias and radial tires.
Type of TyreOverall Cost in Paisa/Km
2016–20172017–20182018–2019
Bias13.1210.9011.66
Radial10.227.378.28
Overall10.967.948.84
Table 3. Six-year population distribution of the number of radial tires condemned at various stages.
S. No.YearNew1st RT2nd RT3rd RT4th RT5th RT6th RT7th RTTotal
12013–201469704850459172451372319
22014–201552722100556116028802536
32015–201682778116065118339402897
42016–2017546231066691214421102701
52017–2018465991080795300491202881
62018–201932476125991129549603027
Table 4. Matrix of Average tyre km (in lakhs, rounded to the nearest 103) at various stages of condemnation.
S. No.No. of TiresStage of the TireOriginalI RTII RTIII RTIV RTV RTVI RTAverage Km
132Original0.84 0.84
24761st RT1.820.47 2.3
312592nd RT1.690.490.42 2.6
49113rd RT1.570.40.450.31 2.73
52954th RT1.50.330.370.40.23 2.83
6455th RT1.470.290.340.330.310.16 2.9
786th RT1.390.360.300.360.190.230.102.92
Table 5. Matrix of the percentage share at various RT stages in the life of a tire (km are in lakhs, rounded to the nearest 103).
S. No.No. of TiresStage of Tire% Original%I RT%II RT%III RT%IV RT%V and More RTAverage Km
132Original100 0.84
24761st RT7920 2.3
312592nd RT651916 2.6
49113rd RT58151611 2.73
52954th RT531213148 2.83
6455th RT511012111162.9
786th RT481210127112.92
Table 6. Number of tires that failed at less than 10,000 km yield, excluding RT failures.
S. No.Stage of RT1st RT2nd RT3rd RT4th RT5th RT6th RTTotal
11st RT14 14
22nd RT1692 108
33rd RT11790 108
44th RT910861 88
55th RT202112 17
66th RT0002114
Overall5210910064131339
Table 7. Predictors for the machine learning model.
NotationIndependent Variable (Predictors)
Depot (BRN)RT Condition (RTRR)RT Stage (RTF)SeasonCR (Tire Condition)
1CSMWO1WinterKO1
2GNGWR2SpringKO2
3KBD 3SummerKO
4KK1 4MonsoonKO4
5KK2 5AutumnKO5
6KMK 6 KO6
7PDY KO7
8SKM CO8
9TDM CO9
10TKL Nil
11ULP
12VP1
13VP2
14VP3
Table 8. Comparison of different ML models.
ML ModelTraining Time (Seconds)R2 (Validation)R2 (Test)
Linear Regression3.56510.440.46
Ensemble Boosted Trees4.50830.510.52
Neural Network22.2010.450.44
Disclaimer/Publisher’s Note: The statements, opinions and data contained in all publications are solely those of the individual author(s) and contributor(s) and not of MDPI and/or the editor(s). MDPI and/or the editor(s) disclaim responsibility for any injury to people or property resulting from any ideas, methods, instructions or products referred to in the content.

