Article

Numerical Simulation of Wind and Sand Resistance in Three Typical Shrubs

1
School of Soil and Water Conservation, Beijing Forestry University, Beijing 100083, China
2
Xinjiang Institute of Ecology and Geography, Chinese Academy of Sciences, Urumqi 830011, China
3
Xinjiang Uygur Autonomous Region Soil and Water Conservation Monitoring Center (Xinjiang Uygur Autonomous Region Soil and Water Conservation Experiment Station), Urumqi 830013, China
*
Author to whom correspondence should be addressed.
Sustainability 2025, 17(12), 5481; https://doi.org/10.3390/su17125481
Submission received: 17 April 2025 / Revised: 12 June 2025 / Accepted: 13 June 2025 / Published: 13 June 2025
(This article belongs to the Section Sustainable Urban and Rural Development)

Abstract

The sand-laden airflow fields surrounding Artemisia desertorum Spreng., Reaumuria soongorica, and Hedysarum scoparium were investigated. The study focuses on a configuration of double rows with staggered shrub distribution. Computational Fluid Dynamics (CFD) simulations were employed to model the airflow. The resulting flow field was categorized into five distinct regions. The shelter distances downwind of the shrubs were observed to be 7 H, 6 H, and 6 H for A. desertorum, R. soongorica, and H. scoparium, respectively. The corresponding shelter widths were measured as 3 m, 3 m, and 8 m, respectively. The three kinds of shrubs all formed vortices behind the shrubs. Three shrub species demonstrated distinct wind shelter efficiency ranges: A. desertorum (0.5–4 H), R. soongorica (0.5–3 H), and H. scoparium (0.5–2 H). Optimal shelter effects were observed in different vertical layers: R. soongorica in the low (0–0.2 m), A. desertorum in the medium (0.2–0.7 m), and H. scoparium in the high (0.7–2.2 m) altitude layers. Overall, H. scoparium exhibited the highest sand resistance, followed by A. desertorum Spreng, with R. soongorica demonstrating the least resistance. This study offers theoretical insights for mitigating aeolian environmental degradation, particularly in safeguarding energy and transportation infrastructure in desert regions and promoting sustainable agricultural practices in arid areas.

1. Introduction

Deserts in China cover a total area of 1.308 million square kilometers, representing approximately 13.6% of the nation’s total land surface. Severe wind and sand disasters can cause significant disruptions, including damage to energy and transportation infrastructure, as well as loss of biodiversity. The establishment of shelterbelt systems has been extensively implemented across China [1,2]. Windbreak forest belts function as essential ecological security barriers for both urban and rural regions, effectively mitigating the impact of sandstorms on air quality, safeguarding farmland against wind erosion, and supporting the stability of agricultural productivity [3]. Vegetation restoration has been widely adopted as a cost-effective and sustainable strategy for combating desertification and mitigating climate change [4,5].
Two-dimensional (2D) models are widely utilized in wind erosion control research. Early studies primarily evaluated the effectiveness of sand fences with varying porosities in mitigating wind-driven sand transport. San, B., Wang, Y., and Qiu, Y. employed three turbulence closure models (RNG k-ε, SST k-ω, and RSM) to investigate the flow characteristics around two-dimensional isolated porous fences. The results indicated that a porosity of 10.2% provided the optimal sheltering effect in the near-wake region [6]. Wu, Y., Jin, A., and Jiang, J. carried out numerical simulations to assess the wind protection performance and airflow characteristics of a novel sand fence design, incorporating different slant insertion angles and spacings. The results indicated that a slant insertion angle of 15° offers the most effective wind shielding. Furthermore, for double-row configurations, a spacing of 25 times the fence height (25 H) yielded the highest protective efficiency [7]. The mechanisms by which vegetation and sand fences mitigate wind and sand movement are notably similar, primarily functioning through the alteration of airflow patterns and facilitation of sand deposition [8,9]. This modeling approach has subsequently been extended to investigate the role of vegetation in wind erosion control. Liu, Y. et al. investigated the windbreak and sand-fixation performance of Reaumuria soongorica across different growth seasons. Their results showed that during the non-growing season, R. soongorica induced a broader range of sand deposition compared to the growing season, indicating higher sand-trapping efficiency during dormancy [10]. Yan, Q. et al. [11] performed numerical simulations of various shrub morphologies, including Haloxylon ammodendron, to examine their influence on wind-sand flow dynamics. The study found that pot-shaped shrubs were the most effective in wind suppression, whereas broom-shaped shrubs exhibited the least efficacy. Pot-shaped shrubs achieved the greatest near-ground wind speed reduction, enhancing their suitability for windbreak applications [11]. Liu, J. et al. [12] simulated wind-sand flow fields around senescent Alhagi sparsifolia shrubs. Their study characterized the spatial distribution of wind and sand flow surrounding these shrubs [12].
In previous shrub studies, simulations typically focused on airflow around individual plants. The present study expands the number of simulated units to establish a model of a shrub-based windbreak forest. While earlier simulations primarily focused on vertical airflow patterns, this study incorporates horizontal airflow components, thereby enriching the analysis. Three representative desert shrubs—Artemisia desertorum, Reaumuria soongorica, and Hedysarum scoparium—were selected as study subjects. Airflow fields, wind velocity profiles, and sand volume fractions around these three shrub species were analyzed. Differences in wind-sheltering and sand resistance capacities among the shrub types were examined under low coverage conditions. The simulation results were validated through wind tunnel experiments. Shrubs with higher wind and sand control efficiencies were identified and verified. Simulating wind-blown sand dynamics contributes to mitigating sandstorm-induced damage to energy infrastructure (e.g., wind and photovoltaic systems) and transportation networks (e.g., high-speed railways and highways), thereby reducing agricultural losses and improving the safety of human settlements [13]. This study provides theoretical support for combating aeolian environmental degradation, with particular emphasis on protecting energy and transportation infrastructure in desert regions and promoting sustainable agriculture in arid zones.

2. Materials and Methods

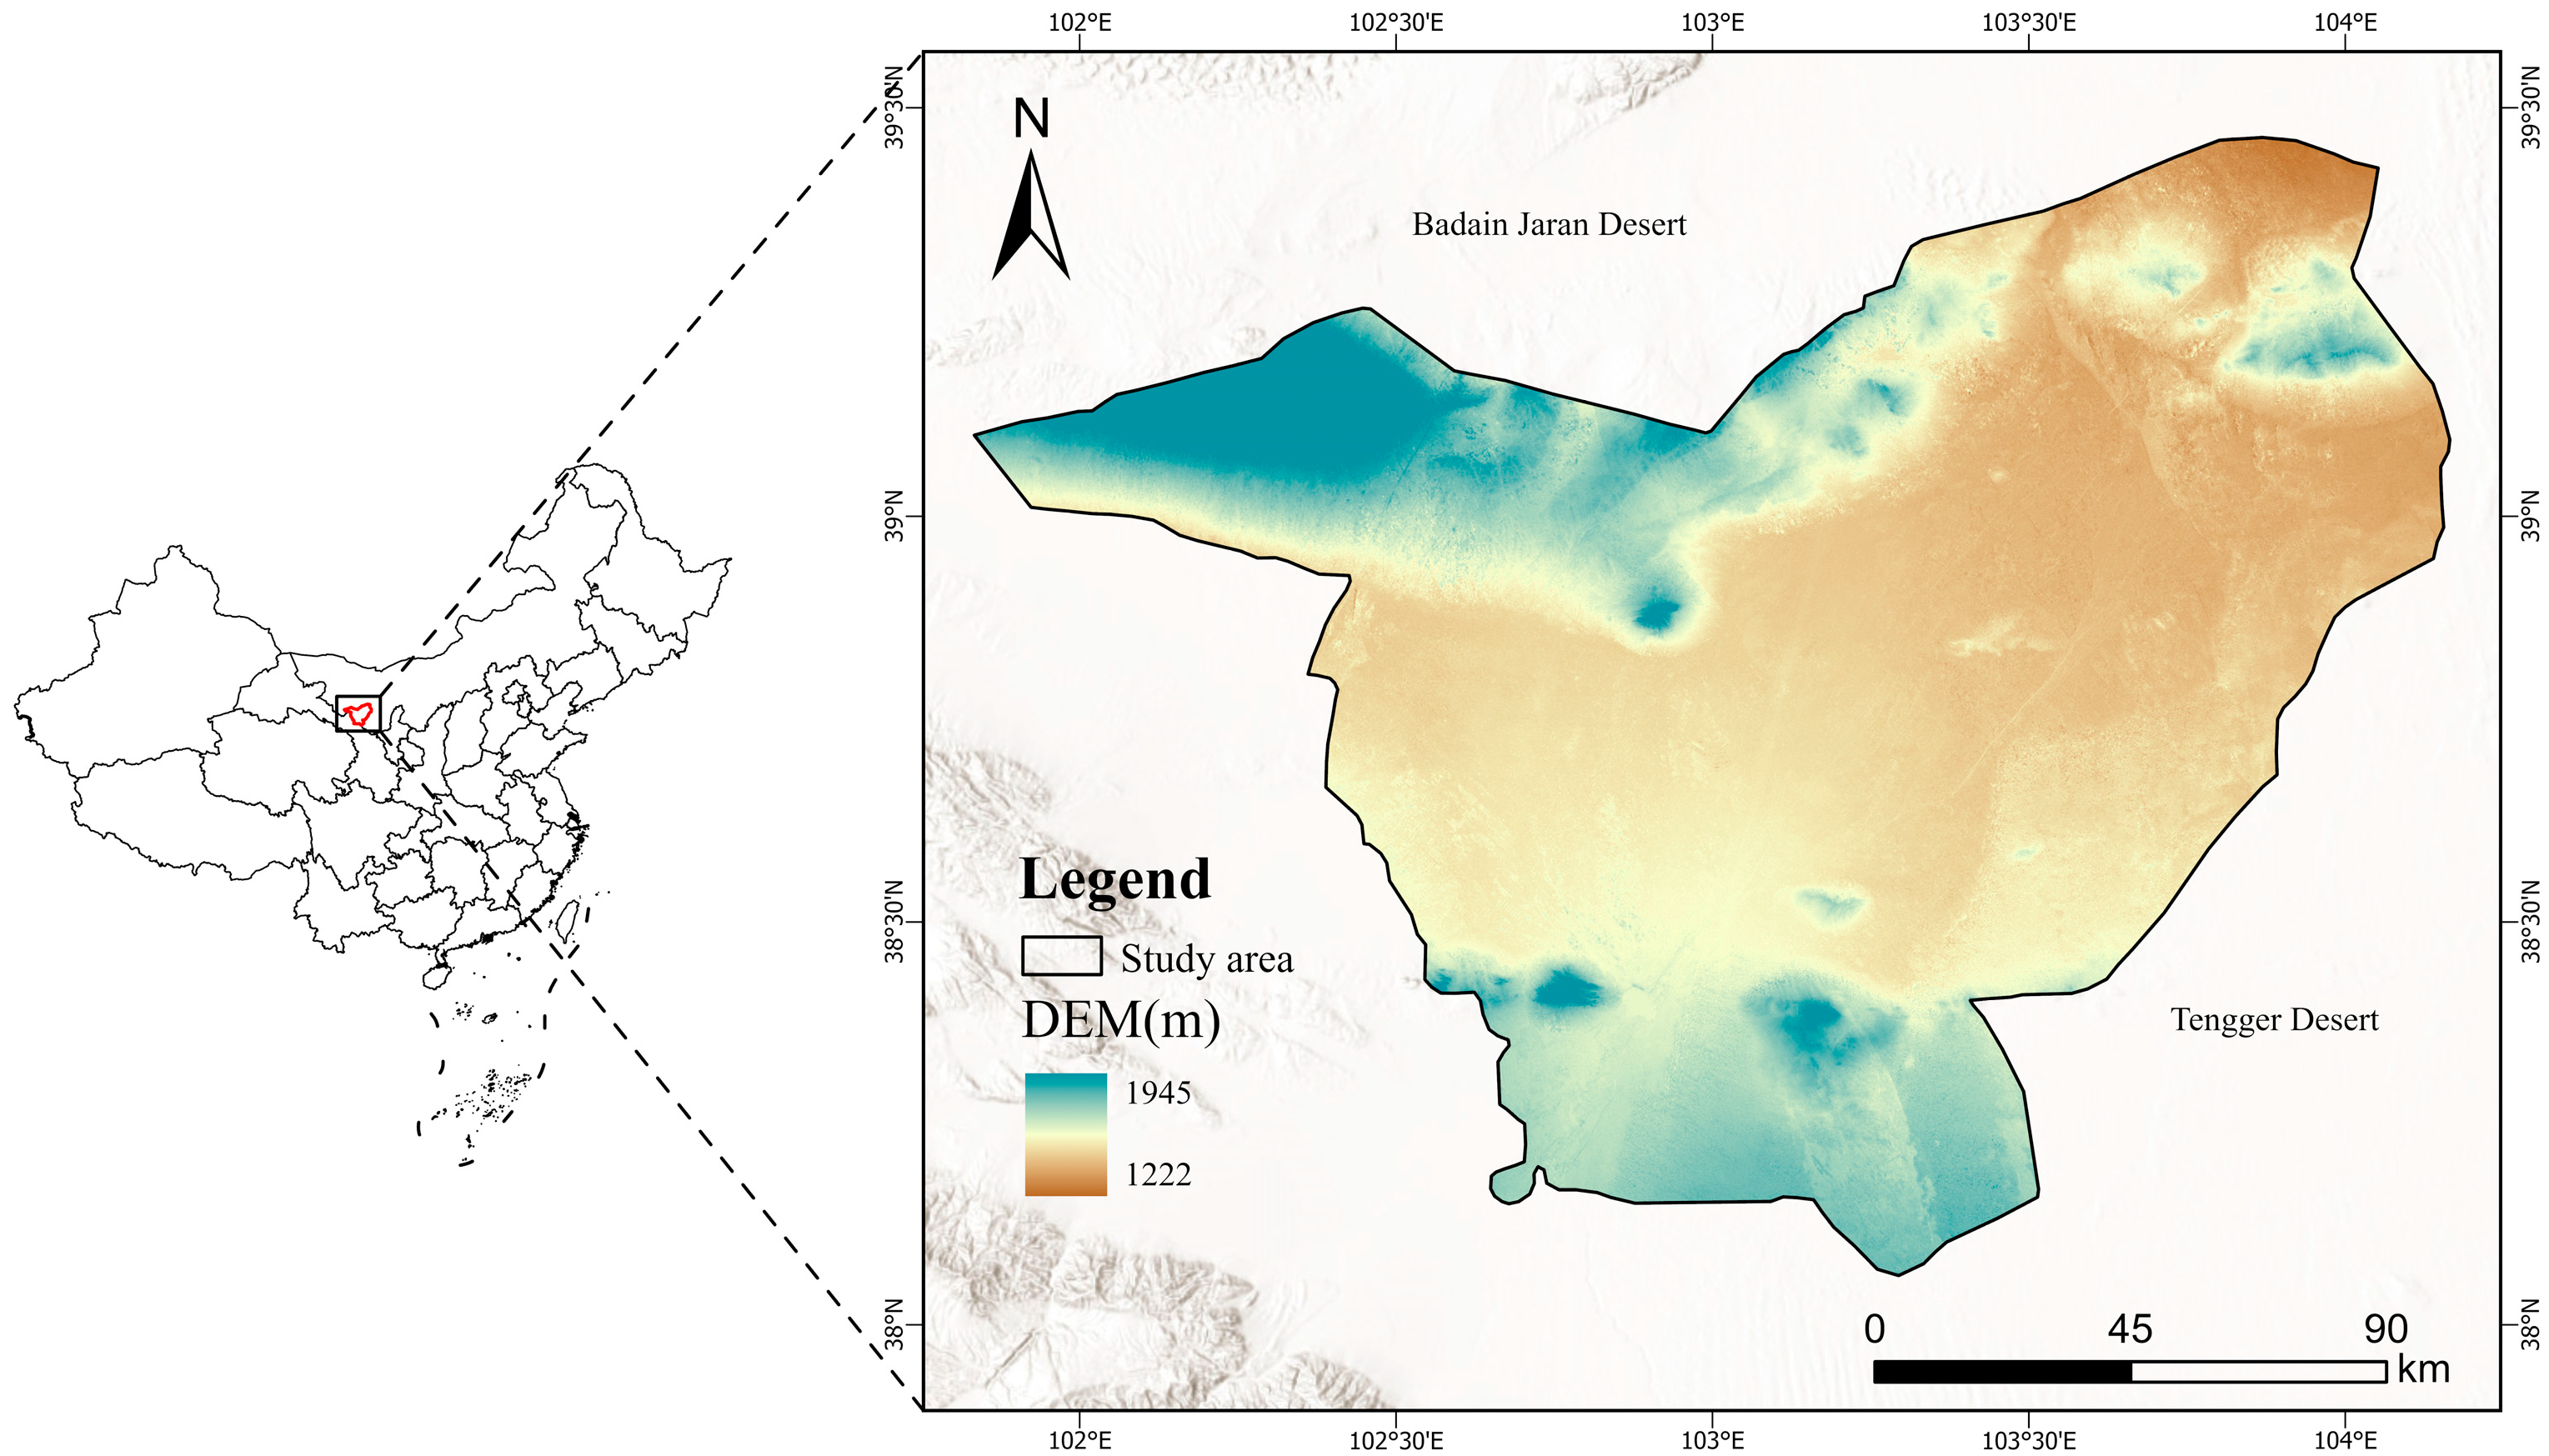
2.1. Objects of Study

The study area is situated in the western region of Minqin County, Wuwei City, Gansu Province, specifically in the western Shawo area between the Badain Jaran and Tengger Deserts; see Figure 1. This region has long suffered from ecological fragility, resulting in severe desertification exacerbated by human activities and climatic stressors [14]. The area supports over 90 species of drought-tolerant shrubs and trees, including Haloxylon ammodendron, Reaumuria soongorica, and Artemisia desertorum [15]. This study selects three representative shrub species to investigate differences in wind-sheltering and sand resistance performance under staggered double-row configurations with varying plant morphologies.
In Liu’s field experiments conducted in May [16], three types of desert shrubs were investigated. To facilitate further analysis, detailed morphological characteristics of the shrubs were recorded. A 20 m × 20 m quadrat was established for specimen selection, within which three to five representative specimens were chosen. Selection criteria included healthy plant growth, absence of anthropogenic disturbance, and sufficient distance from neighboring thickets. Table 1 presents the field data obtained from Liu’s study. In Table 1, H₁ denotes shrub height, C is the canopy diameter, encompassing measurements taken both in the windward direction and perpendicular to the wind direction, H₂ refers to the height below the first branch, S represents the vertical stratum with the maximum upwind projected area, and A is the upwind projected area within the 0–50 cm height range. The shrub modeling data in Table 2 were derived from the values in Table 1. We selected appropriate side lengths and spacing of the geometric elements to ensure that the data in Table 2 closely corresponds to those in Table 1.
The investigation revealed that Artemisia desertorum exhibits a moderate height, with its maximum upwind projected area located at the plant’s midsection. It has a high overall branching rate but a low secondary branching density, resulting in a canopy structure characterized by a sparse outer layer and a dense inner core. The shrub displays a fusiform morphology, featuring a broader central portion and tapering ends. Compared to Hedysarum scoparium, A. desertorum exhibits a similar plant architecture, with the maximum upwind projected area occurring at the same vertical level. However, H. scoparium is taller than A. desertorum, and its canopy diameter is nearly twice as large, resulting in a shape with a broader base, narrower apex, and a correspondingly lower center of gravity. In contrast, Reaumuria soongorica is considerably shorter. Its maximum upwind projected area is concentrated near the plant’s base, resulting in an urn-shaped structure with a broad lower section and a tapered upper portion. The species exhibits an overall branching rate approximately 25% that of H. scoparium, forming a canopy structure with a compact outer layer and sparse inner zone.

2.2. Numerical Simulation
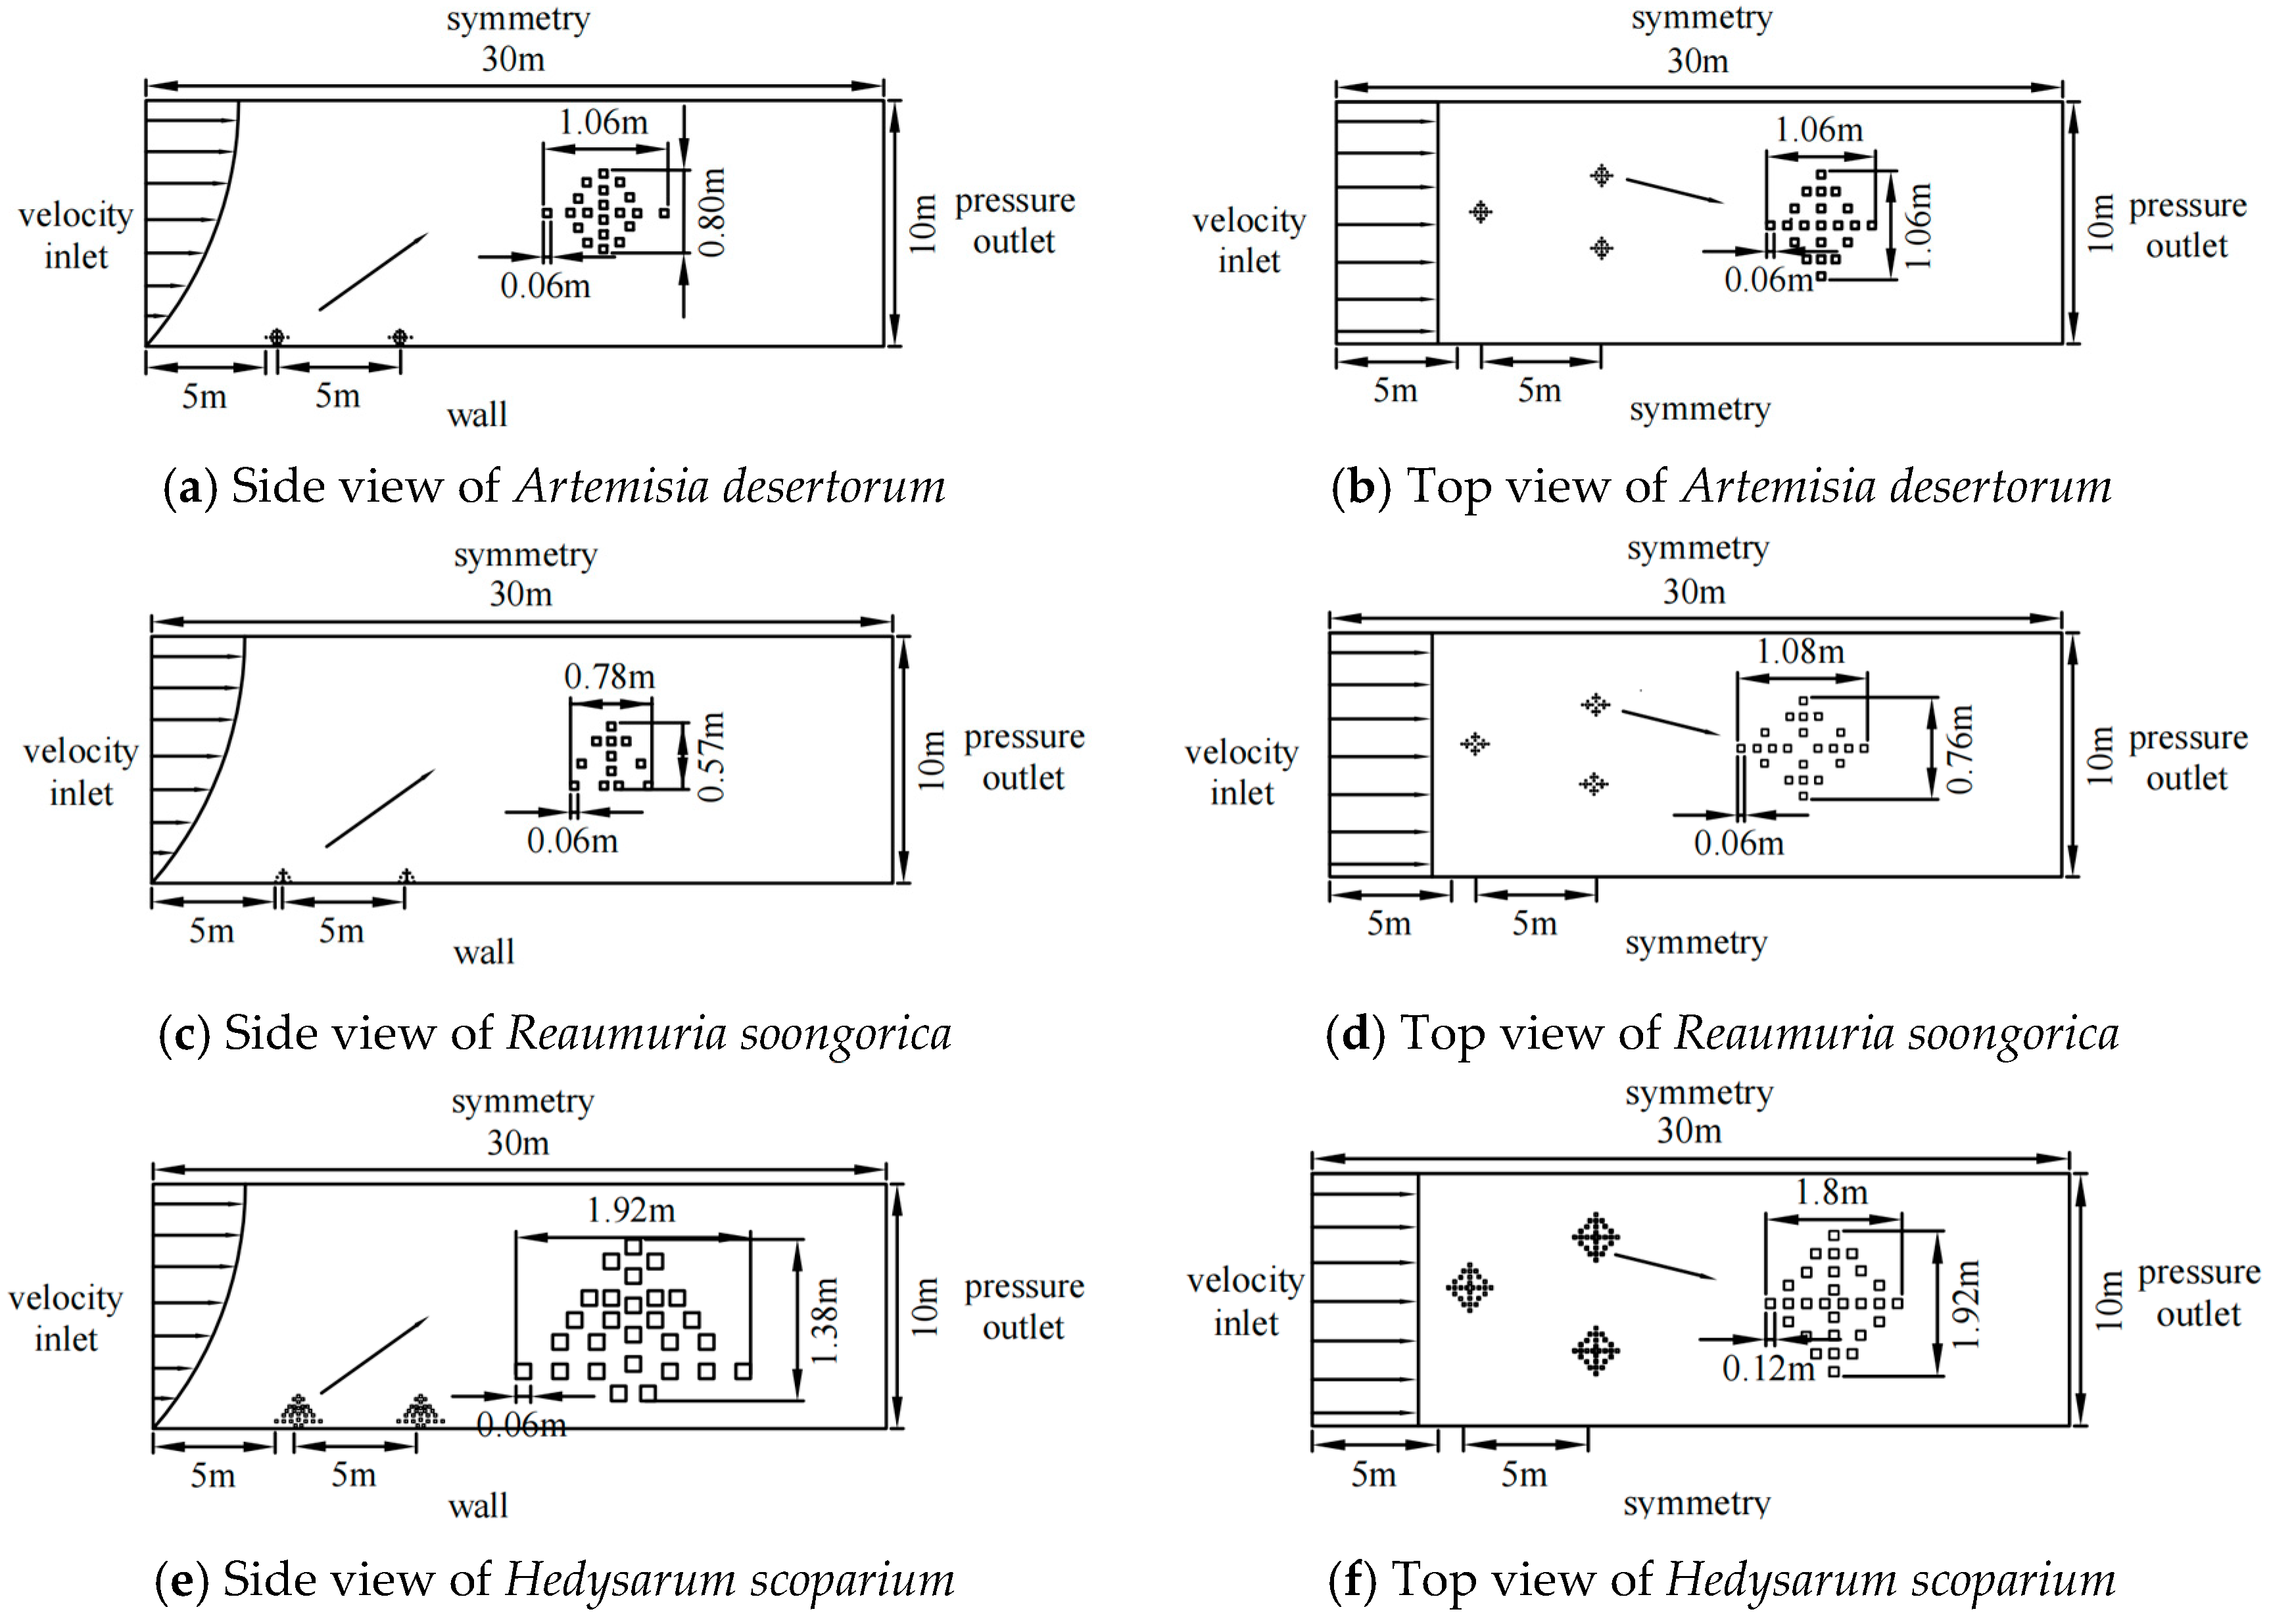
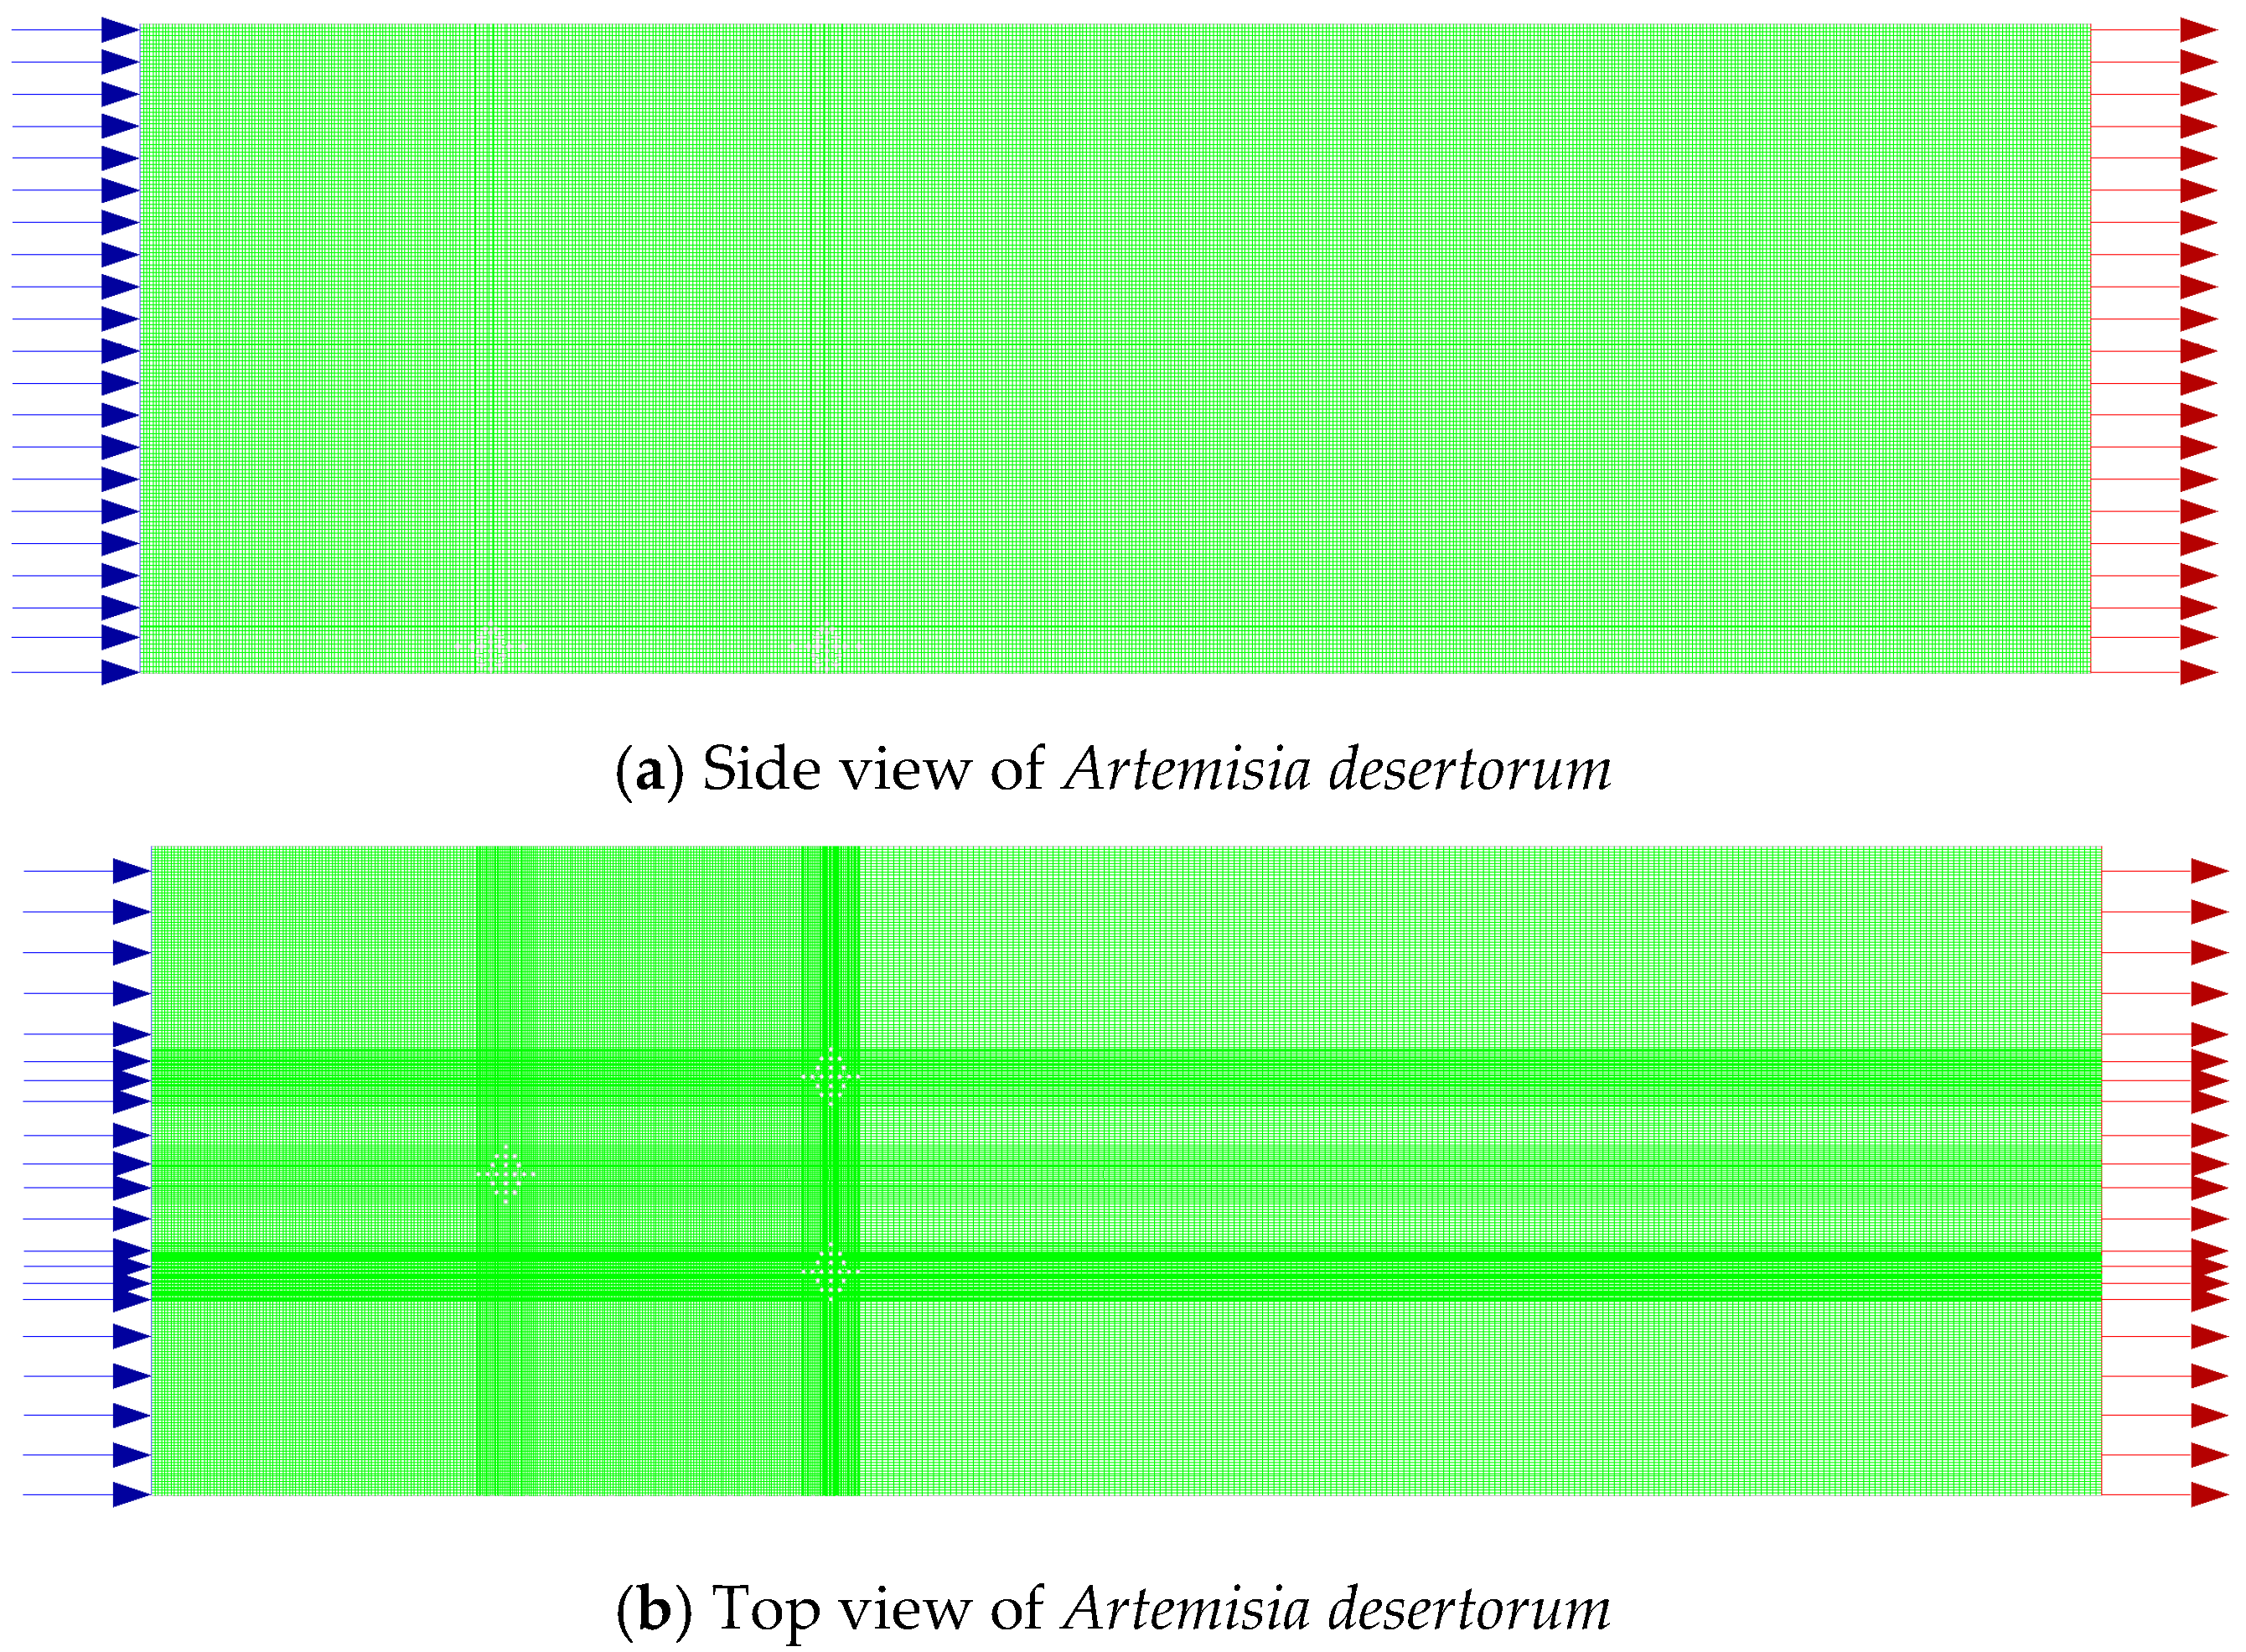
2.2.1. Modeling

The simulation considers both wind and sand particles as interacting components. This study aims to investigate the flow field characteristics in both horizontal and vertical directions. Given the periodic arrangement of belt-shaped windbreak forests and the axisymmetric structure of shrubs, a two-dimensional (2D) cross-sectional model is sufficient to represent the overall flow field. The influence of shrubs on aeolian sand flow is primarily determined by their cross-sectional projections, while internal structural details can be reasonably neglected. Given that the dominant wind direction is primarily horizontal, the 2D model effectively captures the essential characteristics of the flow. Moreover, during transport, sand particles are influenced by aerodynamic drag and gravity within the same plane. Therefore, a 2D model is employed in this study to simulate the wind-sand flow dynamics. The model leveraged the inherent symmetry and sparse distribution characteristics of the shrubs. After iterative adjustments and incorporating findings from previous studies [11,17], the computational domain was finalized as 30 m × 10 m in both the side and top views. In the side view, shrubs were positioned at 5 m and 10 m from the domain entrance. In the top view, two rows of shrubs were arranged in a parallel and staggered configuration. Specifically, one shrub was placed 5 m from the entrance, while two shrubs were positioned 10 m from the entrance and spaced 3 m apart, as illustrated in Figure 2. The overall configuration of the flow field is depicted in Figure 2. The right panel provides a magnified view of an individual shrub cluster, detailing the model’s structural parameters, including plant height, crown width, and the dimensions of the geometric elements constituting the shrub.
After establishing the model, finite element meshing was performed using ICEM CFD 2022R1 software. An unstructured mesh was generated for the computational domain. Near-ground mesh refinement was achieved in ICEM by applying edge parameters. Figure 3 presents the mesh configurations from lateral and top views for Artemisia desertorum; the same methodology was used for Reaumuria soongorica and Hedysarum scoparium. Mesh quality checks in FLUENT 2022R1 revealed no negative volumes or topological errors. The total number of elements exceeded 100,000. Mesh skewness was well below 0.5, and the orthogonality coefficient was significantly greater than 0.9. These parameters indicate good mesh quality, meeting the simulation requirements. Figure 3 illustrates the meshing process conducted in ICEM software.

2.2.2. Setting Parameters

Based on the findings of prior studies [18], the Eulerian two-fluid model was adopted to simulate the sand-laden airflow. The simulation accounts for a flow field comprising both an air phase and a sand phase, with the two phases being mutually coupled and evolving on the same temporal and spatial scales. The volume fractions of the two phases collectively sum to unity. A transient solution approach was employed to capture the temporal evolution of the multiphase flow, incorporating the following representative physical parameters: ρs = 2650 kg/m3, sand viscosity μs = 0.047 Pa·s, initial stacking rate α = 0.625, and the sand particle size ds = 0.1 mm. For the granular phase, the Gidaspow model was utilized to determine granular viscosity, the Lun et al. model was applied to compute granular bulk viscosity and solid pressure, and the Schaeffer model was used for frictional viscosity. The phase-coupled SIMPLE algorithm was employed to obtain a converged solution. The momentum, turbulent kinetic energy, and turbulent dissipation rate equations were all discretized using the second-order upwind scheme. The convergence criterion was set to a residual threshold of 1 × 10⁻⁵, with a time step fixed at 0.001 s. The velocity of the air phase was monitored throughout the simulation to ensure stabilization and validate convergence.
In the side view, the left boundary of the flow field is specified as a velocity inlet, while the right boundary is defined as a pressure outlet. The upper boundary is set as a symmetry condition, and the lower boundary is defined as a no-slip wall. In the top view, both the upper and lower boundaries are treated as symmetry conditions. The left inlet and right outlet are defined consistently with the side view configuration. The specularity coefficient was set to 0.01. To better replicate realistic conditions, wind velocity contour profiles were imposed at the inlet.
v y = v 0 k l n y y 0
where vy is the value of wind speed (m/s); v0 is the friction velocity (m/s); k is the von Karmen coefficient, which generally takes the value of 0.4; y0 is the roughness length (m); y is the height (m).
The main control equations included in the simulation of this paper are the continuity equation and the momentum equation. The continuity equation is as follows:
ρ t + ρ u x x + ρ u y y = 0
where ux, uy are the velocity vectors in the x and y directions, respectively; ρ is the density (kg/m3), and t is the time (s).
The momentum equation is as follows:
ρ u x t + ρ u x u ¯ = p t + τ x x x + τ y x y
ρ u y t + ρ u y u ¯ = p γ + τ x y x + τ y y γ + ρ g
where p is the pressure (Pa), u is the velocity vector, τ x x , τ x y , τ y x , and τ y y are the components of the viscous stress acting on the surface of the micrometabolite due to molecular viscous interaction τ (Pa), g is the gravitational acceleration (m·s2).

3. Results

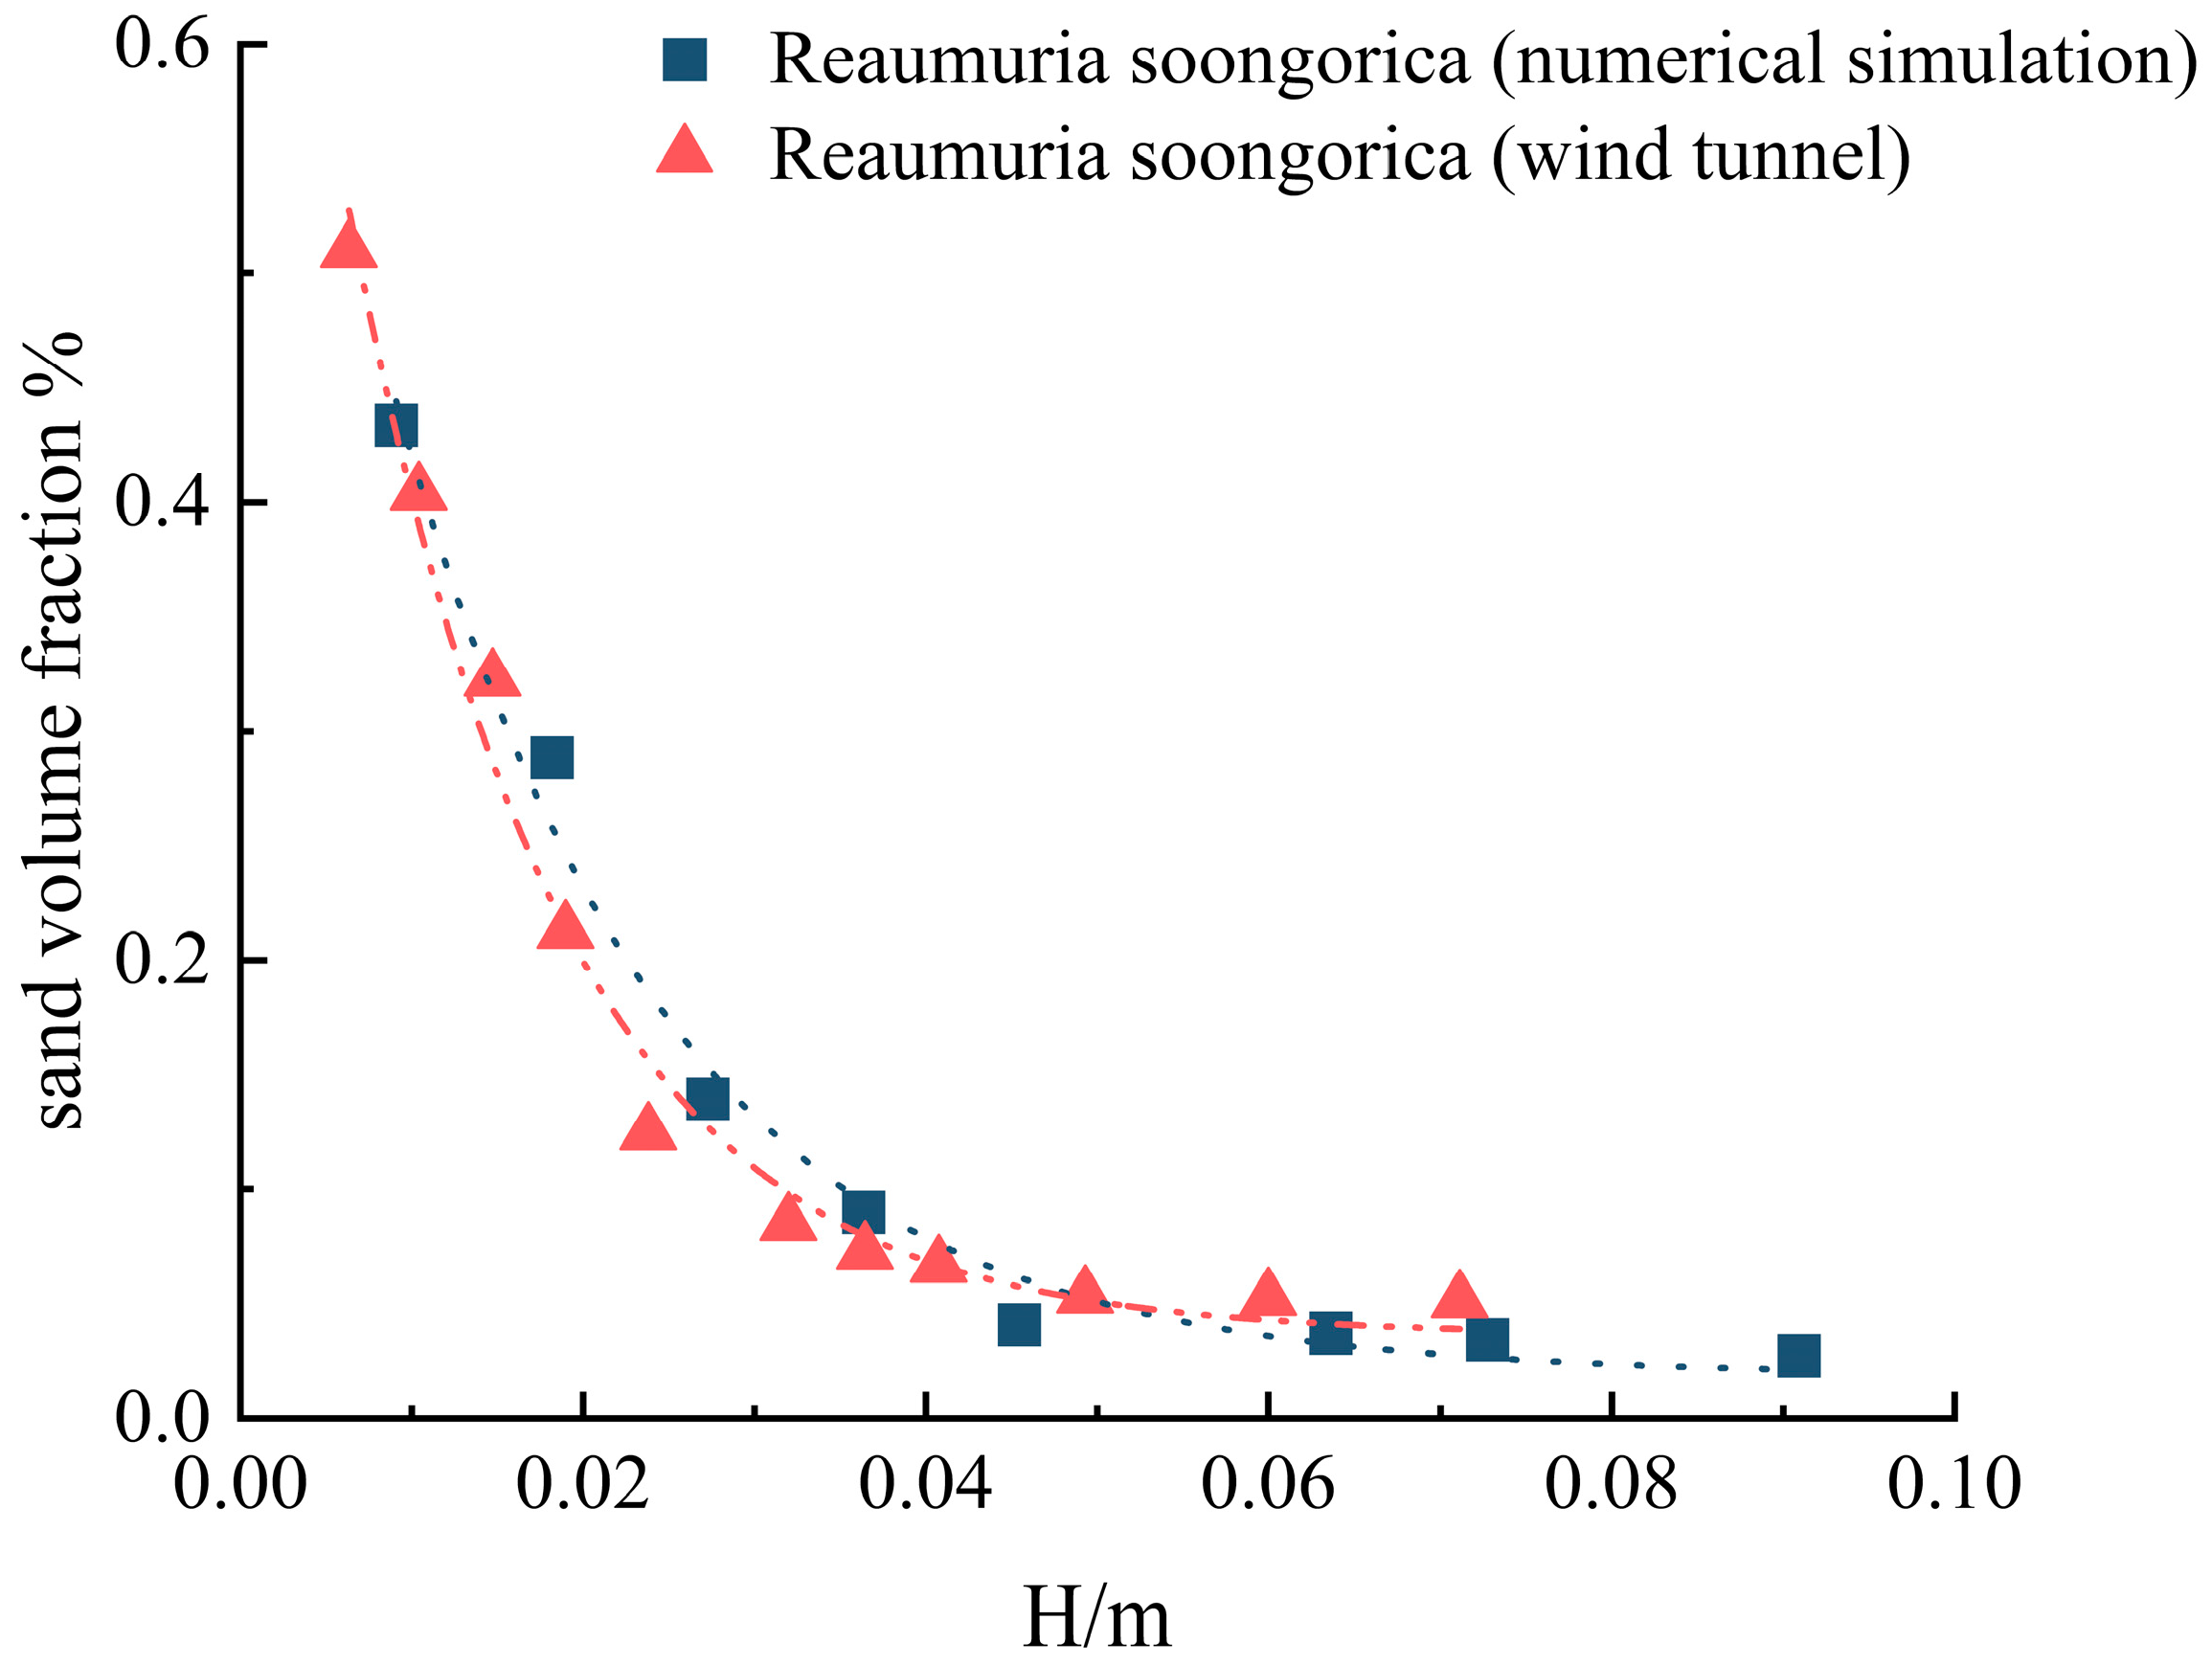
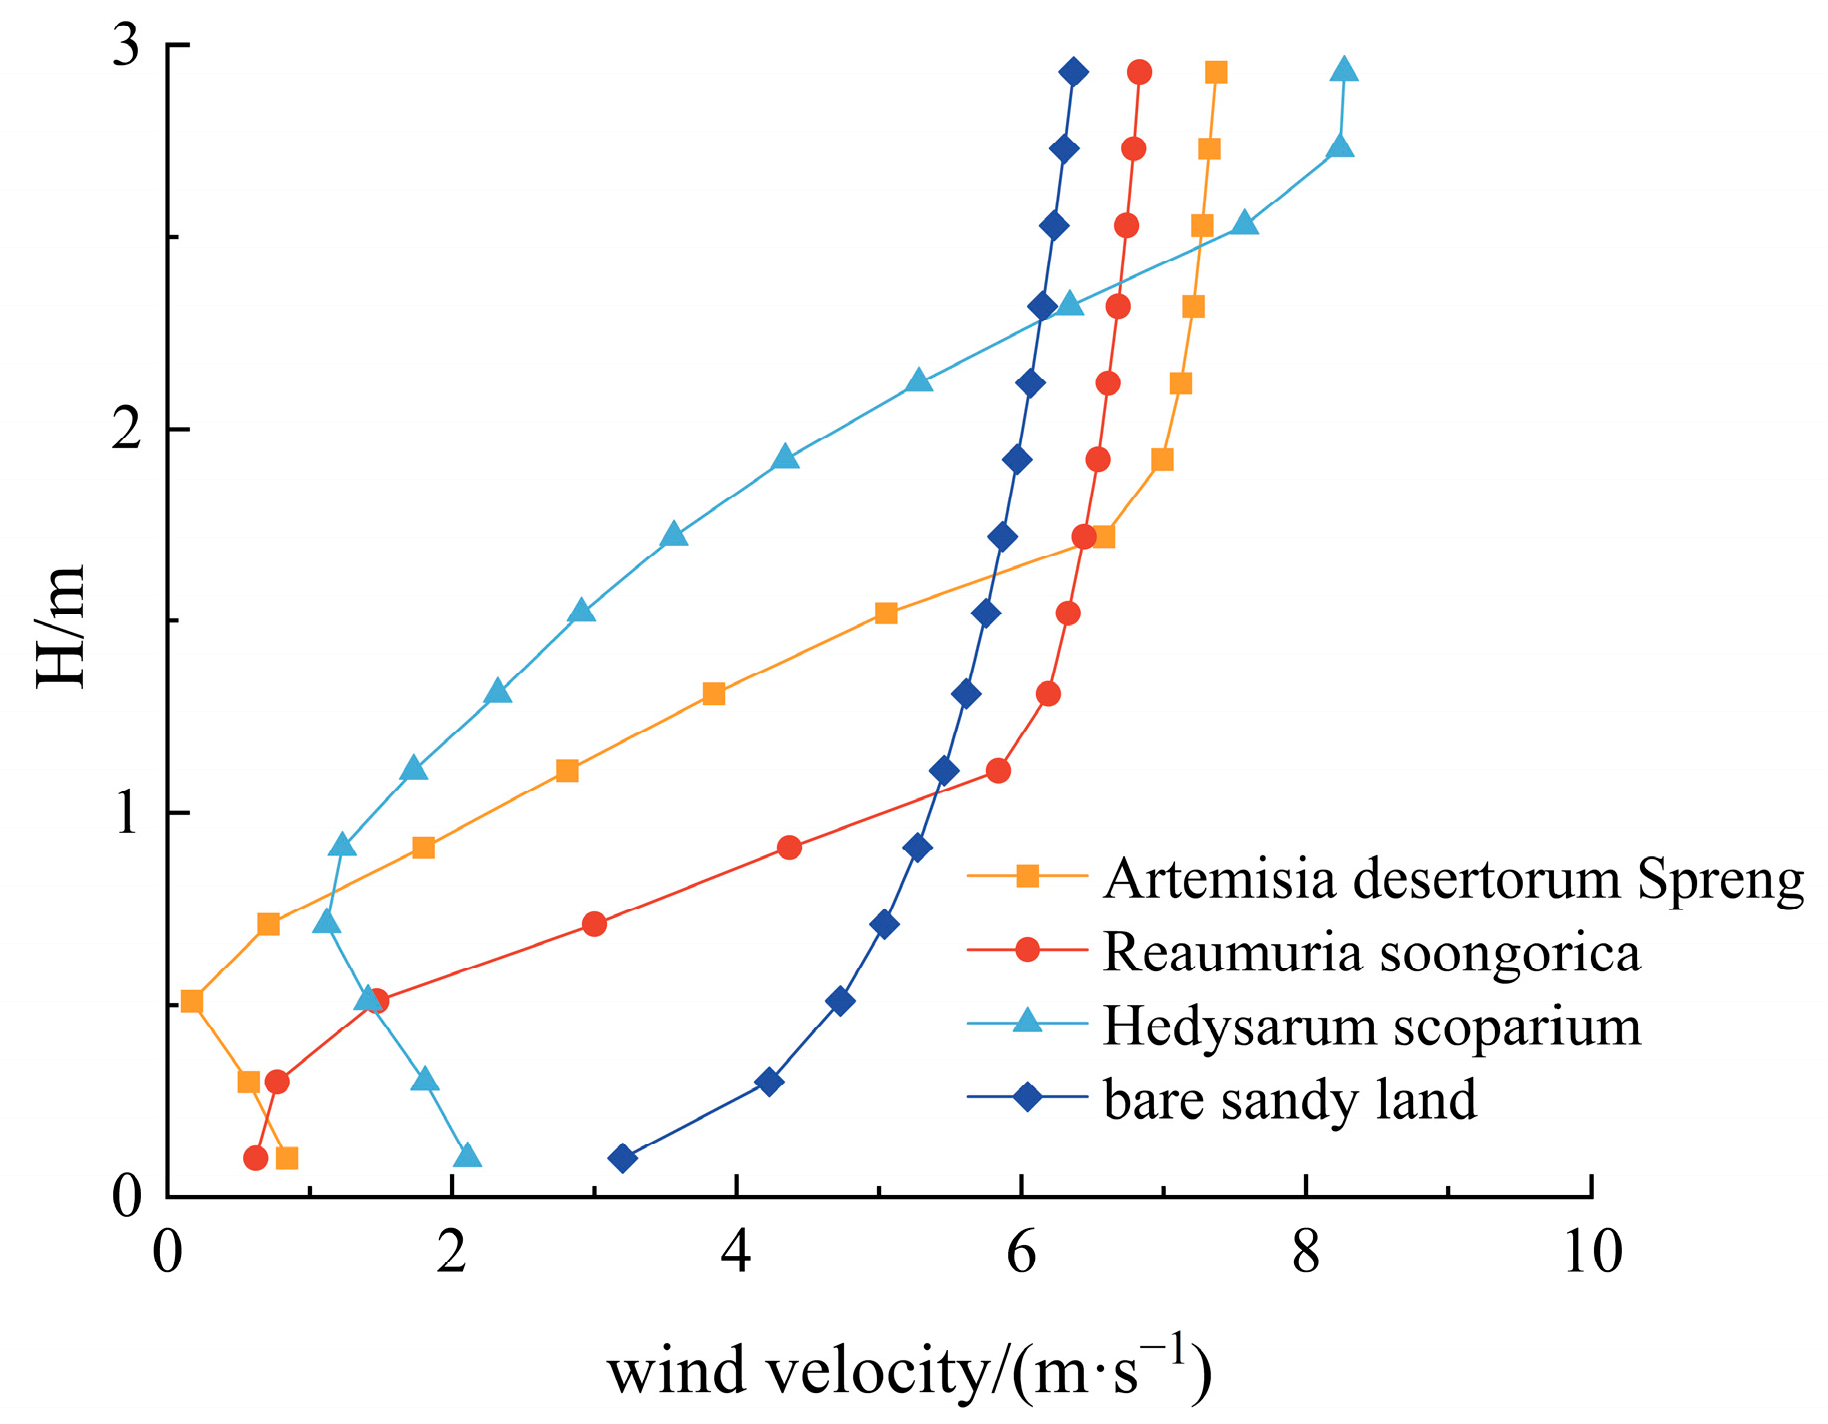
3.1. Wind Tunnel Test

The results of Wang wind tunnel experiments were employed to validate the reliability of the simulation results [19]. The experiments were conducted at the Desert Forestry Experimental Center of the Forestry Science Research Institute, located in Dengkou County. A direct current (DC) open-type wind tunnel was utilized in the experiments, with a cross-sectional area of 2 m × 2 m and a test section length of 25 m. A 0.05 m thick sand bed was laid on the floor of the wind tunnel, and the surface was leveled to ensure uniformity. The wind speed was controlled by a frequency inverter and maintained at 10 m/s for a duration of 2 min. A plant specimen was mounted along the central axis of the test section using a hollow iron pipe. Sand transport at a distance of 3 m downstream of the plant was measured using a sand collector. The measured sediment load was compared with the simulated sand volume fraction, as shown in Figure 4. A high degree of agreement was observed between the experimental and simulation results. Both the sediment load and sand volume fraction decreased rapidly at heights below 0.03 m, with a slower rate of decrease observed between 0.03 m and 0.05 m, and tended to stabilize above 0.05 m. The numerical simulation results were consistent with the wind tunnel measurements. Model fidelity was further ensured through parameter calibration and cross-validation with field data.

3.2. The Shelter Effect of Different Shrubs

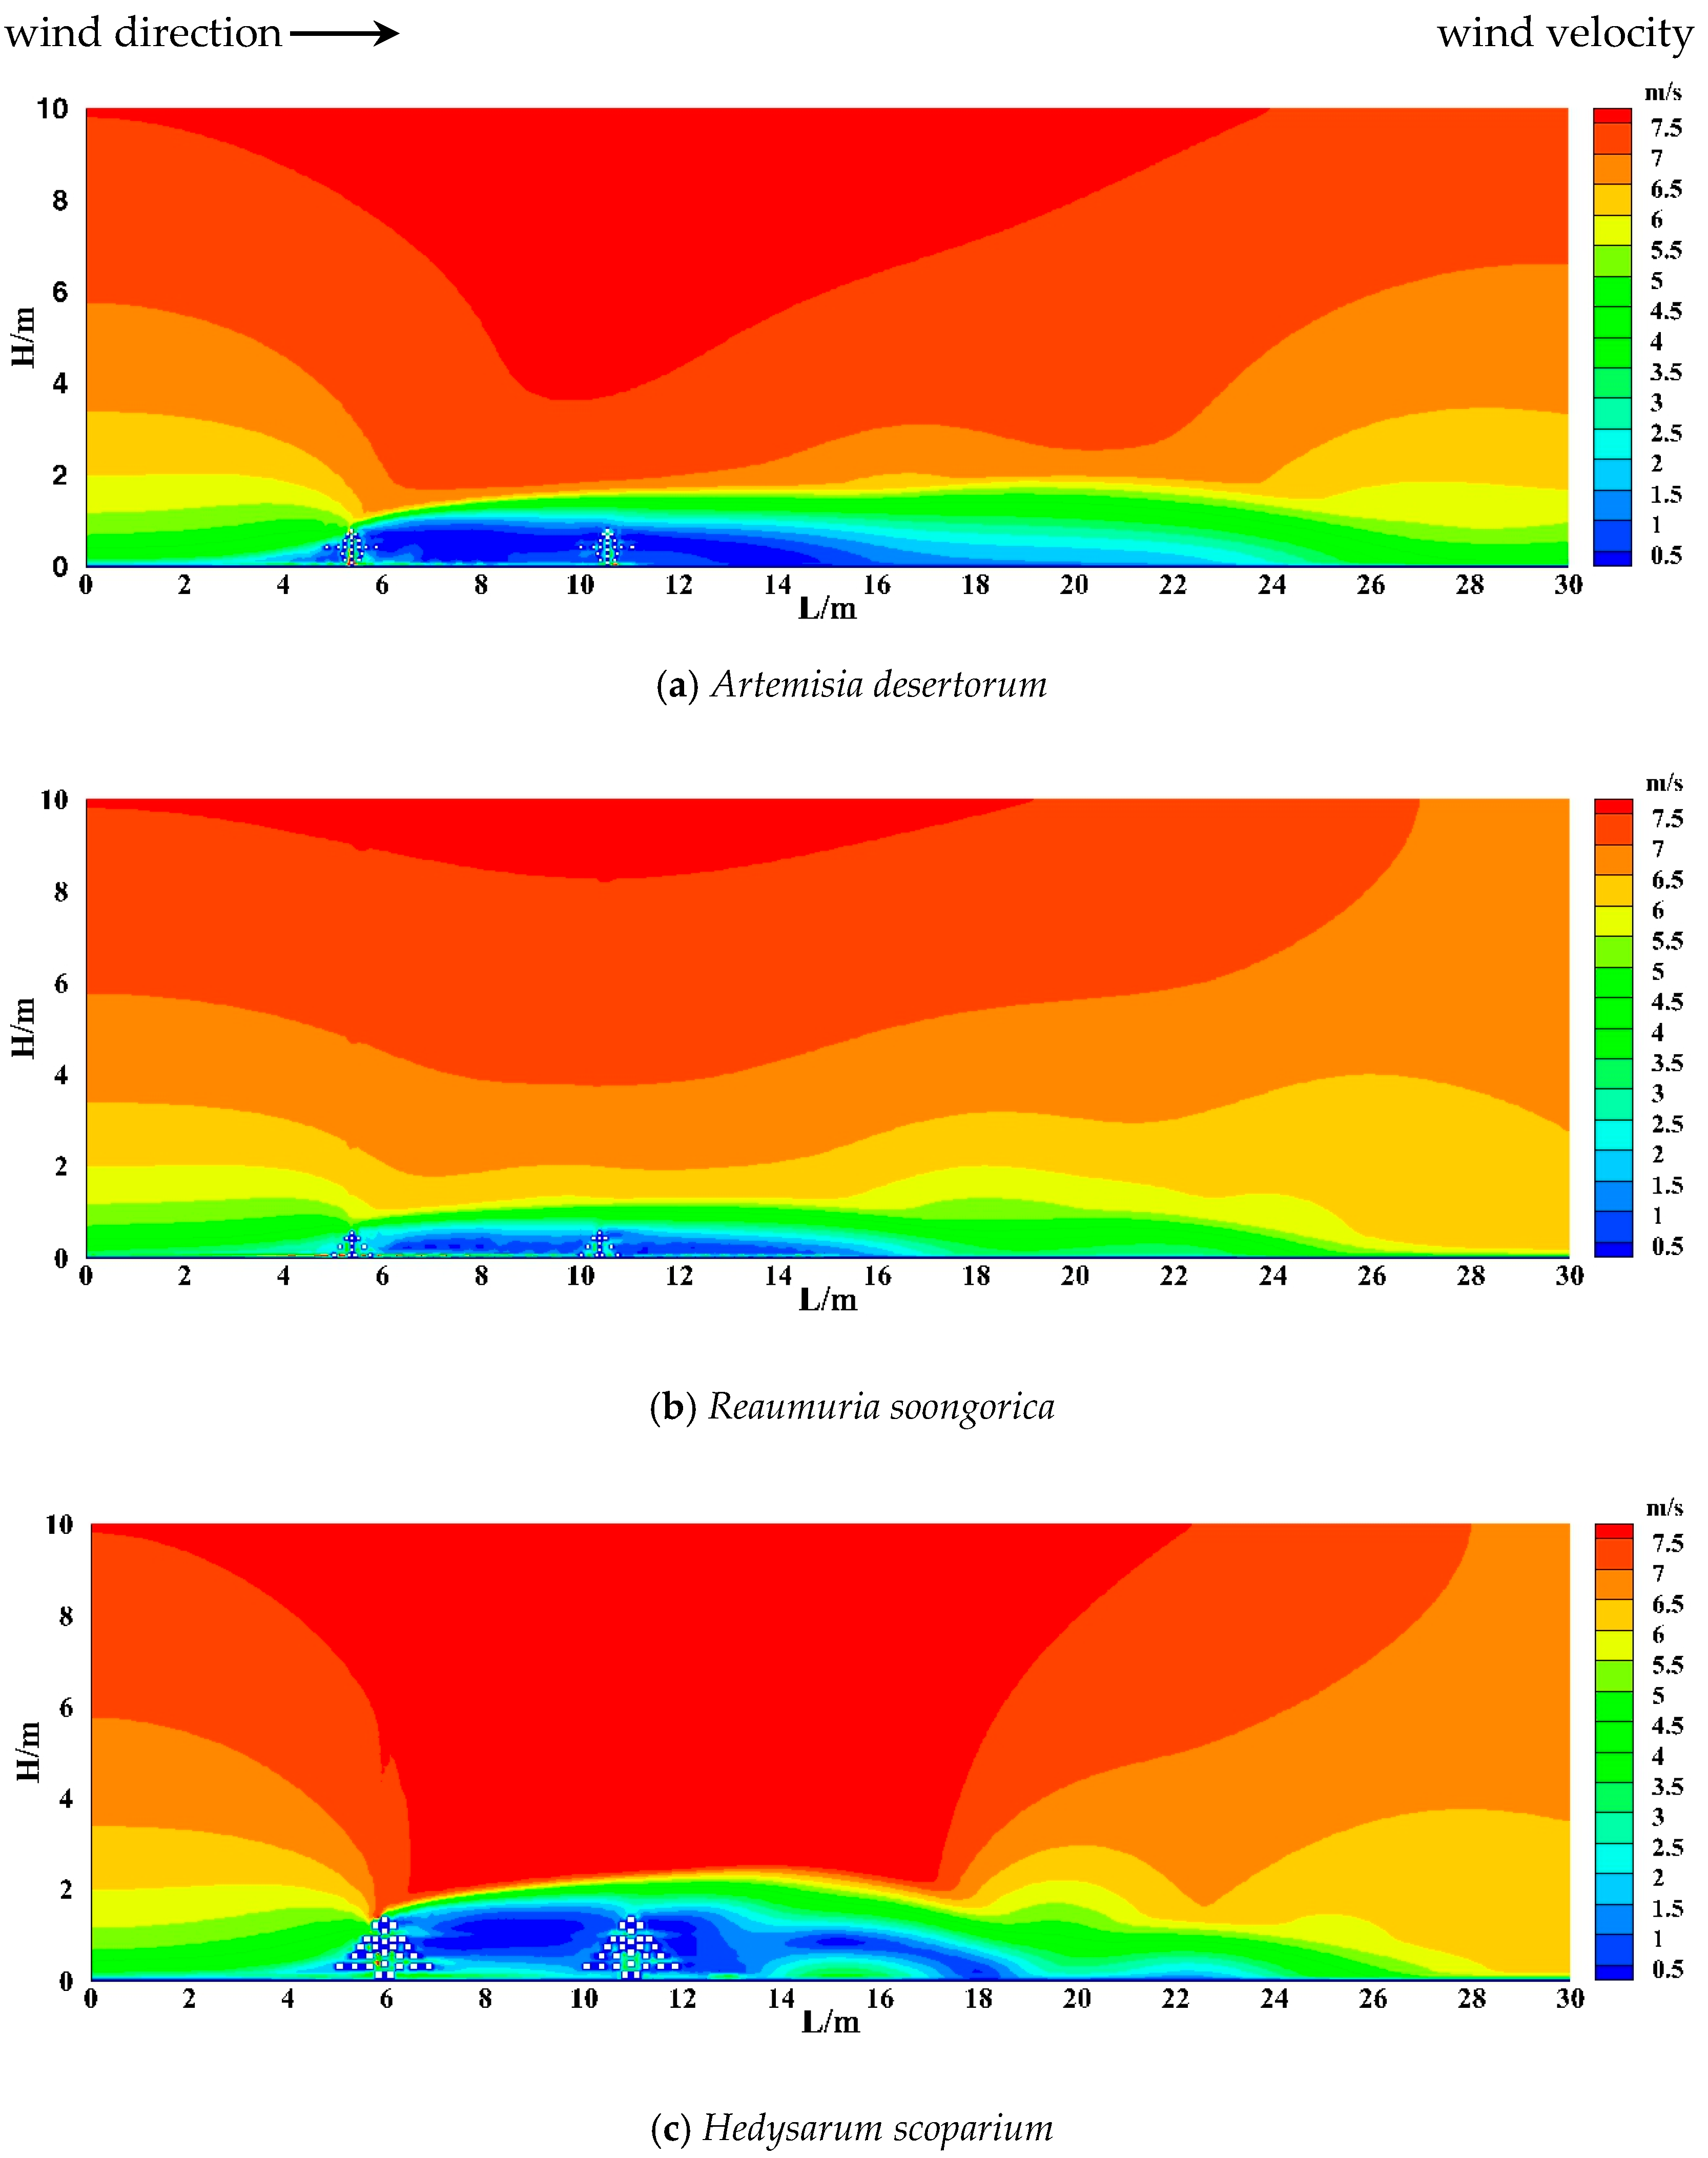
3.2.1. The Vertical Shelter Effect of Shrubs

A simulation was conducted with the wind speed set to 6 m/s. The flow field distribution behind the shrub barriers is illustrated in Figure 5. As expected, the wind speed was reduced in the wake of the shrubs. However, the magnitude of the sheltering effect varied depending on differences in plant architecture. R. soongorica exhibits a short, altar-shaped growth form. Its sparse foliage density in the upper canopy results in limited aerodynamic attenuation of wind velocity. The sheltering effect extends approximately 6 H downstream of the shrubs. While both A. desertorum Spreng and H. scoparium exhibit a fusiform growth habit, the greater height of H. scoparium results in more extensive near-surface wind attenuation. The vertical extent of the sheltering effect reached up to 2 m, approximately twice the height of A. desertorum. However, the horizontal sheltering effect of A. desertorum Spreng was more pronounced, extending up to 7 H, while that of H. scoparium extended to approximately 6 H.
In addition, the energy of the sand-laden airflow was altered after encountering the shrub barriers, leading to a redistribution of velocity within the flow field. According to aerodynamic principles, the flow field can be divided into five distinct zones by the presence of double rows of shrubs, namely: the deceleration zone, acceleration zone, transition zone, vortex zone, and restoration zone. When approaching the shrubs, the airflow is obstructed, resulting in a decrease in velocity and the formation of a deceleration zone. As the airflow passes above the shrubs, the flow cross-section narrows, causing compression and inducing a Venturi effect, where velocity increases and pressure decreases, forming an acceleration zone. When the airflow travels between the two rows of shrubs, the porous medium attenuates wind momentum, giving rise to a transition zone. Downstream of the double shrub rows, a vortex forms under the influence of an adverse pressure gradient, resulting in reduced wind speed and the formation of a vortex zone. Further downstream, the sheltering effect gradually diminishes, and the wind speed begins to recover, thereby forming a restoration zone.

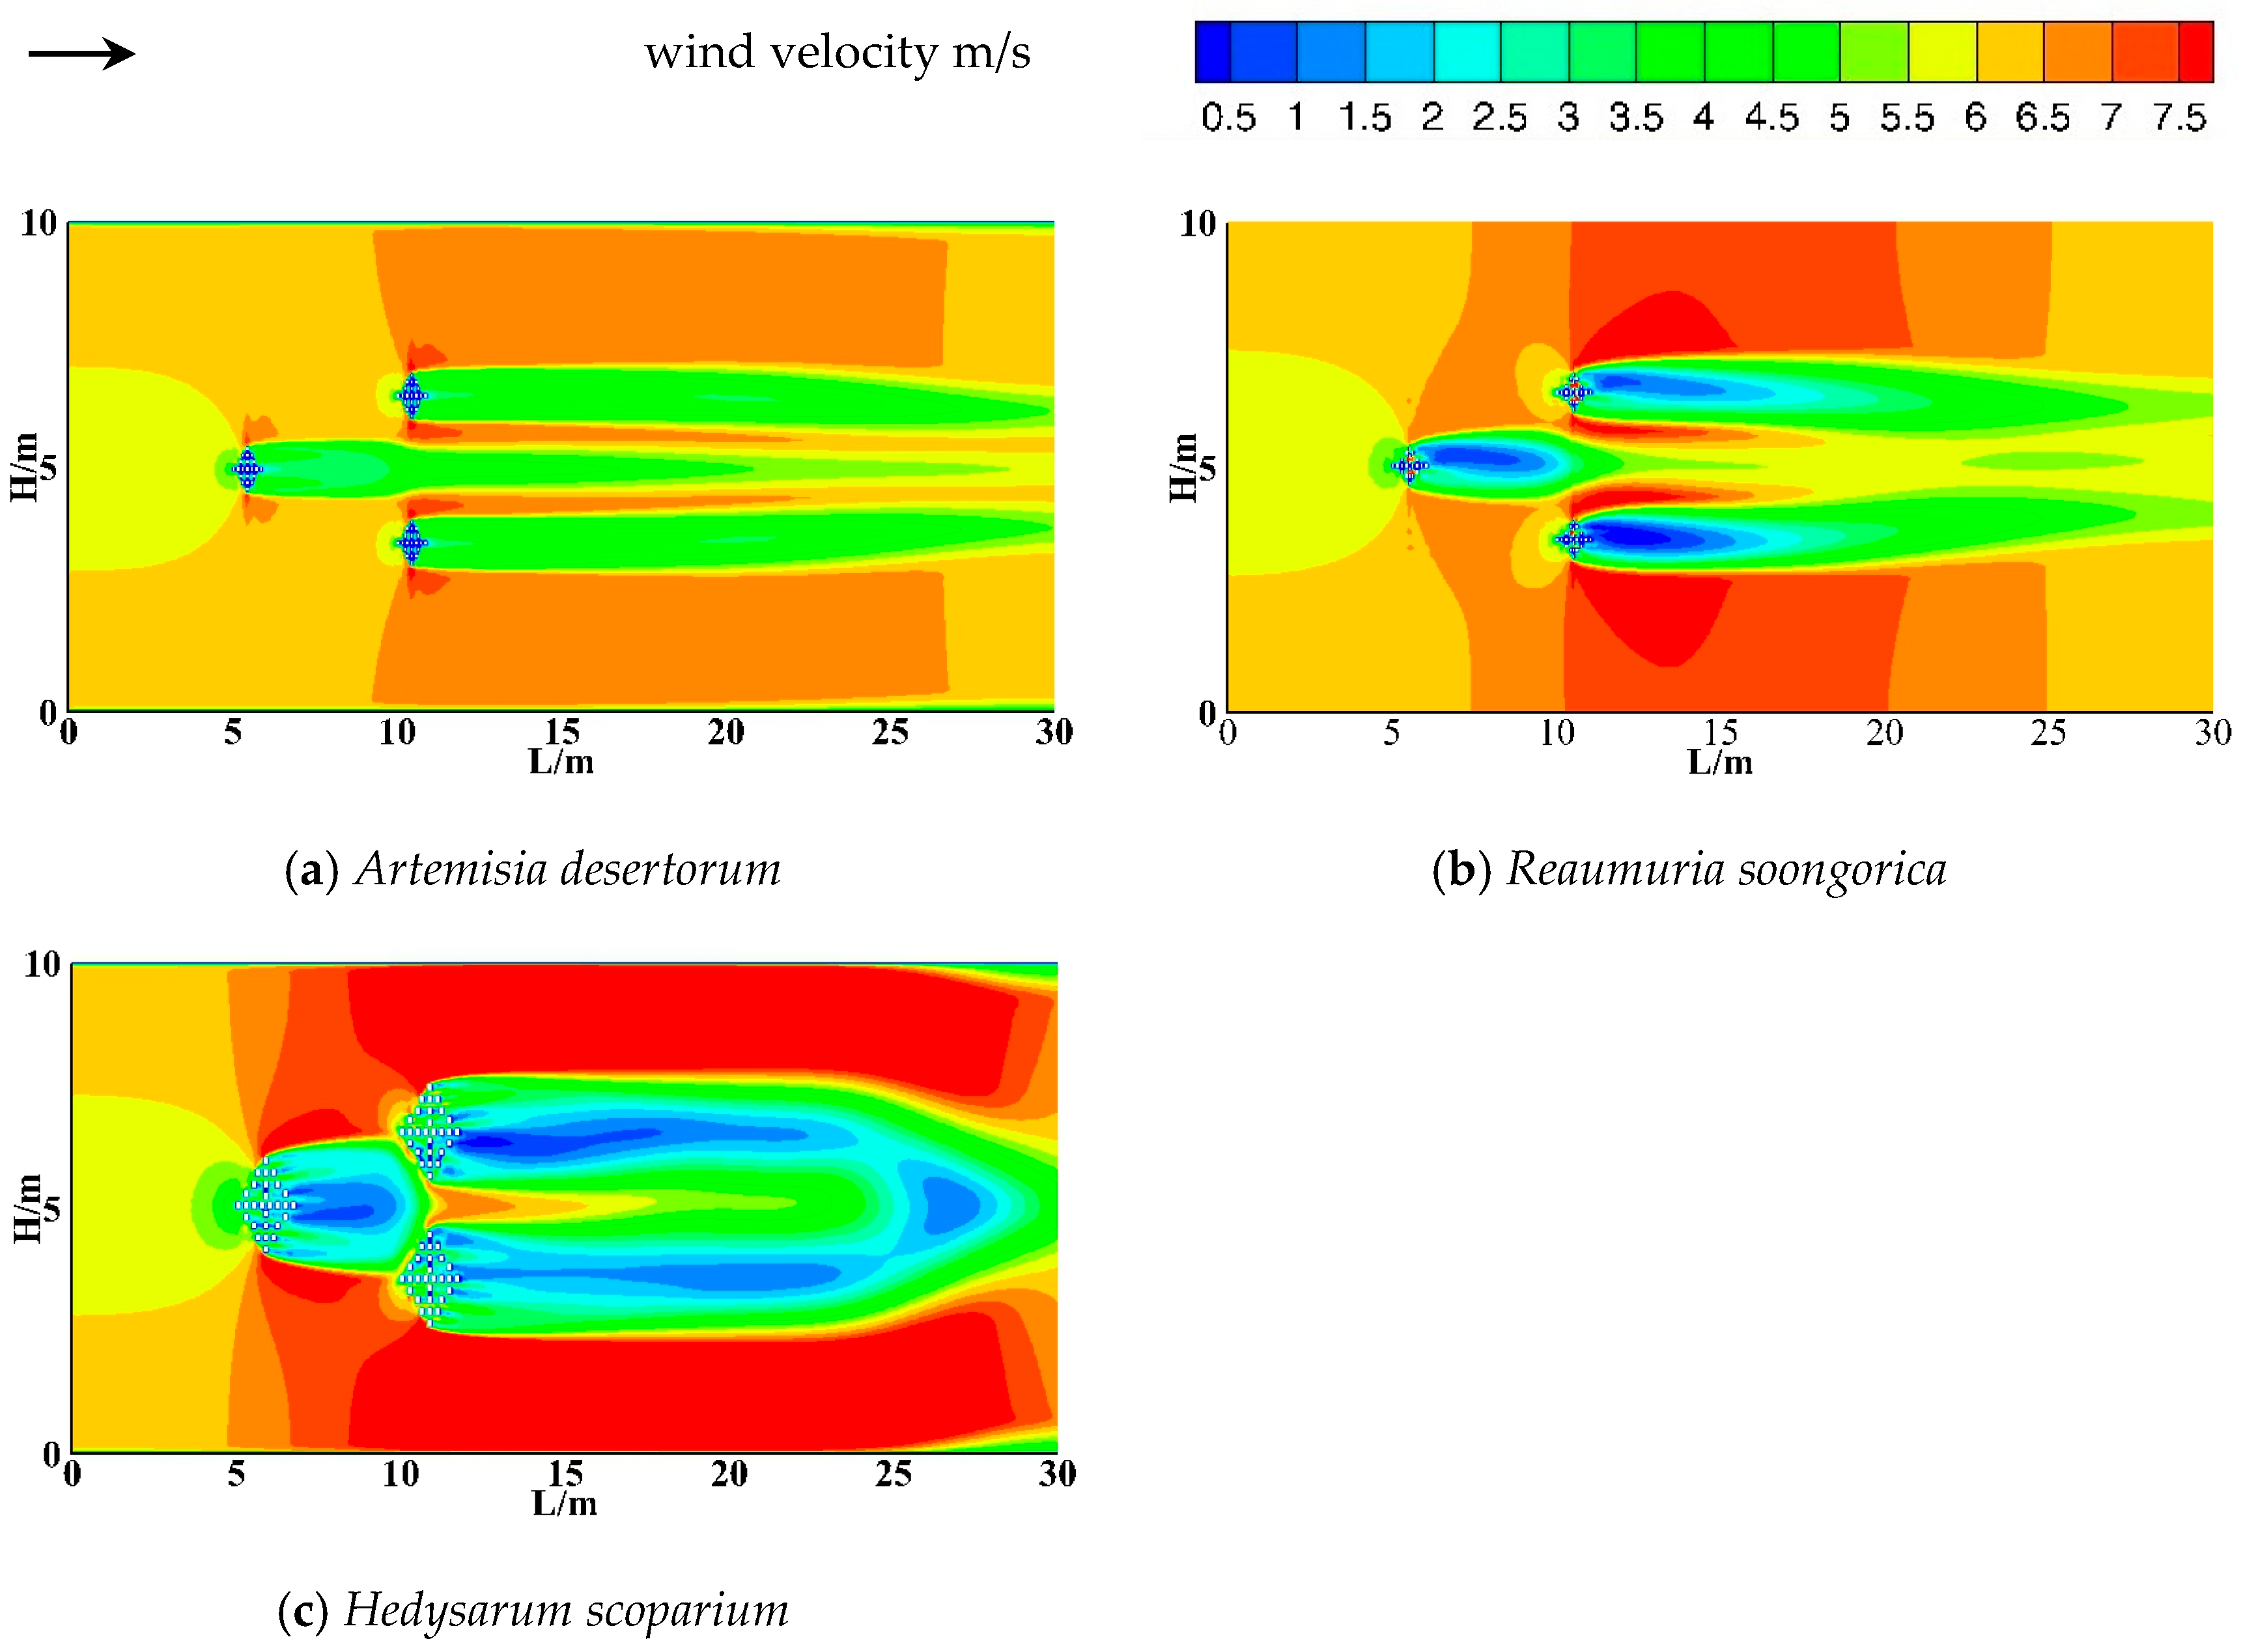
3.2.2. The Horizontal Shelter Effect of Shrubs

Fan-shaped deceleration zones were observed to be upwind of all three shrub species, as shown in Figure 6. Wind speed gradually decreases as the airflow approaches the shrubs. The maximum width of the deceleration zone was approximately 5 m. The horizontal component of the sand-laden airflow bifurcates around the shrubs due to momentum loss and vortex formation. The narrowed cross-section of the overflow induces a Venturi effect, leading to acceleration zones on both sides of the shrubs. The acceleration region was most extensive in Hedysarum scoparium due to its larger canopy dimensions. The width of the sheltering zone was positively correlated with shrub canopy dimensions. Artemisia desertorum and Reaumuria soongorica exhibited similar canopy dimensions, corresponding to shelter widths of approximately 3 m. H. scoparium exhibited an expanded crown morphology, providing a shelter width of up to 8 m, which produced the most pronounced wind attenuation effect among the three species.
Owing to the small canopy dimensions and relatively wide row spacing of Artemisia desertorum and Reaumuria soongorica, each shrub functions as an isolated obstacle, generating a fully developed wake and separation region, as illustrated in Figure 6. This type of flow is classified as isolated roughness flow [20,21]. In contrast, Hedysarum scoparium exhibits a larger canopy and reduced row spacing. The wake generated by the first row of shrubs does not fully develop until it interacts with the subsequent row. This regime is referred to as wake-interference flow [22]. In this regime, turbulence intensity increases, thereby enhancing the sheltering effect and sand resistance of the shrubs. When the row spacing is further reduced, wake development is suppressed by adjacent shrubs. The sand-laden airflow passing over the canopy is directly skimmed due to the formation of a shear layer between shrub rows, which induces vortex formation. This flow pattern is classified as skimming flow [23]. Under such conditions, the entire surface lies within the wake zone and is effectively protected from wind erosion. Therefore, optimizing shrub row spacing and spatial arrangement is critical for maximizing wind erosion control efficiency.

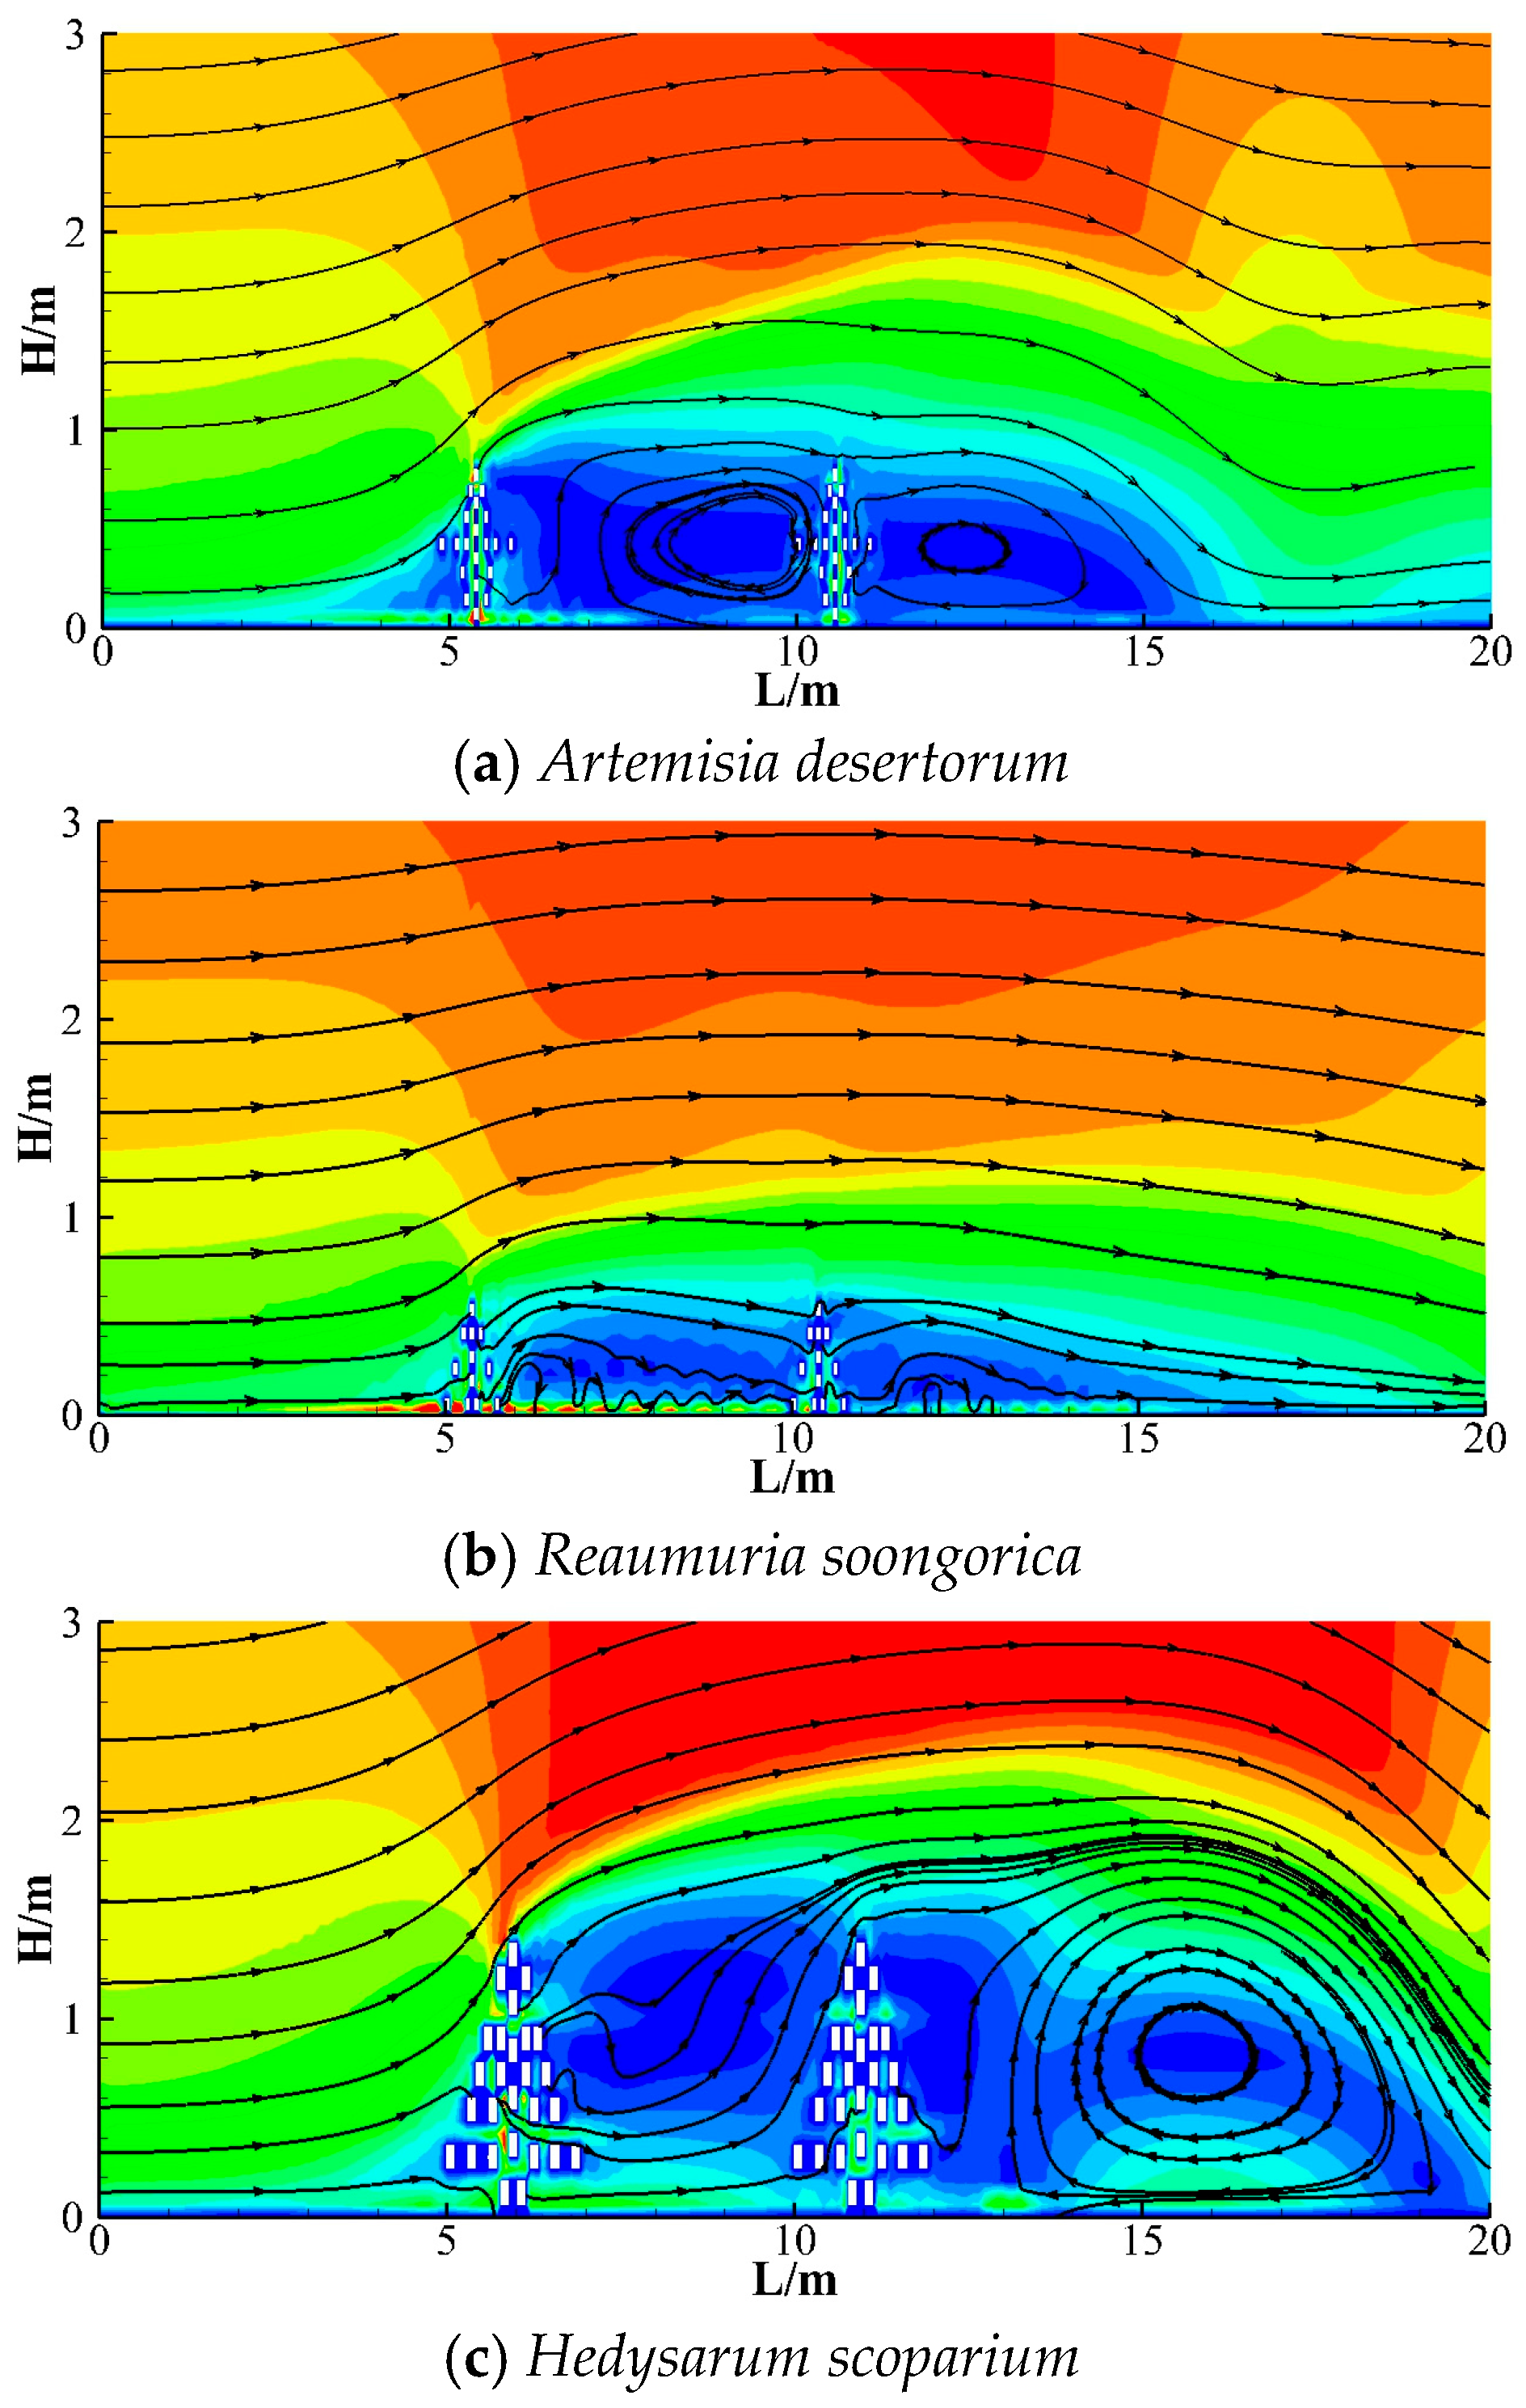
3.2.3. Vortex Analysis After Shrubs

The airflow over the surface is predominantly turbulent in nature. Turbulent flow is characterized by irregular motion and mutual interference of air masses. At this stage, the airflow contains vortical structures of varying scales. Vortical motion is the primary driver of sand transport and a key mechanism through which vegetation provides wind erosion resistance [24,25]. To further analyze airflow behavior around the double-row shrub configuration, wind streamlines were plotted at a wind speed of 6 m/s.
All three shrub species generated vortices downwind of the second row, as shown in Figure 7. The size and position of the vortices varied according to shrub morphology. The vortex heights followed the order Hedysarum scoparium > Artemisia desertorum > Reaumuria soongorica, with corresponding sheltering ranges of 0.5–4 H, 0.5–3 H, and 0.5–2 H, respectively. In addition, A. desertorum formed a vortex within the inter-row space. This vortex extended from the rear of the first row, covering a range of approximately 1–4 H.
According to aerodynamic principles, the formation mechanisms of different vortices can be explained as follows: the vortices formed behind the double row of shrubs result from the shrubs acting as obstacles that deflect airflow. As airflow passes over the tops of the shrubs, it is momentarily accelerated due to the Venturi effect. The accelerated flow then descends, forming a low-pressure zone on the leeward side due to inertial effects. Surrounding high-pressure air flows into this low-pressure zone, leading to vortex formation. Consequently, vortex size exhibits a strong positive correlation with shrub height. A vortex was observed between the two rows of Artemisia desertorum, whereas Reaumuria soongorica and Hedysarum scoparium did not exhibit such formations. This difference can be attributed to factors such as canopy porosity and row spacing. Specifically, the sparse branching and low leaf density of Reaumuria soongorica, along with the narrow row spacing of Hedysarum scoparium, were key factors inhibiting vortex formation.

3.2.4. Analysis of Shelter Effect of Different Shrubs

Figure 8 presents the wind speed profiles within the 0–3 m height range at a distance of 1 H behind the second row of shrubs, in comparison with bare sandy ground. Compared to bare sandy land, all three shrub species reduced wind speed, although the magnitude of reduction varied among them. Artemisia desertorum, Reaumuria soongorica, and Hedysarum scoparium (hereafter in the same order) exhibited their maximum wind reduction effect at heights of 0.5 m, 0.1 m, and 0.8 m, respectively. These heights coincide with the vertical strata corresponding to the maximum upwind projected area of each shrub species. The sheltering effect was closely related to the branch frontal area and increased with its width [26]. The effective shelter heights for the three species were 1.5 m, 1.0 m, and 2.1 m, respectively, slightly exceeding the actual heights of the shrubs.
The wind speed profiles of the three shrub species exhibit an approximate vertical “V” shape (Figure 8). The variation in wind speed can be categorized into three distinct stages. In the first stage, wind speed decreases gradually with increasing height, forming a deceleration zone. For Reaumuria soongorica, which exhibits an altar-shaped growth form, the maximum upwind projected area is located near the ground, making this stage less pronounced. Following the minimum wind speed, airflow gradually recovers, forming an acceleration zone. In the final stage, wind speed continues to increase and eventually exceeds that observed over bare sand, forming a recovery zone. Overall, the effective wind reduction height ranges for the three shrub species are 0.2–0.7 m, 0–0.2 m, and 0.7–2.2 m, respectively.
Wind profile data were processed to derive wind speed reduction values at distances of 1 H and 2 H behind the double-row shrub barriers (Table 3). As expected, wind speed reductions at 2 H were lower than those at 1 H for all three shrubs, indicating a gradual decline in the sheltering effect with increasing distance. At 1 H, the average reductions in wind speed were: Hedysarum scoparium (58.09%) > Artemisia desertorum (55.75%) > Reaumuria soongorica (45.76%). The maximum wind speed reductions followed a different pattern: A. desertorum (93.85%) > R. soongorica (87.24%) > H. scoparium (82.90%). The sheltering effect of H. scoparium was relatively uniform across vertical strata, whereas A. desertorum exhibited greater variability, possibly due to its sparse branching structure.
The average wind speed reduction from 1 H to 2 H was greatest for H. scoparium (6.61%), followed by R. soongorica (2.59%) and A. desertorum (1.80%). This suggests that the shelter effect of H. scoparium diminishes more rapidly with distance, whereas A. desertorum provides a more sustained reduction in wind speed. The three shrubs exhibited optimal sheltering effects at different vertical strata: low (0–0.2 m), middle (0.2–0.7 m), and high (0.7–2.2 m) layers, respectively. H. scoparium exhibited the longest sheltering distance, attributable to its greater height, lower canopy porosity, and distinctive morphology. A. desertorum Spreng provided intermediate sheltering, while R. soongorica was the least effective in terms of distance.

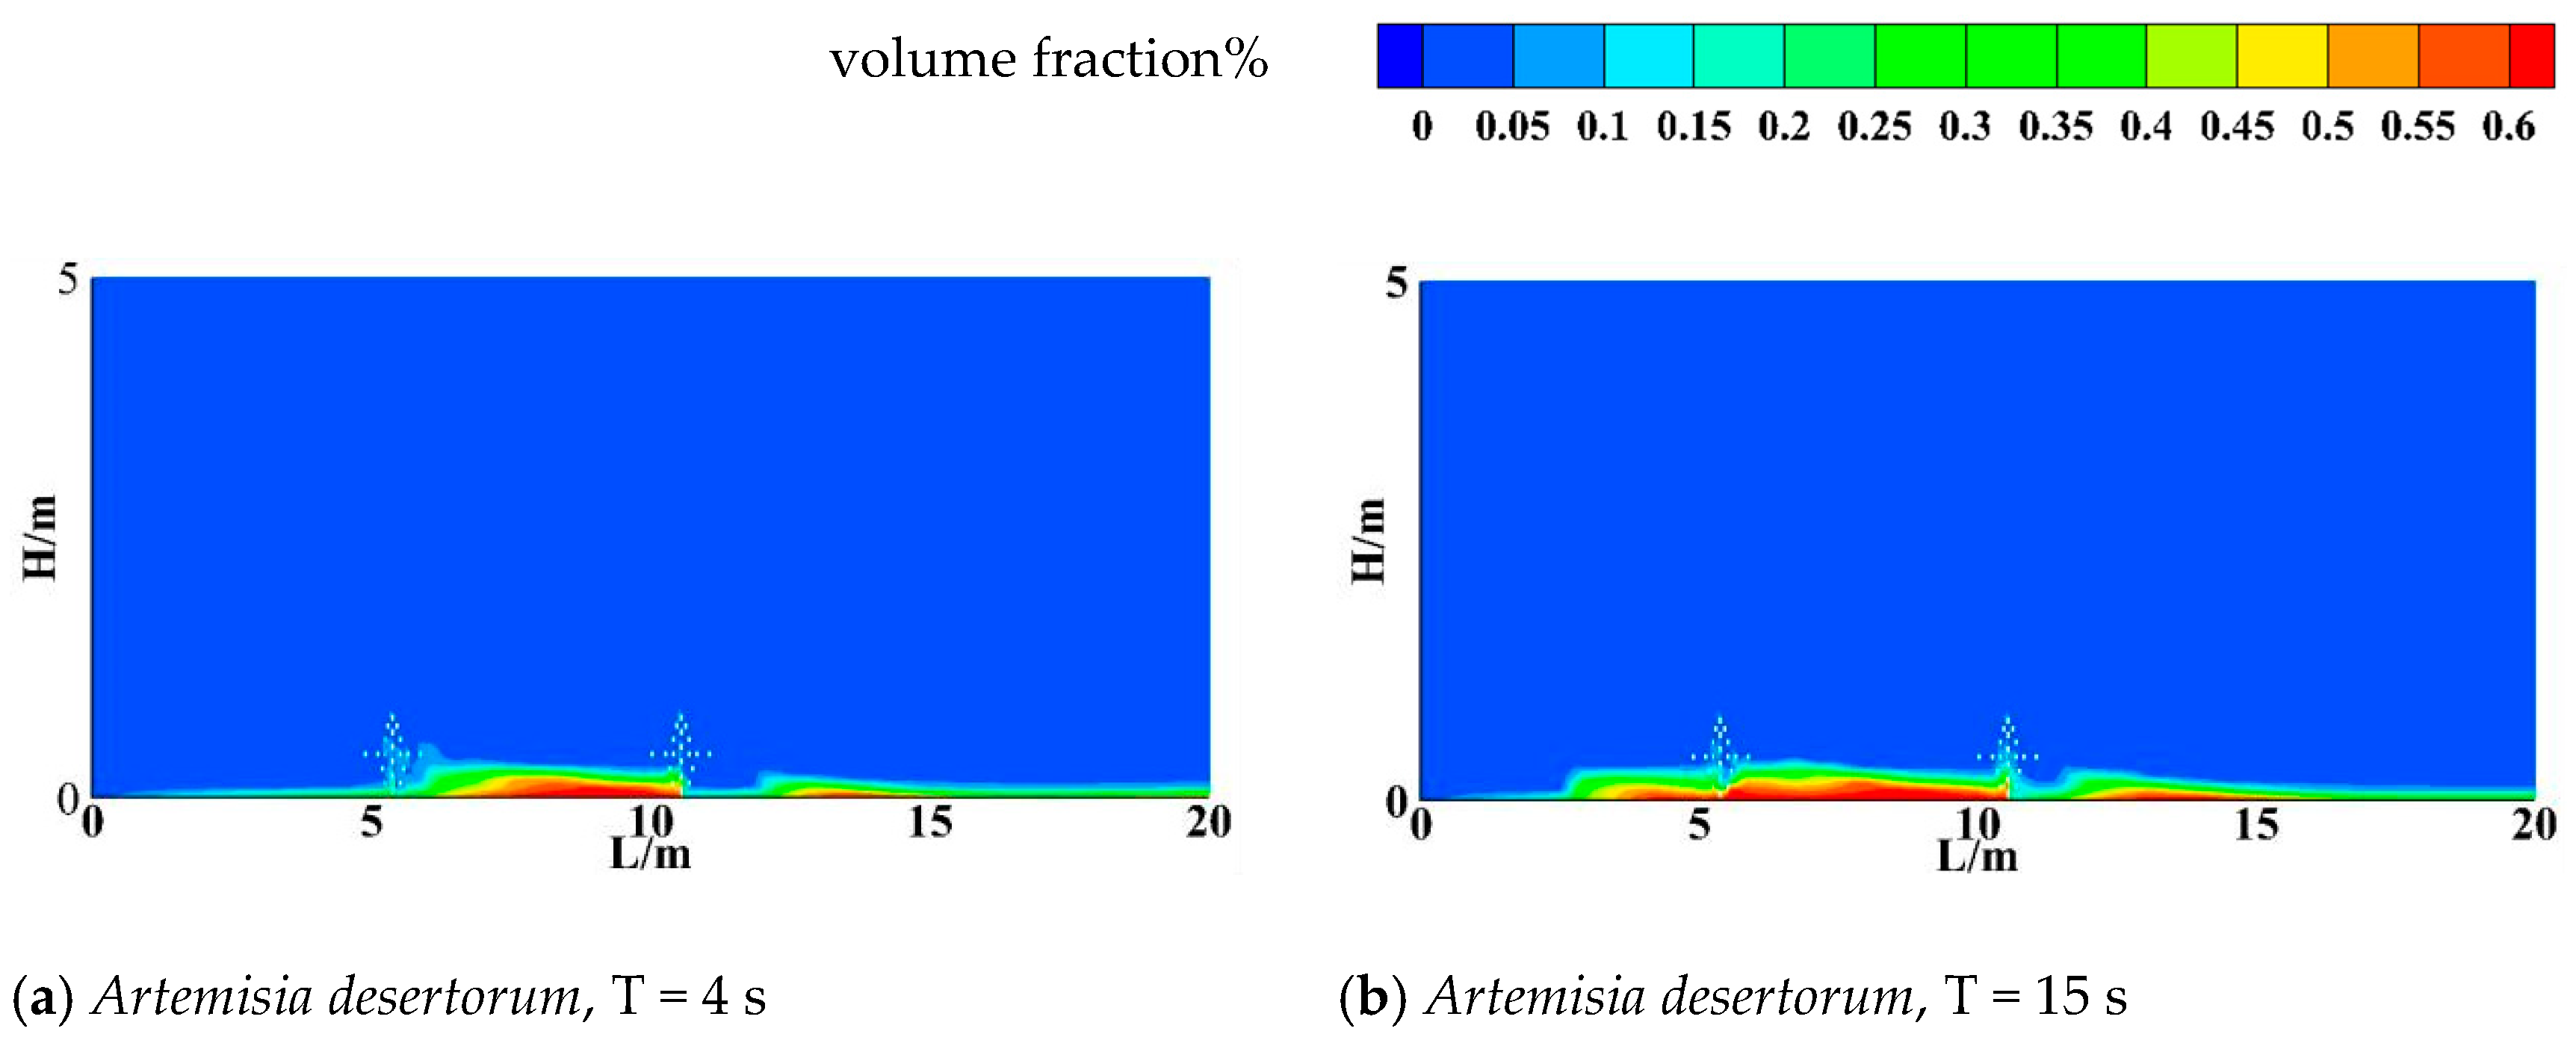
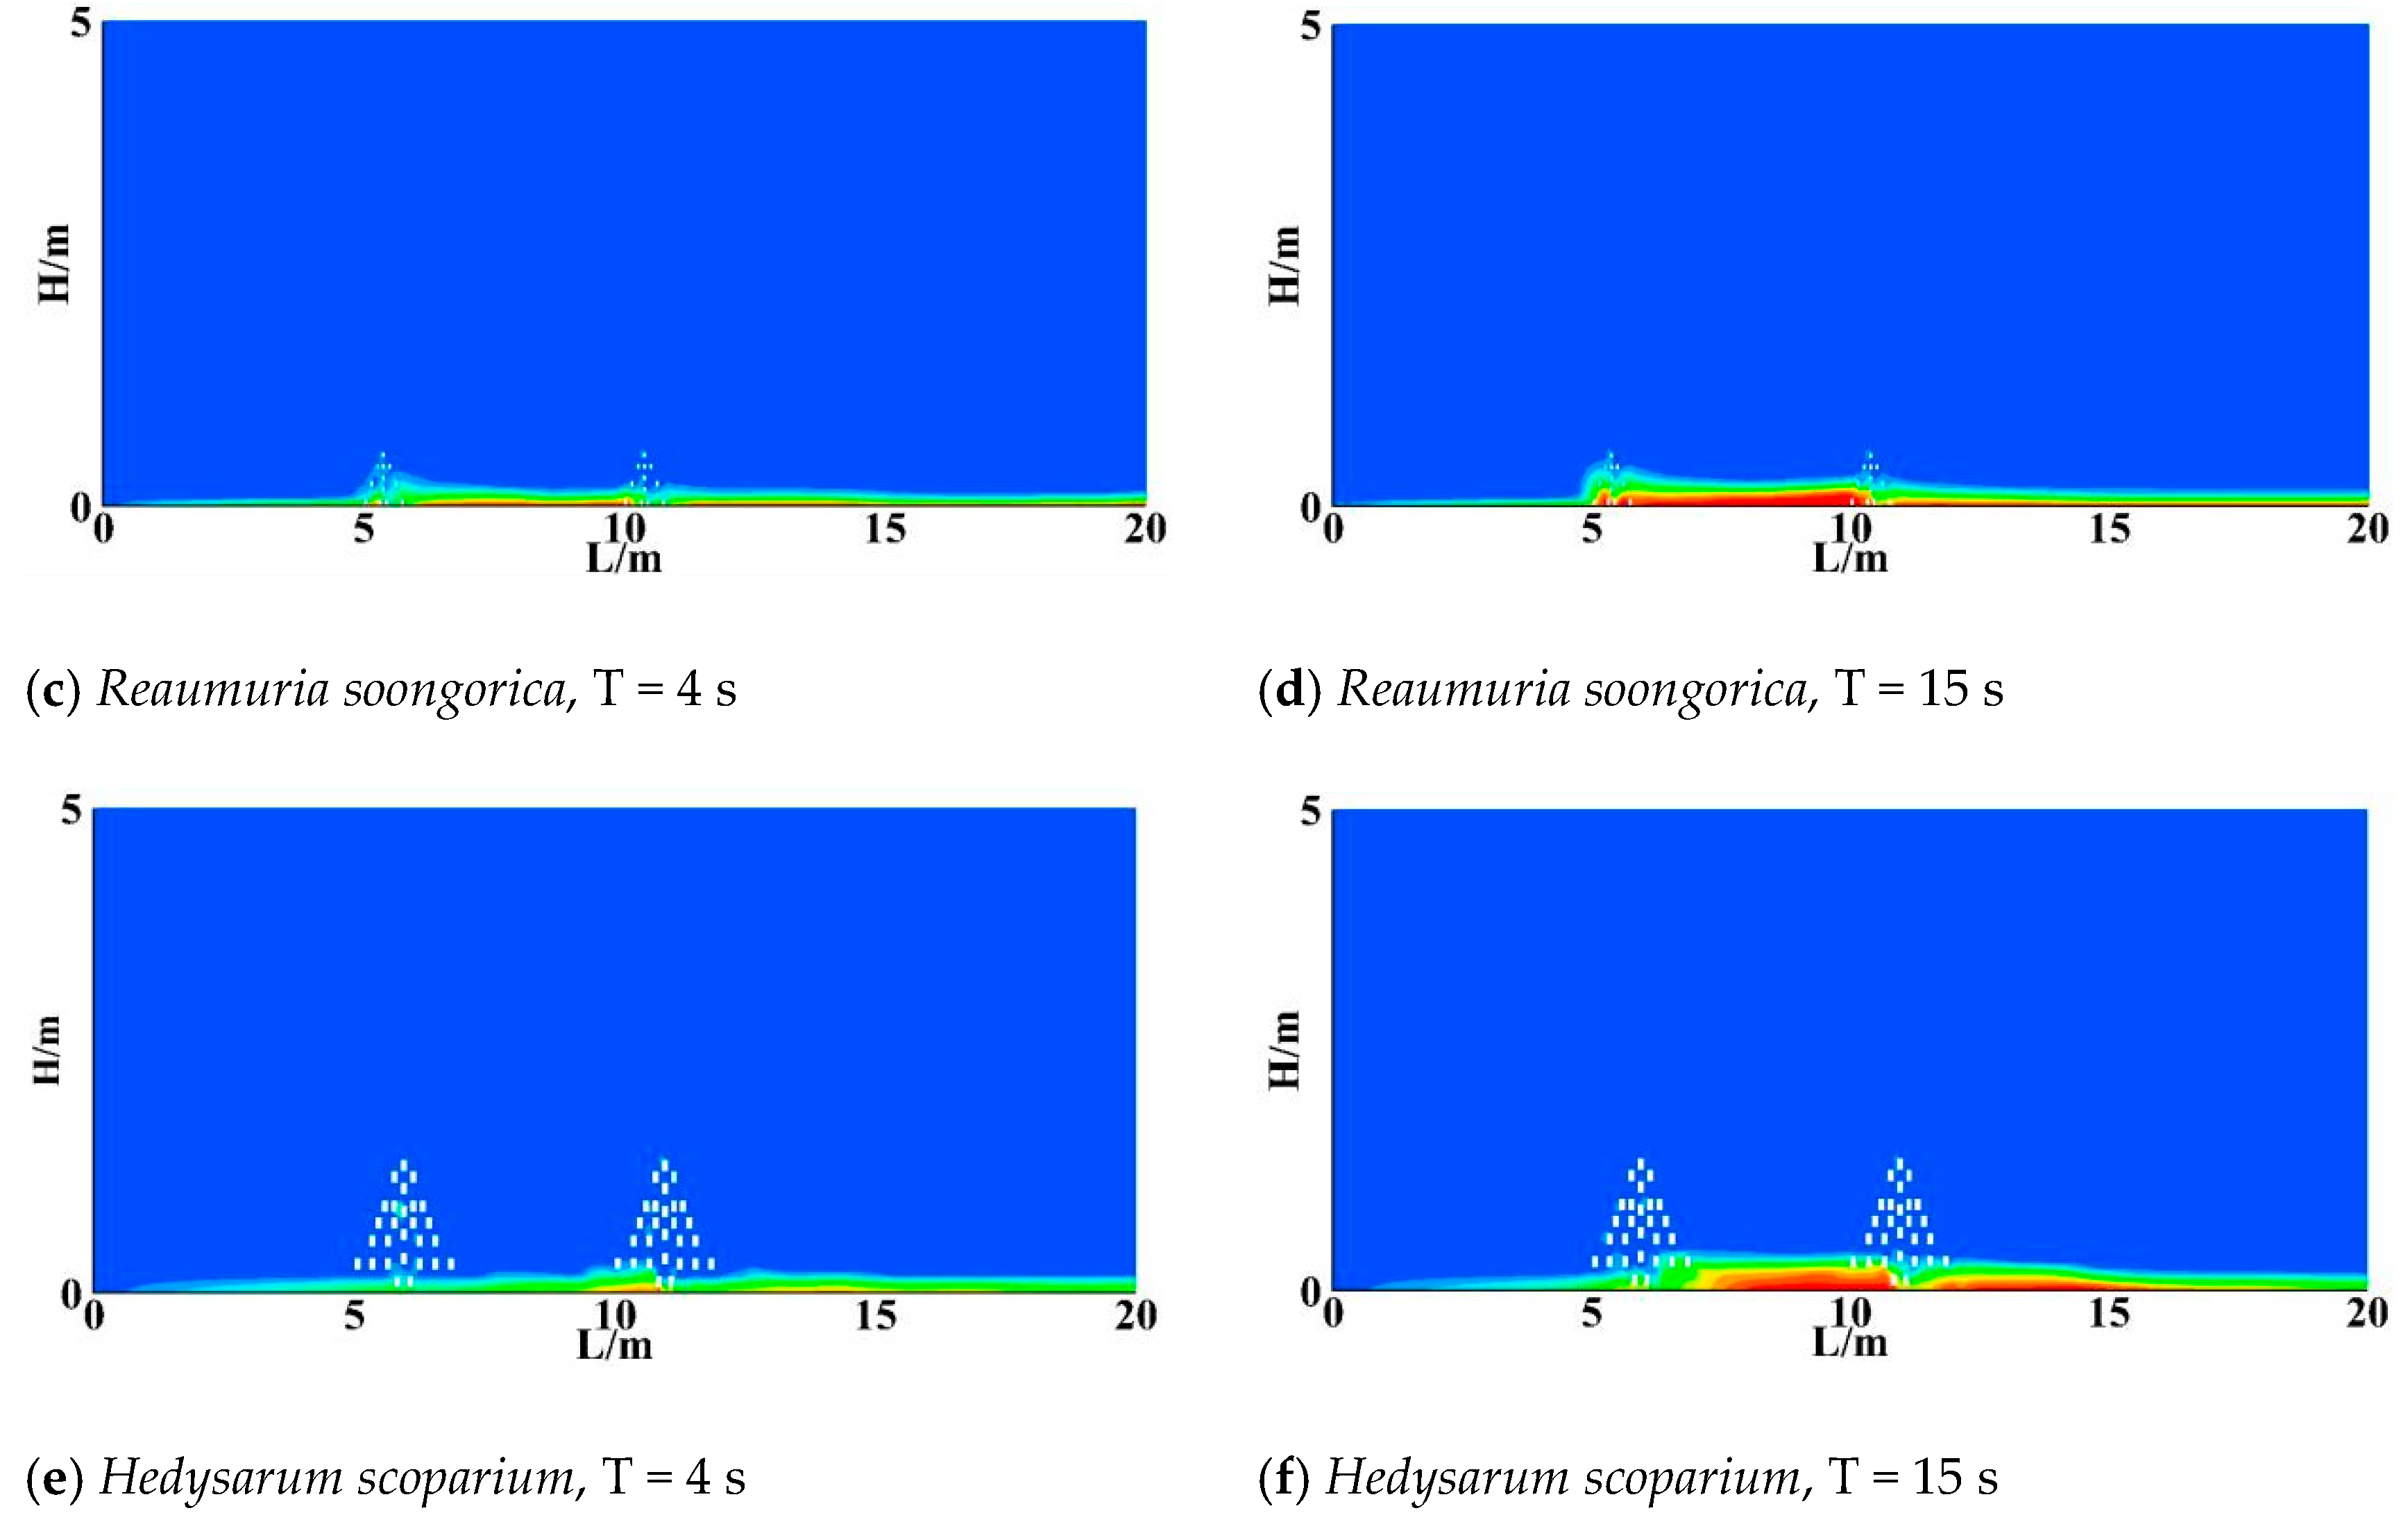
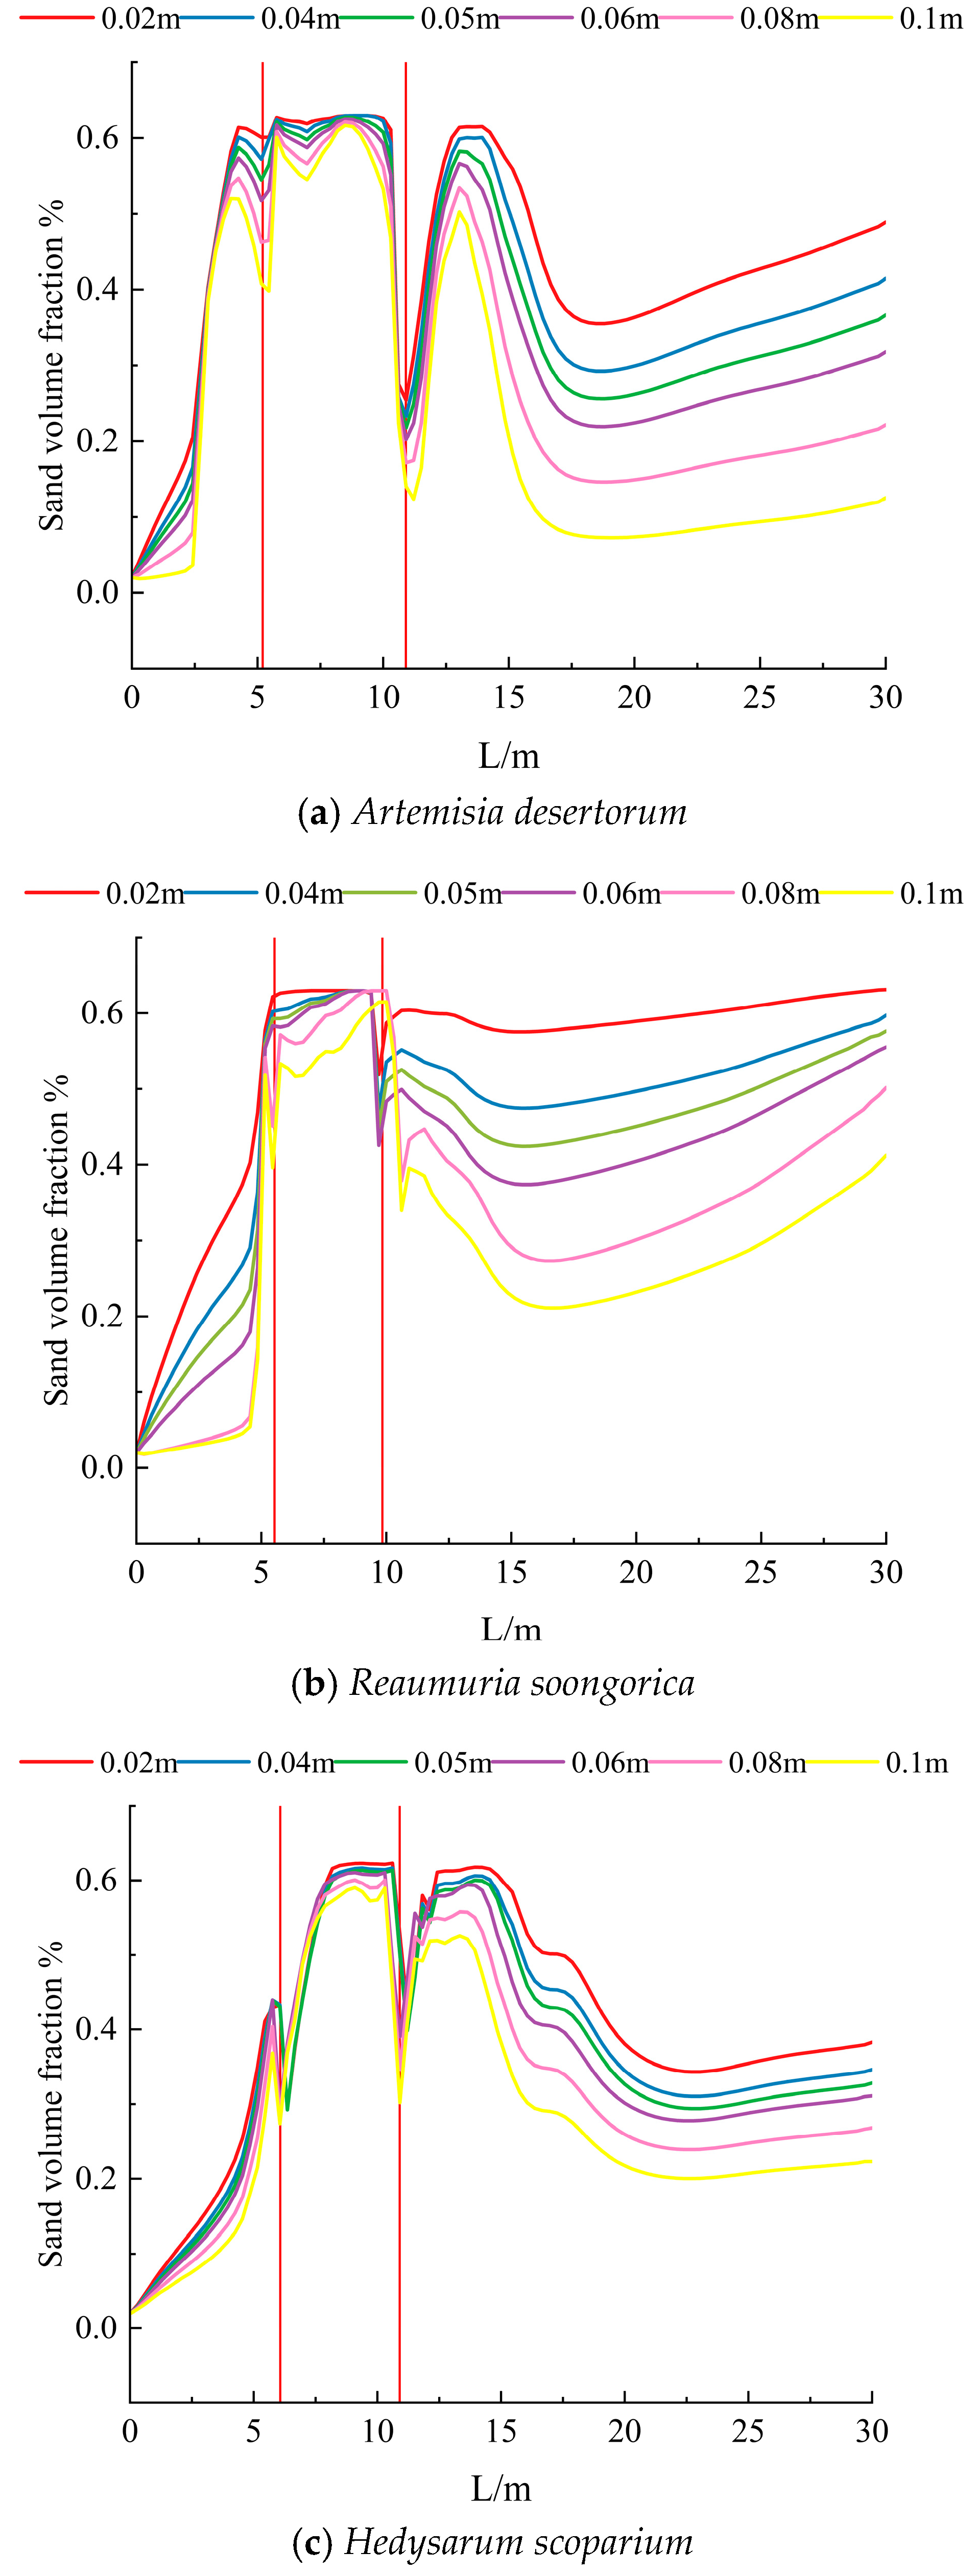
3.3. Sand Resistance of Different Shrubs

When wind speed exceeds the threshold value, aerodynamic forces overcome the gravitational and frictional forces acting on sand particles, initiating creeping, saltation, and suspension—collectively forming an aeolian sand flow. The interaction between sand-laden airflow and shrub barriers induces aerodynamic effects that alter the flow field, leading to localized sediment deposition and the formation of coppice dunes around the shrub bases [27]. To evaluate the sand resistance capacity of different shrubs, sediment accumulation was measured at t = 4 s and t = 15 s under a wind speed of 6 m/s.
As shown in Figure 9, at t = 4 s, sand particles primarily accumulated between the two rows of shrubs and immediately downwind. A. desertorum exhibited the most pronounced sand deposition between shrub rows, while deposition patterns around Reaumuria soongorica and Hedysarum scoparium were relatively similar. By t = 15 s, the amount of deposited sand had increased substantially for all three species. The aeolian sediment deposition extended 3 H, 1 H, and 2 H downwind of A. desertorum, R. soongorica, and H. scoparium, respectively. Correspondingly, the maximum deposition heights increased from 0.4 m, 0.2 m, and 0.2 m to 0.5 m, 0.4 m, and 0.5 m. Additionally, sand deposition was observed upwind of the A. desertorum windbreak, extending approximately 2 H, corresponding to the region of airflow deceleration.
The initial sand bed thickness was set to 0.05 m in the simulation. In this study, a single particle size setting was used for sand. The theoretical maximum packing density for spherical particles is approximately 0.63. However, natural sand grains are irregular in shape, leading to a slightly lower packing limit. Based on the research of Liu et al. [28], the maximum deposition rate of sand particles with a single particle size is 0.625. Therefore, in this study, the initial deposition rate is set to 0.625.
Wind accumulation was considered to occur in regions where the height exceeded 0.05 m and the sand volume fraction approached 0.625, while wind erosion occurred in areas where the height was below 0.05 m and the volume fraction fell below this threshold. Figure 10 shows the along-stream bed accumulation rates of the three shrub species at heights of 0.02 m, 0.04 m, 0.05 m, 0.06 m, 0.08 m and 0.1 m. All three shrub types exhibited a local minimum in volume fraction at approximately 5 m from the inlet (see Figure 10), indicating reduced wind erosion due to the shelter effect. Artemisia desertorum exhibited the highest sand accumulation rate, suggesting the strongest sand-blocking capacity at this stage. Wind accumulation primarily occurred between the two rows of shrubs, with aeolian deposition ranges of 7.5–8.5 m, 9–10 m, and 7–10 m from the inlet for A. desertorum, R. soongorica, and H. scoparium, respectively. Maximum accumulation values for A. desertorum and R. soongorica occurred at 2 H and 1 H downwind of the shrubs. However, in these regions, volume fractions above 0.05 m height remained below 0.625, suggesting that while wind erosion was reduced, true aeolian deposition was not achieved. In contrast, H. scoparium exhibited a sand volume fraction close to 0.625 within the 0.05 m and lower height layers at 1–3 H downwind, indicating substantial accumulation and the formation of a coppice dune.
Overall, the aeolian deposition efficiency of the shrubs reduced wind erosion both upwind and downwind. Wind accumulation occurred between the double shrub rows and in the downwind area of Hedysarum scoparium. However, variations in plant architecture led to differences in the sand resistance capabilities of the three shrub species, with Hedysarum scoparium and Artemisia desertorum exhibiting stronger sand resistance performance, while Reaumuria soongorica showed relatively weaker effectiveness.

4. Discussion

Desert plants exhibit specialized xerophytic adaptations, such as morphological modifications and water-retention mechanisms, enabling them to survive extreme heat and aridity in desert environments. The unique morphology of desert plant components, distinct from typical plant architectures, plays a critical role in determining their effectiveness in resisting wind and sand [29]. In this study, CFD simulations revealed that when desert shrubs are arranged in a double row, the surrounding flow field is divided into five distinct zones: deceleration zone, acceleration zone, transition zone, vortex zone, and restoration zone. Among these, the vortex zone plays a critical role in mitigating wind speed and promoting sand deposition. As sand-laden airflow passes over the shrubs, it undergoes transient acceleration due to the Venturi effect. It then descends due to inertia and gravity, forming a low-pressure zone on the leeward side. Air from surrounding high-pressure regions flows into this zone, resulting in vortex formation. The extent of the vortex showed a positive correlation with the height of the shrub subcanopy. Wind speed profiles exhibited an approximate vertical “V” pattern, with the greatest wind speed reduction occurring at the height corresponding to the maximum upwind projected area, typically where branch and leaf density is highest. Reaumuria soongorica, A. desertorum, and Hedysarum scoparium achieved optimal shelter effects at low (0–0.2 m), middle (0.2–0.7 m), and high (0.7–2.2 m) height strata, respectively.
The aeolian deposition efficiency of shrubs is closely linked to their wind-sheltering mechanisms. A reduction in wind velocity decreases the capacity to fix sand but increases the rate of sand deposition. The synergistic effect between the two rows of shrubs reduces wind speed by over 80%, thereby promoting sediment accumulation of the three studied shrub species. Variations in plant architecture and canopy dimensions led to differences in the spatial extent of wind-induced sediment accumulation. The wind accumulation ranges for the three shrub species were 7.5–8.5 m, 9–10 m, and 7–10 m, respectively. Additionally, wind accumulation for Hedysarum scoparium was observed in the downwind zone. Wind erosion was mitigated on the leeward sides of Artemisia desertorum and Reaumuria soongorica, though no significant wind accumulation was observed. Overall, all three shrubs reduced wind erosion in both upwind and downwind zones. Hedysarum scoparium exhibited the highest sand resistance, followed by Artemisia desertorum, while Reaumuria soongorica showed the weakest performance.
Windbreak configuration becomes a critical factor influencing soil wind erosion under conditions of low vegetation cover [30]. For example, Yang Wenbin et al. [31] investigated the windbreak and sand-fixation performance of Caragana korshinskii under three horizontal configurations: belt-shaped rows, evenly spaced rows, and randomly distributed patterns. Their results showed that under conditions of low vegetation coverage, the two-row belt configuration was the most effective. In the present study, A. desertorum, R. soongorica, and H. scoparium were found to exhibit different optimal sheltering height ranges. For windbreak construction, a mixed-species planting strategy may be employed. A two-row belt configuration that combines Hedysarum scoparium and Reaumuria soongorica can leverage the complementary sheltering capacities of shrubs with different height profiles.
Owing to computational limitations, a two-dimensional (2D) model was adopted in this study. However, actual aeolian sand transport involves complex three-dimensional (3D) turbulent vortices that cannot be accurately captured within a 2D framework. As a result, predictions of near-surface wind velocity profiles and sand particle suspension heights may be less accurate than those derived from 3D simulations. In addition, a simplified wind velocity profile was applied in the simulation, which neglected the influence of vegetation and topography on actual wind fields. Moreover, long-term simulations of sediment accumulation dynamics were not conducted. Future work will aim to overcome these limitations through three-dimensional modeling and experimental validation.

5. Conclusions

All three shrubs were arranged in a staggered double-row configuration during the simulation. The Eulerian two-fluid model was employed in these simulations. The model was validated using wind tunnel experiments, and the main conclusions are as follows:
(1)
The airflow field around the shrubs was divided into five distinct zones: the deceleration zone, acceleration zone, transition zone, vortex zone, and restoration zone. The effective wind speed reduction distances downwind of the three shrub species reached up to 7 H, 6 H, and 6 H, respectively. Fan-shaped deceleration zones were observed upwind of all three shrub species, with the maximum width of the deceleration zone reaching 5 m. The sheltering effect widths of the three shrubs were 3 m, 3 m, and 8 m, respectively.
(2)
All three shrub species generated vortices in the wake region behind the vegetation. However, the intensity of these vortices varied depending on differences in plant architecture and canopy size. The effective wind sheltering ranges were as follows: Artemisia desertorum (0.5–4 H), Reaumuria soongorica (0.5–3 H), and Hedysarum scoparium (0.5–2 H). Additionally, Artemisia desertorum generated an intermediate vortex between the two rows of shrubs, extending from 1 H to 4 H behind the first row.
(3)
The wind velocity profiles behind the shrubs exhibited a characteristic vertical “V” shape. The maximum reduction in wind speed occurred at the same height stratum as the maximum upwind projected area of the shrubs. The optimal wind resistance heights varied among shrub species: Reaumuria soongorica, Artemisia desertorum, and Hedysarum scoparium achieved the most effective wind sheltering at low (0–0.2 m), medium (0.2–0.7 m), and high (0.7–2.2 m) height layers, respectively.
(4)
All three shrub species exhibited wind-driven sand deposition between the two shrub rows. The wind accumulation ranges were 7.5–8.5 m, 9–10 m, and 7–10 m for R. soongorica, A. desertorum, and H. scoparium, respectively. Hedysarum scoparium additionally exhibited aeolian sediment deposition on the leeward side of the shrubs. Overall, the three shrub species reduced wind erosion both upwind and downwind of the windbreak zones. Hedysarum scoparium exhibited the strongest sand resistance, followed by A. desertorum, while Reaumuria soongorica showed the weakest performance.
This study offers theoretical insights for mitigating aeolian environmental degradation, with practical implications for the protection of energy and transportation infrastructure in desert regions and the advancement of sustainable agricultural practices in arid environments.

Author Contributions

H.Z.: Conceptualization, methodology, software, formal analysis, writing—original draft preparation, visualization; L.P.: writing—review and editing; J.L.: writing—review and editing; F.W.: writing—review and editing; Z.Y.: supervision, project administration. All authors have read and agreed to the published version of the manuscript.

Funding

This research was funded by Xinjiang Soil and Water Conservation Supervision and Management Project, grant number 213031003.

Institutional Review Board Statement

Not applicable.

Informed Consent Statement

Not applicable.

Data Availability Statement

Data are contained within the article.

Conflicts of Interest

The authors declare no conflicts of interest.

References

  1. Zheng, X.; Zhu, J.; Xing, Z. Assessment of the effects of shelterbelts on crop yields at the regional scale in Northeast China. Agric. Syst. 2016, 143, 49–60. [Google Scholar] [CrossRef]
  2. Zhang, K.; Qu, J.; Zhang, X.; Zhao, L.; Li, S. Protective efficiency of railway arbor-shrub windbreak forest belts in Gobi regions: Numerical simulation and wind tunnel tests. Front. Environ. Sci. 2022, 10, 885070. [Google Scholar] [CrossRef]
  3. Song, C.; Yu, Q.; Wang, R.; Cui, G. Radiating Benefit of Windbreak and Sand Fixation in the Baijitan Nature Reserve of Lingwu, Ningxia, China. Sustainability 2021, 13, 3508. [Google Scholar] [CrossRef]
  4. Cheng, H.; Liu, C.; Zou, X.; Li, H.; Kang, L.; Liu, B.; Li, J. Wind erosion rate for vegetated soil cover: A prediction model based on surface shear strength. Catena 2020, 187, 104398. [Google Scholar]
  5. Zhao, Y.; Wu, J.; He, C.; Ding, G. Linking wind erosion to ecosystem services in drylands: A landscape ecological approach. Landsc. Ecol. 2017, 32, 2399–2417. [Google Scholar] [CrossRef]
  6. San, B.; Wang, Y.; Qiu, Y. Numerical simulation and optimization study of the wind flow through a porous fence. Environ. Fluid Mech. 2018, 18, 1057–1075. [Google Scholar] [CrossRef]
  7. Wu, Y.; Jin, A.; Jiang, J. Numerical Simulation and Parameter Optimization of a New Slant Insertion-Opening Combination Sand Fence. Sustainability 2024, 16, 8651. [Google Scholar] [CrossRef]
  8. Huang, H. Modeling the inhibition effect of straw checkerboard barriers on wind-blown sand. Earth Surf. Dyn. 2023, 11, 167–181. [Google Scholar] [CrossRef]
  9. Okin, G.S. A new model of wind erosion in the presence of vegetation. J. Geophys. Res. Earth Surf. 2008, 113. [Google Scholar] [CrossRef]
  10. Liu, Y.; Yin, Z.; Yan, Q.; Zhang, C. Numerical simulation of the windbreak and sand-fixation effects of Tamarix chinensis. Arid Zone Res. 2024, 41, 1887–1897. (In Chinese) [Google Scholar]
  11. Yan, Q.; Li, J.; Yin, Z.; Liu, J.; Liu, H. Numerical simulation of the influence of typical shrub types on wind-sand flow field. Arid Zone Res. 2023, 40, 785–797. [Google Scholar]
  12. Liu, J.; Li, J.; Yin, Z.; Liu, H. Numerical simulation of the impact of typical plant types of sandy shrubs on wind and sand flow fields. Arid Reg. Res. 2022, 39, 1514–1525. [Google Scholar]
  13. Huang, S.; Ma, T.; Jiang, F.; Nie, F.; Wang, X.; Ma, T. Numerical simulation and field study on predicting wind-blown sand accumulation in sand mitigation measures of the Ganquan railway. Front. Earth Sci. 2024, 12, 1443030. [Google Scholar] [CrossRef]
  14. Sun, D.; Dawson, R.; Li, B. Agricultural causes of desertification risk in Minqin, China. J. Environ. Manag. 2006, 79, 348–356. [Google Scholar]
  15. Chang, Z.; Duan, X.; Han, F.; Zhong, S.; Wang, Q.; Zhang, J. Stability and Ecological Effects of Main Plant Communities in Minqin Desert Area. Anim. Husb. Feed. Sci. 2015, 7, 191. [Google Scholar]
  16. Liu, H.; Yuan, H.; Wang, D.; Liu, S.; Guo, C.; Ma, R.; Li, X.; Liu, K.; Wan, X.; Li, J. Field observation on windbreak effect of two simulated sand fixing shrubs. Acta Bot. Boreali–Occident. Sin. 2014, 34, 155–159. [Google Scholar]
  17. Yue, X. Flow Field and Sand Particle Phase Movement Characteristics on the Downwind Side of Windbreak and Sand–Fixing Walls. Ph.D. Thesis, Lanzhou University, Lanzhou, China, 2022. [Google Scholar]
  18. Zhang, X.; Xie, S.; Pang, Y. Numerical simulation on wind-sand flow field around railway embankment with different wind angles. Front. Environ. Sci. 2023, 10, 1073257. [Google Scholar] [CrossRef]
  19. Lu, W. Research on the Windbreak and Sand Control Benefits of Typical Individual Shrubs in the Ulan Buh Deser. Master’s Thesis, Beijing Forestry University, Beijing, China, 2019. [Google Scholar]
  20. Morris, H.M., Jr. Flow in rough conduits. Trans. Am. Soc. Civ. Eng. 1955, 120, 373–398. [Google Scholar] [CrossRef]
  21. Liu, J.; Kimura, R.; Miyawaki, M.; Kinugasa, T. Effects of plants with different shapes and coverage on the blown-sand flux and roughness length examined by wind tunnel experiments. Catena 2021, 197, 104976. [Google Scholar] [CrossRef]
  22. Wolfe, S.A.; Nickling, W.G. The protective role of sparse vegetation in wind erosion. Prog. Phys. Geogr. 1993, 17, 50–68. [Google Scholar] [CrossRef]
  23. Wang, G.; Zhou, H.; Wang, W.; Sun, J.; Ma, X. Research Progress on the Correlation between Urban Morphological Indicators and Urban Ventilation at Mesoscopic and Microscopic Scales. Ecol. Sci. 2023, 42, 252–262. [Google Scholar]
  24. Wei, Z. Analysis and Research on the Movement Laws of Windblown Sand. Soil Water Conserv. China 2012, 5, 44–46. [Google Scholar]
  25. Wu, X.; Zou, X.; Zhou, N.; Zhang, C.; Shi, S. Deceleration efficiencies of shrub windbreaks in a wind tunnel. Aeolian Res. 2015, 16, 11–23. [Google Scholar] [CrossRef]
  26. Li, J.; Wang, J.; Jiang, Z.; Chai, W. Spatial Structure and Windbreak Effects of Main Sand Control and Afforestation Tree Species in Minqin County. Res. Soil Water Conserv. 2008, 3, 121–124. [Google Scholar]
  27. Lang, L.; Wang, X.; Hasi, E.; Hua, T. Nebkha (coppice dune) formation and significance to environmental change reconstructions in arid and semiarid areas. J. Geogr. Sci. 2013, 23, 344–358. [Google Scholar] [CrossRef]
  28. Liu, S.; Ha, Z. Prediction of random packing limit for multimodal particle mixtures. Powder Technol. 2002, 126, 283–296. [Google Scholar] [CrossRef]
  29. Liu, C.; Zheng, Z.; Cheng, H.; Zou, X. Airflow around single and multiple plants. Agric. For. Meteorol. 2018, 252, 27–38. [Google Scholar] [CrossRef]
  30. Guo, Z.; Yang, X.; Wu, X.; Zou, X.; Zhang, C.; Fang, H.; Xiang, H. Optimal design for vegetative windbreaks using 3D numerical simulations. Agric. For. Meteorol. 2021, 298, 108290. [Google Scholar] [CrossRef]
  31. Yang, W.; Zhao, A.; Wang, J.; Yao, J.; Tian, Y.; Hu, X.; Yang, H. Study on the Horizontal Configuration Structure and Windbreak and Sand–Fixation Effects of Low–Coverage Artemisia ordosica Clusters. J. Desert Res. 2006, 1, 108–112. [Google Scholar]
Figure 1. Study area map.
Sustainability 17 05481 g001
Figure 2. Flow field diagram.
Sustainability 17 05481 g002
Figure 3. Mesh methodology.
Sustainability 17 05481 g003
Figure 4. Rationality verification of numerical simulation.
Sustainability 17 05481 g004
Figure 5. Distribution of vertical flow field around shrubs.
Sustainability 17 05481 g005
Figure 6. Distribution of horizontal flow field around shrubs.
Sustainability 17 05481 g006
Figure 7. Streamline diagram of the wind around the shrubs.
Sustainability 17 05481 g007
Figure 8. Wind speed profile at a distance of 1 H behind the shrubs.
Sustainability 17 05481 g008
Figure 9. Sand accumulation around shrubs.
Sustainability 17 05481 g009aSustainability 17 05481 g009b
Figure 10. Volume fraction of sand particles at different distances.
Sustainability 17 05481 g010
Table 1. Field survey results.
H1/mC/mH2/mS/mA/m2
A. desertorum0.8480.95–1.040.080.2~0.40.045
R. soongorica0.5530.83–1.070.030~0.10.033
H. scoparium1.4171.95–2.030.120.2~0.40.091
Table 2. Parameters of shrub model.
H1/mC/mH2/mS/mA/m2
A. desertorum0.801.06–1.060.080.2~0.40.042
R. soongorica0.570.76–1.080.030~0.10.039
H. scoparium1.381.80–1.920.120.2~0.40.120
Table 3. Comparison of wind speed reduction.
1 H2 H
Average Wind Speed Reduction %Maximum Wind Speed Reduction %Average Wind Speed Reduction %Maximum Wind Speed Reduction %
A. desertorum55.7593.8553.9593.18
R. soongorica45.7687.2443.1781.94
H. scoparium58.0982.9051.4882.21
Disclaimer/Publisher’s Note: The statements, opinions and data contained in all publications are solely those of the individual author(s) and contributor(s) and not of MDPI and/or the editor(s). MDPI and/or the editor(s) disclaim responsibility for any injury to people or property resulting from any ideas, methods, instructions or products referred to in the content.

