Article

Fewer Clicks, Lower Emissions: Eye-Tracking Analysis of Eco-Friendly Navigation in Tourism Websites

College of Furnishings and Industrial Design, Nanjing Forestry University, Nanjing 210037, China
*
Author to whom correspondence should be addressed.
These authors contributed equally to this work.
Sustainability 2025, 17(12), 5462; https://doi.org/10.3390/su17125462
Submission received: 13 May 2025 / Revised: 7 June 2025 / Accepted: 8 June 2025 / Published: 13 June 2025

Abstract

:
This study investigated the factors influencing search efficiency on travel websites, focusing on the effects of gender, website design, and the distribution of effective versus ineffective areas in page layout on visual search efficiency and task performance. Using eye-tracking technology, three experiments were conducted with 48 participants (19 males, 29 females; Mage = 26.73). Among the tested websites, TC exhibited the highest efficiency in task completion time, followed by QN and TN (40.10 s < 83.88 s < 95.27 s). Analysis of fixation distributions indicated that participants focused on effective areas at rates of 20.53% (TC), 55.31% (QN), and 62.42% (TN), underscoring the significant impact of effective and interference area distribution on search efficiency. These findings provide empirical evidence for optimizing travel website design through visual layout improvements to enhance information retrieval and user experience, with TC serving as a prime example of a site with lower cognitive load that better aligns with sustainable tourism principles.

1. Introduction

1.1. Background

Website carbon emissions are an important but often overlooked aspect of digital pollution. Websites generate approximately 1.6 billion tons of greenhouse gases each year, equivalent to the carbon emissions of the aviation industry. A single page load of each website generates 0.6 g of carbon dioxide. If there are approximately 1000 page visits per month, page loads alone in one year may release 72 kg of carbon dioxide. Media files are the main factor in emissions, accounting for 90% of the total weight of web pages [1]. Carbon emissions could be reduced through optimization methods such as image optimization, efficient coding, and green web hosting. If all websites around the world carried out such optimizations, carbon dioxide emissions could be reduced by tens of millions of tons every year. We have the responsibility to understand and reduce the carbon emissions of websites in order to address digital pollution and protect the environment.
Among numerous types of websites, tourism websites hold a special position. They are essential digital platforms for travelers to gather information and make travel decisions. Efficient information search plays a critical role in enhancing user experience on these platforms. From 2019 to 2022, the tourism industry faced significant challenges due to the COVID-19 pandemic, which caused a sharp decline in traveler numbers and a prolonged market downturn. However, with the gradual containment of the pandemic and the subsequent easing of restrictions, cultural and tourism activities have shown notable recovery. In particular, China has experienced a substantial increase in domestic tourist volumes, accompanied by a growing trend toward diversification in the tourism consumption market. In the post-pandemic era, travelers increasingly rely on online platforms, such as social media and travel websites, to make informed decisions about their travel plans. This shift underscores the importance of optimizing the design and usability of digital platforms to enhance user experience and meet the evolving needs of modern travelers. The efficient search function on travel websites is crucial not only for improving user experience but also for reducing website load and boosting the sustainability of tourism websites.

1.2. Literature Review

Although digital technology provides support for climate action, its energy consumption and carbon emissions cannot be ignored [2]. The development of the Internet has promoted economic growth while also bringing about an increase in energy consumption. The carbon emissions of the Internet mainly come from the operation of data centers, network infrastructure, and the use of terminal devices. Data centers consume a large amount of electricity to operate servers and cooling systems, accounting for approximately 2% of global greenhouse gas emissions. The process of network transmission, especially high-bandwidth applications such as video streaming and file downloading, also leads to significant energy consumption. The manufacturing, use, and disposal of terminal equipment also contribute to carbon emissions [3]. We have the responsibility to gain a thorough understanding of the carbon emissions generated by website behaviors and take active measures to reduce these emissions in order to mitigate the negative impact of the Internet on the environment. Media files such as pictures and videos on websites are usually the main source of data transmission volume. Removing large unnecessary videos, images, scripts, and third-party plugins from websites can reduce data transmission operations and energy consumption. By improving the search function of websites to enable them to return the information needed by users more quickly and accurately, the computing burden of the server can be reduced, and energy consumption can be lowered [4]. In addition, lightweight and responsive web pages that load faster and consume less energy need to be designed. The website must adopt a simple design style, reduce the use of elements such as buttons and animations, and optimize web page layout to improve loading speed. When discussing methods for optimizing the design of tourism websites, optimization strategies from other fields can be drawn upon. Osipov and colleagues proposed in their research that optimizing the production process through machine learning methods can significantly enhance efficiency and reduce resource consumption. Similarly, in the design of tourism websites, applying advanced data analysis and machine learning technologies to optimize page layout and information presentation may also lead to an improvement in user search efficiency and a reduction in website energy consumption [5].
The method of web page information presentation plays an important role in the link between information transmission and user behavior and can affect users’ decisions and behavior. The information on a web page mainly includes text, pictures, audio, and video formats. Adelaar showed that the combination of graphic and text information can significantly enhance consumers’ emotional responses and thus affect their purchasing decisions [6]. When consumers choose products, they are more inclined to visual presentation (pictures) rather than text description. Visual presentation can reduce cognitive load more effectively and help consumers process information faster [7,8]. However, too much or low-quality visual information can lead to negative evaluations of products by consumers, leading to a decline in consumers’ trust in the website, which can, in turn, affect consumption decisions [9]. Lee discussed the inverse effect of abundant picture information on tourism product evaluation. Research has found that when there is too much picture information, users may feel an increased sense of psychological distance, which interferes with users’ retrieval of core information and leads to a negative user experience [10]. Sustainable tourism, in addition to environmental and economic sustainability, also encompasses social and cultural sustainability [11]. Tourism websites, a key link for users to select tourism products, need to have their sustainability considered as well. Too many page elements can lead to users increasing traffic due to failed searches. This can increase the load on tourism websites and affect their sustainability [12].
In website design, the effective area refers to the area where users can quickly obtain information and complete tasks, while the interference area (invalid area) is the area that is not helpful for the completion of user goals and may even distract attention. Visual complexity affects how users perceive and allocate their attention to web pages. Bortko’s research showed that areas with high visual complexity (such as areas with too many advertisements or too many colors) would distract users’ attention and thus become interference areas [13]. By contrast, simplifying the design (such as using white space or a clear layout) can reduce visual distractions and focus the user’s attention on the effective area. Instant feedback and friendly interaction elements (such as buttons and ICONS) in interaction design can enhance the user experience while reducing the impact of invalid areas on user actions [14]. Users usually follow the “F-shaped” or “Z-shaped” pattern when browsing web pages, so placing key information (such as the navigation bar, search box, core content, etc.) at the starting point and midpoint of users’ natural line of sight path can improve the efficiency of users’ visual retrieval [15]. In website design, the distribution of a user’s attention can be analyzed using eye-tracking technology.
Website design is a comprehensive process that involves user interface, information architecture, accessibility, user experience, and visual communication. User interface design directly affects the user’s interactive experience with digital products, and its quality directly affects the user’s stay on the website, interaction frequency, and task completion efficiency. These indicators are key to measuring user engagement [16]. Information architecture is the art and science of organizing and structuring information to help users understand where they are on a website, find what they want, and obtain the information they expect. Good information architecture can enhance user acceptance and satisfaction [17]. Visual communication plays a key role in improving the efficiency of web page information transmission. Visual elements on a web page are not only a means to beautify the page; they also affect the user’s visual attention and understanding of the content of the web page and memory effect [10,18]. Moderate visual appeal can significantly improve the user’s initial impression and sense of trust in a website, but web design with higher visual complexity may increase the user’s cognitive burden [15]. In addition, web design includes important aspects such as interactivity, accessibility, and security [19].
The Internet has become a critical distribution channel for travel companies [20]. With the rise of Web 2.0, tourists are increasingly taking a proactive role in planning their trips, leveraging online resources to make informed decisions [21]. This shift is evident in the growing preference for purchasing airline tickets online rather than through traditional outlets [22]. The convenience of information acquisition plays a partial mediating role between Internet use and tourism consumption behavior, indicating that improvement in information retrieval efficiency can significantly promote tourism consumption [23]. The quality and accessibility of online tourism information significantly affect tourists’ satisfaction and behavioral intention, while the convenience and security of information retrieval are key factors in tourists’ decision making [24]. Uthaisar, Eves, & Wang studied the effects of user-generated content (UGC) and marketing-generated content (MGC) on tourists’ restaurant selection using eye-tracking technology [25]. The research results showed that tourists comprehensively consider graphic information and user evaluation in the process of information retrieval; they not only pay attention to content quality but also rely on visual and interactive experiences.
Web design is a comprehensive process involving the user interface, information architecture, visual communication, and many other aspects. Good design can improve user engagement, information retrieval efficiency, and satisfaction. Web page information presentation has an important impact on user behavior and decision making. However, at present, there are few studies on users’ task completion efficiency and the influence of the division of the effective zone and ineffective zone on user behavior on tourism websites.
The behavioral patterns of users searching information on websites mainly include the following four modes: information search mode, browsing mode, transaction execution mode, and navigation mode. The information retrieval mode involved in this study is transaction execution mode, that is, conducting specific transaction operations on the website. In this behavior mode, users pay more attention to the convenience and efficiency of operations. The process of the user searching for information on the website is as follows: identification of information needs, selection of information sources, information search strategy, and processing and use of information [26,27]. Users’ behavior and task completion efficiency when completing information retrieval tasks on websites are affected by various factors. By optimizing website design, improving users’ Internet experience, clarifying task characteristics, and improving interaction design, users’ task completion efficiency and satisfaction can be significantly improved [28,29,30]. Song and Salvendy proposed an object-oriented model to analyze web browsing experience and designed a keyword-based algorithm to predict users’ browsing behavior in order to improve users’ efficiency in retrieving information [31].
Eye-tracking technology is employed to study the impact of travel website design on user experience. Eye tracking plays a significant role in user experience research by recording users’ visual behaviors in real time, helping researchers understand how users allocate their attention and process information [32]. Eye tracking supports various analytical tools, such as users’ visual focus, fixation counts, dwell time, and heatmaps, which can intuitively display users’ visual focus and behavior patterns, providing a strong basis for optimizing interface design and enhancing user experience [33]. Eye movements have the potential to reveal users’ initial emotional responses, as visual perception is closely linked to emotional processing. Given that physiological responses, including eye movements, are often involuntary, they can serve as reliable indicators of users’ authentic emotional states [34,35]. Eye movement testing can not only provide reliable visual behavior data but also provide standardized data collection methods, which can improve the repeatability of research and the reliability and validity of research results [36]. Alemdag and Cagiltay systematically detailed the application of eye tracking in multimedia learning and analyzed its role in understanding user information processing [37]. Additionally, eye-tracking technology has been instrumental in understanding how users process multimedia content, shedding light on attention patterns and cognitive load during information analysis [21]. These findings underscore the potential of eye tracking to enhance the design and usability of digital platforms. These advantages make eye tracking an indispensable tool in user experience research, effectively enhancing the scientific and practical nature of the research.

1.3. Objective

The primary objective of this study was to explore the impact of travel website design on users’ task completion efficiency. Specifically, the study focuses on two key aspects: (1) the influence of different travel website platforms on users’ task completion performance; (2) the effect of page layout partitioning on task efficiency. By analyzing these factors, this study aims to provide actionable recommendations for optimizing website design, thereby enhancing user experience and task completion efficiency. An efficient and well-designed travel website not only improves the user experience but also reduces its carbon footprint by minimizing unnecessary page loads and energy consumption, thus contributing to environmental sustainability.

2. Methods

2.1. Experiment Design

Travel website interface design plays a critical role in influencing users’ consumption decisions. This study employed a multi-phase approach to evaluate the usability of travel website interfaces.
  • Questionnaire Design and Distribution:
A travel website interface evaluation questionnaire was developed to understand users’ basic interactions with tourism websites. The questionnaire was distributed to 250 individuals who had either traveled or expressed travel intentions within the past three months. The results identified the three most frequently used travel websites: www.Qunar.com (QN), www.Tuniu.com (TN), and www.Ly.com (TC). Additionally, the most commonly used functions on these platforms were ticket booking, hotel search, and travel guidance.
QN: As a leading online travel platform in China, Qunar offers comprehensive travel services like flight tickets and hotel bookings, featuring a user-friendly interface with a clean layout.
TC: Specializing in domestic travel products, Tongcheng provides services such as ticket bookings and hotel reservations. Its well-organized layout minimizes distractions, aiding efficient visual search.
TN: Known for leisure travel products, Tuniu’s website is rich in visual design with numerous images, which might introduce more interference during the search process.
  • Pre-Experiment:
A pre-experiment was conducted with nine participants: three tourism management students, three website designers, and three web design professional teachers. This phase aimed to refine the experimental design and ensure the validity of the procedures.
  • Generalized Test:
The main experiment evaluated the usage efficiency of travel website interfaces through a combination of questionnaire analysis and eye-tracking technology. The study analyzed differences in usage efficiency across various interface designs and compared eye-tracking data to identify user behavior patterns. The experimental process is illustrated in Figure 1.

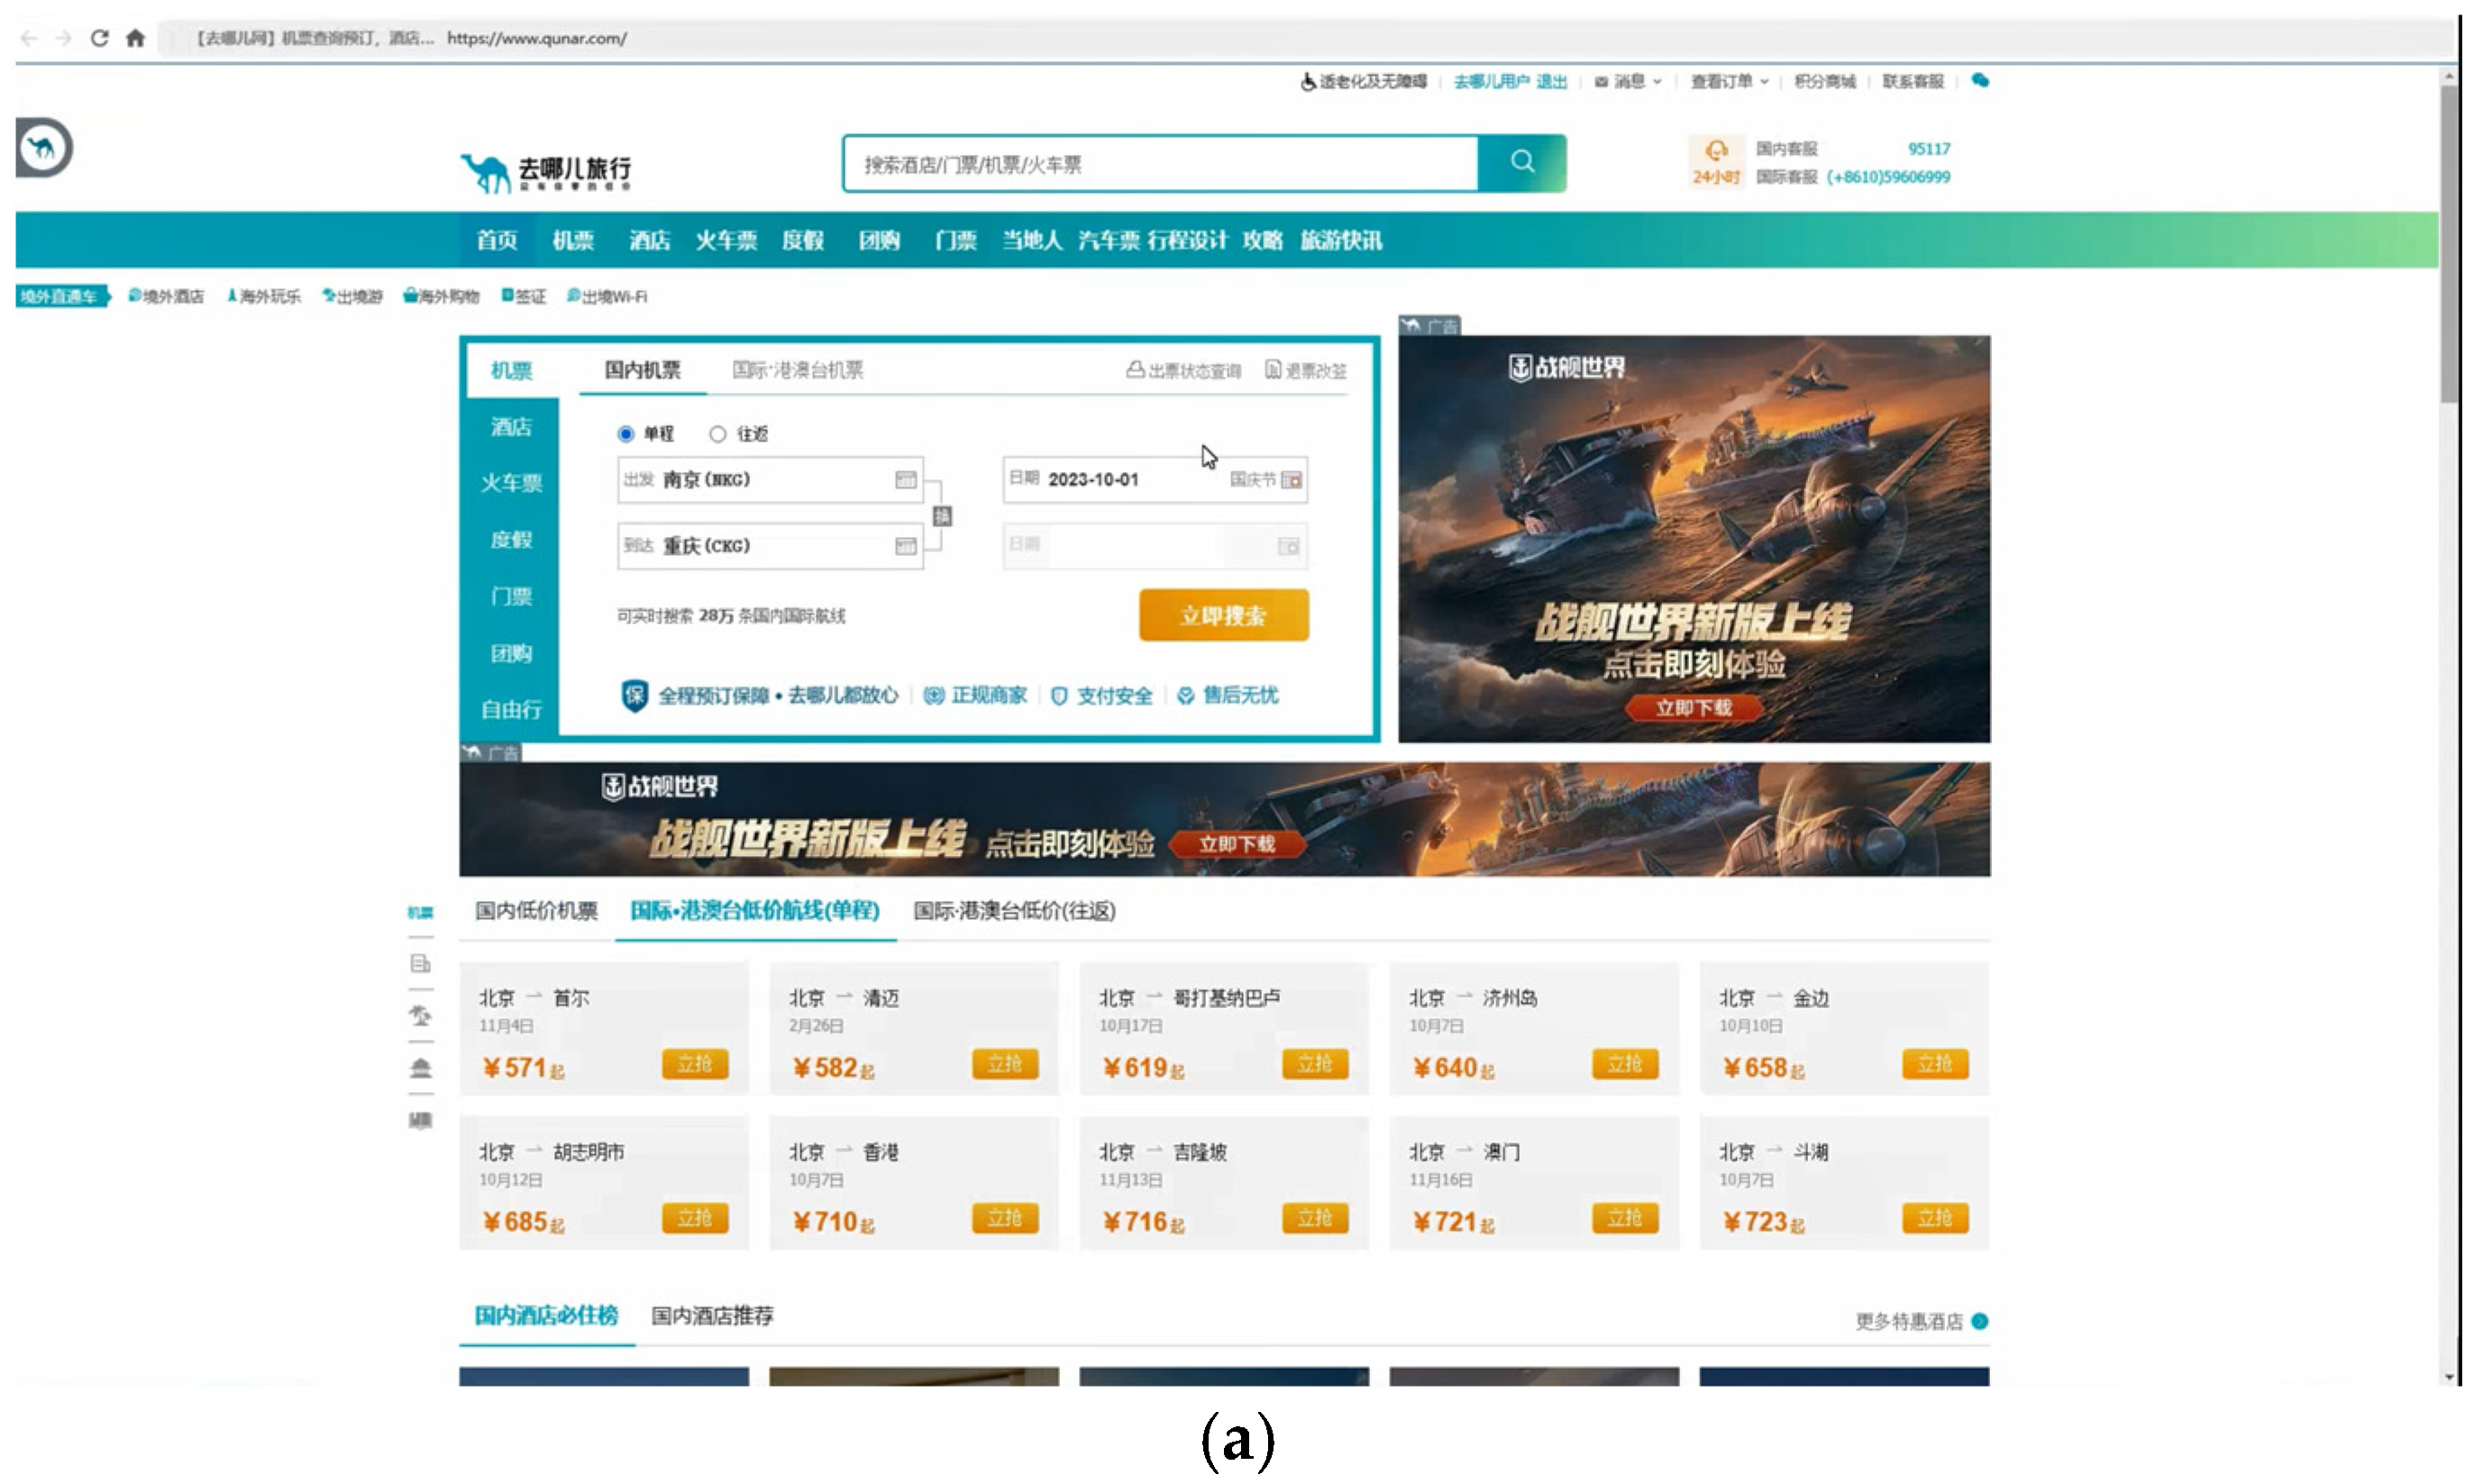
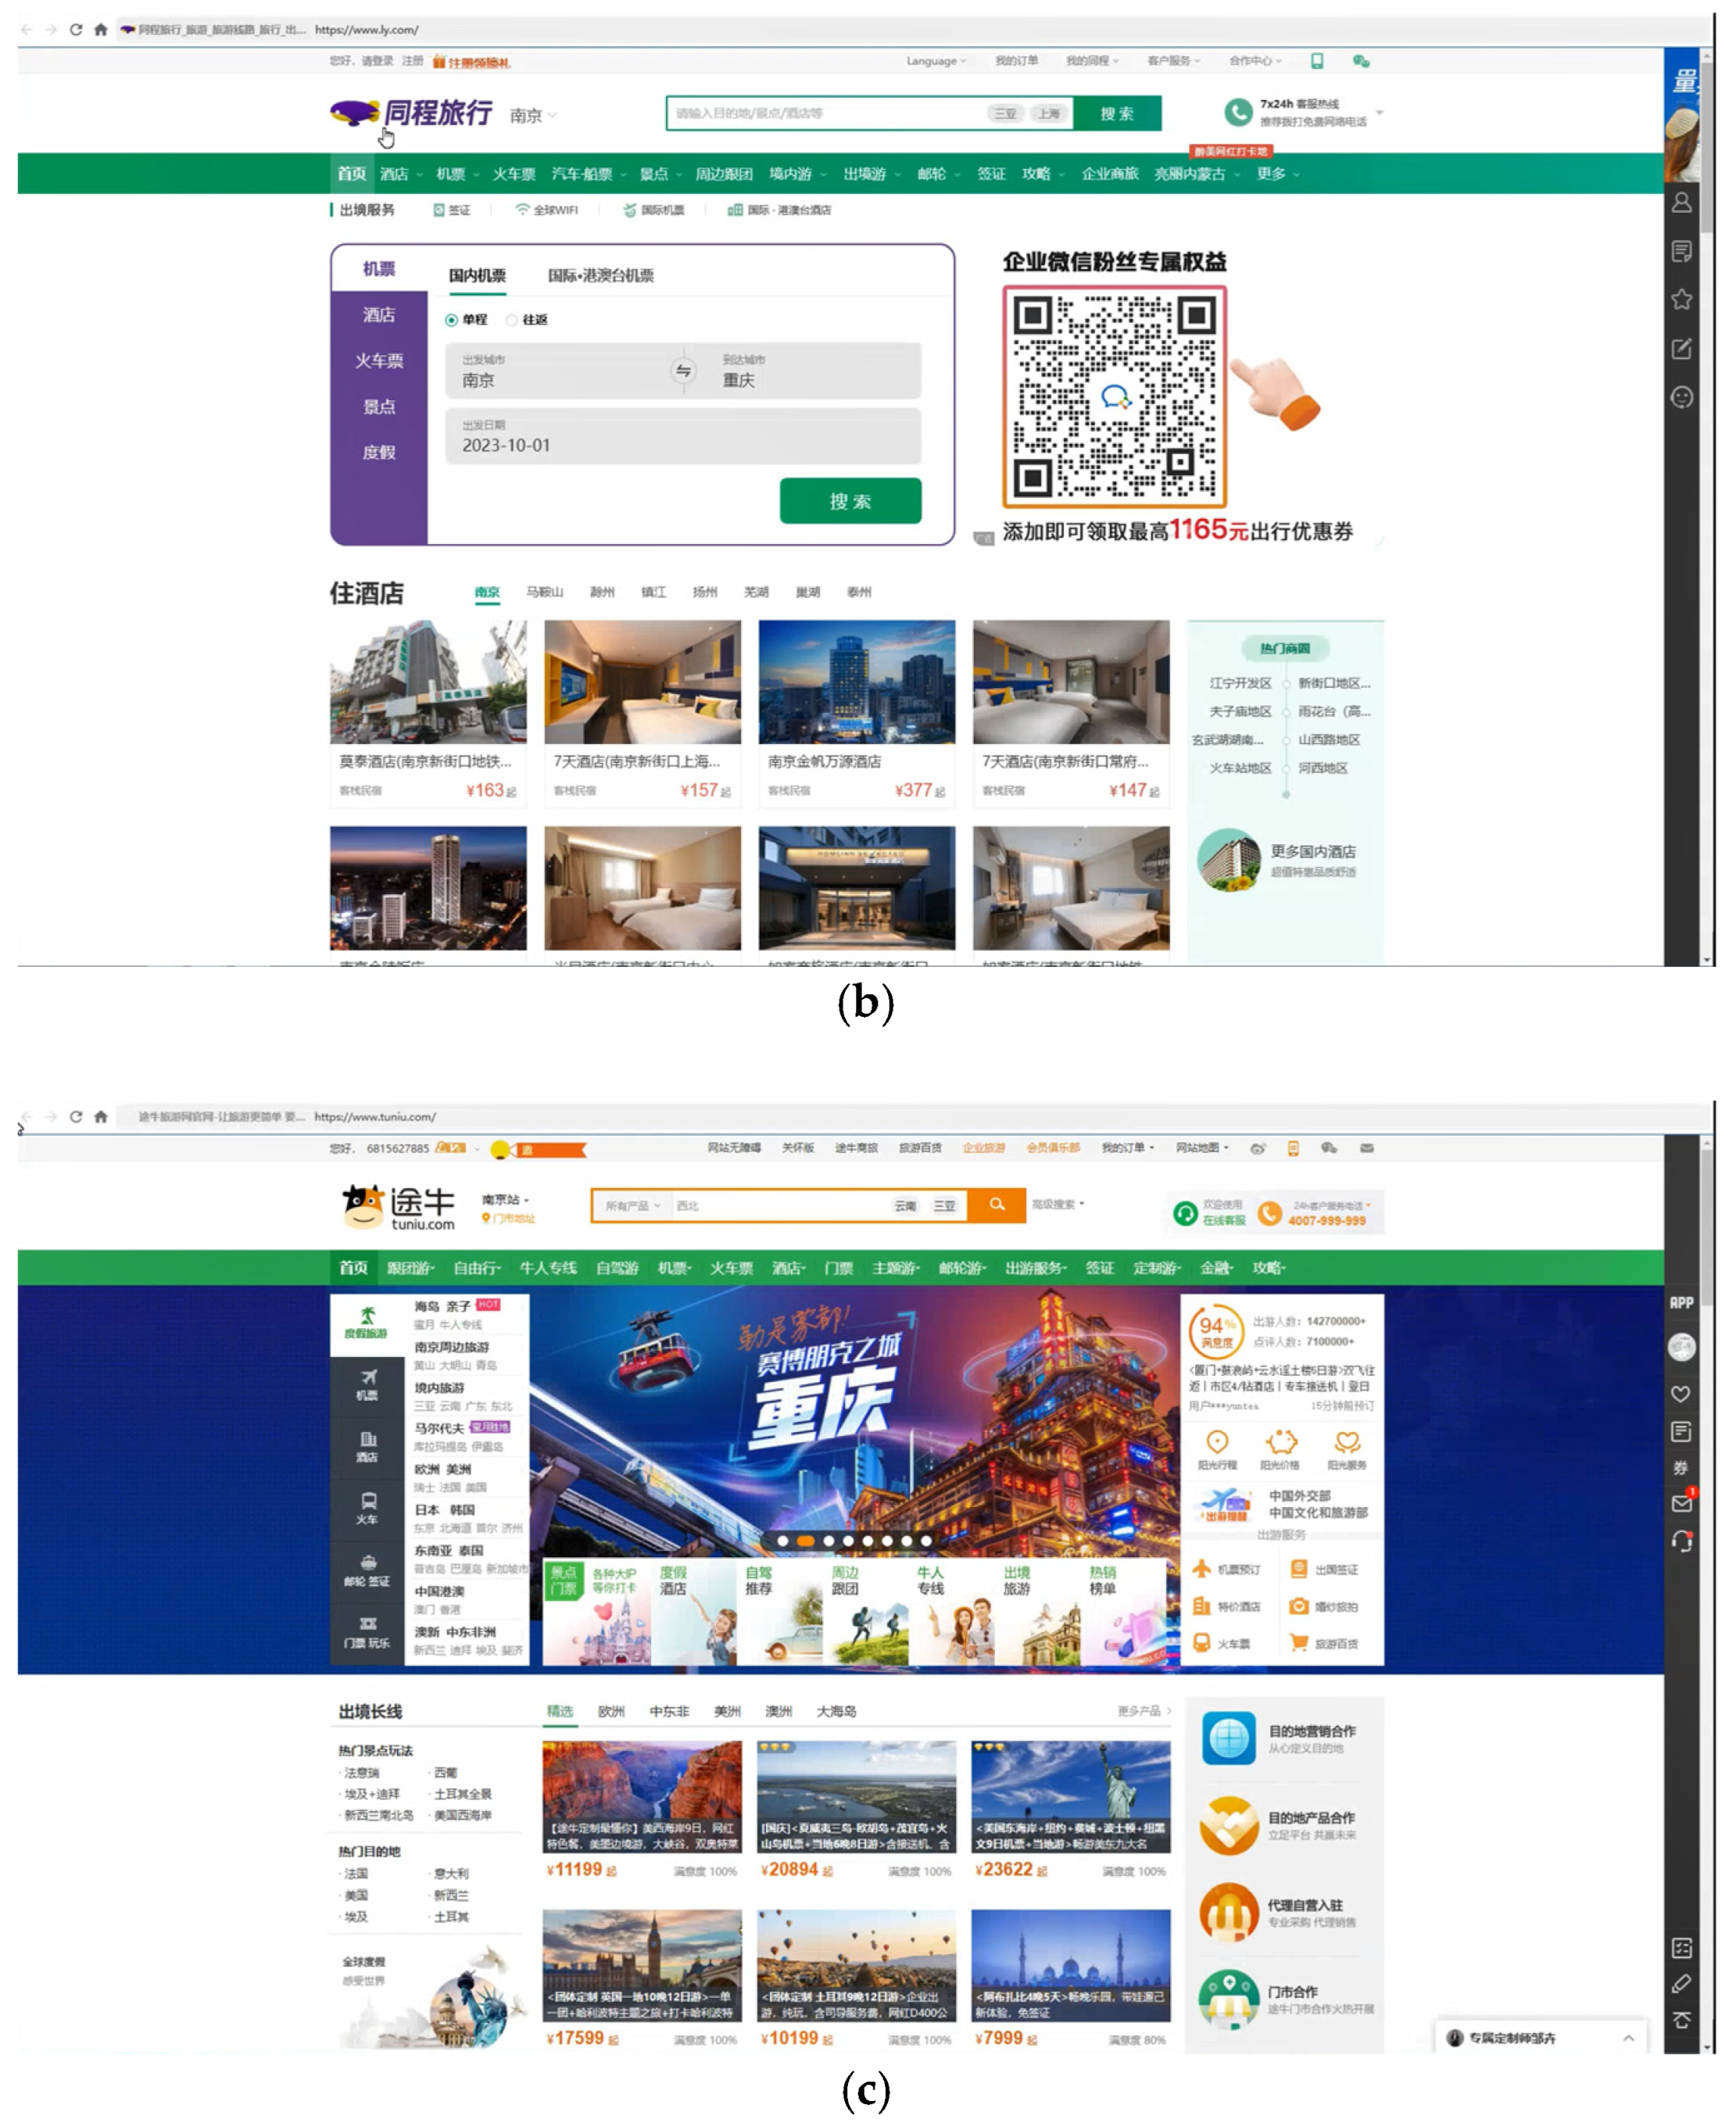
2.2. Experiment Material

Figure 2 illustrates the home pages of the three travel websites selected for the experiment. These websites—popular among young people for checking travel information and purchasing tickets—were chosen as experimental materials to reflect real-world usage scenarios. All websites were displayed on a desktop computer screen (53.15 cm × 29.90 cm, 1920 × 1080 pixels resolution). The experiment was conducted in a quiet room, isolated from external noise, with one participant at a time to ensure a controlled and distraction-free environment.

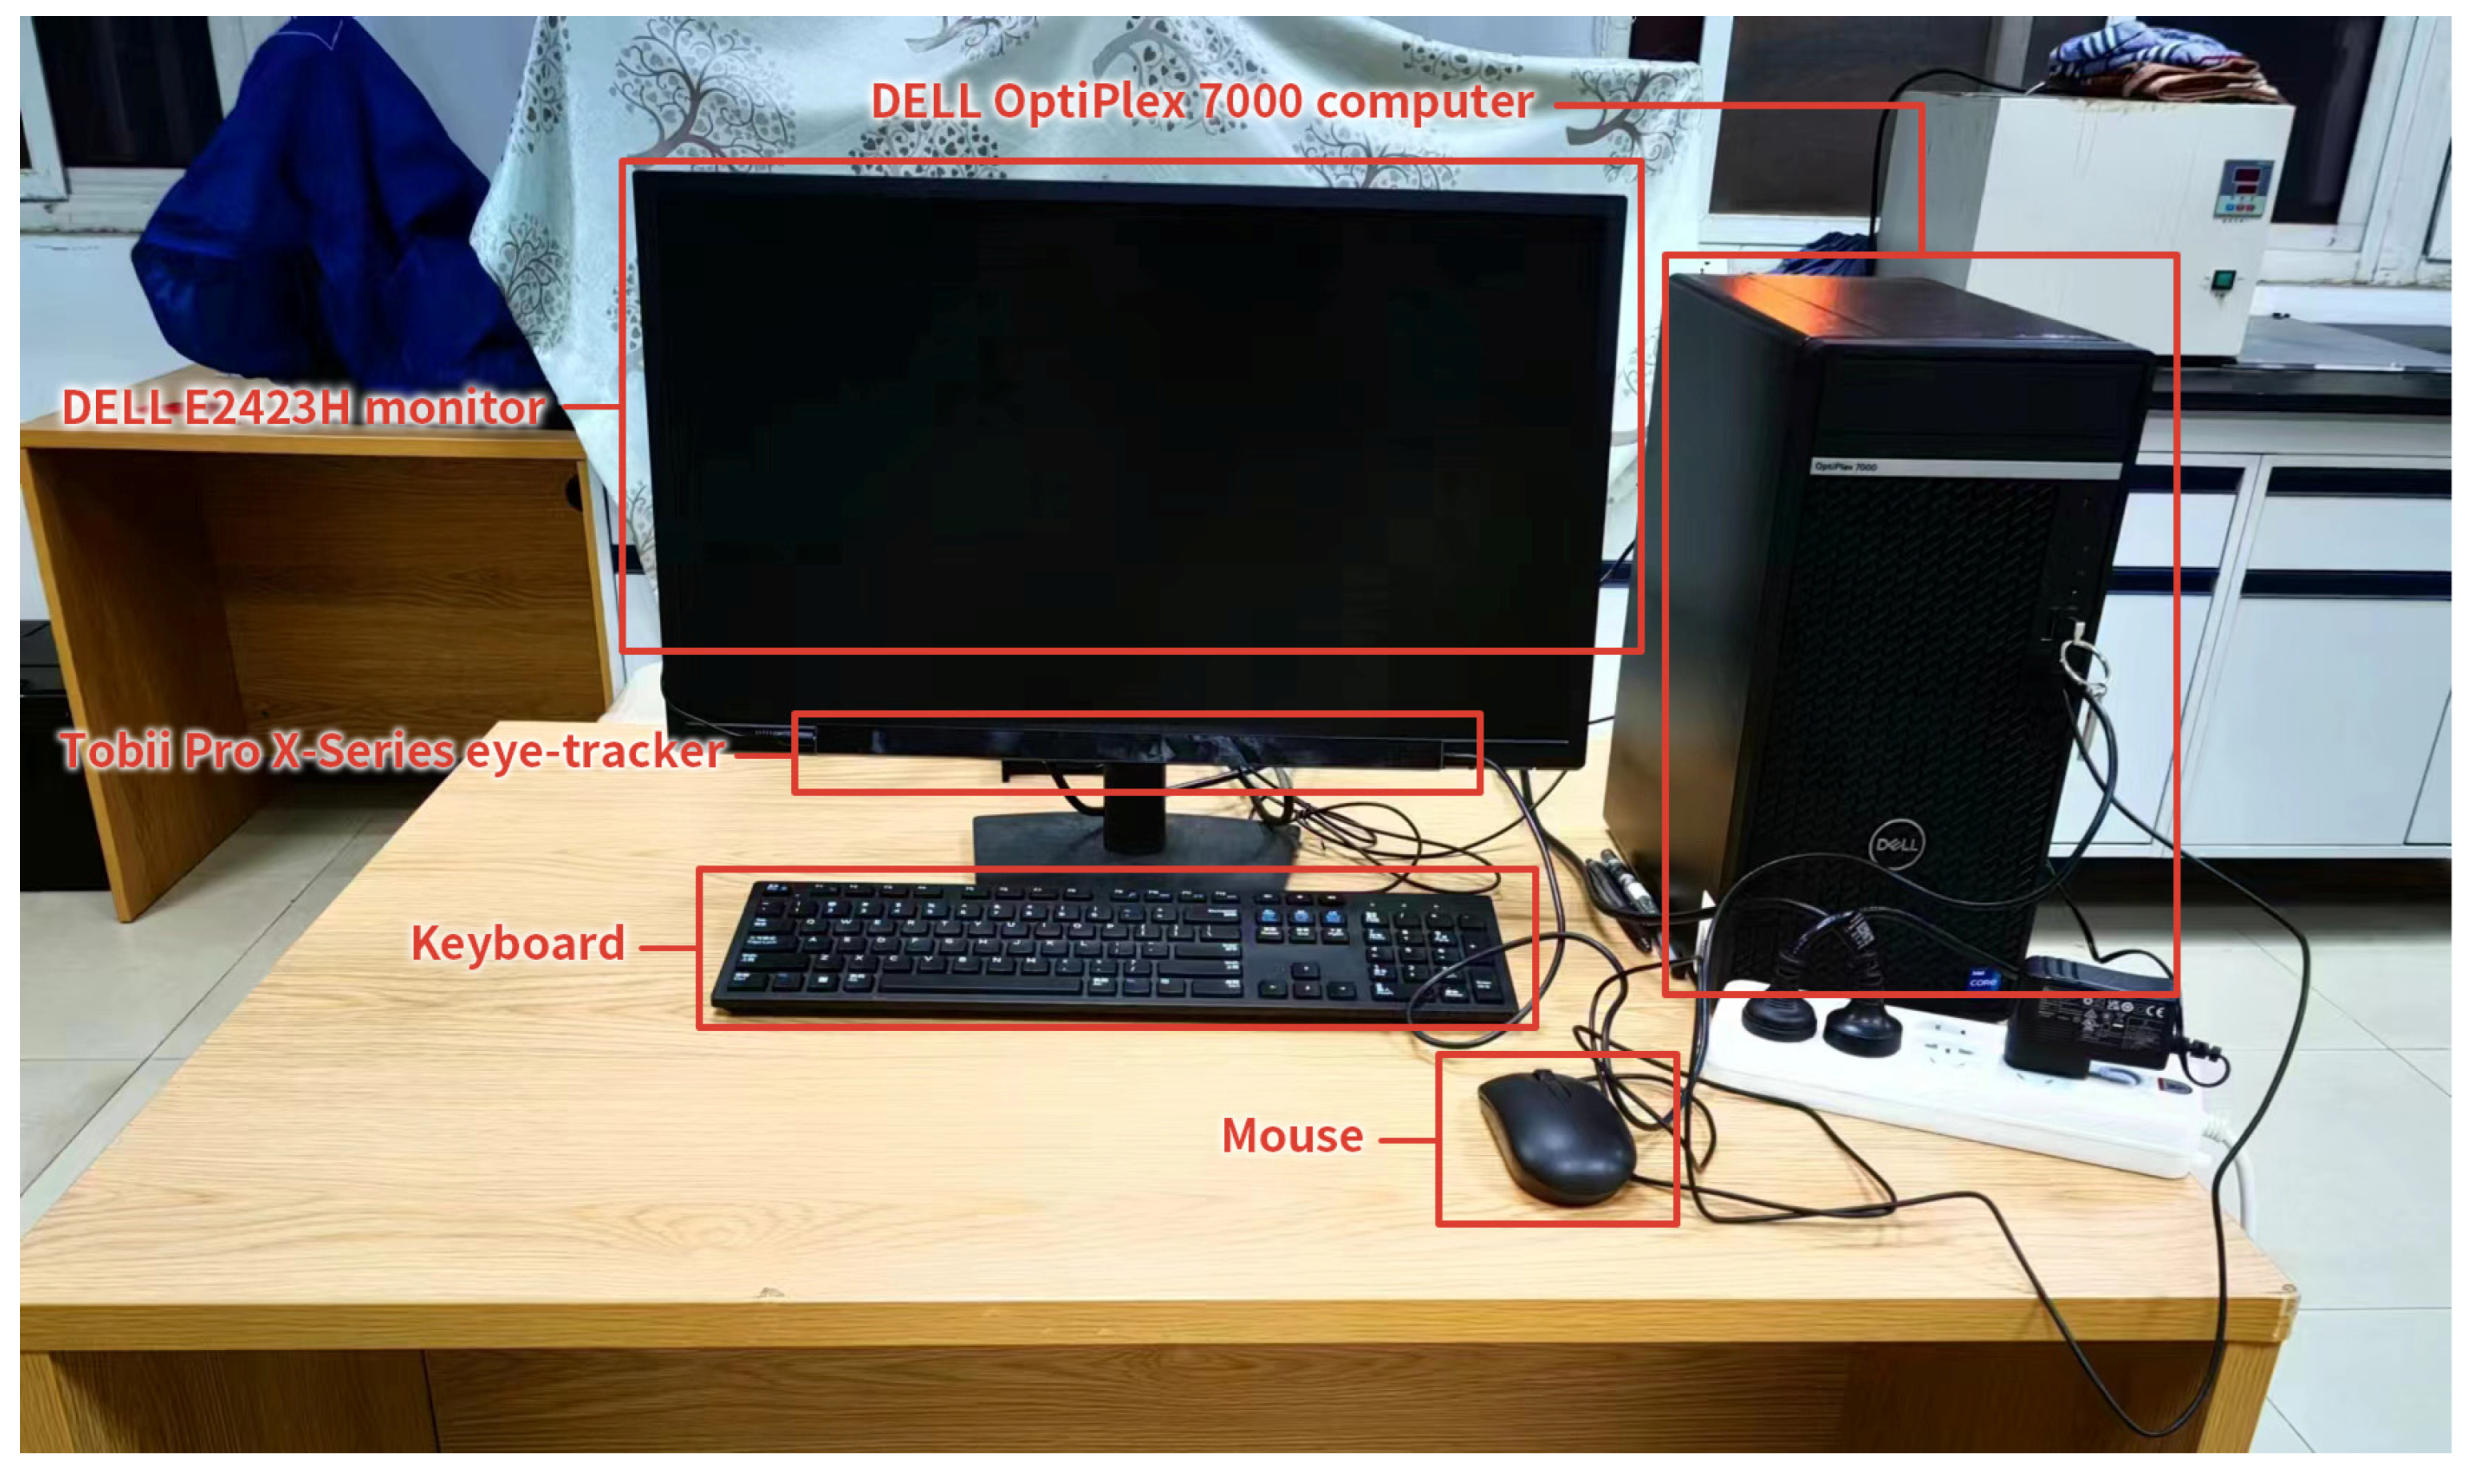
2.3. Experiment Equipment

The experimental procedures were carried out in a dedicated eye-tracking laboratory at Nanjing Forestry University. As illustrated in Figure 3, the experimental setup comprised a DELL OptiPlex 7000 computer (Dell Inc., Xiamen, China) connected to a DELL E2423H monitor (53.15 cm × 29.90 cm display area, 1920 × 1080 pixel resolution) for stimulus presentation. The system was equipped with a Tobii Pro X-Series eye-tracker positioned at the base of the monitor. Eye movement data acquisition and experimental control were implemented through ErgoLAB 3.0 software installed on the central processing unit. To ensure experimental validity and participant comfort, the laboratory environment was maintained at a constant temperature of 25 °C and a relative humidity of 50% throughout all experimental sessions, conditions, which have been previously established as optimal for eye-tracking research [38].

2.4. Participants

A total of 48 participants (19 males and 29 females; Mage = 26.73, SDage = 4.82; age range: 18–35 years) were recruited for this study based on two inclusion criteria: recent travel experience within the preceding three months or concrete plans for near-future travel. This selection criterion ensured that participants represented the target demographic for the experimental investigation. All participants met the following additional requirements: (1) a minimum of six years of computer experience, ensuring operational proficiency and eliminating potential technological barriers; (2) normal or corrected-to-normal visual acuity, as verified through self-reporting; and (3) right-handedness, to maintain consistency in motor response patterns across participants.

2.5. Procedure

2.5.1. Preliminary Experiment

A pilot study was conducted to determine the optimal number of trials per condition and to validate experimental parameters. Nine participants, comprising three tourism management students, three website designers, and three teachers, were recruited for this preliminary investigation. The pilot study served two primary purposes: (1) to assess task comprehensibility and duration appropriateness, and (2) to establish area of interest (AOI) parameters for evaluating the impact of effective versus interference areas on information retrieval efficiency. Post-experiment debriefing sessions revealed that all participants successfully identified target elements and functions within the experimental trials, confirming task feasibility.
Based on pilot study outcomes, the main experiment was designed with the following parameters: each participant was randomly assigned to complete a visual search task on one travel website. To control for potential learning effects and cognitive fatigue, participants were exposed to only one experimental condition. The pilot data indicated that three minutes was an adequate timeframe for successful task completion, as all participants were able to identify relevant content and functions within this duration. Consequently, this time constraint was implemented in the main experiment, with trials exceeding three minutes being classified as unsuccessful.

2.5.2. Formal Experiment

Participants were individually invited to the laboratory for the experiment. Each participant first received a brief overview of the procedure and provided informed consent. They were then seated approximately 70 cm from the display screen, and the eye-tracking system was calibrated using the 5-point method. Calibration accuracy was required to be below 0.6 before proceeding to the formal experiment.
An experiment introduction appeared on the screen, stating: “An element-searching task will be displayed. Please remember the task and press the space key to proceed. You will then see the homepage of a travel website. Your goal is to locate a specific element matching the task. Once found, press the space key to continue. Repeat this process until the task is completed. If you understand the instructions, press the space key to begin.”
Once participants confirmed their understanding, the experiment commenced. Participants were tasked with locating a flight ticket from the homepage of one travel website, specifically searching for a flight departing from Nanjing to Chongqing between 8:00 a.m. and 12:00 p.m. on October 1st. This task was designed to simulate real-world ticket booking processes. Each participant completed one trial on only one randomly presented website. Each participant was exposed to only one website to control for potential learning effects and cognitive fatigue.
If a participant failed to complete the task within three minutes, the trial was recorded as a failure. Throughout the experiment, participants’ eye gaze and response time were recorded using the eye-tracking system.

3. Results

3.1. Survey

In this study, a questionnaire was designed to investigate users’ basic interactions with tourism websites, including their preferred platforms, frequency of use, and common travel-related tasks. The collected data were systematically collated and analyzed to identify user preferences and typical behavioral patterns when using travel websites. Task analysis was employed to determine the primary interfaces and core functions most frequently utilized by users. The results of the questionnaire are presented in Table 1.
A total of 232 valid questionnaires were collected, with respondents predominantly aged 18 to 35. Accordingly, the follow-up experiment targeted participants within this age range. The gender distribution was 56.90% female and 43.10% male. Smartphones and computers were the primary devices for accessing travel websites, accounting for 47.00% and 40.52% of usage, respectively.
According to the survey results, the public’s awareness of carbon emissions from the Internet was relatively low. Only 5.17% of the respondents had a complete understanding of the carbon emissions of the Internet, while as many as 45.69% had never heard of it or did not know the details. This indicates that the concept of Internet carbon emissions has not yet been widely disseminated and is not deeply understood among the general public, and the public lacks sufficient awareness of the huge environmental impact of the Internet.
Among mainstream travel websites, www.Tuniu.com (TN), www.Ly.com (TC), and www.Qunar.com (QN) were the most frequently used, representing 29.31%, 23.70%, and 21.12% of user preferences, respectively. The primary purposes for visiting travel websites included booking flights (56.47%), booking hotels (52.16%), and searching for travel tips (46.12%). These findings underscored users’ core needs: completing booking operations and accessing valuable travel information.
When selecting a travel website, users prioritized comprehensive information (40.95%), service quality (34.48%), quick search (34.91%), and user reviews (27.59%), which were identified as the most important features, highlighting the critical role of personalized services and operational efficiency in enhancing user experience. When choosing a travel website, most people did not consider the website’s adoption of a low-carbon and environmentally friendly design to be an important factor. Only 1.72% of the respondents always considered it, while 43.97% seldom considered it and 18.97% never considered it. This reflects that although low-carbon design and environmental protection have become a topic of great concern, in the actual behavior of choosing tourism websites, most people do not consider the website’s adoption of low-carbon and environmentally friendly design to be an important factor.
Based on the questionnaire results, this study designed an experimental task to simulate real-world user interactions with travel websites. Participants were required to start from the homepage of a travel website, search for specified flight tickets and travel tips for a specific city, and complete the task while their eye movements were recorded. This task aimed to evaluate user efficiency and behavioral patterns during the performance of core travel website functions.
By replicating real-world usage scenarios, the task provided insights into users’ behavioral habits during information retrieval and decision-making. The resulting empirical data offered valuable guidance for optimizing website interface design and functionality, ultimately enhancing user satisfaction and the competitive edge of travel websites.
The study employed a repeated-measures design, with travel website layout and participant gender as independent variables. The dependent variables included fixation count, dwell time, visual search efficiency, and overall user experience. Consistent with prior research, visual search efficiency was quantified using task completion time, fixation count, and fixation duration.
Task completion time was defined as the interval from the presentation of experimental stimuli to the moment participants pressed the space bar after completing their search. This metric reflects the total time required to locate a specific element or perform a function. Eye fixation, characterized by the sustained focus on a particular area [39], was measured by fixation count (the total number of fixations on stimuli) and fixation duration (the cumulative time spent on all fixations).

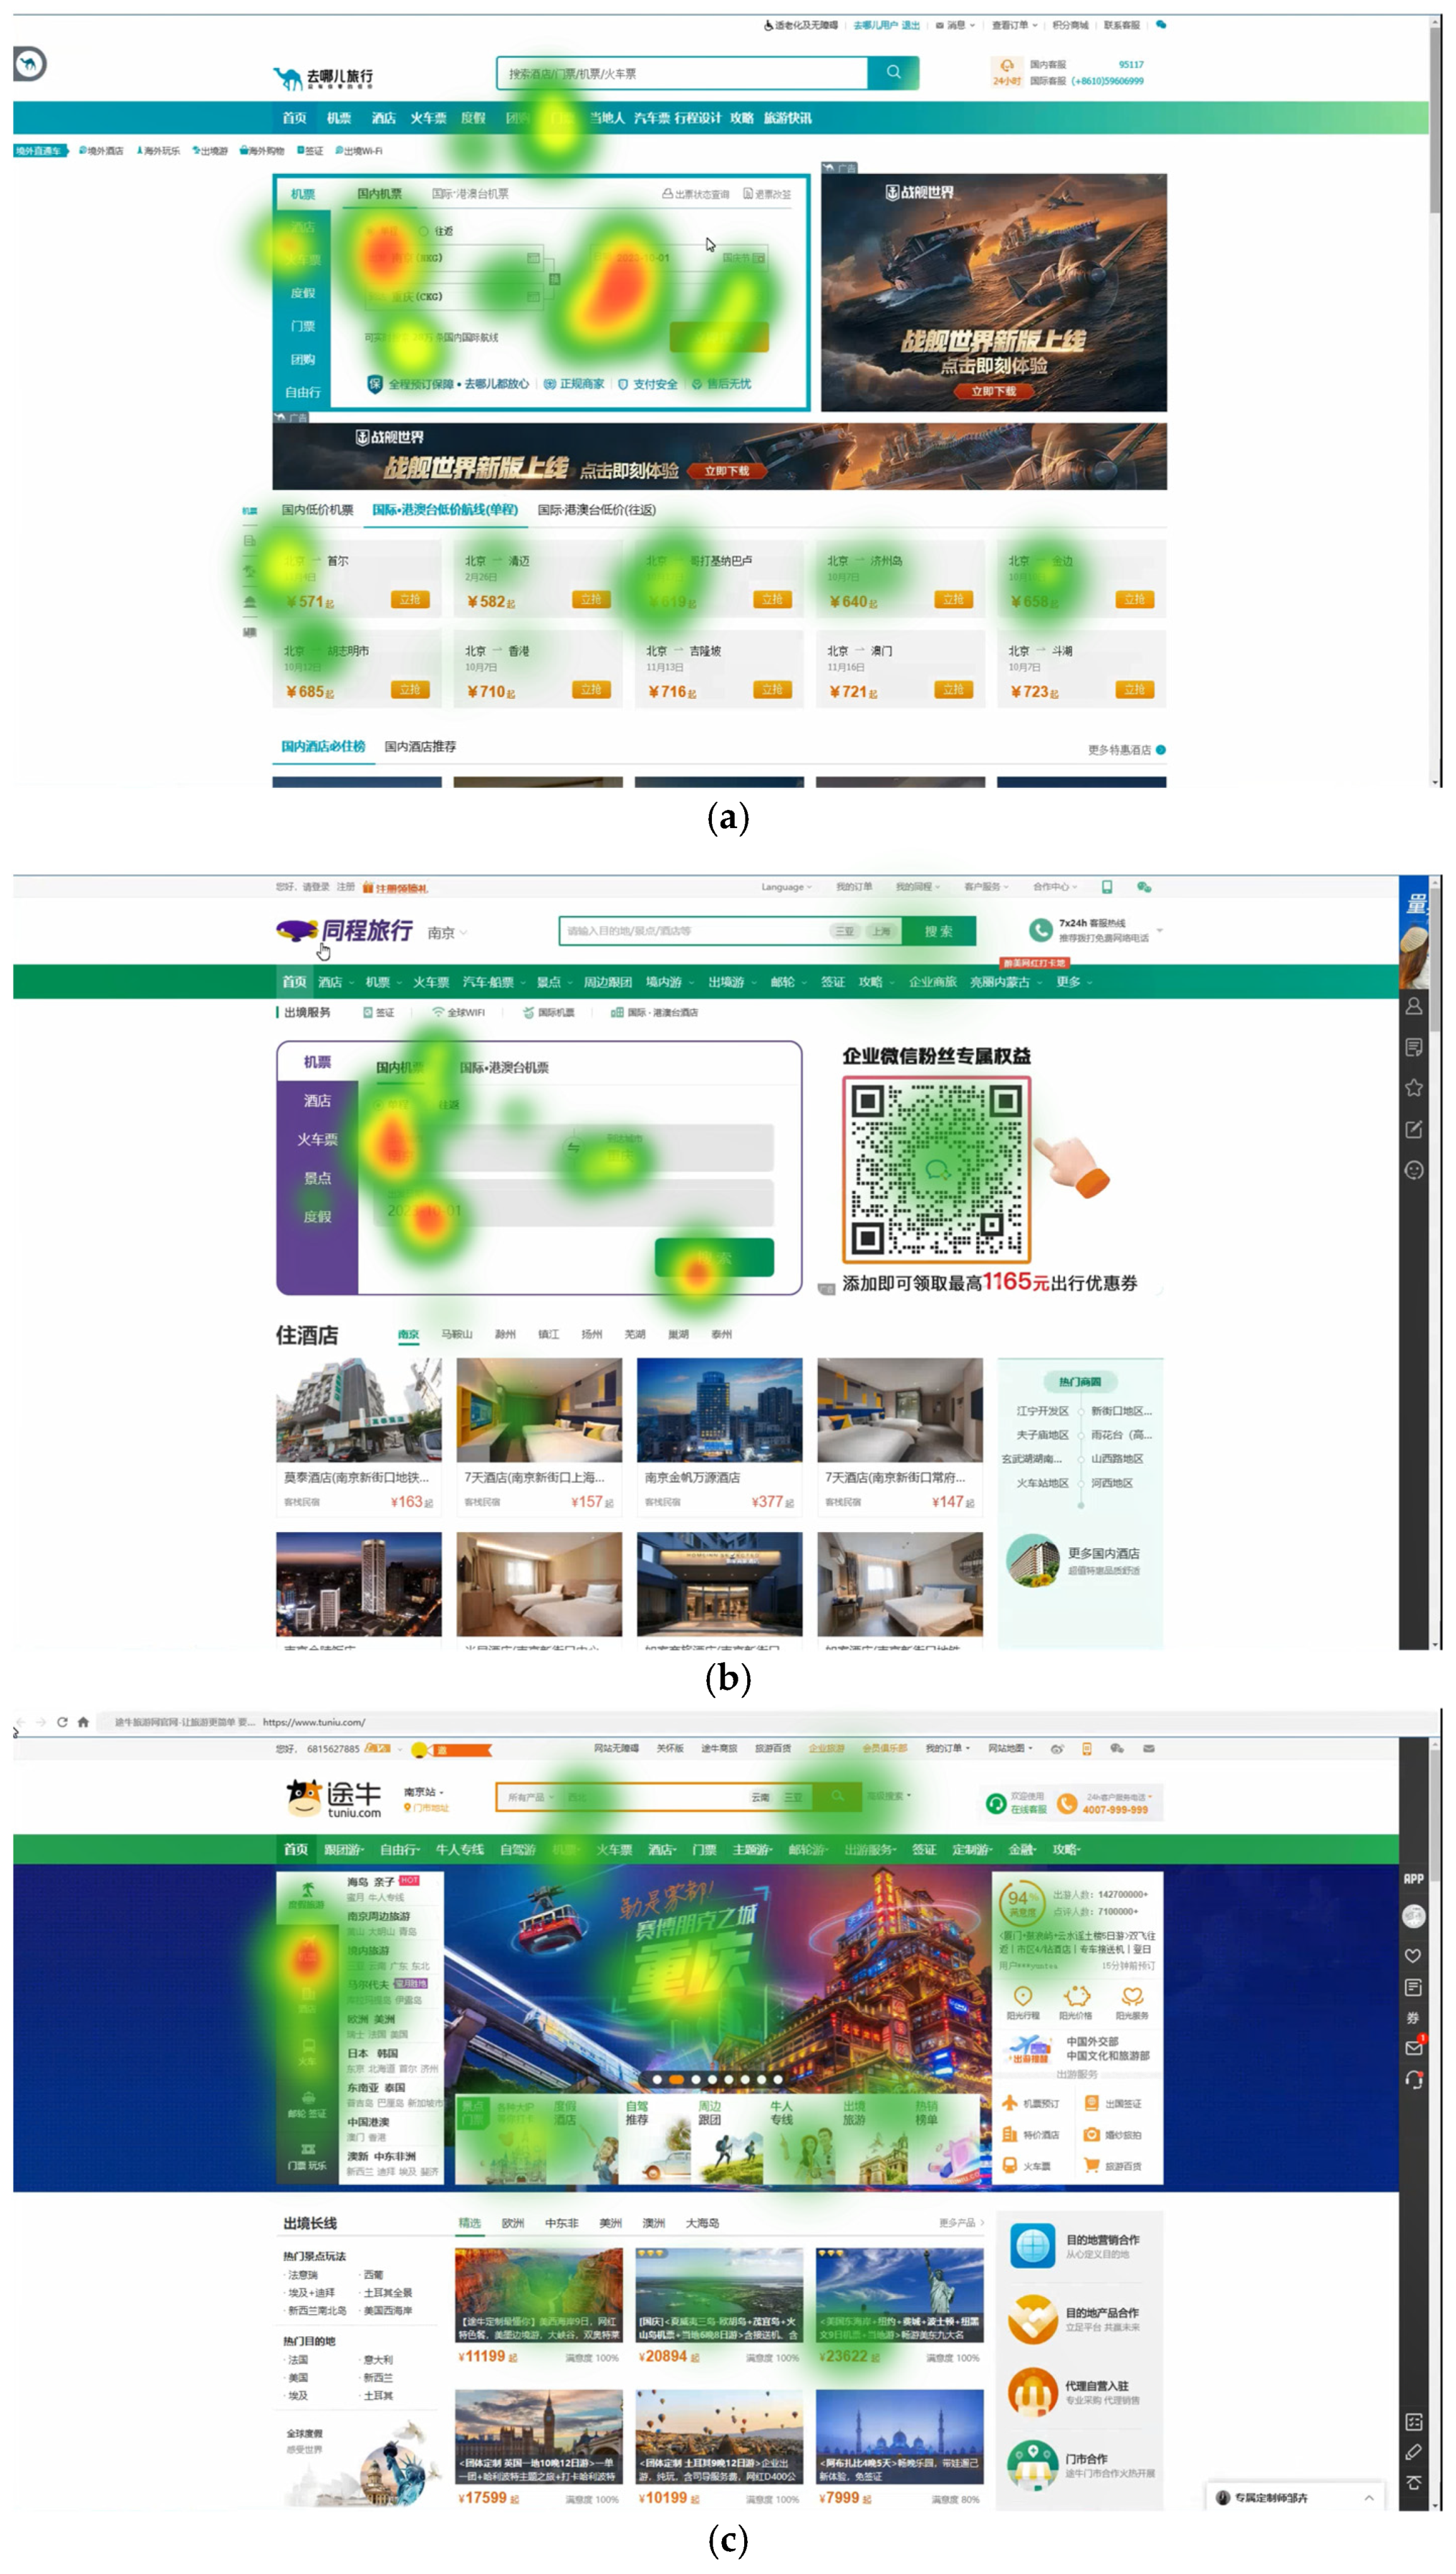
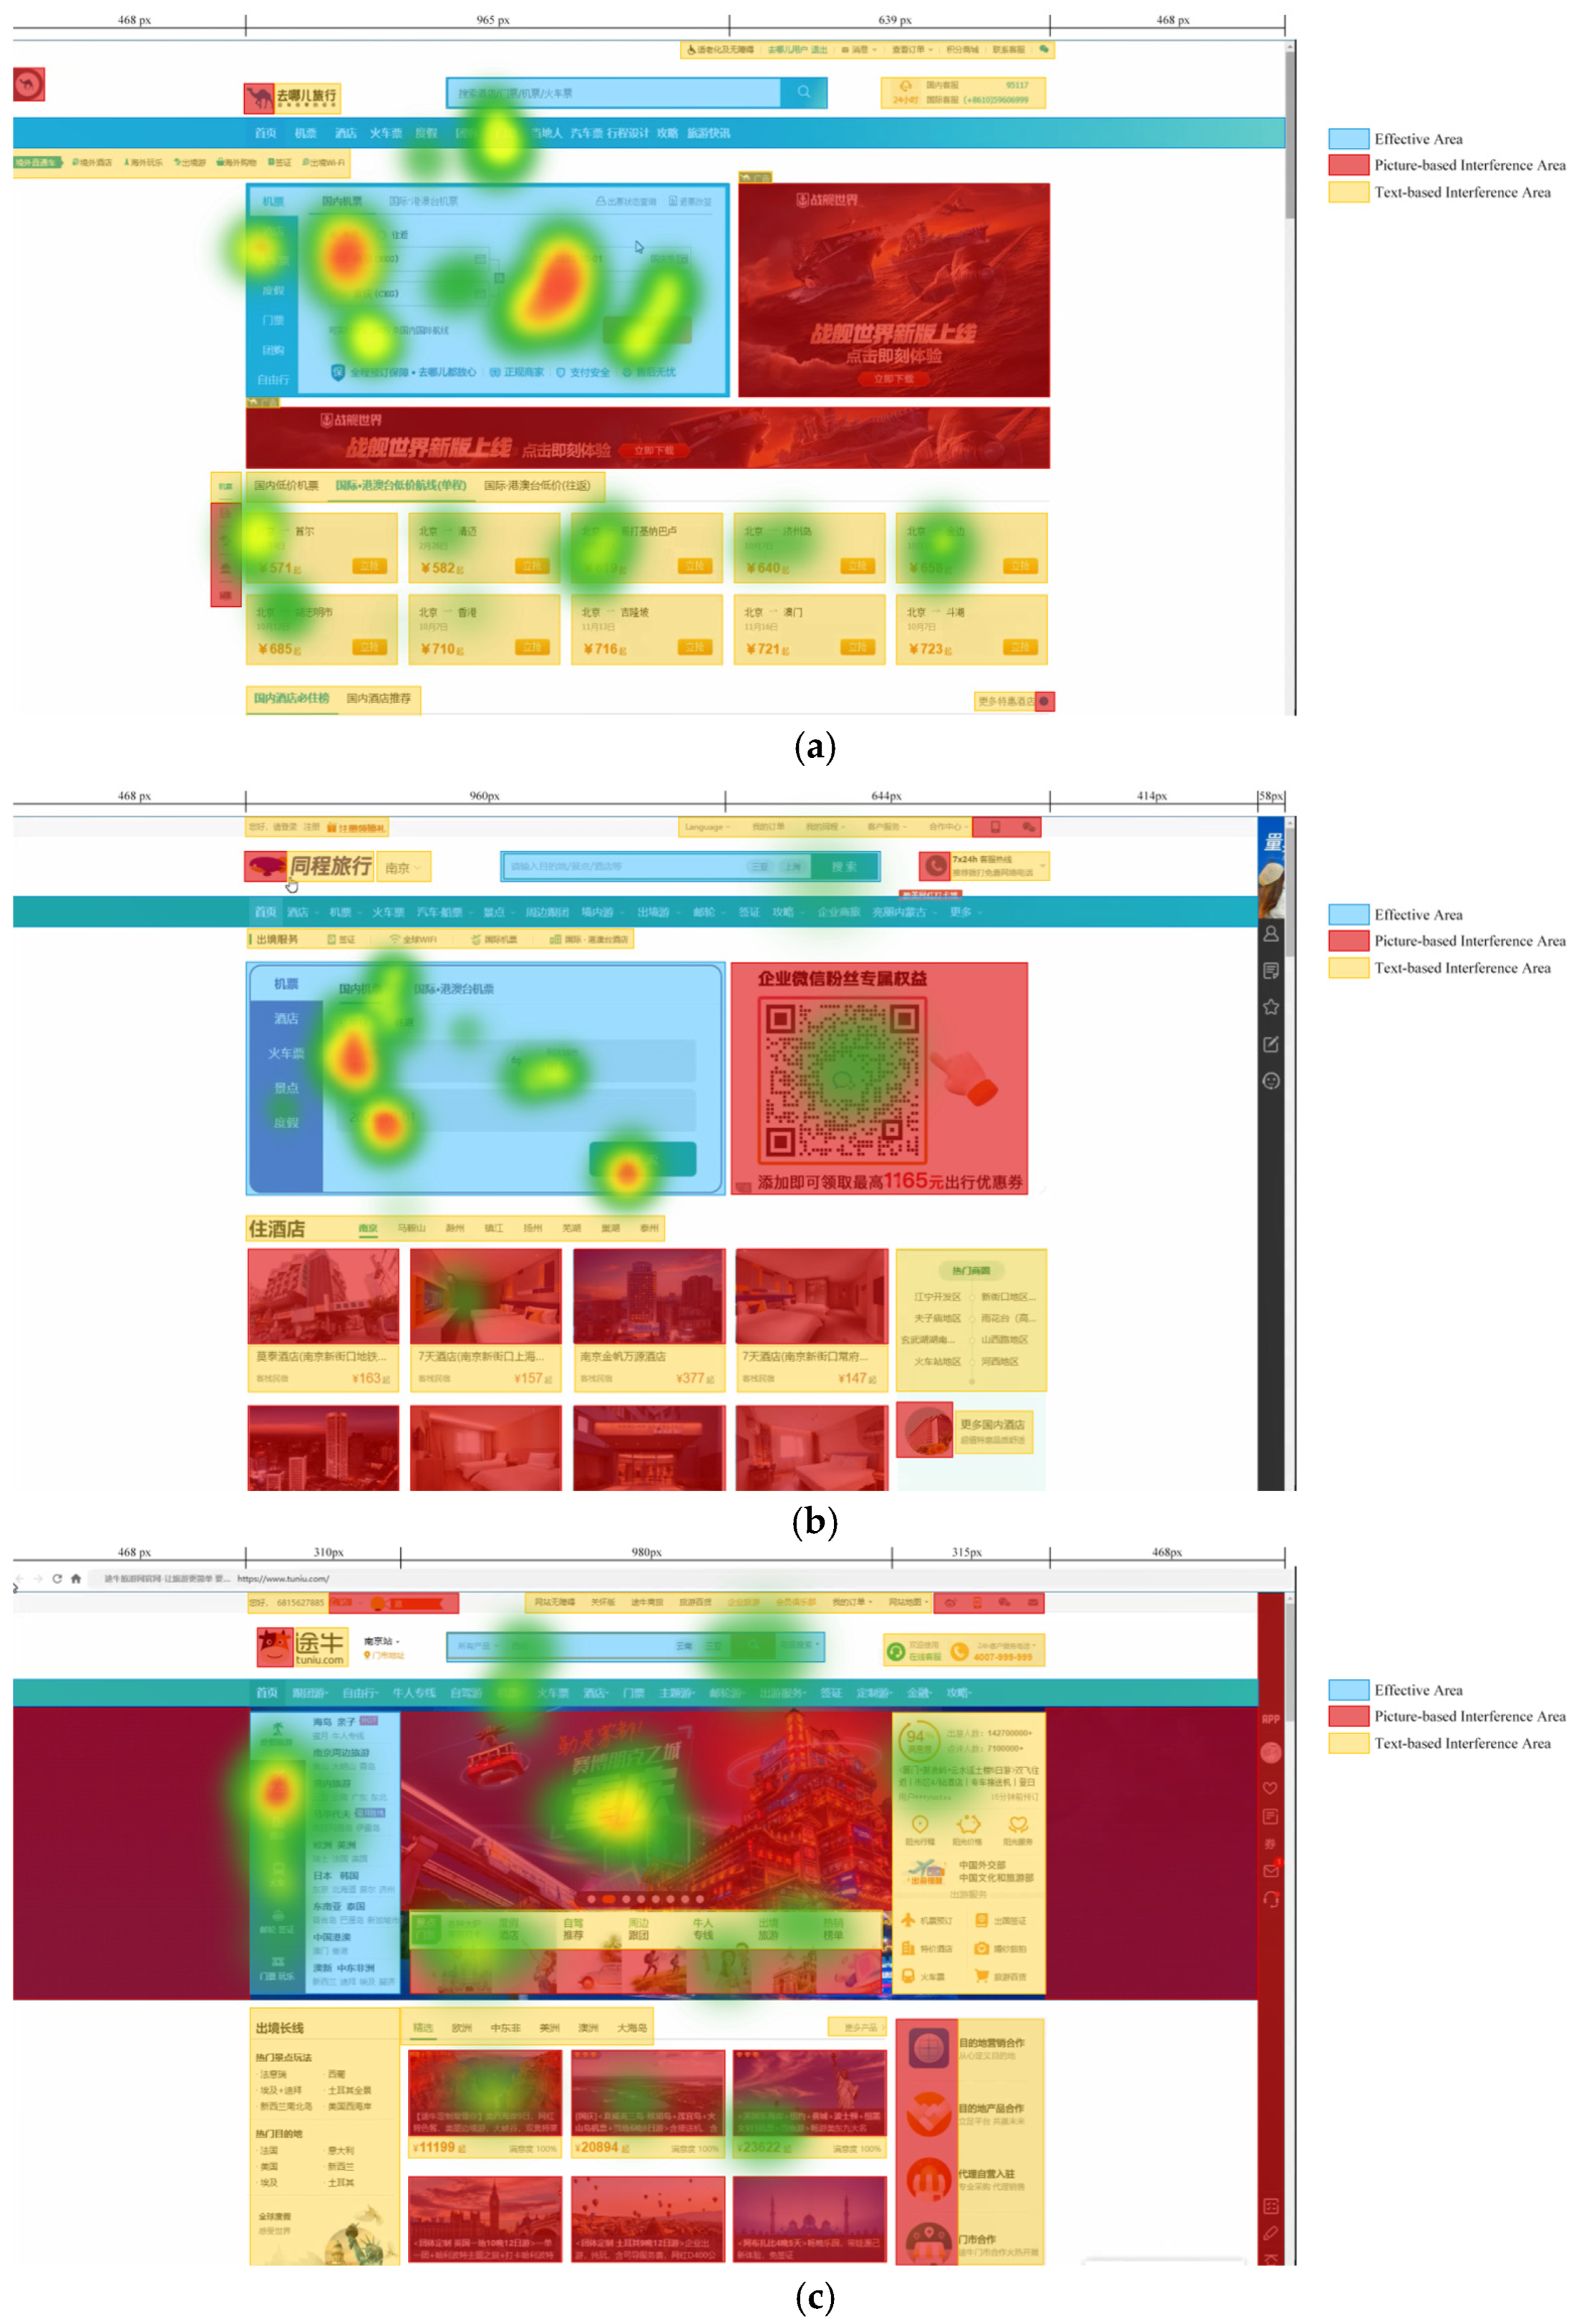
3.2. Eye Movement Heatmap Analysis (Browsing Areas)

Figure 4 presents the eye movement heatmaps of participants searching for flight tickets on the homepages of the three travel websites. The different colors in the figure, ranging from green to yellow to orange to red, indicate the level of users’ focus, with red representing the highest concentration. The heatmaps reveal that participants’ browsing areas on QN and TN were significantly larger than on TC. While the fixation areas on TC’s homepage were primarily concentrated on task-relevant elements, the hotspot areas on QN and TN covered a broader range, including both task-relevant and unrelated sections.
These findings suggest that TC’s homepage interface layout is more user-friendly and functionally optimized compared to those of QN and TN. TC’s design effectively directed user attention to task-critical areas, demonstrating superior usability in terms of interface layout and functional positioning.

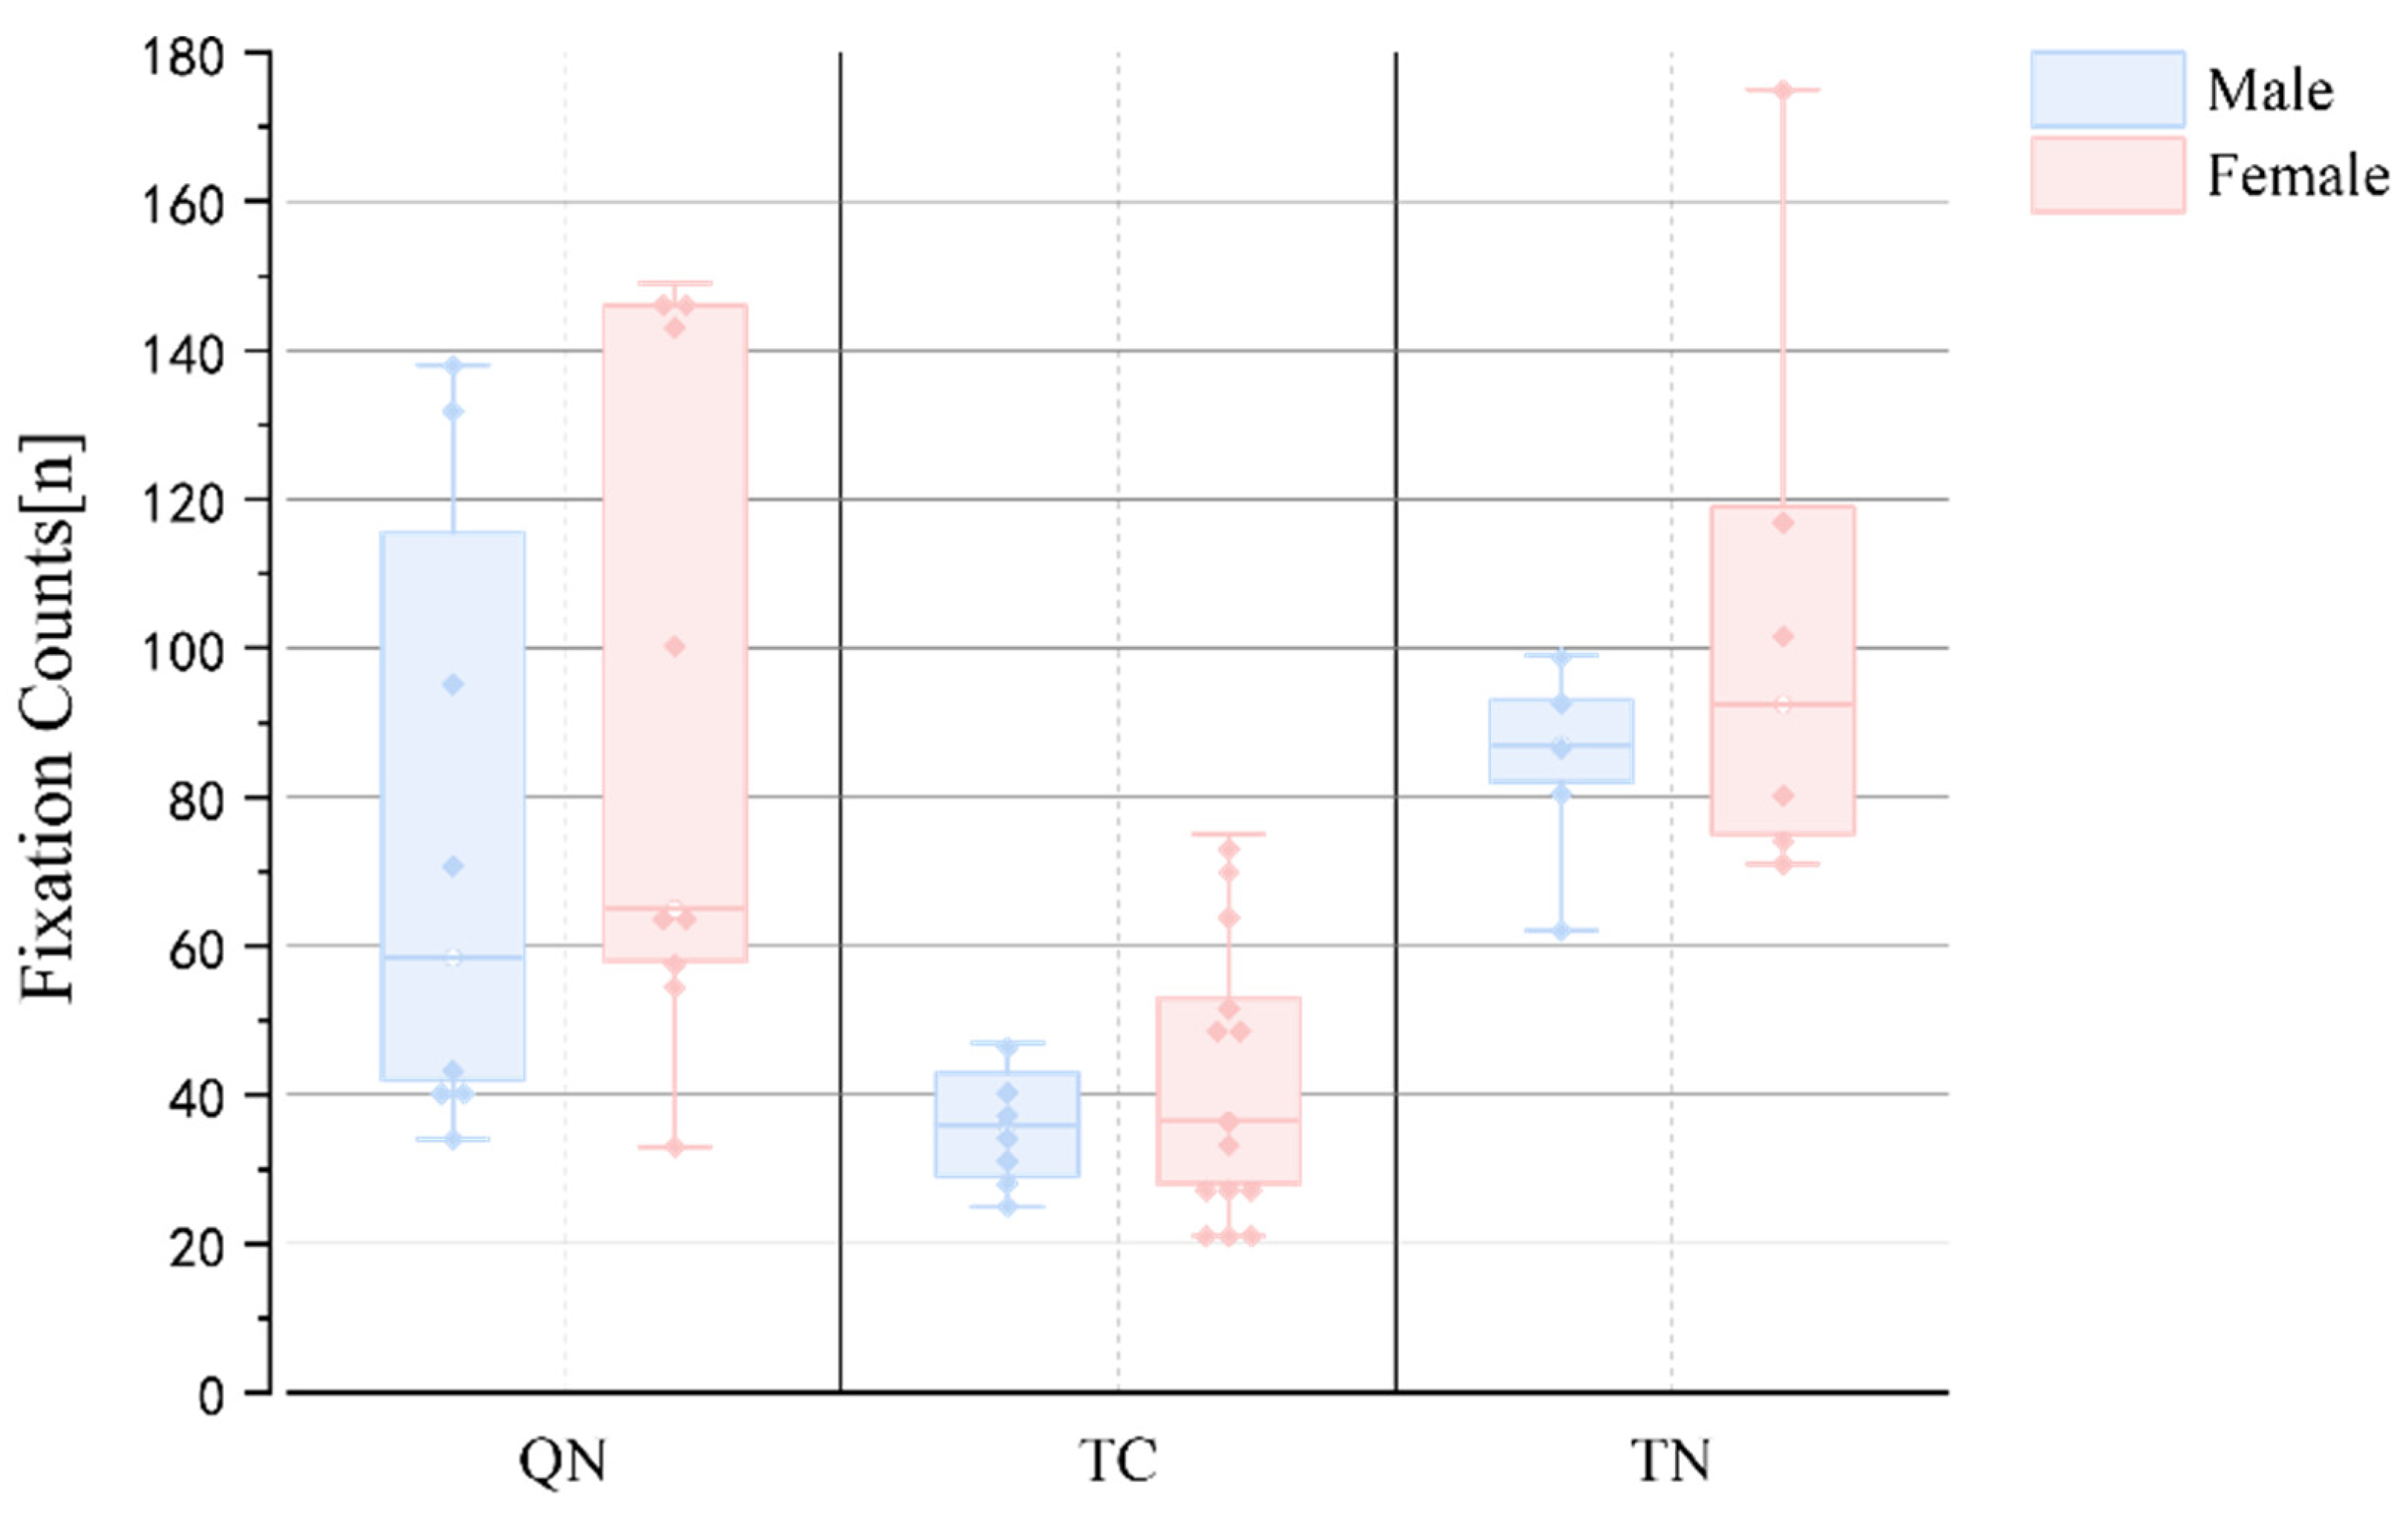
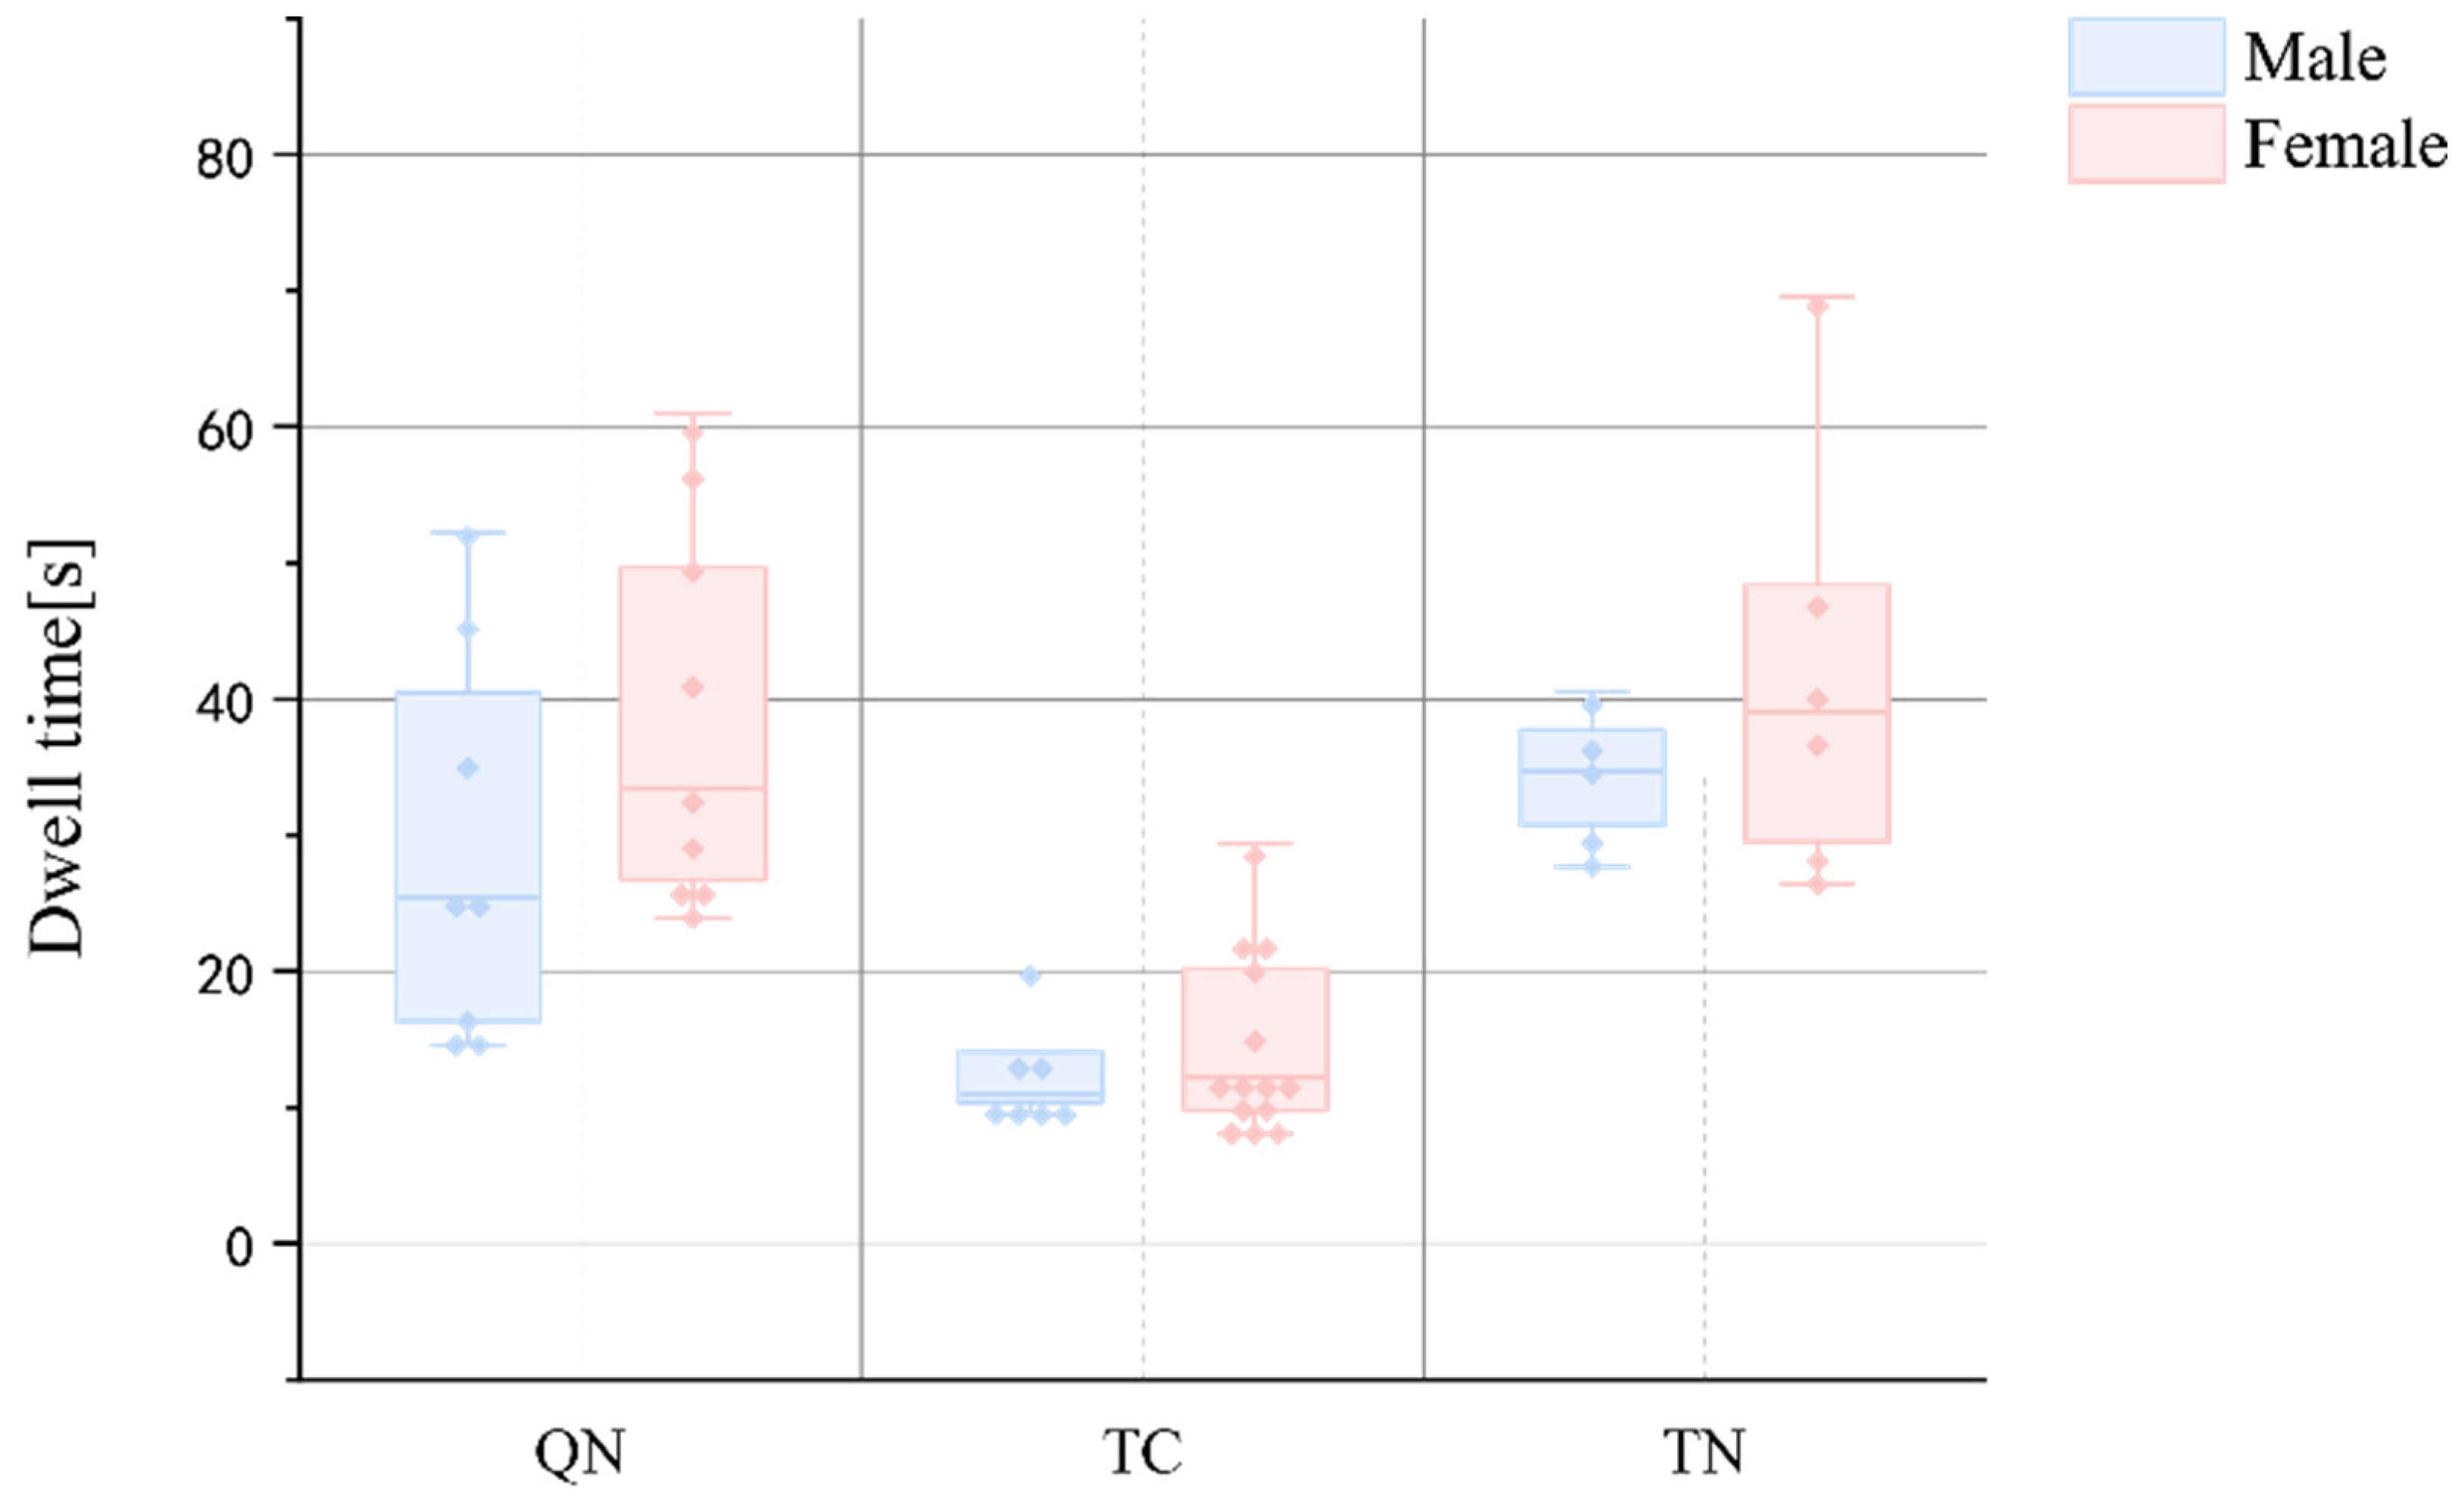
3.3. Fixation Count and Dwell Time

Analysis of variance revealed statistically significant differences among the website interfaces of QN, TC, and TN in terms of fixation counts and total gaze time (p < 0.01) (Table 2 and Table 3). Specifically, these travel websites exhibited significant variance in search efficiency, search volume, task completion efficiency, and interface guiding effectiveness.
Table 2 shows that female participants generally had higher fixation times and dwell times than male participants when completing the task. Since the task primarily involved text-based information search, higher fixation times and dwell times were negatively correlated with search efficiency. This suggests that the designs of the ticket search boxes on the three travel websites were more conducive to task completion by male users.
Fixation times were negatively correlated with interface search efficiency. In the task, the mean fixation counts on TN and QN were more than twice those on TC (40.10 < 83.88 < 95.27), indicating that participants’ search areas on TC’s homepage were smaller and more focused. This demonstrated that TC’s homepage design significantly outperformed QN and TN in functional search efficiency.
Similarly, total gaze time was negatively correlated with task completion efficiency. Participants spent the longest gaze time on TN’s homepage, followed by QN’s (14.08 s < 34.23 s < 38.49 s), suggesting that TC’s homepage allows for easier information extraction and higher usability (Table 2).
These findings were significant, as they revealed that male users exhibited higher search efficiency within the context of this study (Figure 5 and Figure 6). In this study, male users tended to focus more on effective areas, which helped to reduce cognitive load and resource consumption. This focused attention could further contribute to the sustainability of tourism websites by lowering server demands and enhancing overall system efficiency. TC stood out from the tested websites, as it had the best search efficiency. Its design made users focus on effective areas more easily and reduced distractions from non-essential elements. This meant that users could find what they needed more quickly and with less effort, resulting in a better user experience and lower cognitive load. Also, the effective organization of information on TC reduced the time and effort users spend searching for relevant information, making the overall tourism planning process more efficient and more eco-friendly.

3.4. AOI Fixation Count and Dwell Time

3.4.1. Partition of Homepage

The web page interface was systematically divided into functionally distinct areas based on their relevance to the experimental task. The effective area, demarcated in blue (Figure 7), comprised task-relevant components, including the search bar, navigation tabs, and ticket information section—elements directly supporting information retrieval. Conversely, the interference area was categorized into two types: (1) picture-based interference (marked in red) and (2) text-based interference (indicated in yellow), both containing task-irrelevant content such as pop-up windows and advertisement placements.
Quantitative analysis of the homepage and strategy interface layouts across all three websites revealed consistent spatial distribution patterns. The information-rich effective area occupied approximately 1604 pixels in width, representing roughly two-thirds of the total page width. This predominant section served as the primary visual search space for participants during task execution, with eye movement data subsequently being analyzed within this critical region.
The analysis of AOI (area of interest) distribution and heat map visualization (Table 4) revealed significant differences in user attention patterns across the three websites. The proportion of fixation counts in the effective area relative to total fixations was 20.53% for TC, 55.31% for QN, and 62.42% for TN. Notably, the visual scanning area on QN and TN homepages was substantially larger than that of TC, with TC’s fixation counts being exclusively concentrated on task-relevant elements (Figure 8 and Figure 9). The heat map analysis further indicated that QN and TN exhibited extensive visual attention distribution within their interference areas.
Comparative analysis of fixation patterns revealed distinct characteristics across websites: both TC and TN demonstrated significantly higher fixation counts in picture-based interference areas compared to text-based interference zones (p < 0.05). In contrast, QN showed comparable fixation counts between its picture-based and text-based interference areas. Despite these patterns, task completion time analysis revealed that participants achieved faster task resolution on TC (mean = 14.08 s, SD = 5.62) compared to both QN (mean = 34.23 s, SD = 14.60) and TN (mean = 38.49 s, SD = 12.20), suggesting more efficient information processing on TC’s interface.
These findings collectively indicated that TC’s homepage interface design demonstrated superior functionality in terms of layout optimization and task-relevant element placement compared to those of QN and TN. The more focused attention distribution and faster task completion times on TC suggested that its design facilitates more efficient visual search and information retrieval processes. TC’s design minimizes distractions by reducing the visual scanning area and concentrating user attention on task-relevant elements. By optimizing the layout to maximize effective areas and minimize interference areas, TC reduces the cognitive load on users and the operational load on the website’s servers. This leads to reduced energy consumption and resource usage, making it a more environmentally friendly option. Furthermore, the effective organization of information on TC’s platform streamlined the travel planning process, making it more efficient and eco-conscious, thus supporting the broader goals of sustainable tourism development.

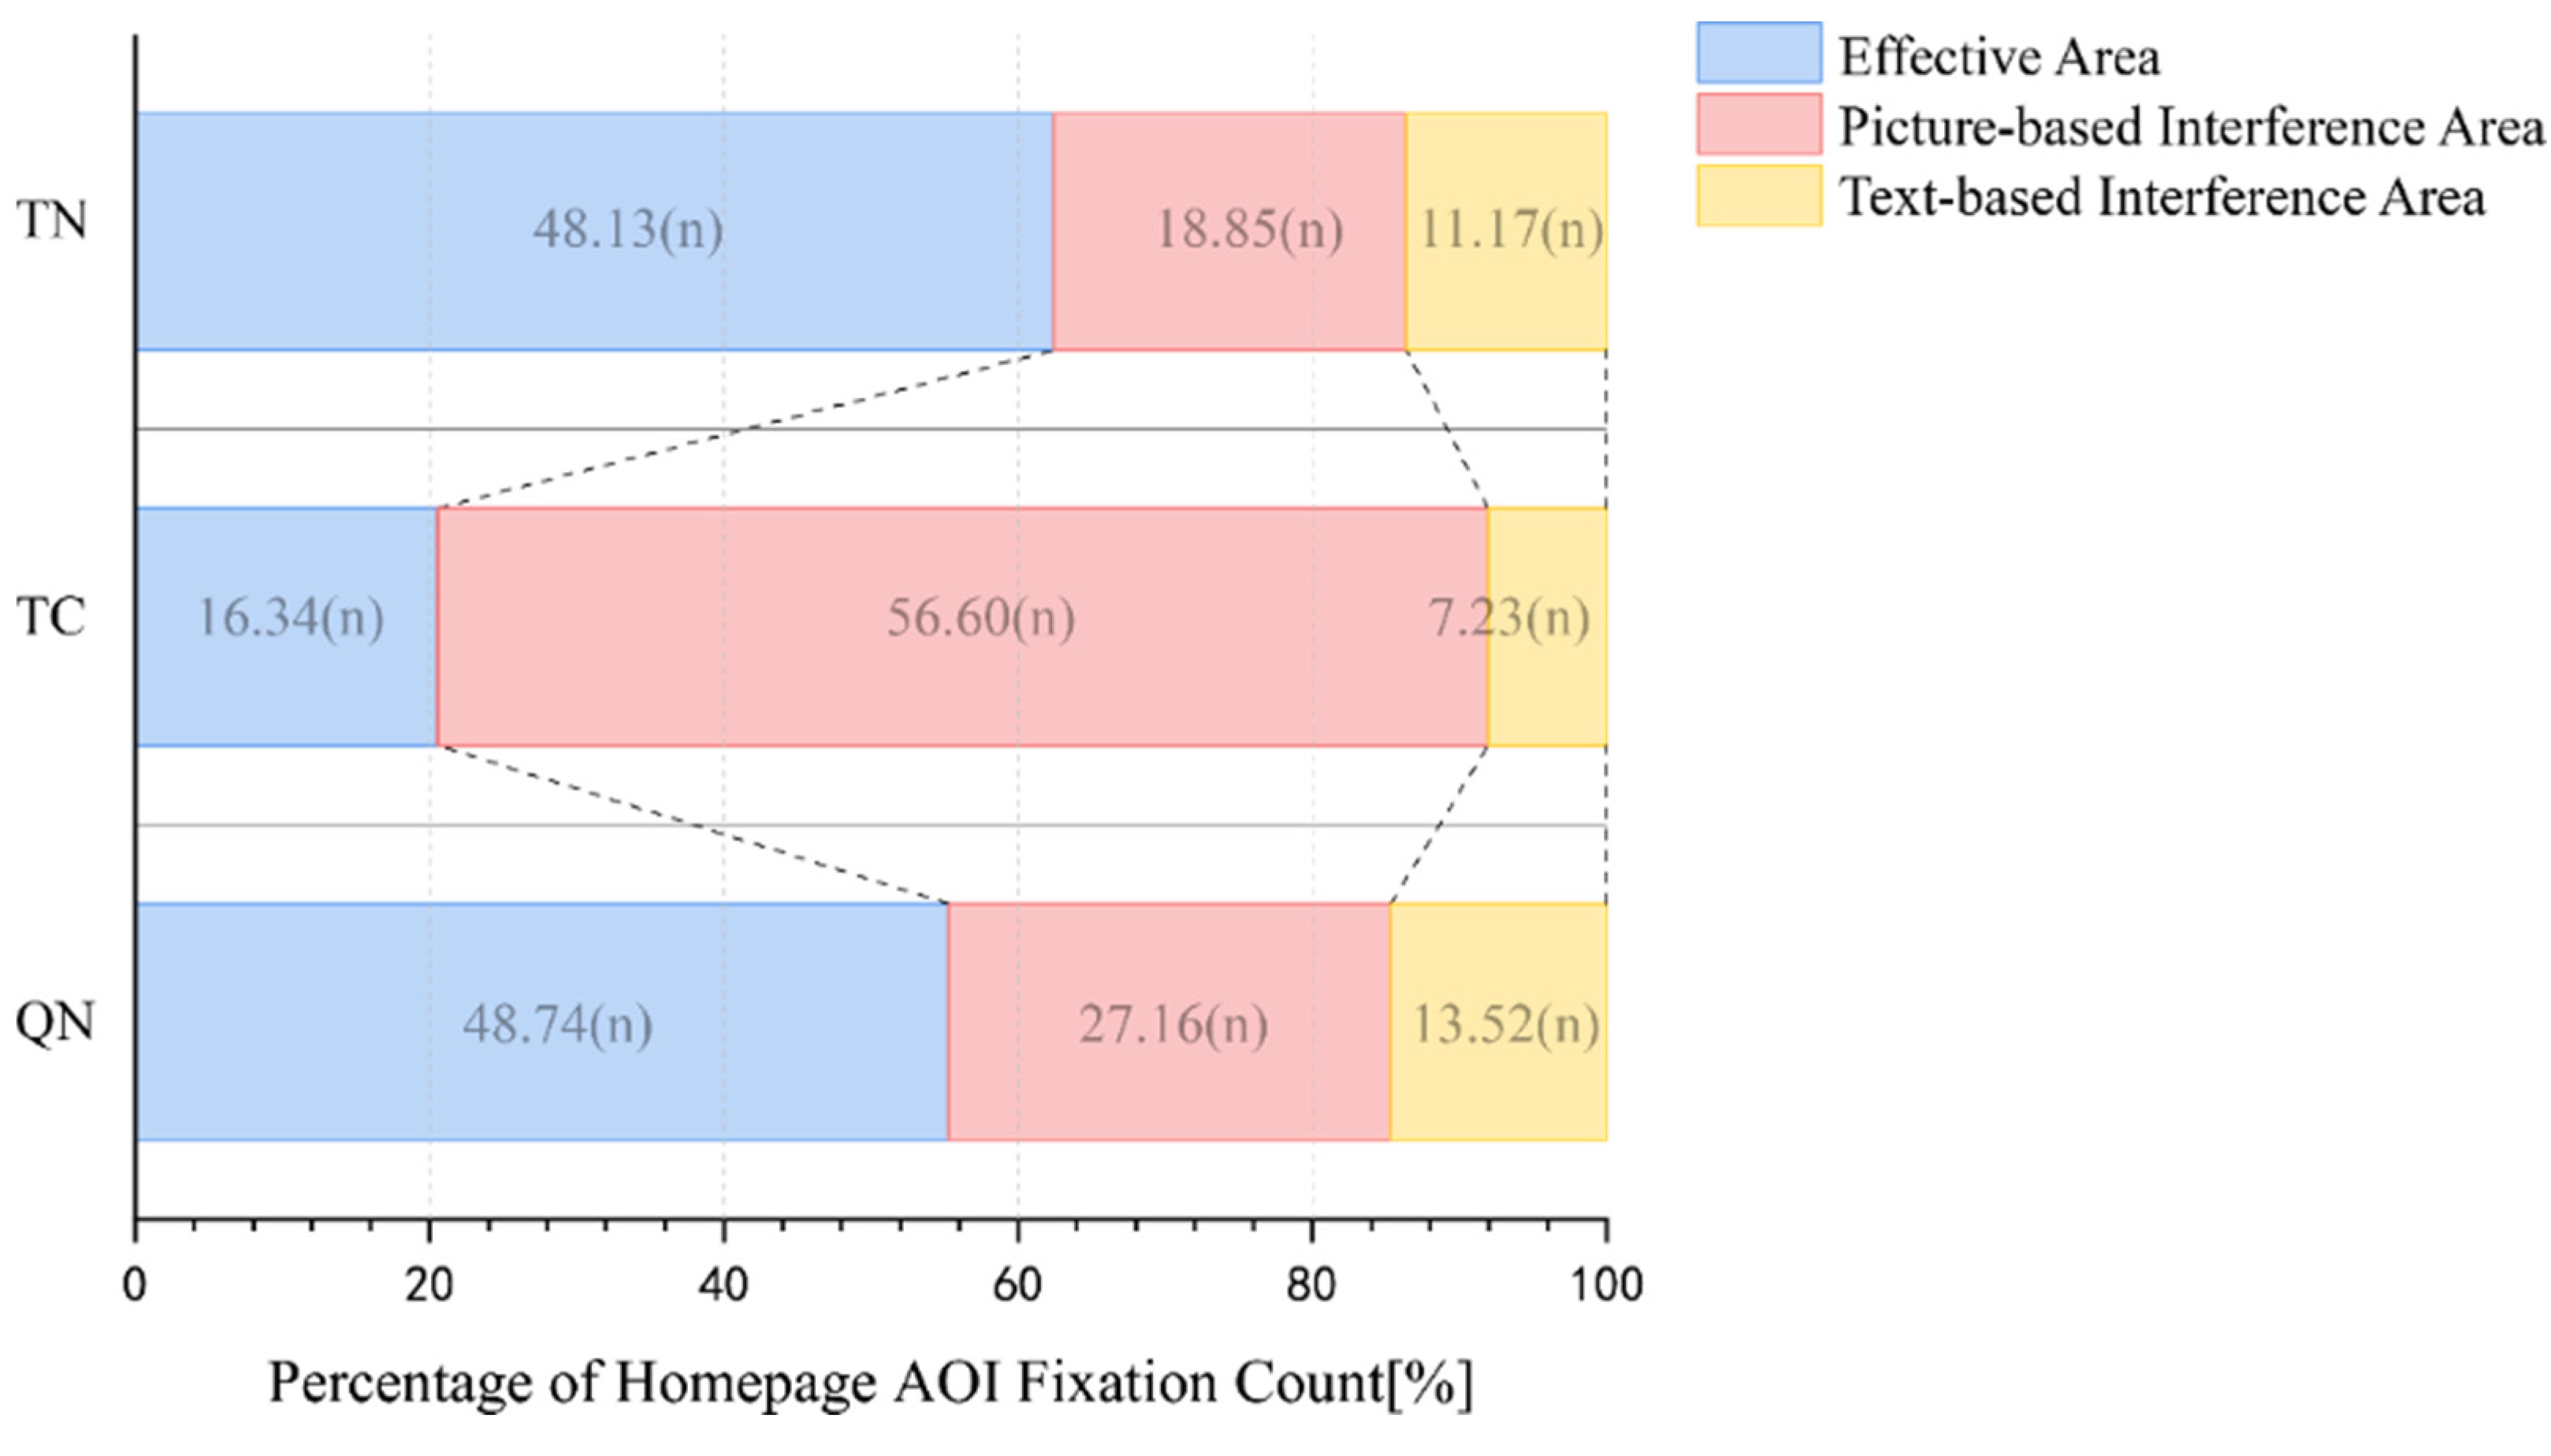
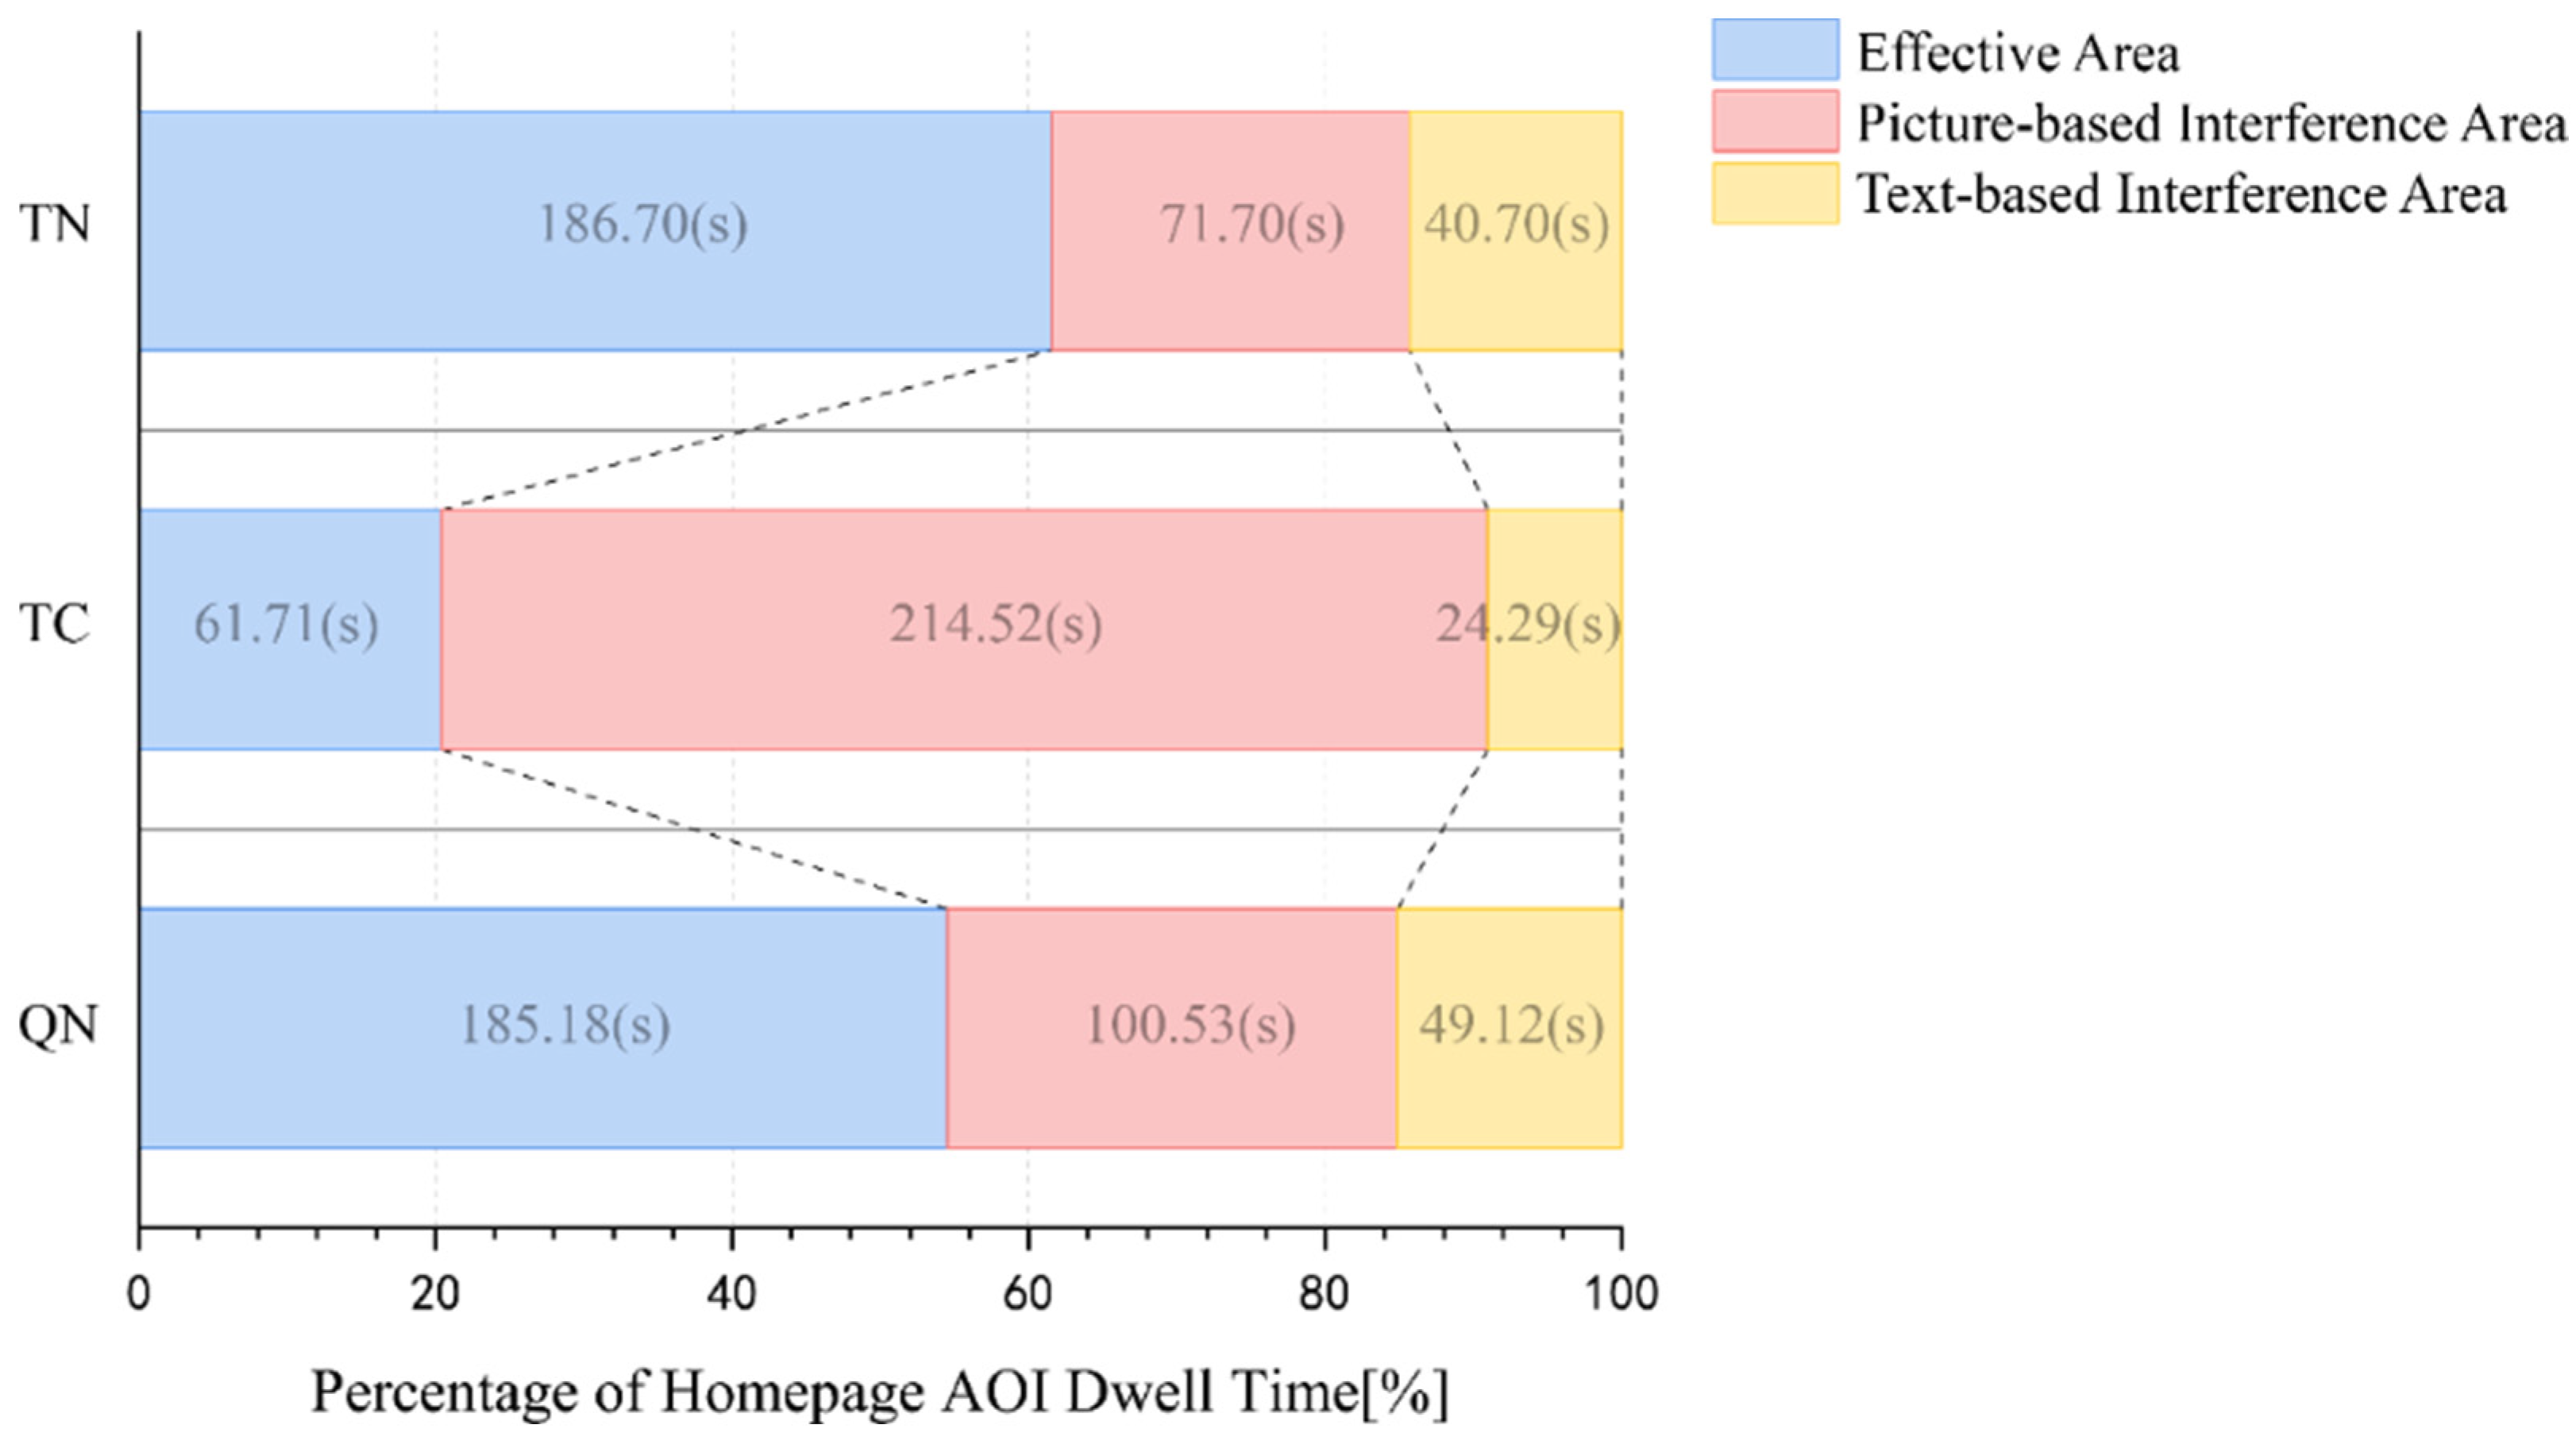
3.4.2. Effective and Interference Areas

Eye-tracking metrics, including fixation count and dwell time, were systematically recorded to evaluate information search efficiency and assess the interference effects of pictorial versus textual elements during task completion (Table 4). Statistical analysis using independent samples t-tests revealed significant differences in visual behavior patterns across the three website interfaces (QN, TC, and TN) regarding both fixation counts and dwell time in effective versus interference zones (p < 0.001). These findings confirmed substantial variations in user interaction patterns with effective and interference zones across the different travel websites.
Gender-based analysis of visual behavior patterns yielded interesting findings: male participants demonstrated significantly longer dwell times (p < 0.05) and higher fixation counts (p < 0.05) in effective areas compared to female participants. This suggests that male users exhibited more focused attention on task-relevant areas and were less susceptible to interference from non-essential elements, whereas female users showed greater visual engagement with interference zone content during task execution. These findings are significant, as they reveal that male users generally exhibit higher search efficiency. The more focused attention of male users on effective areas can lead to less cognitive load and resource consumption, which in turn contributes to the sustainability of tourism websites by reducing server demands and improving overall system efficiency.

3.4.3. Analysis of Interference Zones

The interference zones were further categorized into picture-based and text-based information to analyze their respective impacts on user behavior (Table 5). Independent samples t-tests revealed significant differences among the QN, TC, and TN travel websites in the number of fixation counts and total dwell time within picture-based interference zones (p < 0.05). The picture-based interference zone on TC’s website had the most pronounced effect on participants, followed by QN and TN (56.60 > 27.16 > 18.85).
Further analysis of gender differences in picture-based interference zones showed that females had higher total dwell times (43.10 s > 31.00 s) and fixation counts (11.51 > 8.40) compared to males, indicating that females were more significantly affected by picture-based interference content. Additionally, the proportion of total dwell time and fixation counts in picture-based interference zones was higher for females than for males. These findings suggested that females are more susceptible to distraction from picture-based information compared to males.
Platform design significantly impacted search efficiency by influencing how users interact with both effective and interference areas. Websites with a higher proportion of task-relevant elements and a more organized layout, such as TC, tend to facilitate faster and more efficient information retrieval. Although users spent more time in the picture-based interference zones on TC’s website, their time in the effective area was also relatively short. Moreover, when considering the task completion efficiency across the three websites, users completed tasks most efficiently on TC. This indicated that even if interference zones attract more attention, a well-organized website layout can still enable users to locate key information effectively, making such a design efficient. The design of TC appeared to be more conducive to efficient visual search, particularly benefiting male users, who demonstrate more focused attention on effective areas. Conversely, the more extensive visual attention distribution within interference areas on QN and TN might contribute to longer task completion times, especially for female users, who were more affected by such distractions. By concentrating user attention on essential information, travel websites could reduce the cognitive resources users need to expand during their search. This led to a more streamlined interaction with the website, which in turn lowered the operational load on the website’s servers. Fewer server requests and less data processing meant reduced energy consumption and a smaller carbon footprint.

4. Discussion

Online travel platforms have significantly enhanced convenience in daily life, while the demand for comprehensive travel information services continues to grow. Users now expect travel websites to provide not only attraction inquiries but also integrated services such as flight and hotel bookings, attraction reservations, and more. Moreover, improving task completion efficiency on travel websites not only enhances user experience but also contributes to environmental sustainability by reducing digital carbon footprints. To remain competitive, travel websites often prioritize extensive content and multifunctional designs, resulting in complex interface layouts. However, this complexity frequently leads to challenges in efficiently retrieving specific information from an overwhelming amount of content.
To address this issue, travel websites should focus on improving search efficiency and delivering a positive user experience. This leads to decreased energy consumption as users achieve their goals more efficiently. By integrating insights from website design and usability literature, this study contributed to the broader understanding of how website design influences users’ visual search efficiency and experience, aligning with the promotion of environmental protection. This research employed a multimodal approach, combining behavioral measurements and eye-tracking technology to provide actionable recommendations for optimizing travel website interfaces.

4.1. Theoretical Implications

This study analyzed the impact of travel website design on user task completion efficiency. By integrating eye-tracking technology with psychological and design theories, this study provides a novel framework for understanding user behavior on travel websites. Eye-tracking technology provided a quantitative method for collecting and analyzing users’ visual attention, enabling researchers to precisely measure the time and frequency of participants’ interactions with travel websites. By observing participants’ eye movement patterns, this study identified critical factors influencing travel website design. The results revealed significant variations in user attention across different design elements, offering valuable guidance for optimizing website layouts.
A key finding was the importance of strategically distributing graphical and textual content to enhance interactive usability. While participants primarily focused on effective zones for information retrieval, they were also distracted by non-target elements, such as advertisements and pop-up windows, which negatively impacted task performance. Notably, graphical distractions in interference areas were more disruptive than textual ones, suggesting that minimizing such elements can improve task completion rates.
By combining eye-tracking data with statistical methods like one-way ANOVA, this study quantitatively identified user pain points and provided actionable insights for future design improvements. The integration of eye-tracking technology with psychological and design theories represented an innovative approach to web design, with potential applications extending beyond travel websites to various other disciplines. The findings not only enhance our understanding of how different genders and website designs influence search efficiency but also offer actionable recommendations for optimizing website layouts to support sustainable tourism.

4.2. Practical Implications

This study revealed significant differences in user attention across various areas of travel websites, directly influencing search efficiency. These findings offer actionable guidance for travel website design. Designers should strategically balance the distribution of graphical and textual content to enhance interactive usability. Effective zones, which facilitate quick information retrieval, should be prominently featured, while interference areas—particularly those with graphical distractions—must be minimized to improve task completion rates.
This study highlights the importance of evaluating the impact of every page element on user experience. By integrating eye-tracking technology with design thinking principles, designers can identify and prioritize critical areas, leading to more intuitive and user-friendly interfaces. This interdisciplinary approach extends beyond website design, with potential applications in advertising, packaging design, and other fields in which user interaction and visual attention are paramount.

4.3. Limitations and Future Work

This study had several limitations. First, the participants’ ages ranged from 18 to 35. While this demographic represents a significant portion of travel website users, it may not fully capture the diversity of all users. Future studies should include participants with broader demographic backgrounds to enhance generalizability. Also, this study did not consider the influence of time of day and context of use, which can significantly affect user behavior on websites. Future research should explore how different time frames, user fatigue levels, and search purposes impact task completion efficiency and user experience. This would provide a more comprehensive understanding of the factors influencing user interactions with travel websites and other platforms.
Second, the study focused on labeling areas of interest (AOIs) for homepages, but participants’ navigation to subsequent pages was somewhat random. When participants’ attention shifted away from these pages, it became challenging to define and analyze attention areas consistently.
Third, while the study examined participants’ attention through metrics such as fixation counts, fixation duration, heatmaps, and AOI indices, it did not fully explore other eye movement behaviors. For instance, the frequency and sequence of visual navigation, as well as other eye-tracking indices, were not thoroughly investigated. Another limitation is the potential influence of participants’ familiarity with the websites. Our study selected participants based on their recent travel experience or plans for future travel but did not specifically assess their prior experience with the tested websites. Future research could address these aspects to provide a more comprehensive understanding of user behavior.
Fourth, the experimental conditions were rigorously controlled to minimize external influences, which may not fully replicate real-world computer interface usage. Future studies could explore user experience in more natural settings to better reflect everyday interactions with travel websites.
Finally, due to equipment constraints, this experiment only tested users’ task completion on websites, which might differ from mobile interfaces. Given that 47% of participants access travel websites via smartphones, we plan to test task completion on mobile devices in the next stage to gain a more comprehensive understanding of user behavior across different devices.

5. Conclusions

This study investigated the effects of gender, website design, effective regions, and interference regions on visual search efficiency and task completion. The main findings are as follows. (1) Website design impact: The distribution of effective and interference areas significantly influenced participants’ task completion efficiency. Participants spent the longest dwell time and had the highest fixation counts on TN’s homepage, followed by QN, indicating that these websites presented greater challenges in locating key information, resulting in lower usability. (2) Effective area optimization: The proportion and distribution of effective areas played a critical role in task efficiency. For instance, QN’s homepage had the smallest effective area and a higher number of picture-based interference areas, which prolonged participants’ search times and reduced task completion efficiency.
Based on these findings, the following recommendations are proposed for travel website design. (1) Clear distinction between zones: On homepages and key pages, effective and interference areas should be clearly distinguished, with critical information placed in prominent locations to facilitate quick access. (2) Minimize interference elements: The number and size of interference elements should be reduced and their layout optimized to minimize disruptions to users’ information search processes. (3) Optimize effective zones: Within the limited space of effective zones, information should be organized logically and displayed intuitively, using clear categorization and hierarchical structures to enhance user comprehension.
According to the records of the experimental process, it was found that participants needed to operate four to eight times during the process of completing specific tasks, including two to five web page loads. If website design is optimized and the number of web page loading times during each person’s task completion is reduced by one to three times, the carbon emissions generated by each person are expected to be reduced by 0.6 to 1.8 g. Optimizing website design can enhance users’ search efficiency, reduce the computing burden on the server, and thereby lower energy consumption.
The insights gained from optimizing tourism website design could inform improvements for other platforms, such as hotel booking sites, tour recommendation platforms, and multimedia websites. Future research will explore how to adapt and apply these methodologies to other types of websites to enhance user experience and efficiency.
These recommendations aim to improve the usability and efficiency of travel websites, ultimately enhancing user satisfaction and task performance. Higher user search efficiency not only enhances user satisfaction and task performance but also contributes to lower website operational loads. By carefully designing the distribution of effective and interference areas, travel websites can be more environmentally friendly and resource-efficient. Effective zones in particular should be prioritized in design, as they are more sustainable and help conserve website resources, ultimately supporting the broader goals of sustainable tourism.

Author Contributions

Conceptualization, C.C. and K.H.; methodology, C.C. and K.H.; formal analysis, K.H.; writing—original draft preparation, C.C. and K.H.; writing—review and editing, C.C. and K.H.; visualization, K.H.; supervision, C.C.; project administration, C.C.; funding acquisition, C.C. All authors have read and agreed to the published version of the manuscript.

Funding

This research was funded by a National Natural Science Foundation of China Grant, grant number 72201128, and the China Postdoctoral Science Foundation, grant number 2023M730483.

Institutional Review Board Statement

This is an experiment on study, which has been approved by the IEC of College of Furnishings and Industrial Design, Nanjing Forestry University, with the ethical approval number 2024113, and date of approval 2 August 2024.

Informed Consent Statement

Informed consent was obtained from all participants involved in the study.

Data Availability Statement

Data will be made available on request.

Acknowledgments

During the preparation of this work, the authors used DeepSeek in order to improve language. After using this tool, the authors reviewed and edited the content as needed and take full responsibility for the content of the publication.

Conflicts of Interest

The authors declare no conflicts of interest.

References

  1. Istrate, R.; Tulus, V.; Grass, R.N.; Vanbever, L.; Stark, W.J.; Guillén-Gosálbez, G. The Environmental Sustainability of Digital Content Consumption. Nat. Commun. 2024, 15, 3724. [Google Scholar] [CrossRef]
  2. Ozcan, B.; Apergis, N. The Impact of Internet Use on Air Pollution: Evidence from Emerging Countries. Environ. Sci. Pollut. Res. 2018, 25, 4174–4189. [Google Scholar] [CrossRef] [PubMed]
  3. Lokmic-Tomkins, Z.; Davies, S.; Block, L.J.; Cochrane, L.; Dorin, A.; von Gerich, H.; Lozada-Perezmitre, E.; Reid, L.; Peltonen, L.-M. Assessing the Carbon Footprint of Digital Health Interventions: A Scoping Review. J. Am. Med. Inform. Assoc. 2022, 29, 2128–2139. [Google Scholar] [CrossRef]
  4. Paul, S.G.; Saha, A.; Arefin, M.S.; Bhuiyan, T.; Biswas, A.A.; Reza, A.W.; Alotaibi, N.M.; Alyami, S.A.; Moni, M.A. A Comprehensive Review of Green Computing: Past, Present, and Future Research. IEEE Access 2023, 11, 87445–87494. [Google Scholar] [CrossRef]
  5. Osipov, A.V.; Pleshakova, E.S.; Gataullin, S.T. Production Processes Optimization through Machine Learning Methods Based on Geophysical Monitoring Data. Comput. Opt. 2024, 48, 633–642. [Google Scholar] [CrossRef]
  6. Adelaar, T.; Chang, S.; Lancendorfer, K.M.; Lee, B.; Morimoto, M. Effects of Media Formats on Emotions and Impulse Buying Intent. J. Inf. Technol. 2003, 18, 247–266. [Google Scholar] [CrossRef]
  7. Townsend, C.; Kahn, B.E. The “Visual Preference Heuristic”: The Influence of Visual versus Verbal Depiction on Assortment Processing, Perceived Variety, and Choice Overload. J. Consum. Res. 2014, 40, 993–1015. [Google Scholar] [CrossRef]
  8. Yoo, J.; Kim, M. The Effects of Home Page Design on Consumer Responses: Moderating Role of Centrality of Visual Product Aesthetics. Comput. Hum. Behav. 2014, 38, 240–247. [Google Scholar] [CrossRef]
  9. Amsl, S.; Watson, I.; Teller, C.; Wood, S. Presenting Products on Websites—The Importance of Information Quality Criteria for Online Shoppers. Int. J. Retail Distrib. Manag. 2023, 51, 1213–1238. [Google Scholar] [CrossRef]
  10. Lee, Y.-C.; Peng, C.-H.; Sia, C.-L.; Ke, W. Effects of Visual-Preview and Information-Sidedness Features on Website Persuasiveness. Decis. Support Syst. 2025, 188, 114361. [Google Scholar] [CrossRef]
  11. Capucho, J.; Leitão, J.; Alves, H. Mapping and Linking Well-Being, Tourism Economics, Sustainable Tourism and Sustainable Development: An Integrative Systematisation of the Literature and Bibliometric Analysis. Discov. Sustain. 2025, 6, 291. [Google Scholar] [CrossRef]
  12. Zeqiri, A.; Ben Youssef, A.; Maherzi Zahar, T. The Role of Digital Tourism Platforms in Advancing Sustainable Development Goals in the Industry 4.0 Era. Sustainability 2025, 17, 3482. [Google Scholar] [CrossRef]
  13. Bortko, K.; Jankowski, J.; Bartków, P.; Pazura, P.; Śmiałkowska, B. Attracting User Attention to Visual Elements within Website with the Use of Fitts’s Law and Flickering Effect. Procedia Comput. Sci. 2020, 176, 2756–2763. [Google Scholar] [CrossRef]
  14. Bakaev, M.; Heil, S.; Jagow, J.; Speicher, M.; Bauer, K.; Gaedke, M. A Taxonomy of User Behavior Model (UBM) Tools for UI Design and User Research. In Web Engineering, ICWE 2023; Garrigos, I., Rodriguez, J.M.M., Wimmer, M., Eds.; Springer International Publishing Ag: Cham, Switzerland, 2023; Volume 13893, pp. 236–244. [Google Scholar]
  15. Qing, H.; Ibrahim, R.; Nies, H.W. Analysis of Web Design Visual Element Attention Based on User Educational Background. Sci. Rep. 2024, 14, 4657. [Google Scholar] [CrossRef]
  16. Priyadarshini, A.P. The Impact of User Interface Design on User Engagement. Int. J. Eng. Res. 2024, 13, IJERTV13IS030232. [Google Scholar]
  17. Sonmez, F.; Aydin, U.; Perdahci, Z.N. Investigation of University Websites from Technology Acceptance Model and Information Architecture Perspective: A Case Study. J. Inf. Sci. 2024, 50, 466–480. [Google Scholar] [CrossRef]
  18. King, A.J.; Lazard, A.J.; White, S.R. The Influence of Visual Complexity on Initial User Impressions: Testing the Persuasive Model of Web Design. Behav. Inf. Technol. 2020, 39, 497–510. [Google Scholar] [CrossRef]
  19. Ramya, P.; Jai Sai Chaitanya, K.; Fardeen, S.K.; Prabhakar, G. Web Design as an Important Factor in the Success of a Website. In Smart Technologies in Data Science and Communication; Ogudo, K.A., Saha, S.K., Bhattacharyya, D., Eds.; Springer Nature: Singapore, 2023; pp. 51–60. [Google Scholar]
  20. Lee, J.; Morrison, A.M. A Comparative Study of Web Site Performance. J. Hosp. Tour. Technol. 2010, 1, 50–67. [Google Scholar] [CrossRef]
  21. Munoz-Leiva, F.; Hernandez-Mendez, J.; Gomez-Carmona, D. Measuring Advertising Effectiveness in Travel 2.0 Websites through Eye-Tracking Technology. Physiol. Behav. 2019, 200, 83–95. [Google Scholar] [CrossRef]
  22. Ruel Novabos, C.; Matias, A.; Mena, M. How Good Is This Destination Website: A User-Centered Evaluation of Provincial Tourism Websites. In Proceedings of the 6th International Conference on Applied Human Factors and Ergonomics (Ahfe 2015) and the Affiliated Conferences, AHFE 2015, Caesars Palace, LV, USA, 26–30 July 2015; Ahram, T., Karwowski, W., Schmorrow, D., Eds.; Elsevier Science Bv: Amsterdam, The Netherlands, 2015; Volume 3, pp. 3478–3485. [Google Scholar]
  23. Lei, X.; Yang, D. Analysis on the Impact of Internet Use on Residents’ Tourism Consumption Behavior and the Mechanism of Action. PLoS ONE 2024, 19, e0311998. [Google Scholar] [CrossRef]
  24. Majeed, S.; Zhou, Z.; Lu, C.; Ramkissoon, H. Online Tourism Information and Tourist Behavior: A Structural Equation Modeling Analysis Based on a Self-Administered Survey. Front. Psychol. 2020, 11, 599. [Google Scholar] [CrossRef]
  25. Uthaisar, S.; Eves, A.; Wang, X.L. Tourists’ Online Information Search Behavior: Combined User-Generated and Marketer-Generated Content in Restaurant Decision Making. J. Travel Res. 2024, 63, 1549–1573. [Google Scholar] [CrossRef]
  26. Chatterjee, A. (Ed.) Chapter C—Information Users. In Elements of Information Organization and Dissemination; Chandos Publishing: Hull, UK, 2017; pp. 47–71. ISBN 978-0-08-102025-8. [Google Scholar]
  27. Wilson, T.D. Approaches to Information-Seeking Behaviour in Psychology: A Comparison of Early and Contemporary Studies. Inf. Res. 2024, 29, 34–53. [Google Scholar] [CrossRef]
  28. Ben Mimoun, M.S.; Garnier, M.; Ladwein, R.; Benavent, C. Determinants of E-Consumer Productivity in Product Retrieval on a Commercial Website: An Experimental Approach. Inf. Manag. 2014, 51, 375–390. [Google Scholar] [CrossRef]
  29. Huang, Z. Usability of Tourism Websites: A Case Study of Heuristic Evaluation. New Rev. Hypermedia Multimed. 2020, 26, 55–91. [Google Scholar] [CrossRef]
  30. Li, Y.; Yuan, X.; Che, R. An Investigation of Task Characteristics and Users ? Evaluation of Interaction Design in Different Online Health Information Systems. Inf. Process. Manag. 2021, 58, 102476. [Google Scholar] [CrossRef]
  31. Song, G.F.; Salvendy, G. A Framework for Reuse of User Experience in Web Browsing. Behav. Inf. Technol. 2003, 22, 79–90. [Google Scholar] [CrossRef]
  32. García, M.; Cano, S. Eye Tracking to Evaluate the User eXperience (UX): Literature Review. In Social Computing and Social Media: Design, User Experience and Impact; Meiselwitz, G., Ed.; Springer International Publishing: Cham, Switzerland, 2022; pp. 134–145. [Google Scholar]
  33. Poole, A.; Ball, L.J. Eye Tracking in Human-Computer Interaction and Usability Research: Current Status and Future Prospects; Idea Group Reference: Hershey, PA, USA, 2004. [Google Scholar]
  34. Guo, F.; Ding, Y.; Liu, W.; Liu, C.; Zhang, X. Can Eye-Tracking Data Be Measured to Assess Product Design?: Visual Attention Mechanism Should Be Considered. Int. J. Ind. Ergon. 2016, 53, 229–235. [Google Scholar] [CrossRef]
  35. Ho, C.-H.; Lu, Y.-N. Can Pupil Size Be Measured to Assess Design Products? Int. J. Ind. Ergon. 2014, 44, 436–441. [Google Scholar] [CrossRef]
  36. Carter, B.T.; Luke, S.G. Best Practices in Eye Tracking Research. Int. J. Psychophysiol. 2020, 155, 49–62. [Google Scholar] [CrossRef]
  37. Alemdag, E.; Cagiltay, K. A Systematic Review of Eye Tracking Research on Multimedia Learning. Comput. Educ. 2018, 125, 413–428. [Google Scholar] [CrossRef]
  38. Tian, X.; Fang, Z.; Liu, W. Decreased Humidity Improves Cognitive Performance at Extreme High Indoor Temperature. Indoor Air 2021, 31, 608–627. [Google Scholar] [CrossRef]
  39. Tangmanee, C. FIXATION AND RECALL OF YOUTUBE AD BANNERS: AN EYE-TRACKING STUDY. Int. J. Electron. Commer. Stud. 2016, 7, 49–76. [Google Scholar] [CrossRef]
Figure 1. The experimental process.
Sustainability 17 05462 g001
Figure 2. Homepages of travel websites. (a) Homepage of QN; (b) homepage of TC; (c) homepage of TN.
Sustainability 17 05462 g002aSustainability 17 05462 g002b
Figure 3. Experimental equipment.
Sustainability 17 05462 g003
Figure 4. Heatmap of the homepages. (a) Homepage of QN; (b) homepage of TC; (c) homepage of TN.
Sustainability 17 05462 g004
Figure 5. The fixation counts of three websites when searching for tickets.
Sustainability 17 05462 g005
Figure 6. The dwell time of three websites when searching for tickets.
Sustainability 17 05462 g006
Figure 7. Partition of homepages. (a) Partition of QN homepage; (b) partition of TC homepage; (c) partition of TN homepage.
Sustainability 17 05462 g007
Figure 8. The percentage of homepage AOI fixation count.
Sustainability 17 05462 g008
Figure 9. The percentage of homepage AOI dwell time.
Sustainability 17 05462 g009
Table 1. Questionnaire about travel websites.
QuestionChoiceNumberPercentage (%)
1. AgeUnder 185 (2, 3)2.16
18–2576 (35, 41)32.76
26–3577 (32, 45)33.19
36–4535 (14, 21)15.09
46–5522 (11, 11)9.48
Over 5617 (6, 11)7.33
2. GenderMale10043.10
Female13256.90
3. Do you know that the Internet is the biggest source of carbon emissions?Fully understand12 (8, 4)5.17
Heard of it, but don’t know the details114 (60, 54)49.14
Know a little about103 (31, 72)44.40
Never heard of it3 (1, 2)1.29
4. How frequently do you visit travel websites?Daily8 (2, 6)3.45
Weekly34 (16, 18)14.66
Monthly124 (60, 64)53.45
Occasionally56 (16, 40)24.14
Never10 (6, 4)4.31
5. What is your main purpose for visiting travel websites? (multiple choice)Flight booking131 (60, 71)56.47
Hotel booking121 (41, 80)52.16
Guidance searching107 (48, 59)46.12
Destination searching/information74 (30, 44)31.90
Prices comparison68 (28, 40)29.31
6. What is the main device you use to access travel websites? Smartphone109 (49, 60)46.98
Tablet21 (5, 16)9.05
Laptop/Desktop94 (44, 50)40.52
Other8 (2, 6)3.45
7. When choosing a travel website, do you consider whether the website adopts a low-carbon and environmentally friendly design?Always4 (2, 2)1.72
Often16 (5, 11)6.90
Sometimes66 (30, 36)28.45
Seldom102 (46, 56)43.97
Never44 (17, 27)18.97
8. Which travel website do you visit most frequently?www.Ly.com53 (21, 32)23.70
www.Qunar.com49 (24, 25)21.12
www.Tuniu.com68 (30, 38)29.31
www.Ctrip.com23 (11, 12)9.91
www.Fliggy.com19 (9, 10)8.19
Other (please specify)20 (5, 15)8.62
9. What is the main reason for choosing this website? (multiple choice)User-friendly interface72 (39, 33)31.03
Comprehensive Information95 (55, 40)40.95
Price advantages55 (25, 30)23.71
Quality service80 (48, 32)34.48
Fast website operation40 (18, 22)17.24
Other (please specify)10 (4, 6)4.31
10. Which function or service do you value most when using travel websites?Quick search81 (36, 45)34.91
User reviews64 (30, 34)27.59
Customized function recommendations50 (20, 30)21.55
Maps and navigation37 (14, 23)15.95
The data in the column “Number” are presented as the total (number of males, number of females).
Table 2. Eye movement index when searching for tickets.
Eye Movement IndexSampleGenderMeanMeanStandard DeviationStandard Deviationp
Fixation Count (n)QNMale75.5083.88 42.5143.720.00
Female91.3338.97
TCMale36.1440.10 7.8015.74
Female42.0718.45
TNMale84.6095.2714.1530.80
Female104.1739.09
Dwell Time (s)QNMale28.8934.2314.1514.600.00
Female38.9714.12
TCMale12.6614.083.545.62
Female14.796.42
TNMale34.2738.495.1812.20
Female42.0015.60
Table 4. Effective and interference areas and eye movement index.
Website Dwell Time of
Effective Areas (s)
Fixation Count
of Effective Areas (n)
Dwell Time
of Interference Areas (s)
Fixation Count
of Interference Areas (n)
QNMeanMale62.22 48.74234.38185.1835.9740.68143.38149.65
Female36.74141.4444.87155.22
Standard deviationMale21.6623.5078.4387.4627.7228.65110.76109.79
Female18.7273.0930.45115.33
VarianceMale469.02552.146151.707648.80768.64820.8312,267.4112,054.24
Female350.245342.79927.1413,300.19
TCMeanMale18.1016.3470.7161.7157.1263.83216.00238.81
Female15.4657.2167.19250.21
Standard deviationMale8.116.8642.3929.7324.0622.1283.4678.13
Female6.2821.5621.1975.87
VarianceMale65.8347.051796.91883.61578.96489.24 6965.67 6104.76
Female39.49464.64449.005756.80
TNMeanMale56.7348.13227.75186.7015.2830.0263.25112.40
Female42.40159.3339.84145.17
Standard deviationMale14.6315.4029.8469.914.4019.2026.5969.98
Female14.1477.5619.0271.89
VarianceMale213.95237.15890.254887.1219.34368.49706.924896.49
Female200.066015.87361.815168.57
TotalMeanMale44.8134.44172.68131.4839.4048.59153.26180.90
Female27.64104.4854.60199.00
Standard deviationMale26.1522.6697.7288.2227.4227.53102.88102.42
Female17.3770.8326.3599.72
VarianceMale683.87513.599548.567782.09751.64757.9710,584.9810,488.99
Female301.635017.47694.289944.29
p 0.00 0.00 0.001 0.001
Table 5. Interference zones and eye movement index.
Website Dwell Time
of Picture-Based Interference Area (s)
Fixation Count
of Picture-Based Interference Area
(n)
Dwell Time
of Text-Based Interference Area
(s)
Fixation Count
of Text-Based Interference Area
(n)
QNMeanMale24.6427.1699.88100.5311.3313.5243.5049.12
Female29.40101.1115.4754.11
Standard deviationMale24.9725.47103.8299.764.2412.3916.7143.26
Female27.19102.3416.8058.64
VarianceMale623.30648.5110,779.249952.5217.96153.42279.141871.11
Female739.5110,472.36282.083438.36
TCMeanMale50.5256.60192.86214.526.597.2323.1424.29
Female59.65225.367.5424.86
Standard deviationMale22.7419.3573.3769.368.096.4926.6519.11
Female17.5367.365.8615.26
VarianceMale517.05374.275382.484810.4665.4342.15710.14365.01
Female307.204537.3234.30232.75
TNMeanMale9.5818.8542.0071.705.7011.1721.2540.70
Female25.0391.5014.8153.67
Standard deviationMale3.4213.6313.2249.3044.787.4916.6826.54
Female14.5855.636.9024.43
VarianceMale11.69185.76174.672430.9022.8456.15278.25704.46
Female212.593094.7047.54596.67
TotalMeanMale31.0038.31121.947144.3968.4010.2831.3236.50
Female43.10159.10311.5139.90
Standard deviationMale26.1726.2898.01899.5916.279.4422.5032.48
Female25.6799.53110.9737.63
VarianceMale684.83690.709607.509918.37239.3189.05506.121055.19
Female659.049906.45120.261415.67
p 0.000 0.000 0.116 0.054
Table 3. ANOVA of eye movement index when searching for tickets.
Degrees of FreedomMean SquareFp
Fixation Count (n)Between-group214,408.5114.7240
Within-group46978.603
Total48
Dwell Time (s)Between-group22918.924.2090
Within-group46120.57
Total48
Disclaimer/Publisher’s Note: The statements, opinions and data contained in all publications are solely those of the individual author(s) and contributor(s) and not of MDPI and/or the editor(s). MDPI and/or the editor(s) disclaim responsibility for any injury to people or property resulting from any ideas, methods, instructions or products referred to in the content.

