Article

Ergonomics Management Evaluation Model for Supply Chain: An Axiomatic Design Approach

by
Iván Francisco Rodríguez-Gámez
1,2,
Aide Aracely Maldonado-Macías
3,*,
Ernesto Alonso Lagarda-Leyva
2,
Juan Luis Hernández-Arellano
4,
Yordán Rodríguez
5 and
Arnulfo Naranjo-Flores
2
1
Department of Electrical Engineering and Computer Sciences, Autonomous University of Ciudad Juarez, Del Charro Ave. 450N, Ciudad Juarez 32310, Chihuahua, Mexico
2
Department of Industrial Engineering, Sonora Institute of Technology, 5 de Febrero 818 Sur Col. Centro, Ciudad Obregon 85000, Sonora, Mexico
3
Department of Industrial Engineering and Manufacturing, Autonomous University of Ciudad Juarez, Del Charro Ave. 450N, Ciudad Juarez 32310, Chihuahua, Mexico
4
Department of Design, Autonomous University of Ciudad Juarez, Del Charro Ave. 450N, Ciudad Juarez 32310, Chihuahua, Mexico
5
National School of Public Health, University of Antioquia, Medellin 050010, Colombia
*
Author to whom correspondence should be addressed.
Sustainability 2025, 17(12), 5458; https://doi.org/10.3390/su17125458
Submission received: 8 March 2025 / Revised: 31 May 2025 / Accepted: 3 June 2025 / Published: 13 June 2025

Abstract

Organizations worldwide are moving towards sustainability in the supply chains (SCs). Ergonomics management (EM) in SCs can contribute to their social sustainability (SS) by providing a fair, safe, and healthy environment. The literature recognizes the lack of an ergonomics management evaluation model (EMEM) for SCs contributing to SS. This research aims to propose an EMEM applicable to SCs. A continuous improvement approach with five constructs: Plan, Do, Check, Act, and Leadership and Worker participation (L&WP) was conducted, including nineteen domains, and the axiomatic design methodology was deployed. Design ranges (DRs) were defined by 34 experts from Latin America. System ranges (SRs) were assessed by self-assessments of EM practices to obtain the information content axiom in one case study of the Mexican salt industry. A new ergonomics management index for the supply chain (EMISC) and a corresponding scale were implemented. According to this scale, the index was found to be low, indicating a poor ergonomics management index (EMI) for the supplier link across the nineteen domains. The proposed EMEM effectively obtains an EMI of the supply chain (SC) by link and entirely. The model identifies opportunities to improve ergonomics practices for companies participating in sustainable supply chains (SSC).

1. Introduction

There is a growing focus on sustainable management of supply chains (SCs) [1], and sustainable practices have been adopted on a large scale [2,3]. According to Coyle et al. [4], SCs are integrated by companies that must share information and coordinate physical execution for an integrated and fluid flow of goods, services, information, and cash. Therefore, the focus on sustainability in SCs seeks a balance of three pillars: economic growth, social welfare, and environmental protection, promoting responsible and efficient use of resources. This balance can be achieved by implementing strategies addressing these three fundamental sustainability aspects. Social sustainability (SS) is where the present research contributes since it seeks to provide an evaluation model of ergonomics management (EM) to achieve a safe and healthy environment for all employees of the SC, where the EM favors the creation of increasingly efficient processes and work environments which are adequate, and/or adapted to human capacities and limitations. Therefore, ergonomics can contribute to SS in organizations since both concur in the search to improve the quality of life of people at work by contributing socially to a highly competitive global market.
SS in organizations is a construct that demands preventive occupational health and safety, human-centered work design, empowerment, individual and collective learning, employee participation, and work-life balance [5,6].
On the other hand, EM is defined as a set of procedures and actions aimed at identifying ergonomic risk factors, planning and implementing an ergonomics program, establishing the control of risks and hazards through good practices, and setting goals to reduce or eliminate them in man-machine systems and work environments [7]. Ergonomics can be a means for SS in SC. From the SC perspective, SS has been adopted under corporate strategies such as the socially responsible company brand name [8,9].
Also, the human factors and ergonomics field (HF/E) has debated whether and how ergonomics or human factors can play a role and contribute to the SS of SC, given that both disciplines are concerned with improving human welfare, equity, and life quality at work and the everyday environment. Furthermore, considering that human characteristics, behavior, performance, and human interactions with technology are vital elements of SC, there seems to be a natural synergy between both disciplines, aiming to understand and optimize the outcomes of human-system interactions to develop sustainable use of human resources, so ergonomics and these aspects of sustainable development can be expected to be good partners [10]. Thus, there is evidence in the literature of its contribution to SC, where ergonomics is becoming increasingly important, as it is considered a crucial parameter for achieving sustainability [11].
Nonetheless, part of the problem of this research is that members of an SC are entitled to implement ergonomics and face several obstacles [12], such as:
  • The SC faces frequent changes in suppliers and companies.
  • The frequent changes in the products and systems of the chain also lead to organizational changes.
  • Subsidiaries of multinational corporations are also subject to changes in management, organization, and production philosophies.
In addition, the literature recognizes two further difficulties. The first is associated with the lack of a social approach to SC. In contrast, the second relates to the lack of reliable and effective indicators and metrics for evaluating SC ergonomic management.
In this regard, for Korkulu and Bóna [13], the social approach has received insufficient attention in both SC management and sustainability issues addressed by researchers. Therefore, companies and academics have cooperated to consider SC as a whole and toward sustainability [14,15]. Also, there are attempts in the literature to establish a primarily accepted theoretical-practical framework for assessing SS in SC. However, this goal has not yet been fully achieved, and there is a high degree of misalignment of information and concepts [16]. Additionally, Seuring [11] stated that social issues are poorly addressed in the design of sustainable supply chain (SSC) practices, considering that research on sustainable supply chain management (SSCM) practices is scarce [17]. These findings are evidence of the problem’s relevance in understanding the impact of HF/E on society and the quality of life of human resources, as well as the economic benefits for companies that have successfully implemented ergonomics and achieved their SS objectives.
On the other hand, regarding the second difficulty, the lack of reliable and effective ergonomics indicators and metrics in evaluating SCs helps define the relevance of this research. As an example, Cantor [18] and Perttula [19] have pointed out the need for comprehensive Ergonomics studies in SCs for an evaluation approach of all the links using a holistic view and considering that the definition of criteria for SS is not yet firmly established [12]. Additionally, due to the complexity of this problem, a broader view of health and quality of life in SCs is needed [20].
In addition, there are a variety of metrics related to ergonomics in SC. Organizations use these metrics to evaluate performance; however, their purpose should go beyond their measurement and be a guide to establish actions or strategies for improvement. These metrics can make organizations globally competitive by complying with Ergonomics requirements. Some of the organizations that led the evaluation of these requirements are OHSAS (Occupational Health and Safety Assessment Series) 18001 of 2007, ISO (International Organization for Standardization) 45000, and ILO-OSH (Occupational Safety and Health Management Systems) 2001.
Until now, SCs have not been the object of study or evaluation from an ergonomics perspective. Transferring metrics measurement to the SC partners would also be relevant. So far, supplier assessments have been carried out, further broadening the scope of SC, but there is a lack of an overall SC assessment index within an ergonomics approach.
Due to their specificity, the actual indices are limited for SC evaluation because they are associated with specific variables, such as the number of accidents, risk factors, and compliance with current regulations, which are relevant but are unable to assess the ergonomics management among the SC companies’ members and the SC itself. Consequently, the evaluation scope is restricted to a single link within the supply chain, and a comprehensive measurement approach for the entire supply chain has not yet been proposed.
This gap presents a research opportunity to thoroughly evaluate supply chains and their member companies as they work toward socially sustainable objectives through ergonomics management. The existing literature acknowledges the absence of an ergonomics management evaluation model (EMEM) for supply chains that could aid in achieving sustainability goals and facilitate a detailed evaluation of their interconnected links.
Therefore, this research aims to propose an EMEM designed for supply chains, offering a holistic evaluation approach along with an ergonomics management index for a single SC link and the entire SC. A global measurement approach throughout the SC has not been proposed yet.
Accordingly, this research aims to propose an EMEM that applies to SCs by proposing a complete evaluation approach and an ergonomics management index. This objective formulates the following research question and hypothesis.
Are the EMEM and indices valid for assessing the supply chain through the axiomatic design methodology?
H1. 
The proposed EMEM and EMIs are statistically valid and can be used to assess the supply chain through the axiomatic design approach.
The structure of the paper is as follows. Section 1 presents the background of the research and the problem statement. Section 2 provides the theoretical background on the relevant concepts and main theories used to develop the EMEM for SC. Section 3 details the materials, methods, and procedures for constructing and implementing the EMEM for SC. Section 4 presents the results of the EMEM development through the axiomatic design, through a case study of the application of the EMEM and practical recommendations. Section 5 discusses the features of the current ergonomics management evaluation models that can be contrasted with the proposed model to highlight the main differences and advantages. Finally, Section 6 summarizes the research findings and outlines directions for future research.

2. Theoretical Background

This section presents the relevant concepts, such as supply chain, sustainability, social sustainability, and ergonomics management, and the main theories used for the development of EMEM for SC, focusing on the axiomatic design (AD) methodology, the continuous improvement model, and the ISO 45001:2018 occupational health and safety management systems [21].

2.1. Supply Chain

Companies no longer engage in individual competition inside the market but rather compete as integral parts of a supply chain. An efficient supply chain is essential for a company to fulfill its consumers’ requirements and to keep up with fast-paced product cycles promptly [22]. A supply chain refers to an interconnected system of organizations, resources, processes, and technology that produces and delivers a finished product to the end user. It encompasses all stages, from the supply of raw materials to the distribution of the final product. The supply chain involves various entities such as suppliers, manufacturers, distributors, retailers, end users, and supporting entities like warehouses, logistic service providers, and government agencies [23]. It is also a series of integrated enterprises that must share information and coordinate physical execution to ensure an integrated and smooth flow of goods, services, information, and cash [4].

2.2. Sustainability in the Supply Chain

There is a trend to gradually incorporate and manage sustainability strategy in SC, which has given rise to the SSC, which is nothing more than creating a unified SC through the intentional integration of economic, environmental, and social considerations [24]. In this way, SSC is a business system designed to efficiently and effectively manage material, information, and capital flows related to the procurement, production, and distribution of products or services to promote the organization’s profitability, competitiveness, and resilience in the short and long term.
The concept of sustainability is still progressing, being complex and contested, and is therefore under continuous discussion and research [25]. This concept was first defined in 1987 through the definition of sustainable development: “meets the needs of the present without compromising the ability of future generations to meet their own needs” [26]. This concept emphasizes balancing economic growth, environmental stewardship, and social well-being [27]. These elements are known as the main sustainability pillars. Each pillar is defined as below:
Economic sustainability could be described as a set of actions and strategies to ensure economic prosperity without negatively impacting a community’s social, environmental, and cultural aspects [28]. On the other hand, economics is the chief pillar that decides a business’s financial success, including financial costs and benefits. However, the distinction comes here in terms of sustainability. The face-to-face regular business connotation is that economic sustainability is not about profit at any cost. Financial sustainability is centered around and connected to the other two pillars. The primary concern related to economic sustainability is that implementing or practicing environmental and social sustainability should not affect the economy, meaning the product should not be too expensive to practice the other two pillars of sustainability. This includes long term planning, cost savings, productivity, living costs, development smart growth, etc. [29].
Environmental sustainability is a broad term that includes “the condition of resilience, balance, and connection to allow society (humans) to meet its requirements without surpassing the capacity of its supporting ecosystem to continue the regeneration of the services without harming the biological diversity” [30]. This concept includes the protection of the environment and preventing nature from being used as an indefinite source of resources [31]. Another approach concerns supporting eco-friendly production and efficient resource use to avoid adverse impacts on future generations. It involves integrating strategies and practices in companies that address environmental issues at various operational levels [32].
Social sustainability: according to Pope et al. [33], this concept’s scope depends on the characteristics of the embedded dimensions that are the basis of sustainability assessment. Turker and Ozdemir [34] identified in the literature that some studies are aligned with social responsibility by focusing on labor equity, healthcare, safety/injury, and philanthropy, its criteria as internal human resources, external population, stakeholder engagement, and macro-social performance or satisfaction of basic needs and quality of life, equal opportunities, and social coherence by improving social capital, human capital, and well-being of individuals and communities [35]. On the other hand, some international organizations, such as the United Nations, the International Organization for Standardization (ISO), and the World Bank, have also tried to identify their core issues, such as equity, health, education, housing, safety, population, labor practices and decent work, human rights, society and product responsibility or organizational governance, environment, fair operating practices, consumer issues, and community participation and development. It is concluded that SS can be defined as the extent to which an organization addresses equity principles by developing innovative approaches to meet the demands of social stakeholders by considering dynamic interactions across components [34].

2.3. Social Sustainability in the Supply Chain

Balaman [36] defines SS as specifying and managing the positive and negative impacts of systems, processes, organizations, and activities on people and social life. The aspects included in this concept consist of categories and are separated into external and internal social aspects [37]. External aspects relate to the operational initiative’s impacts on three levels of society: the local community, the regional level, and the national level. Internal elements focus on the company’s social responsibility towards its workforce and include but are not limited to all aspects of employment, such as job stability, working practices, health and safety, and skills development.

2.4. Continuous Improvement Model and Health and Safety Standards

The PDCA (Plan-Do-Check-Act) cycle is a systematic process designed to continuously obtain valuable learning and knowledge to improve a product, process, or service. It has been used recently; more and more organizations have been implementing management systems in different fields: quality management systems (QMS), environmental management systems (EMS), health and safety management systems (HSMS), and information security management systems (ISMS), regulated by ISO, as well as in total quality management (TQM) models. This management model is based on four phases aimed at developing continual improvement:
  • Plan: Establish the system’s objectives and processes, the resources needed to deliver results according to the customer’s requirements and the organization’s policies, and identify and address risks and opportunities.
  • Do: Implement what was planned.
  • Check: Monitor and (where applicable) measure processes and the resulting products and services against policies, objectives, requirements, and planned activities, and report the results.
  • Act: Takes actions to improve performance, as necessary.
This model has been utilized for the OHSAS 18001 and ISO 45001, which are the most widely used standards in terms of health and safety [38]. Typical components of any HSMS include organizing, planning, implementing, assessing, and taking corrective action when necessary to guarantee the health and safety of workers and employees [39]. It is extensively used in businesses worldwide [40]. The PDCA cycle for management systems can categorize the ISO standard requirements, as seen in Figure 1.
Additional relevant elements of the cycle include the systemic approach, which offers an integrated viewpoint and is implemented in companies by identifying the internal and external factors that can affect the outcomes and their synergy, and a methodical procedure for achieving the desired outcomes. Additionally, some benefits have been identified, including complete control over compliance requirements, a notable decline in injury indices (in the context of safety and health management), a decrease in related expenses, and an enhancement of the company’s reputation [41]. Also, operational performance has positive and noteworthy impacts [42]. Furthermore, based on the ten primary clauses of the ISO high-level structure, the standards’ framework is among their strongest features. Thanks to this feature, there is an excellent chance that all requirements can be merged into a single integrated management system [43].
Rodríguez-Gámez et al. [7] developed a literature review that provides an overview of management systems, existing models, and standards that can be used to conform to the ergonomics management model. However, ISO 45001 was chosen as the basis for the ergonomics management system; it is also based on the PDCA cycle, and Leadership and Worker participation (L&WP) are integrated into the model for its relevance. In addition, due to its nature, ergonomics is highly related to health and safety management systems since both focus on risk analysis from their respective field of action. Not forgetting that within its regulatory framework, it establishes an opportunity for inclusion and thus improves the working conditions and health of the worker. The domains to be considered in the ergonomics management system are shown in Table 1; these nineteen domains are classified for each construct and under the PDCA cycle.
Considering these findings, the decision was made to adopt ISO 45001 as a structural element and the PDCA cycle, which are relevant and critical to developing the SC’s EMEM.

2.5. ISO 45001—Ergonomics

According to ISO 45001:2018, an HSMS provides a framework for managing health and safety risks and opportunities. However, Haas and Yorio [44] admitted that the lack of such a system is one of the root causes of many industrial disasters. One of the opportunities is related to system improvement; within these are identified ergonomic assessments and other worker injury prevention assessments [21]. On the other hand, the literature supports the relationship between ISO 45001 and ergonomics; for example, Rostykus et al. [45] attest that ISO 45001 is a model that works well as an ergonomics management system, as it identifies and communicates hazards and addresses their analysis and mitigation. These authors state that aligning how the organization addresses ergonomics through a management system allows Occupational Safety and Health professionals to communicate and engage business leaders in a way they are already familiar with.

2.6. Ergonomics Management

Fernandes et al. [46] consider that EM, which has a macro approach and seeks to understand the human-organization interaction and its complexity, must act proactively and not only based on past historical occupational injuries. It is essential to know the ergonomic risks to encourage decision-making in an assertive way when dealing with them or even to anticipate future events that bring potential risks. Knowledge of the risk enables its identification, information, and priority ranking to act on the vulnerabilities and anticipate dangerous situations.
In this research, EM is interpreted under the vision of an ergonomics management system (ErMS), whose definition is established by Rodríguez-Gámez et al. [47], who define it as the set of procedures and actions that create a plan, identify risk factors, execute a program, establish control through good practices, and set objectives to reduce or eliminate ergonomic risks and hazards from the man-machine system and environment. The definition involves the consideration of people’s physical and mental capabilities and limitations through a dynamic of change, staff participation, and continuous improvement to optimize human well-being and the overall performance of a system. This concept allows us to evaluate the practices and requirements in SC through the constructs and domains established by Rodríguez-Gámez et al. [7] to contribute to the SS of SC through an evaluation system that provides an index of EM, which gives an overview of the level of management practices adopted in each link of SC as well as globally in the entire SC.

2.7. Axiomatic Design (AD)

Axiomatic design is a tool for structuring and optimizing the design process, ensuring efficient and effective solutions. Engineer Nam P. Suh developed this methodology in 1977 as a systematic approach to designing products, processes, or systems. To systematize this design process, four domains were created to represent the four different design activities that provide the fundamentals of AD, as shown in Figure 2.
In the first customer domain, customers’ attributes and needs are characterized as customer attributes (CAs). These attributes and needs are then translated into a set of functional requirements (FRs) in the second domain, the functional domain. Moving to the third domain, the physical domain, design parameters (DPs) are selected to meet the identified functional requirements. Finally, in the process domain, we select a set of process variables (PVs) to create the design parameters from the third domain. The functional requirements and design parameters are interconnected through an iterative process alternating between the functional and physical domains. Since many design parameters can fulfill a given functional requirement, choosing the most effective one is crucial to achieving a robust design [48]. This design process emphasizes the reciprocal relationship between the requirements (the “what”) and the methods to meet those requirements (the “how”). Design parameters provide a scientific foundation for engineering system design and have been applied for various design purposes [49], such as:
  • Provide a systematic way to design complex systems and products.
  • Exalt the creativity of the designer.
  • Reduce haphazard search processes in design solutions.
  • Minimize the trial-and-error iterative process.
  • Determine the best design among the proposed options.
  • Create a system architecture that fully captures the construction of its functions and provides adequate and timely documentation.
  • Find efficient design solutions using the computer appropriately.
AD theory is founded on axioms, theorems, and corollaries. Design axioms are the fundamental principles that guide and evaluate design decisions, ensuring that designs are efficient, robust, and aligned with user objectives. This theory states that good designs comply with two axioms [50].
  • The independence axiom states that the independence of functional requirements (FRs) must always be maintained. FRs are the minimum independent requirements that characterize the design objectives [51]. This axiom is verified; it is necessary to construct the design matrix where FRs are related to DPs. In it, FRs are represented as rows, while DPs are represented as columns. Generally, this can be represented as matrix A where:
{FR} = [A] {DP}
The relationship between an FR and a DP is represented as a non-zero element, as shown in the following equation. In contrast, an element in such a design matrix equal to zero corresponds to a DP unrelated to an FR [50].
F R 1 F R 2 F R 3 = X 0 0 X X 0 X 0 X D P 1 D P 2 D P 3
The matrix in the above Equation represents a design consisting of three FRs and three DPs. It can assume three basic configurations concerning the independence of the FRs: uncoupled (see Equation (3)), decoupled (see Equation (4)), and coupled (see Equation (5)). The uncoupled design matrix represents a design with independent FRs, which means each FR is satisfied with a single DP; this type of design satisfies the independence axiom and can be considered a good design. The decoupled design matrix represents decoupled designs, which are not ideal but are acceptable solutions, as they tend to have control and independence. The coupled design matrix is obtained when the FRs are satisfied with a single DP, representing an unacceptable design.
F R 1 F R 2 F R 3 = X 0 0 0 X 0 0 0 X D P 1 D P 2 D P 3
F R 1 F R 2 F R 3 = X 0 0 X X 0 X X X D P 1 D P 2 D P 3
F R 1 F R 2 F R 3 = X X X X X X X X X D P 1 D P 2 D P 3
2.
The information axiom states that among designs that satisfy the independence axiom, the design with the lowest information content is the best [50]. The information is defined in terms of the information content (Ii), which relates in its simplest form to the probability of satisfying the given FRs. The Ii determines the best design with the highest probability of success. The information content for a given FRi is defined as follows:
I i = log 2 1 p i
where pi is the probability of achieving the functional requirement FRi, and log is the base two logarithms (with the unit of bits). In any design situation, the likelihood of success is determined by what the designer wishes to achieve in terms of tolerance, called the design range (DR), and what the system can deliver, called the system range (SR). Figure 3 shows the overlap between the designer-specified “DR” and the system capability range “SR,” the region where the acceptable solution exists [52].
Therefore, the common range can be written as the uniform probability distribution function (pi).
p i = c o m m o n   r a n g e s y s t e m   r a n g e
Therefore, the information content is equal to:
I i = log 2 c o m m o n   r a n g e s y s t e m   r a n g e
Information content represents a class of entropy that measures the uncertainty associated with design [53]. A lower information content means that the design is more straightforward, more predictable, and less uncertain, making it easier to implement, control, and maintain. Thus, it is more likely to satisfy established FR, which means the design will be successful since there is less uncertainty about its performance. On the contrary, the greater the information content, the greater the uncertainty and complexity of the design. It can occur if functional requirements are not fully aligned or interdependencies between design components exist.

3. Materials and Methods

The continuous improvement instrument for ergonomics management system evaluation (CIEMSE), proposed by Rodríguez-Gámez et al. [47], was used in the EMEM in two evaluation schemes. First, design ranges (DRs) were defined by 34 experts from Latin America. Then, system ranges (SRs) were assessed by self-assessments of EM practices to obtain the information content axiom in one Mexican salt industry case study. In addition, the Leadership and worker participation construct was considered in both instruments. Table 1 shows the domains considered in the two assessment schemes. 
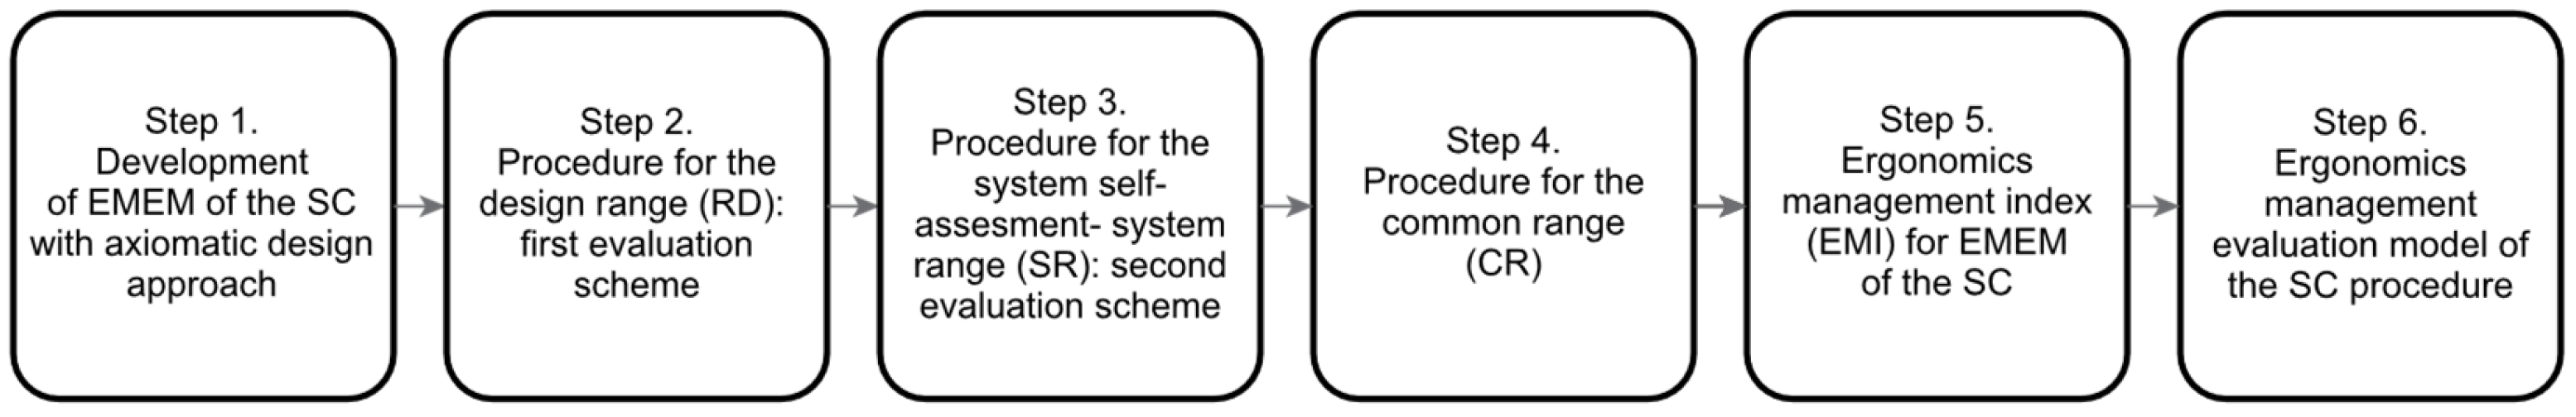
Figure 4 shows the development of the EMEM of the SC:

3.1. Step 1. Development of the EMEM of the SC Using an Axiomatic Design Approach

The axiomatic design (AD) methodology proposed by PhD. Nam P. Suh [54], was used to develop the EMEM of the SC. First, the four design domains—the CAs, FRs, PDs, and PVs—and their interrelation through mapping are determined. Subsequently, the EMI is obtained using the information axiom. The following sections explain the development procedure.

3.1.1. Determination of Customer Attributes (CAs)

In the customer domain, the attributes or needs of the users (customers) of the EMEM for SC were determined. These attributes were identified considering the need for an evaluation model that contributes to the fulfillment of the SS through the analysis of the systematic literature review conducted by Rodríguez-Gámez et al. [7].

3.1.2. Define FRs of the System

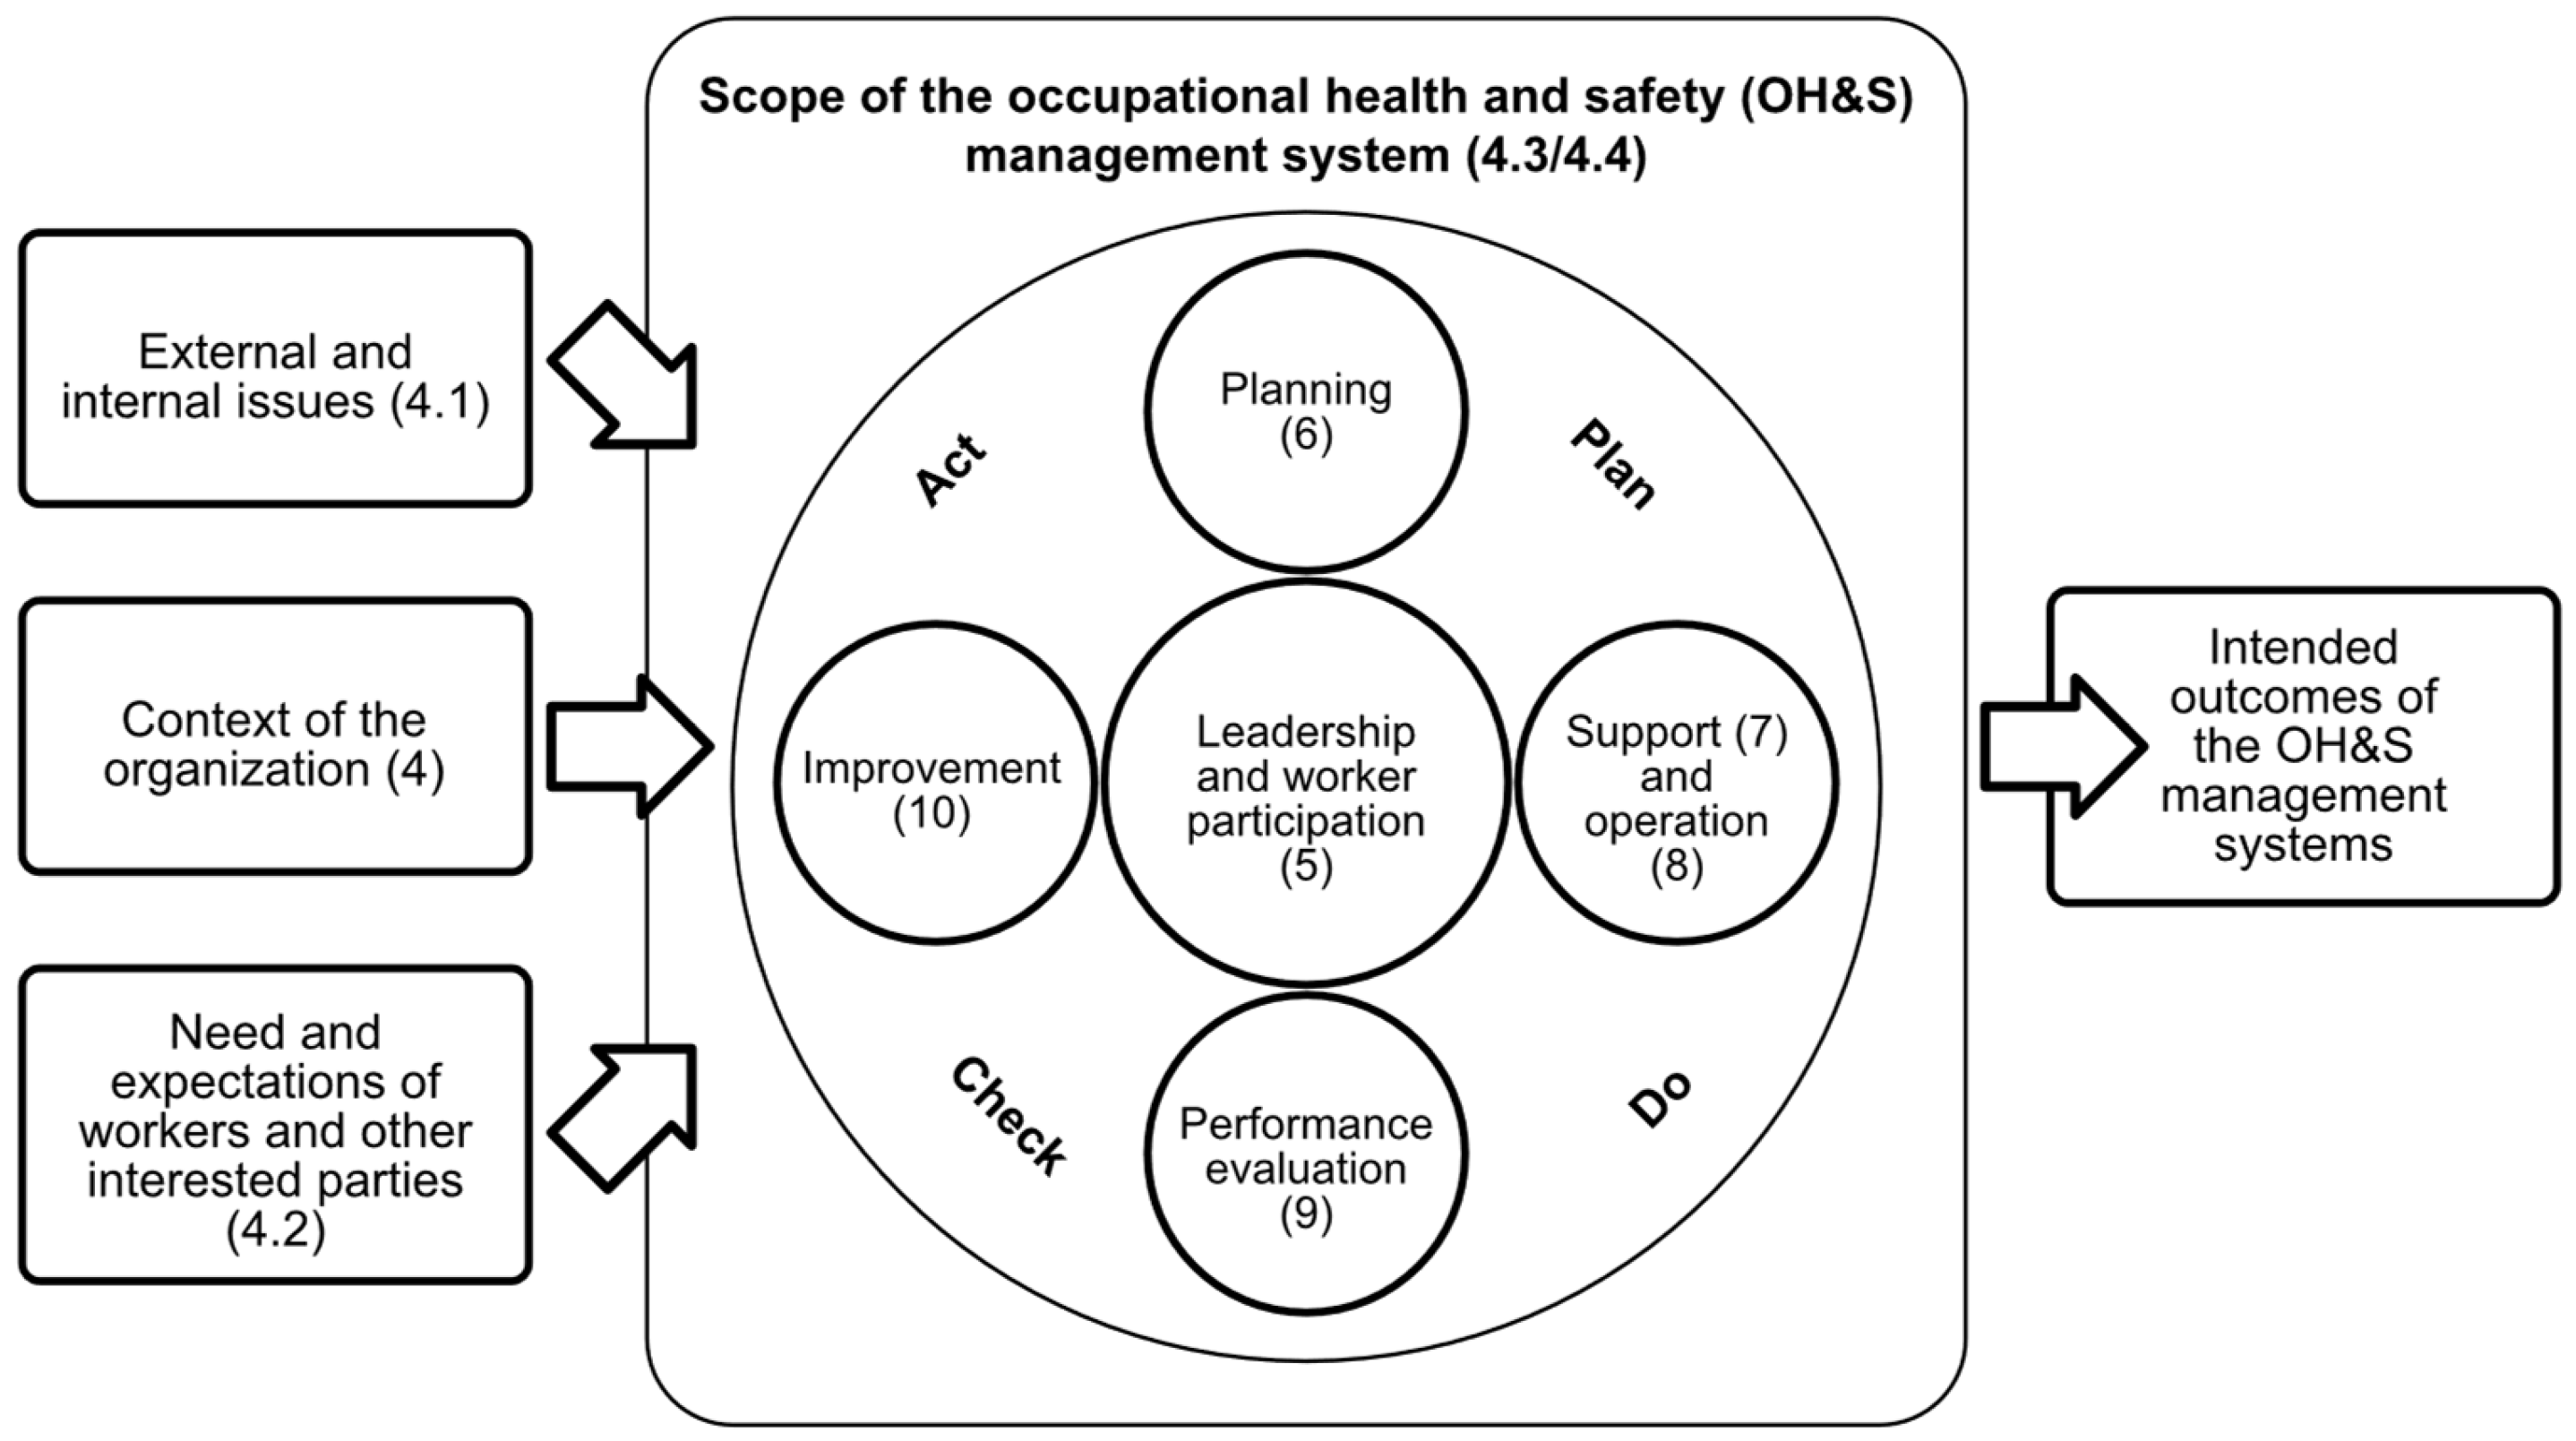
The functional requirements (FRs) of the EMEM for the SC were determined by satisfying the CAs or client needs established in the previous stage. The practices and requirements of the ISO 45001:2018 Occupational Health and Safety Management Systems standard were used to manage hazards in the workplace and systematically identify, control, and verify the reduction of risk factors. The practices and requirements were adapted to the EM considerations through a detailed analysis and relevance process. Input and system constraints were also determined. The former were imposed as part of the design specifications of the evaluation model, and the system constraints were imposed by the system in which the evaluation model was to operate.

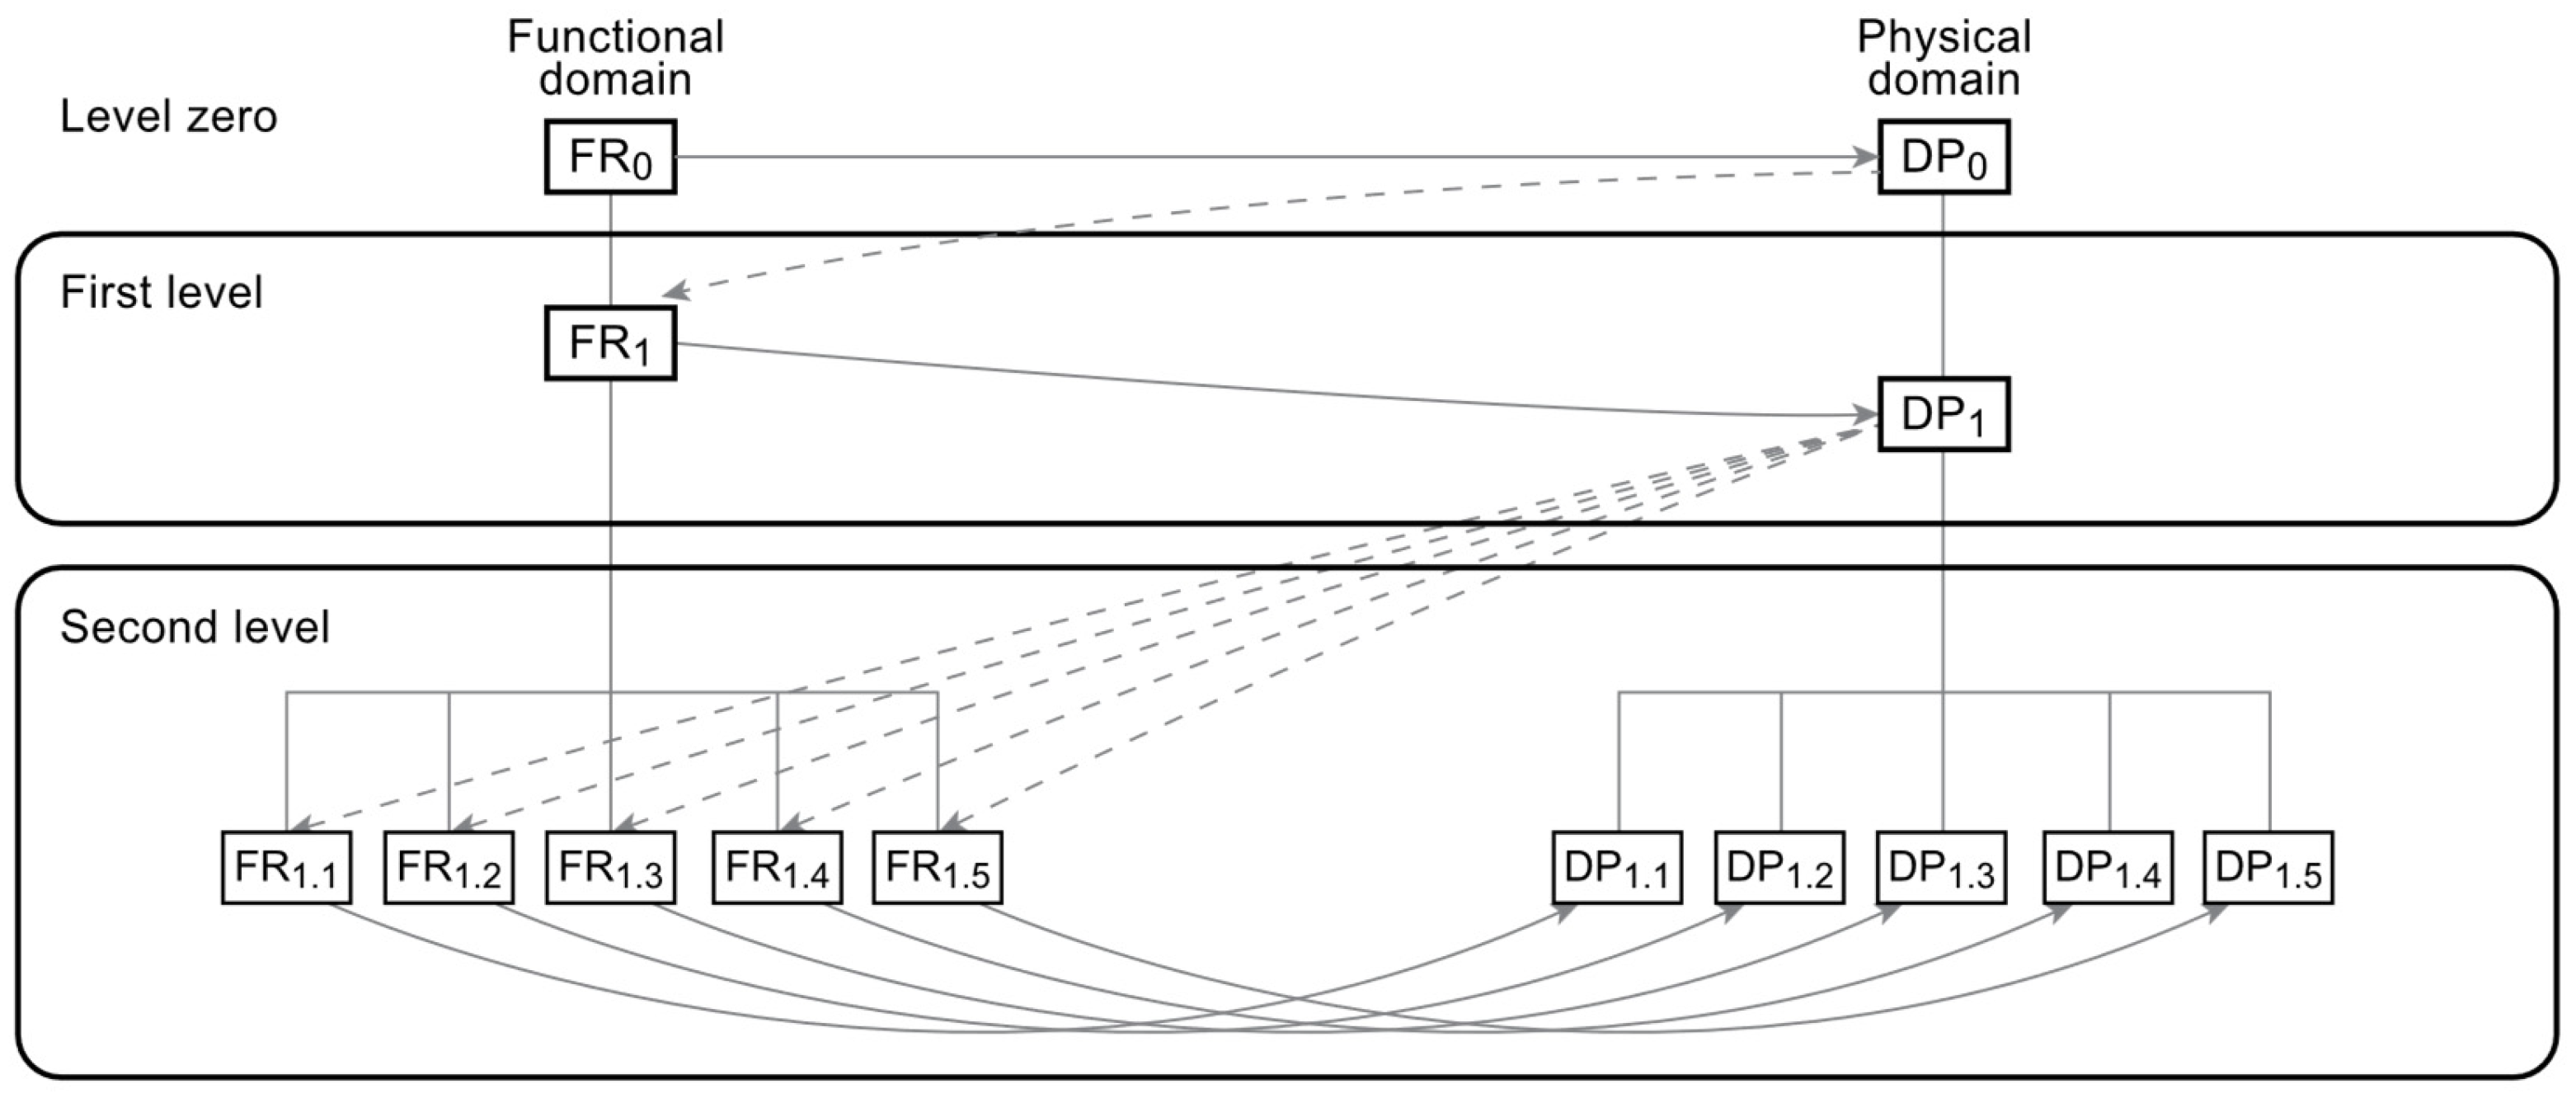
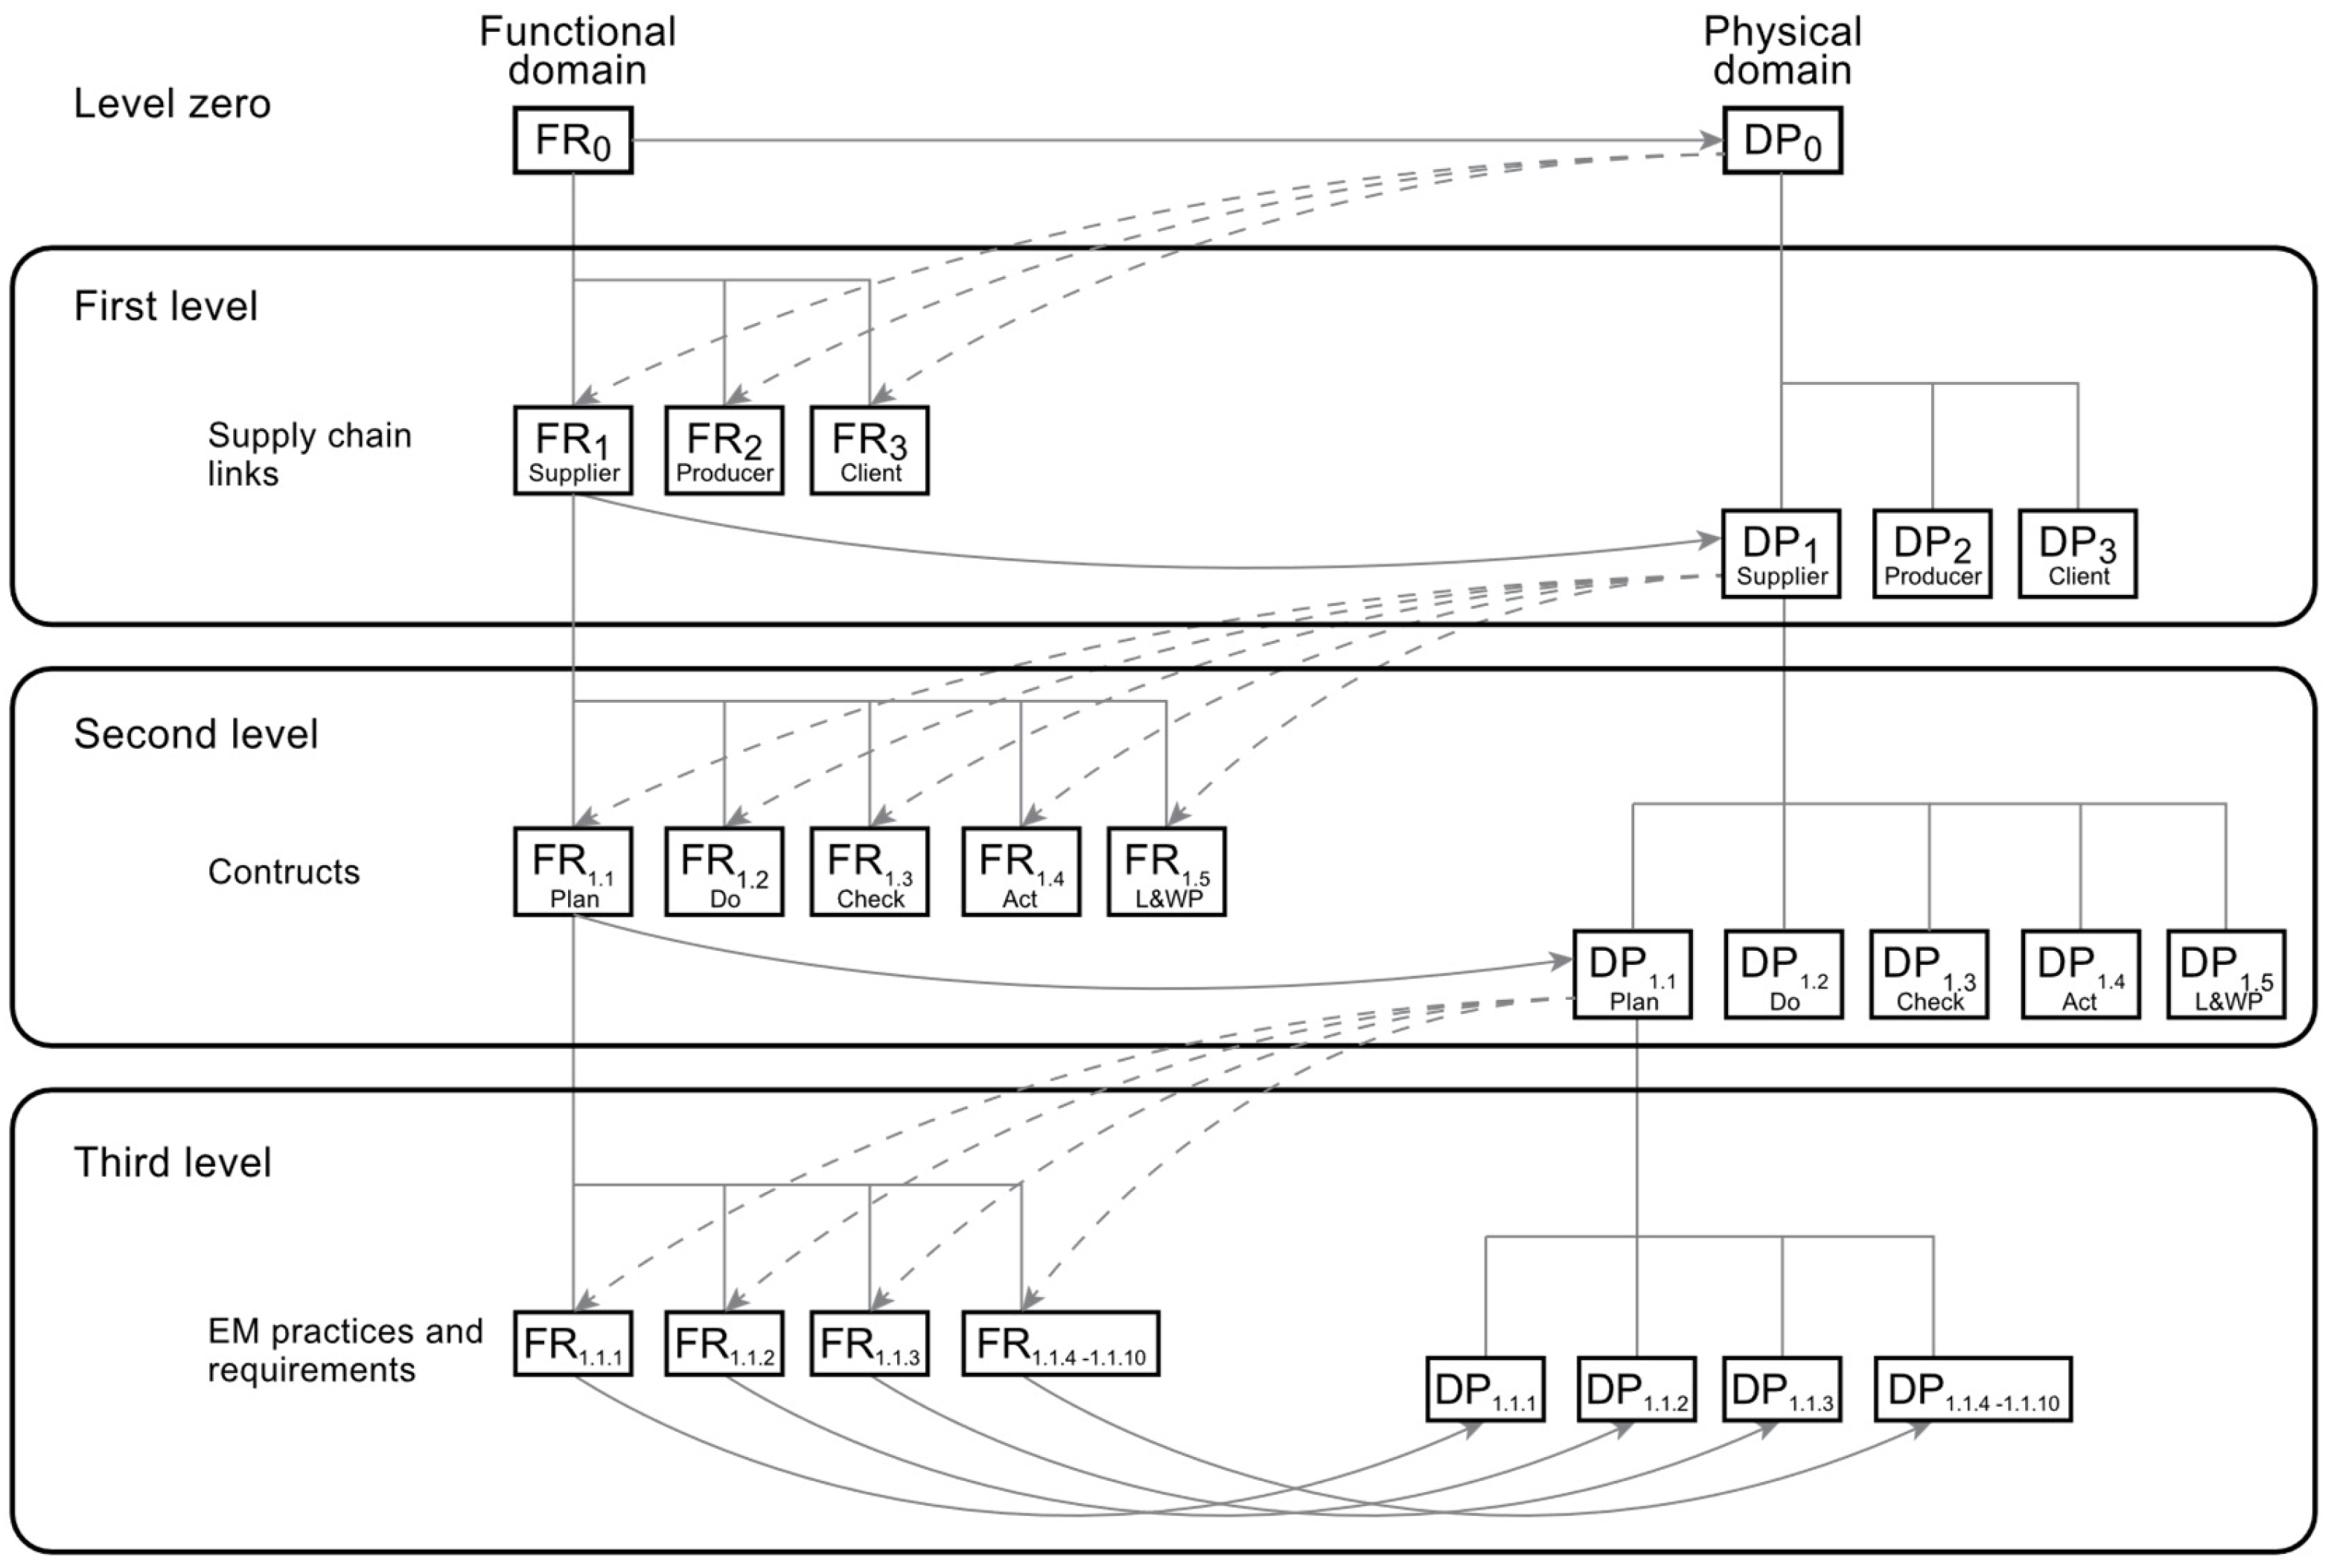
3.1.3. Mapping Between the Domains and Decomposition of {FRs}, {DPs}, and {PVs}: A Step in the Creating System

The next step is to translate the FRs from the functional domain to the physical domain, that is, to conceive a design and identify the design parameters (DPs). The mapping was done between what we want to achieve (FR) and how we want to achieve it (DP).
Maldonado-Macías et al. [49] suggested some considerations used to establish the DPs of the EMEM for SC:
  • Generate a list of what the design should do.
  • The wording of the DPs should start with a noun.
  • The PDs must satisfy the established FRs.
  • Select for each FR a DP.
  • Have physical tolerances.
To determine the process variables (PVs), we considered controlling the DPs set at each hierarchical level and ensuring compliance with the FRs set through the necessary processes or procedures. The decomposition of FRs, DPs, and PVs involved zigzagging between domains until the design of the EMEM for SC was completed. 
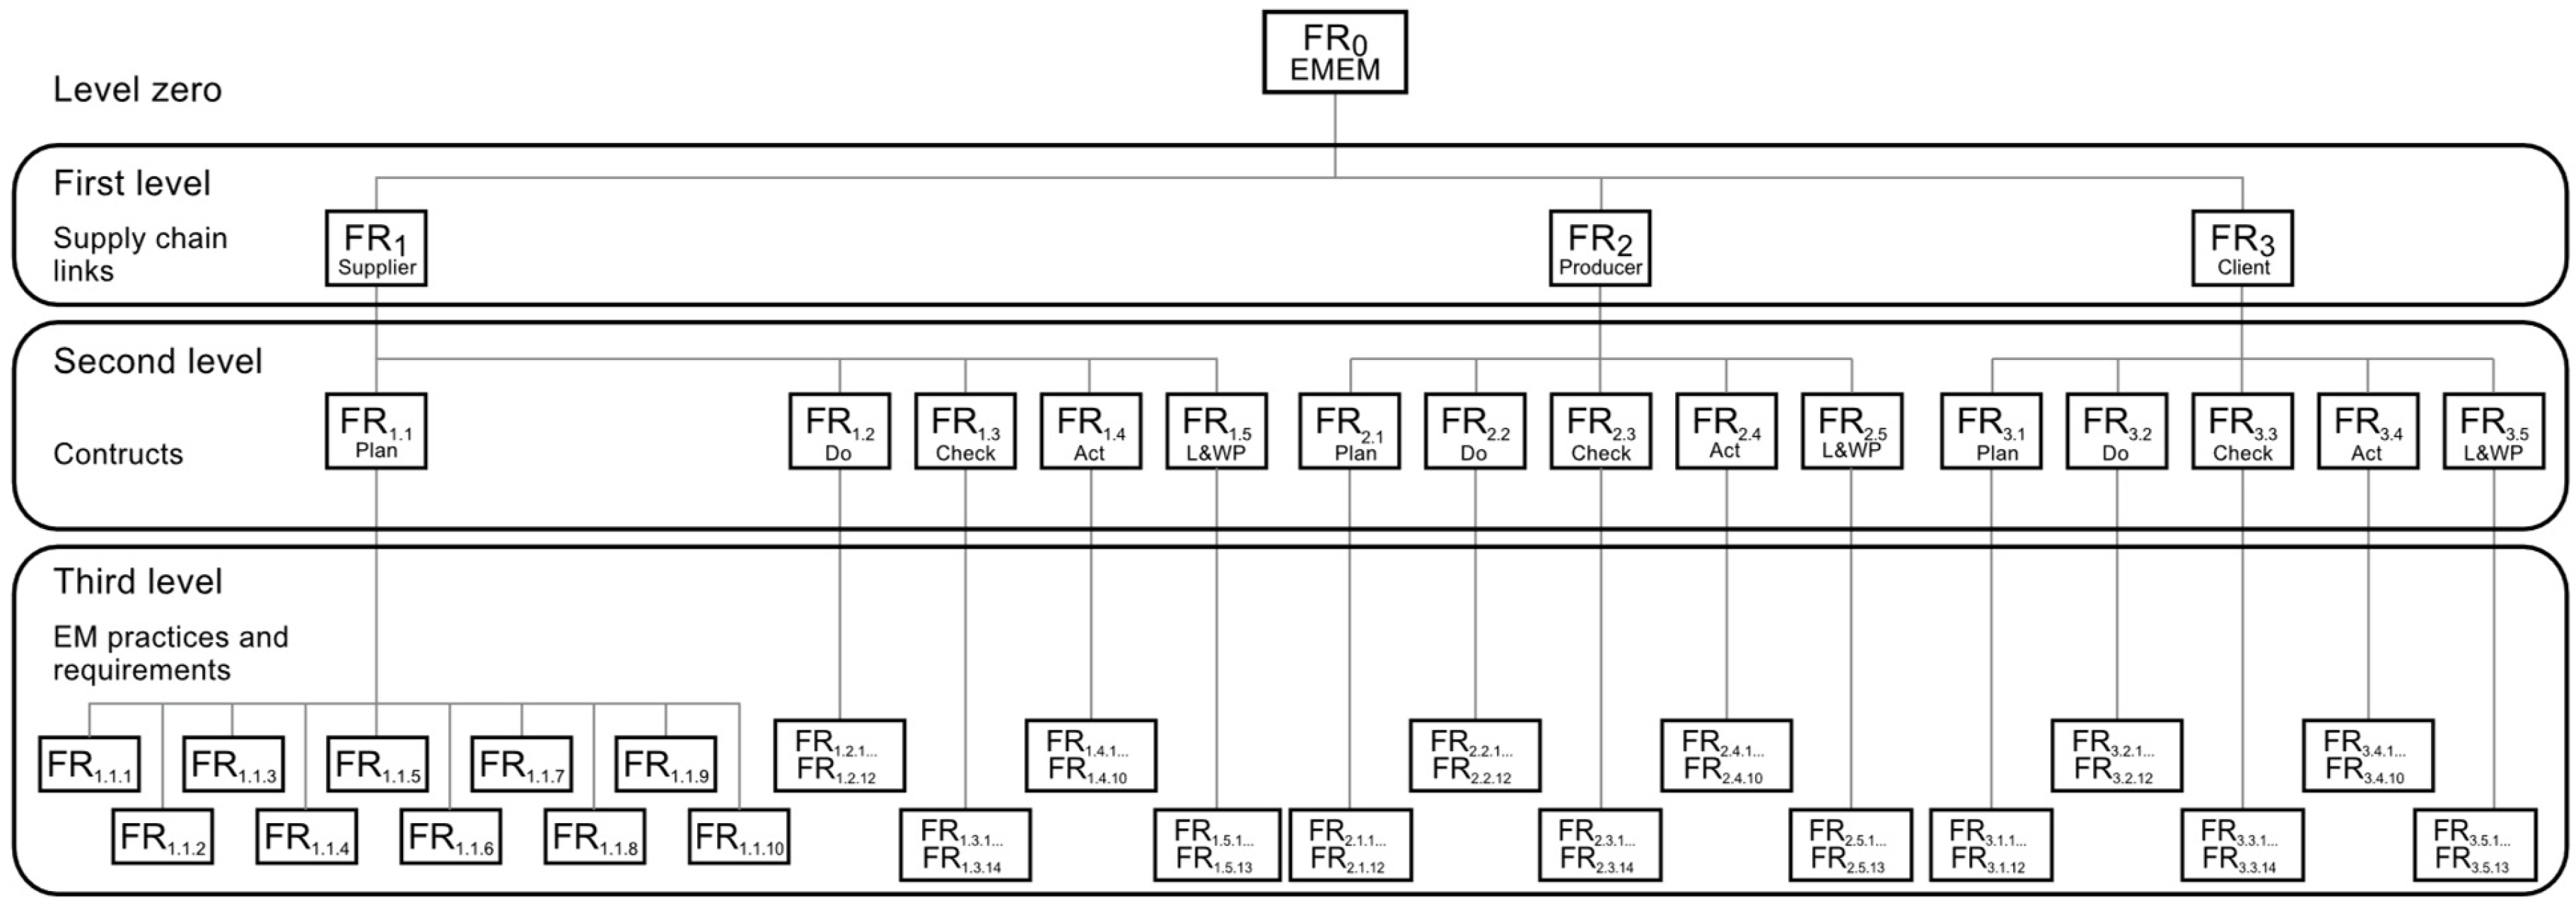
Figure 5 shows this process: The FRs are decomposed into a hierarchical structure, and the DPs are defined to satisfy the FRs at each hierarchy level.

3.1.4. The Independence Axiom

The design matrix [A] was developed to identify whether it is coupled or not to comply with the independence axiom, as it is preferable that each of the FRs must be satisfied independently by a DP in an uncoupled design matrix.

3.1.5. Ergonomics Management Index from Information Content Axiom

The information content axiom indicates the complexity and probability of the design’s success by satisfying the FRs set out in the design. For the design of the EMEM for SC, the ergonomics management index (EMI) was used to indicate the level of compliance with ergonomics management practices and requirements (EMPr&Rq). In this, the probability of compliance using the two evaluation schemes and the relationship between the results of the two schemes must be determined.
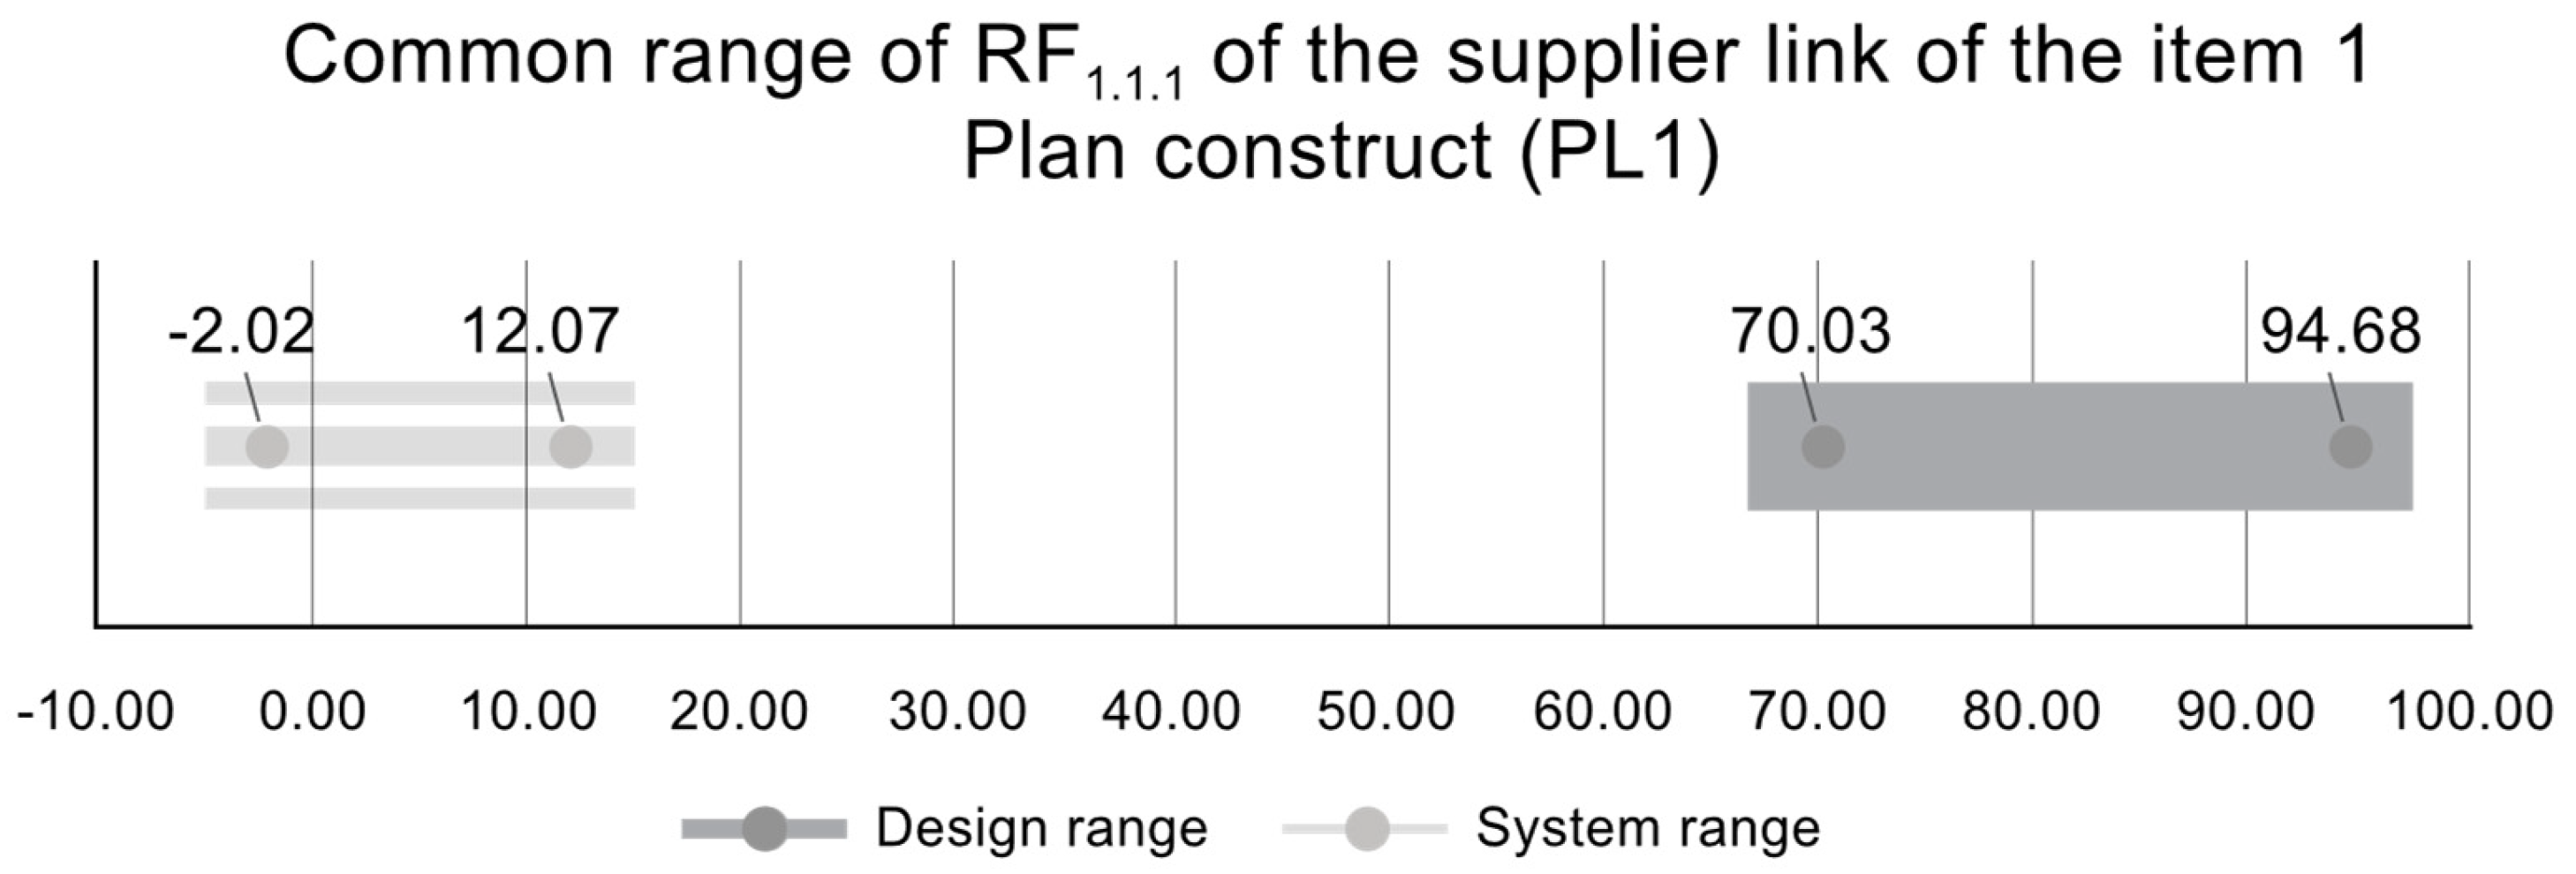
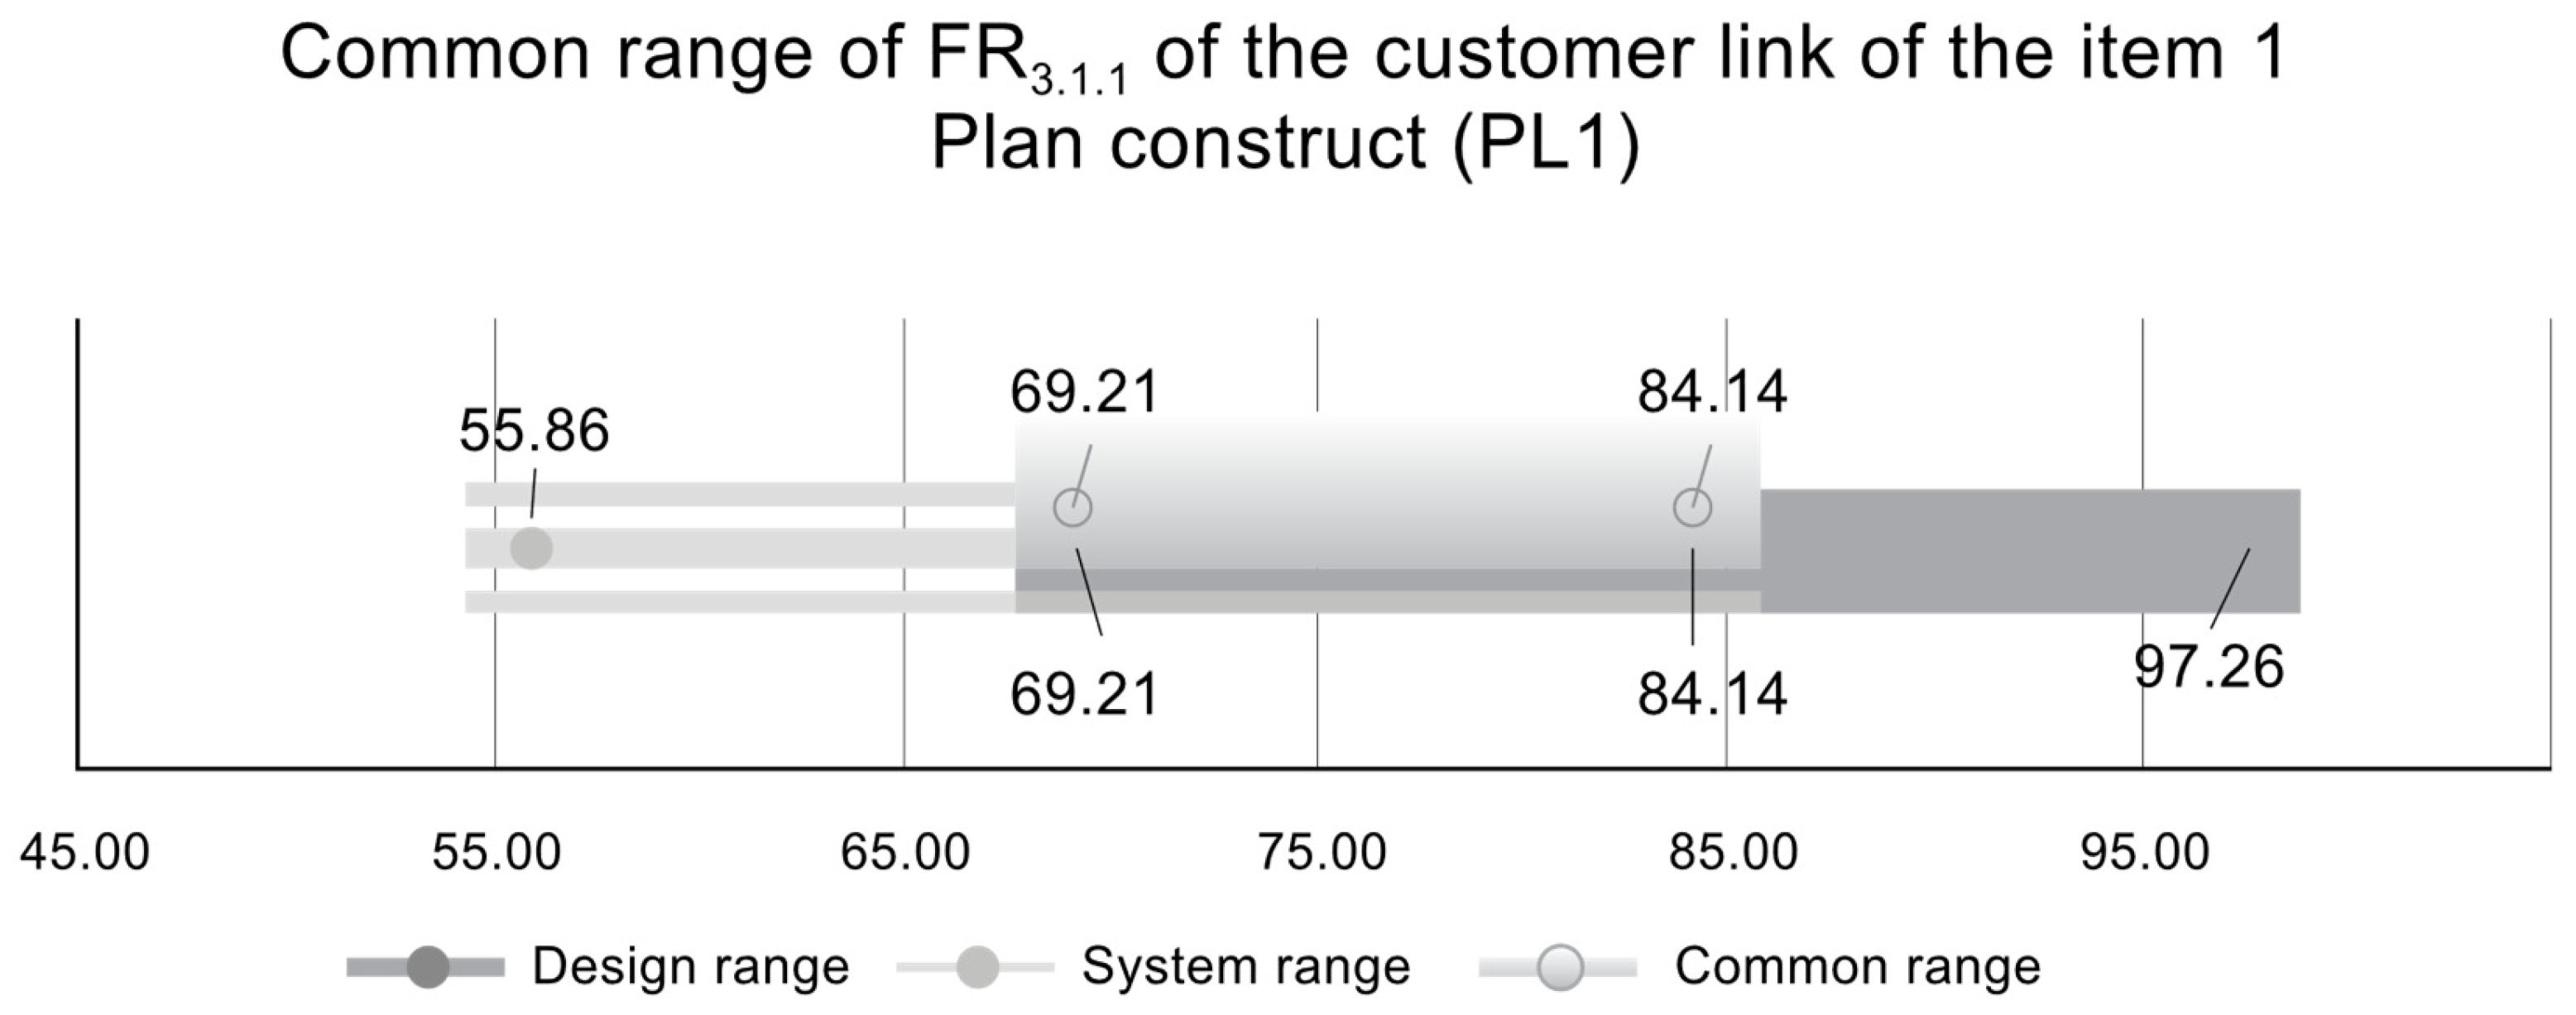
The first Scheme determines the design range (DR), where the minimum desirable percentage of compliance of the EMPr&Rq established by the experts is considered; the other Scheme determines the system range (SR) through the responses of the rate of compliance of EMPr&Rq by the organizations participating in the SC. The common range (CR) is established due to the ratio of the two design and system range distributions. The SR and CR are used to determine the EMI. The EMI equation shows the following:
E M I = log 2 S R C R
The lower value of EMI represents less uncertainty in satisfying the FRs; therefore, the assessed system may be more likely to meet the experts’ expectations for each EMPr&Rq. The procedures for determining DR, SR, and CR are described below.

3.2. Step 2. Procedure for the Design Range (DR): First Evaluation Scheme

The DR makes it possible to establish the tolerances or limits of acceptance or compliance of implementing the EMPr&Rq in the SC. For this purpose, the following procedure is shown:
  • The experts must answer the ergonomics management expert instrument (EMEI) and establish the minimum desirable percentage (xmdp) value for each FR (item).
  • These values are used to calculate the average of the minimum desirable percentage value of compliance with the EMPR&Rq.
x ¯ m d p = i = 1 n x m d p i n
where:
x ¯ m d p = Is the average of the minimum desirable percentage values of the compliance of the EMPr&Rq.
x m d p = Is the minimum desirable percentage value for each FR given by the experts
n = Number of experts who established the xmdp values for each FR.
3.
Determine the DR for each FR by calculating the standard deviation, the upper and lower limits. The equations for this purpose are shown below:
s = 1 n 1 i = 1 n x m d p x ¯ m d p 2
where:
s = It is the standard deviation of the minimum desired percentage values given by the expert sample for each FR.
X D R u p p e r = x ¯ m d p + s
XDRupper = It is the upper limit of the DR for each FR.
X D R l o w = x ¯ m d p s
XDRlow = It is the low limit of the DR for each FR.
D R = X D R u p p e r X D R l o w
DR = It is the design range for each FR.
The DR established for each FR by the experts is used to evaluate the performance of the different links that make up the SC since each link is an organizational system where employees participate and require better working conditions, as well as the implementation of good practices and ergonomics requirements.

3.3. Step 3. Procedure for the System Self-Assessment—System Range (SR): Second Evaluation Scheme

The SR allows the establishment of the real capacity of the evaluated system to satisfy the FRs of the EMPr&Rq implementation in each SC link. For this purpose, the following procedure is shown:
  • The respondents (employees of the system to be evaluated) must answer the ergonomics management self-assessment instrument (EMSI) and establish the value compliance percentage (xcp) with the EMPr&Rq for each established FR under the evaluation of the link in which the respondents participate. It should be noted that the participants’ responses should not be mixed if they belong to different SC links.
  • These values are used to calculate the average of the minimum desirable percentage of compliance value with the EMPR&Rq.
x ¯ c p = i = 1 n x c p i n
where:
x ¯ c p = is the average of the compliance percentages values with the EMPr&Rq for each FR and per assessed link given by the participants of the self-assessment.
x c p = is the compliance percentage with the EMPr&Rq for each FR, as given by the participants and per the evaluated link of the SC.
n = number of participants who self-assessed the level of compliance of each FR and per link of the SC assessed.
3.
To obtain the SR for each FR in each link of the SC by calculating the standard deviation, along with the upper and lower limits. The equations for this purpose are shown below:
s = 1 n 1 i = 1 n x c p x ¯ c p 2
where:
s = It is the standard deviation of the compliance percentage values for each FR and per link of the SC given by the self-assessment sample.
X S R u p p e r = x ¯ c p + s
XSRupper = It is the upper limit of the SR for each FR and per link of the SC.
X S R l o w = x ¯ c p s
XSRlow = It is the low limit of the SR for each FR and per link of the SC.
S R = X S R u p p e r X S R l o w
SR = It is the system range for each FR and per link of the SC.

3.4. Step 4. Procedure for the Common Range (CR)

The DR and SR for each FR must be calculated to determine the CR. The procedure is shown below:
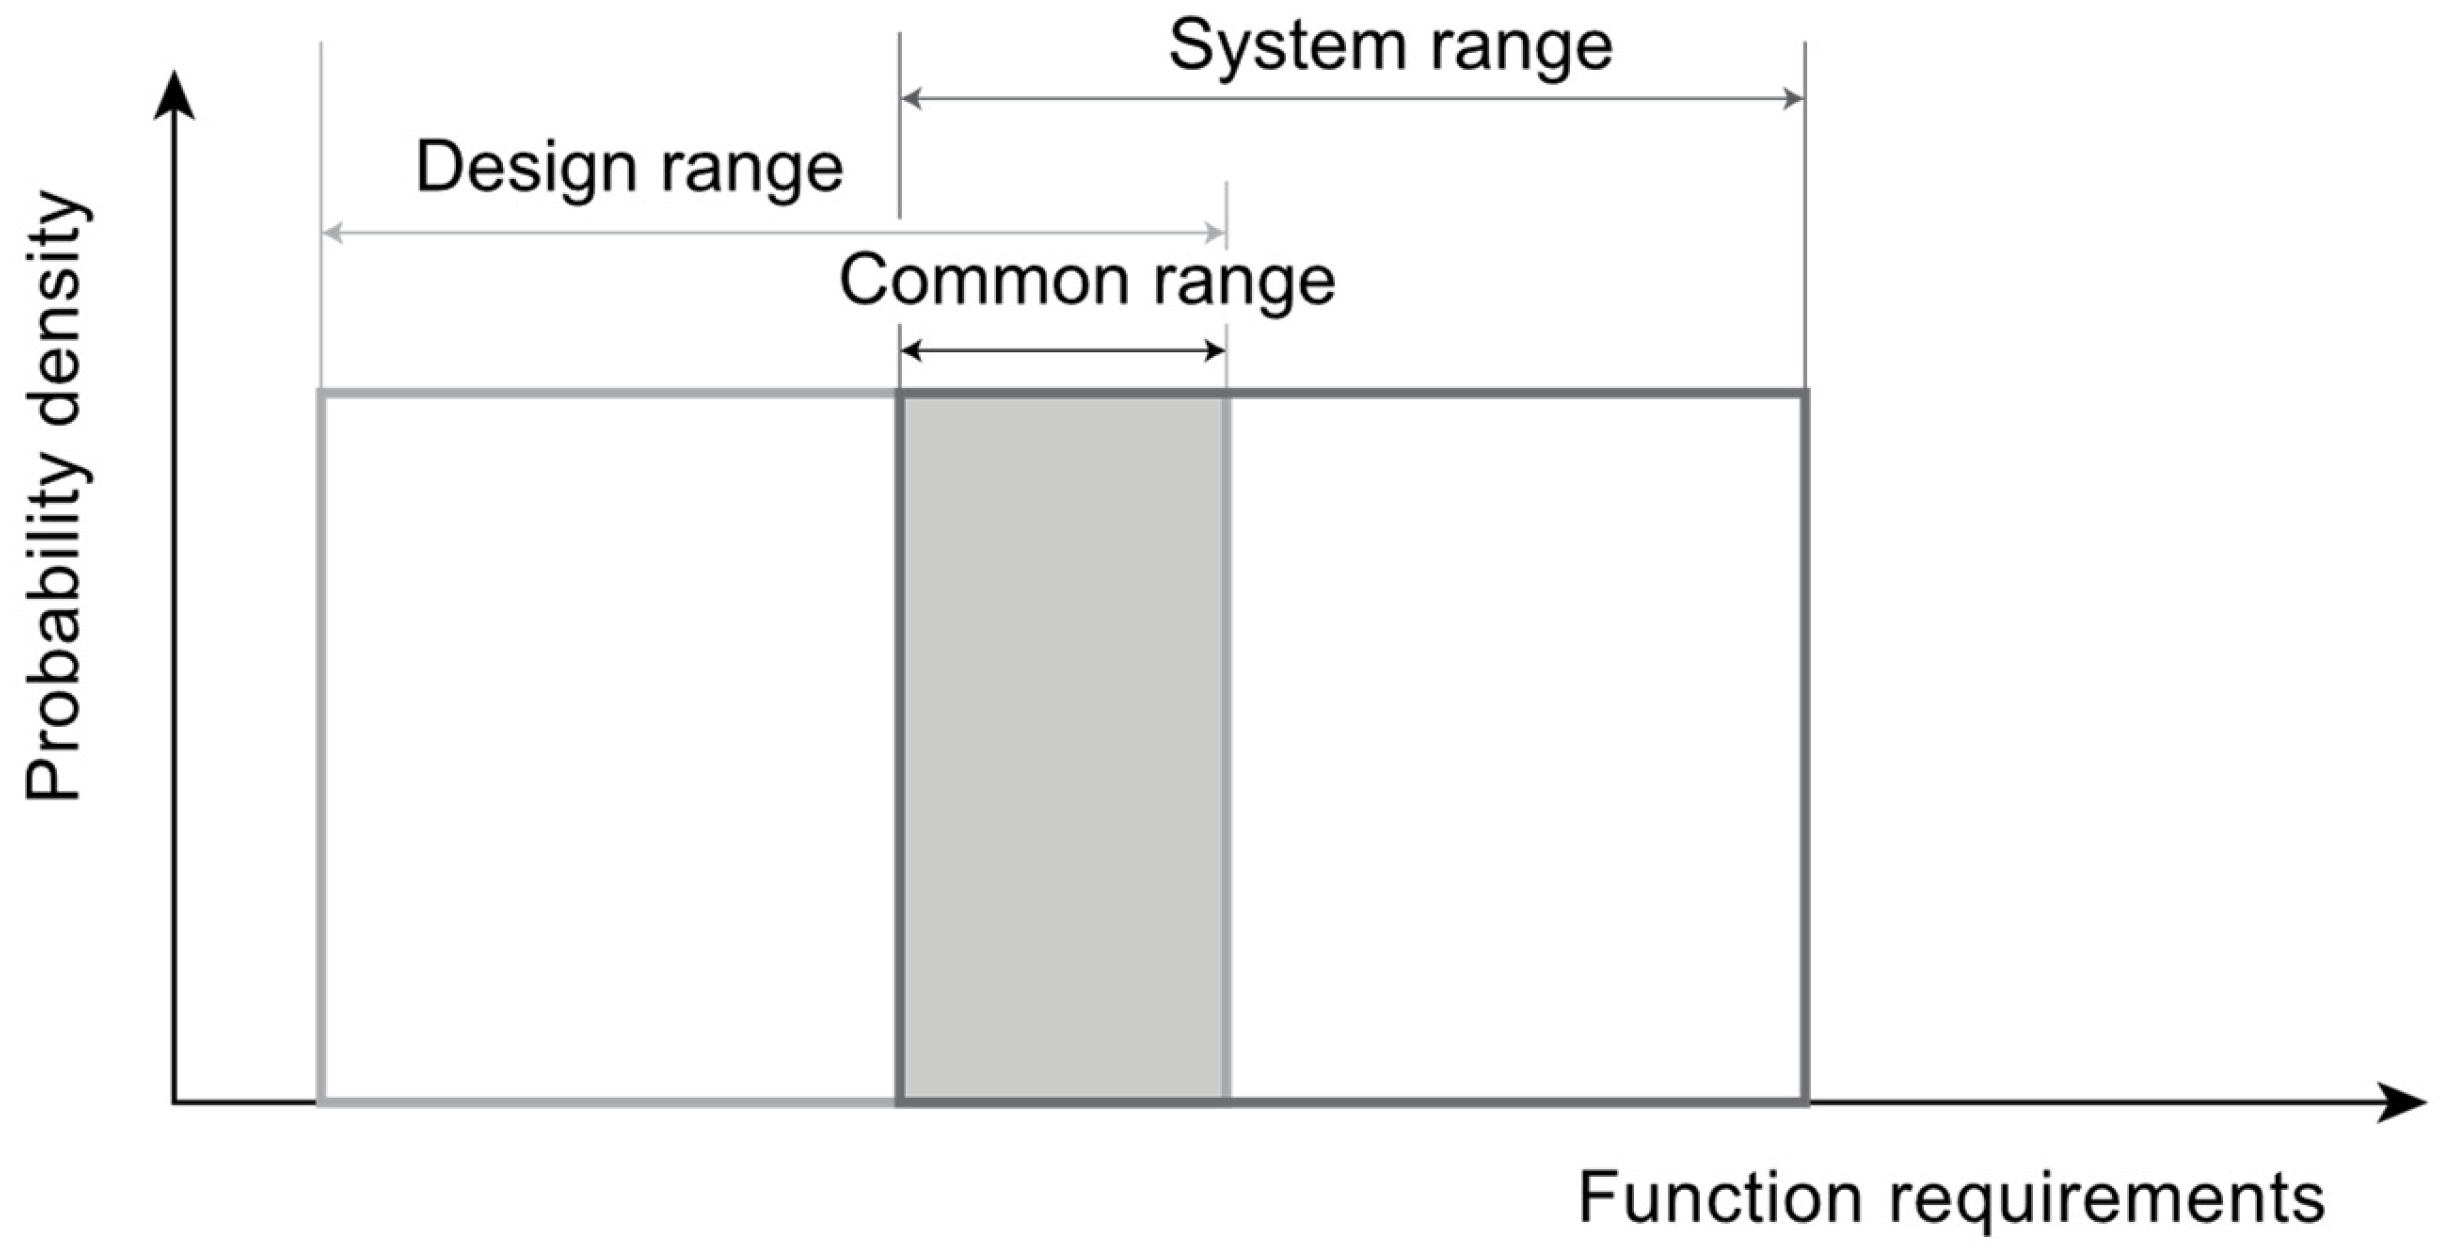
  • Plot the DR and SR through each FR’s upper and lower limits. Figure 6 shows an example of design range, system range, and common range in a probability density function plot.
  • Identify the area of intersection (overlap) between the DR and SR. This involves comparing the limits of allowable variation (minimum desirable percentage of compliance for the EMPr&Rq), represented by the DR with the actual variation provided by the assessed system (percentage of compliance with the EMPr&Rq), represented by the SR.
  • Determine the CR utilizing the seven cases as appropriate.
  • Case 1: Overlap exists when the upper limit of the DR is greater than or equal to the lower limit of the system range (XDRupper > XSRlow). In addition, the following two conditions must be verified: the upper limit of the SR is greater than the upper limit of the DR, and the lower limit of the DR is greater than the lower limit of the SR (XSRupper > XDRupper and XDRlow < XSRlow), as shown in Figure 6 below, which means that the design expectations were covered and exceeded by the results of the system evaluation. Consequently, the minimum information content is achieved, and the SR can become the DR for consequent evaluation of the corre-sponding FR.
Figure 6. Case 1 to determine the common range.
Sustainability 17 05458 g006
Therefore, the CR is determined by the following equation:
CR = XDRupperXSRlow
Therefore, for this evaluation model purpose, the EMI = 0 for the evaluated FR.
  • Case 2: There is overlap between DR and SR when the upper limit of the XSRupper is greater than XDRlow (XSRupper > XDRlow). Additionally, for this case to apply, the following two conditions must be verified: the upper limit of the DR is greater than the upper limit of the SR, and the lower limit of the DR is greater than the lower limit of the SR (XSRupper > XDRlow and XDRupper > XSRupper), which means that the evaluated system partially met the design expectations. Therefore, the CR is determined by the following equation:
CR = XSRupperXDRlow
  • Case 3: Overlap does not exist between DR and SR, since the upper limit of the XDRupper is lower than the XSRlow (XDRupper < XSRlow). However, for this model purpose, this means that the result of the evaluated system exceeded the design expectations. Therefore, the CR is determined by the following equation:
CR = Infinite
Since the design expectations and the system evaluation results do not overlap, the minimum information content can be achieved and the EMI = 0 for the evaluated FR.
  • Case 4: Overlap does not exist since the lower limit of the XDRlow is higher than the XSRupper (XDRlow > XSRupper), the design expectations are not met with the results of the evaluated system. Therefore, the CR is determined by the following equation:
CR = Infinite
Since the design expectations and the evaluated system’s results do not overlap, for this evaluation model purpose the EMI is equal to 10 for the evaluated FR.
  • Case 5: Perfect overlap occurs between DR and SR when XDRupper = XSRupper and XDRlow = XSRlow, which means that the design expectations are met with the results of the thoroughly evaluated system. Therefore, the CR is determined with the following Equation:
CR = XDRupperXSRlow or XSRupperXDRlow
Since the design expectations and the evaluated system’s results are entirely overlapped, the EMI is equal to 0 for the evaluated FR.
  • Case 6: There is an overlap between DR and SR when the upper limit of the SR is greater than the upper limit of the DR, and the lower limit of the DR is greater than the lower limit of the SR (XSRupper > XDRupper and XDRlow > XSRlow), which means that the design expectations were partially covered by the results of the system evaluation; however, there are ergonomics practices improvement opportunities in the results of the evaluated system since they do not cover the expectations (minimum requirements) of the design. Therefore, the CR is determined by the following equation:
CR = XDRupperXDRlow
  • Case 7: There is an overlap between DR and SR when the upper limit of the DR is higher than the SR upper, and the lower limit of the SR is higher than the lower limit of the DR (XDRupper > XSRupper and XSRlow > XDRlow), which means that the results of the system evaluation fully cover the minimum design expectations. Therefore, the CR is determined by the following equation:
CR = XSRupperXSRlow

3.5. Step 5. Ergonomics Management Index (EMI) for EMEM of the SC

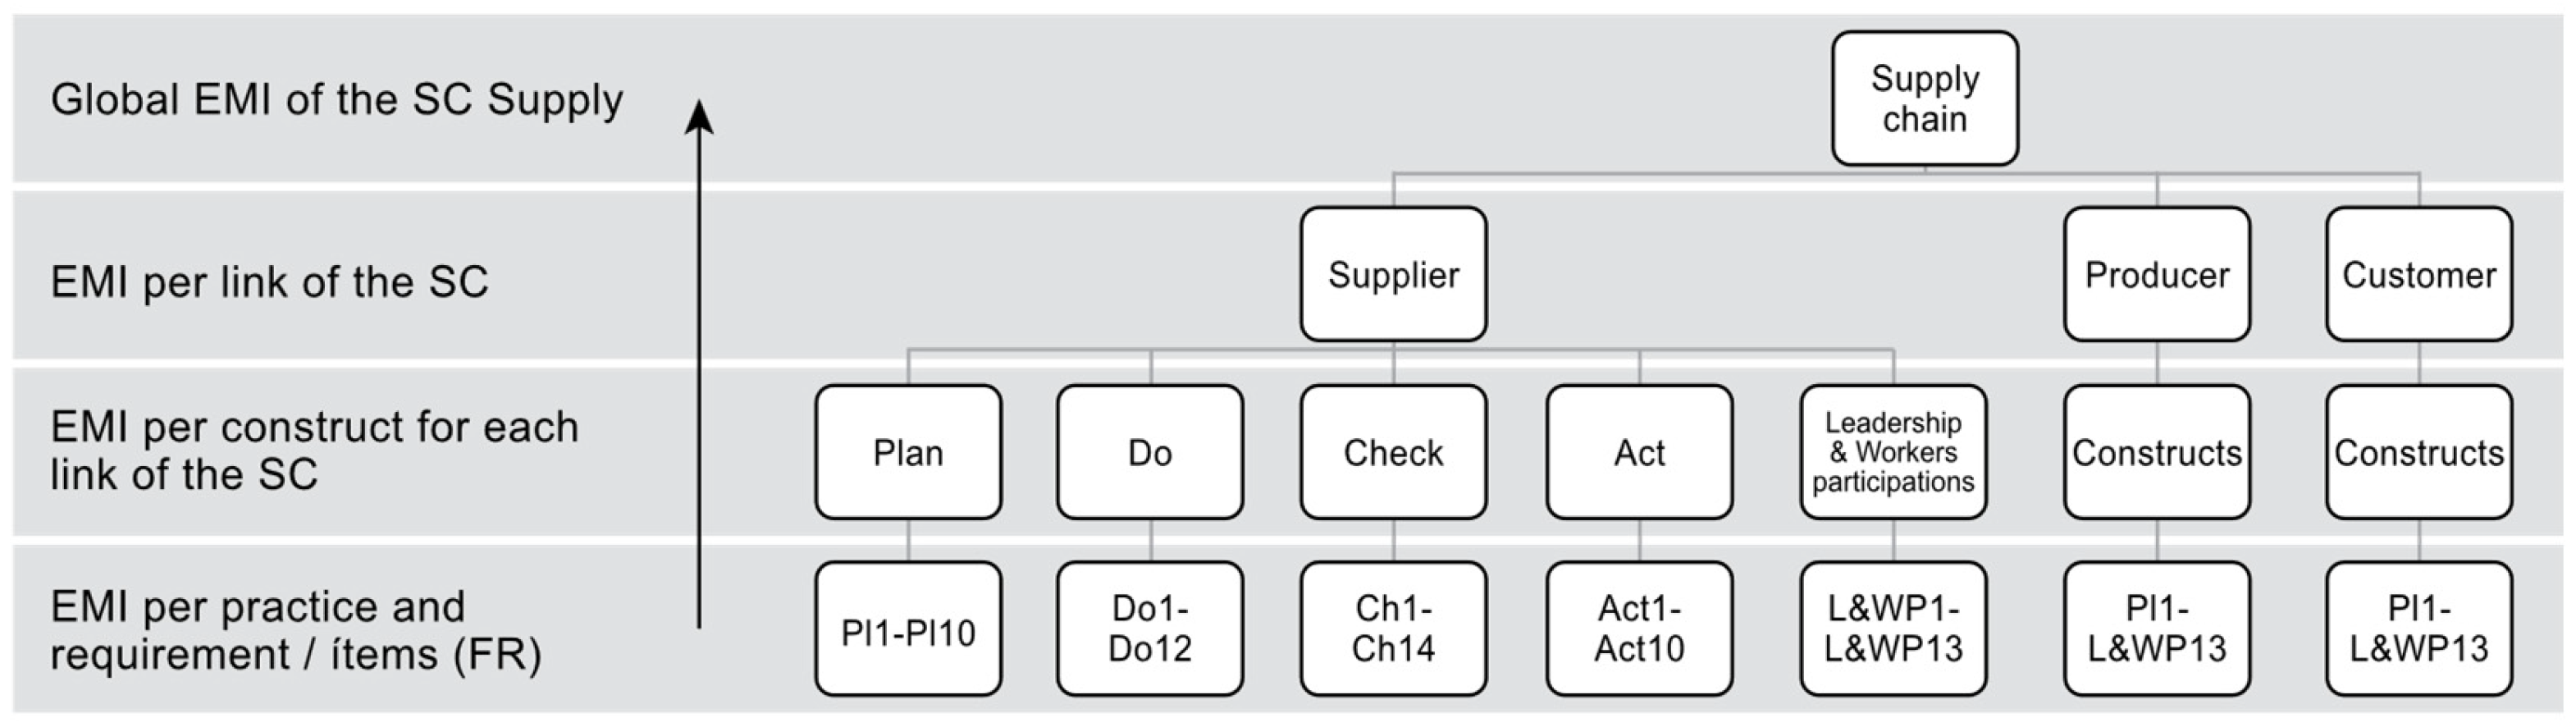
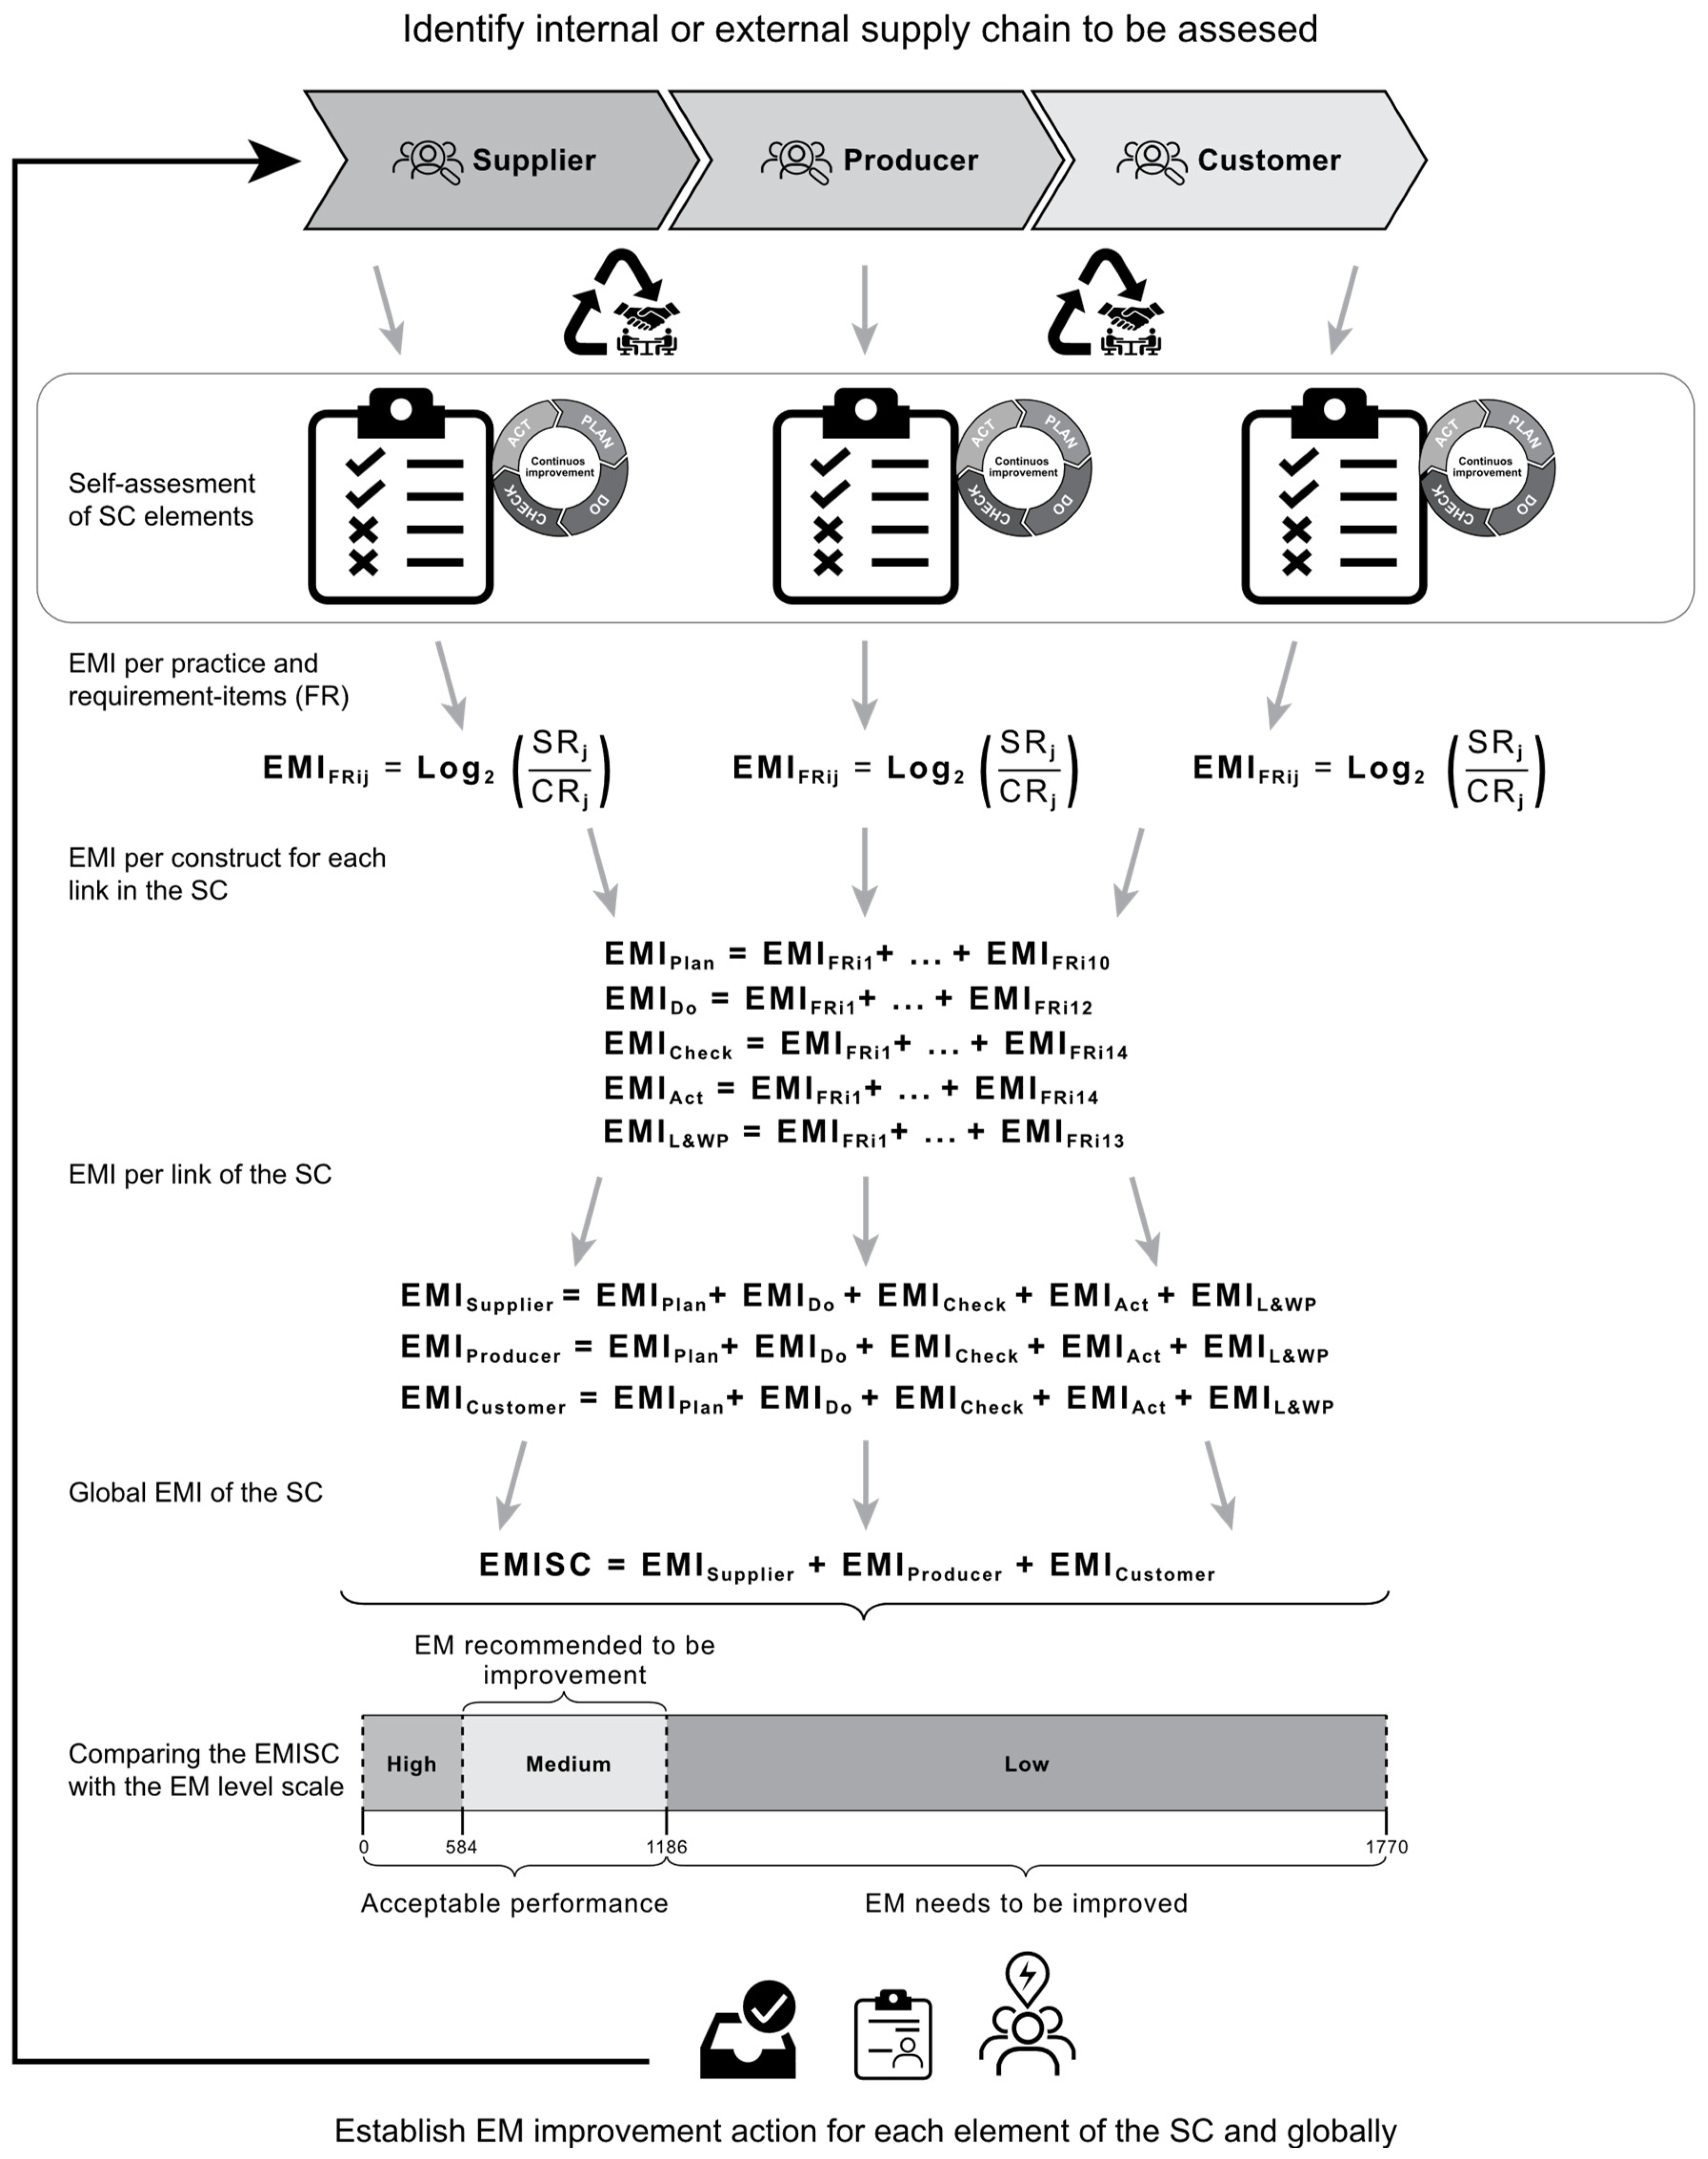
This step establishes the basis for the determination of the EMI for each element of the EMEM of the SC, which can be obtained at different levels depicted in Figure 7.
One of the main advantages of the model derives from the additive nature of the information axiom, which offers versatility in assessment and facilitates obtaining the EMI at all levels of the SC. FRs, constructs (Plan, Do, Check, Act, and Leadership and Workers Participation) for the supplier, producer, and customer. Therefore, the model calculates the EMI for each EMPr&Rq using Equation (9) to be determined until the overall EMI of the SC (EMISC) is obtained from the process of adding each independent result and respecting the hierarchy (in Section 3.1.5, the equations for the calculation of the EMIs are shown). At the base of 
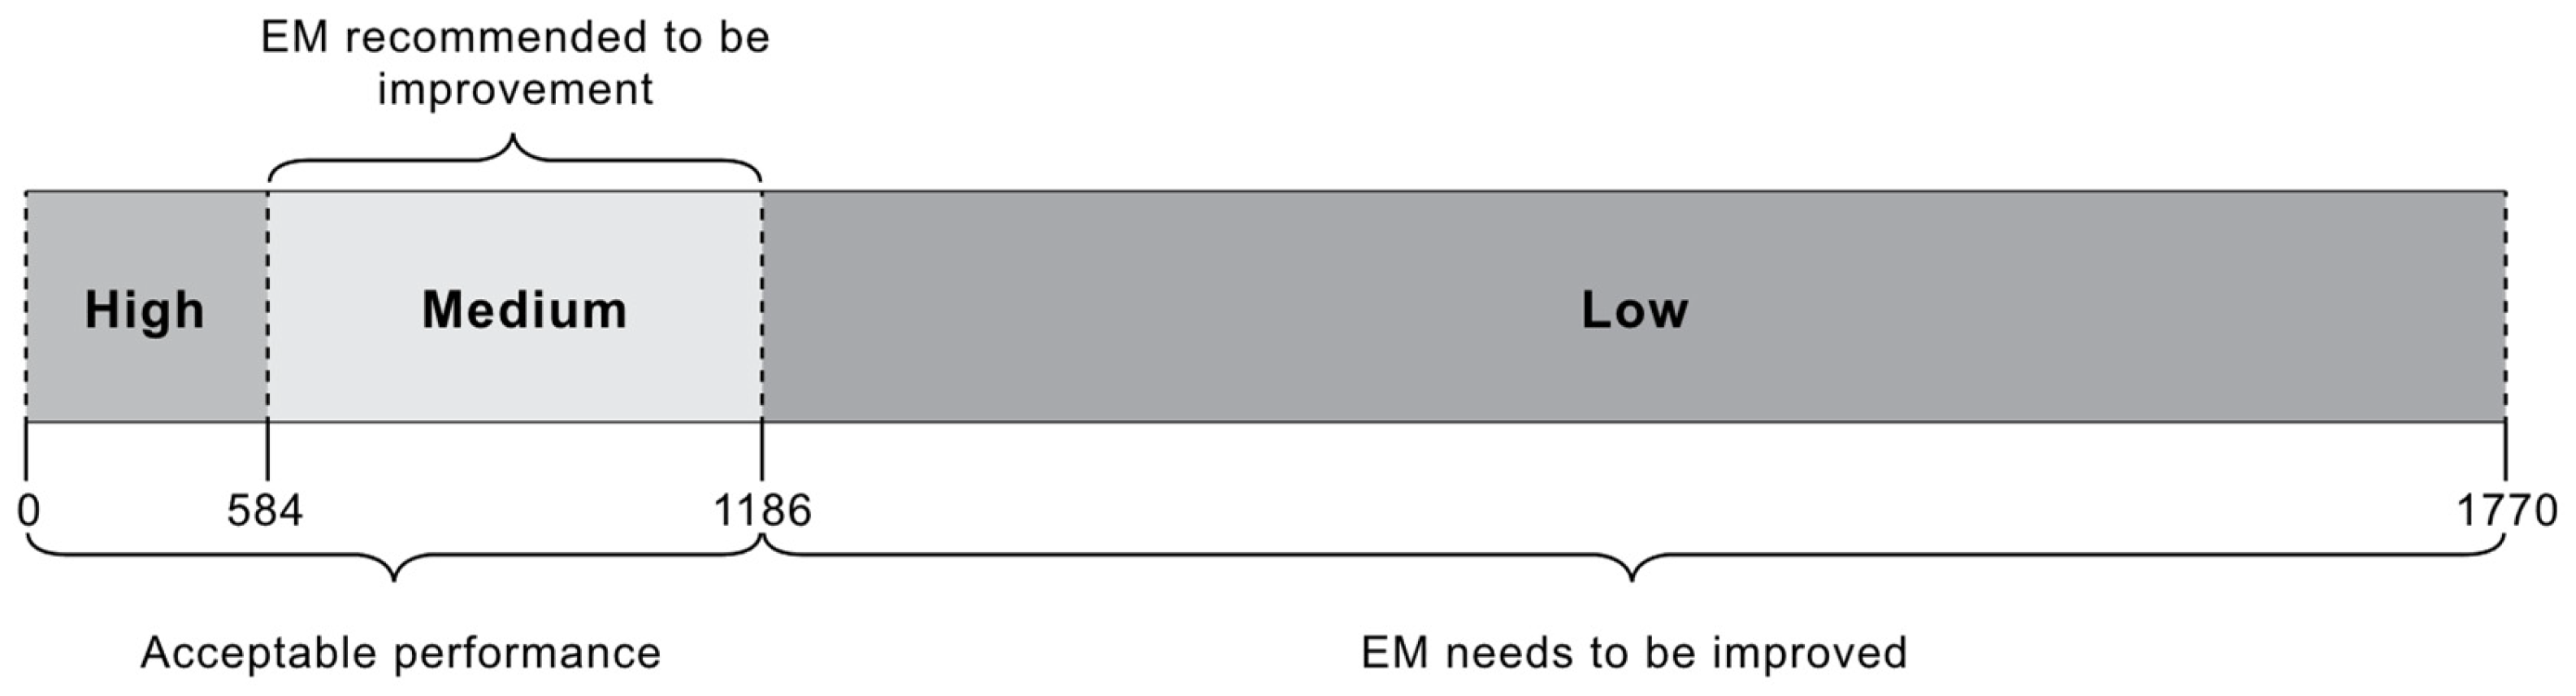
Figure 7 are the items or FRs assessed in the EMSI, at the second level are the constructs or domains for each link, while the third level shows the links that make up the SC. Once the EMISC is obtained, it is compared with the EM scale (see Figure 8) to determine the level of management of the SC assessed and the need for intervention through an action plan. The complete procedure for applying this model will be presented in Section 3.6. In addition, a case study will be deployed in Section 4.2.

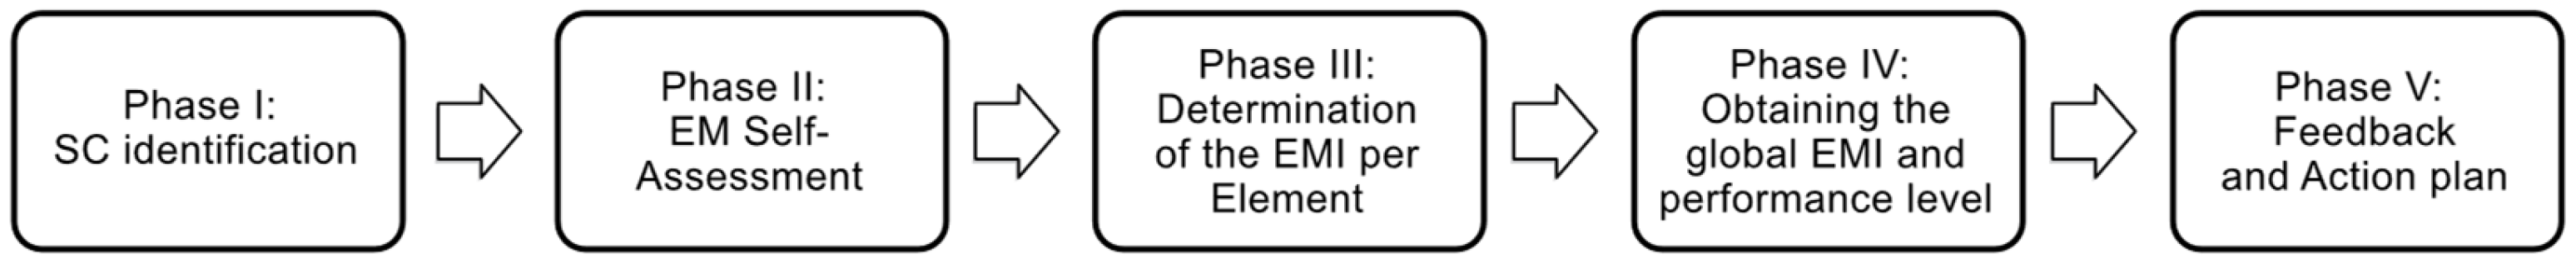
3.6. Step 6. EMEM of the SC Procedure

Implementing the EMEM of the SC requires a procedure consisting of 5 phases. These phases are shown and described below in Figure 9:

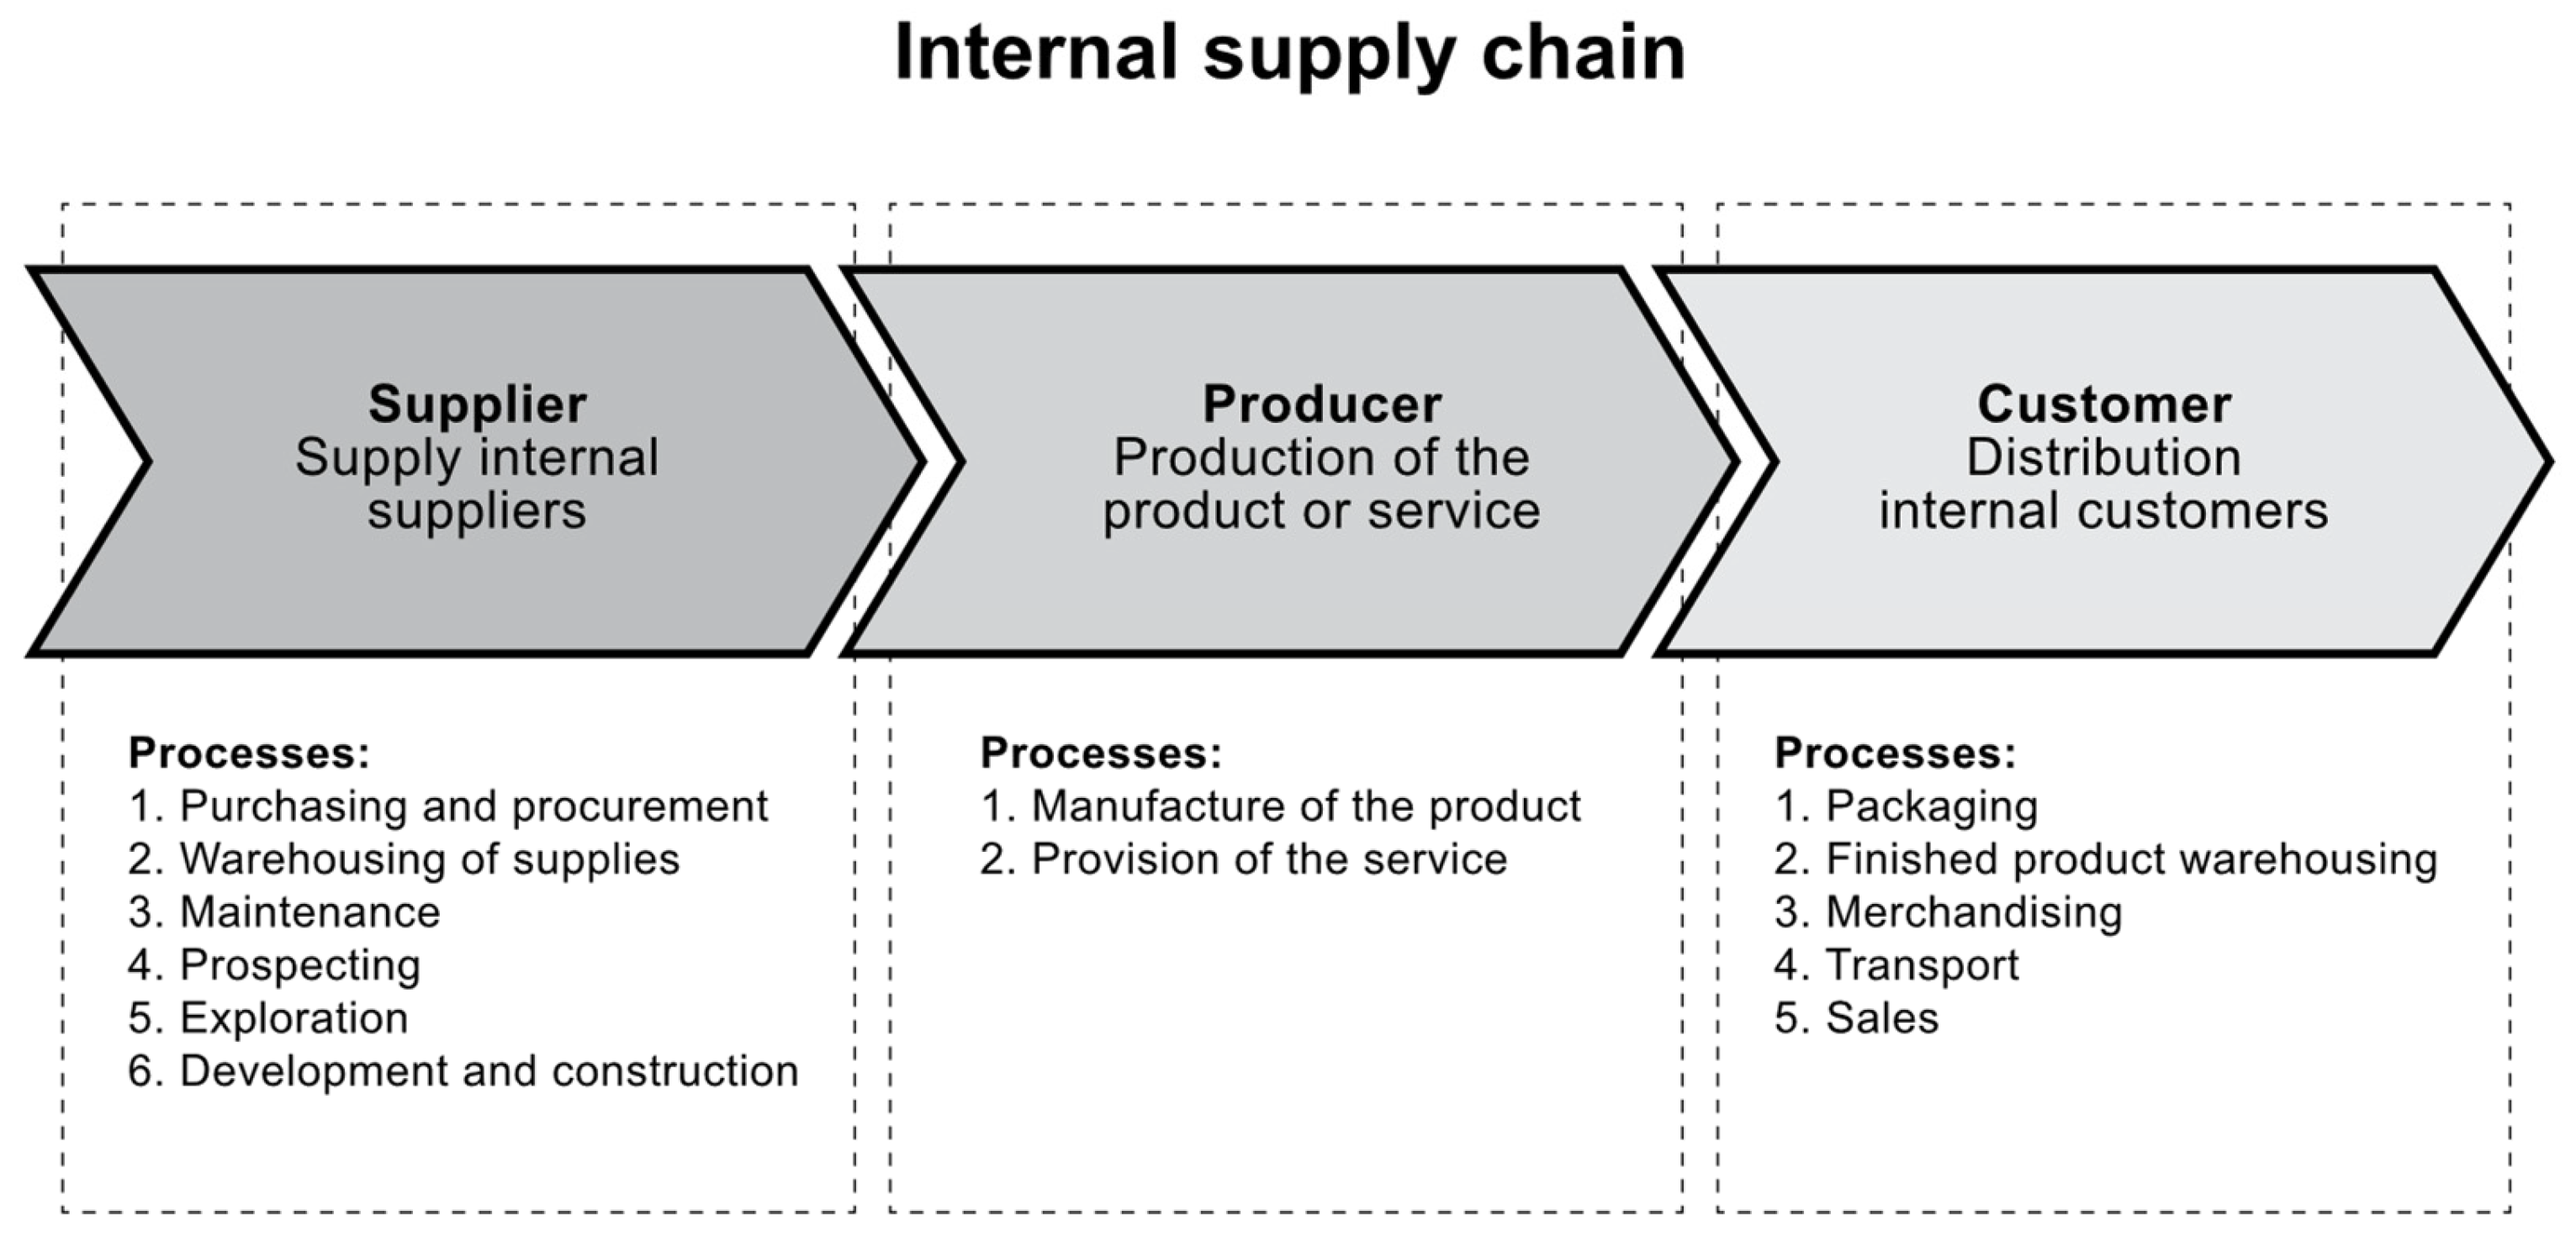
3.6.1. Phase I: Supply Chain Identification

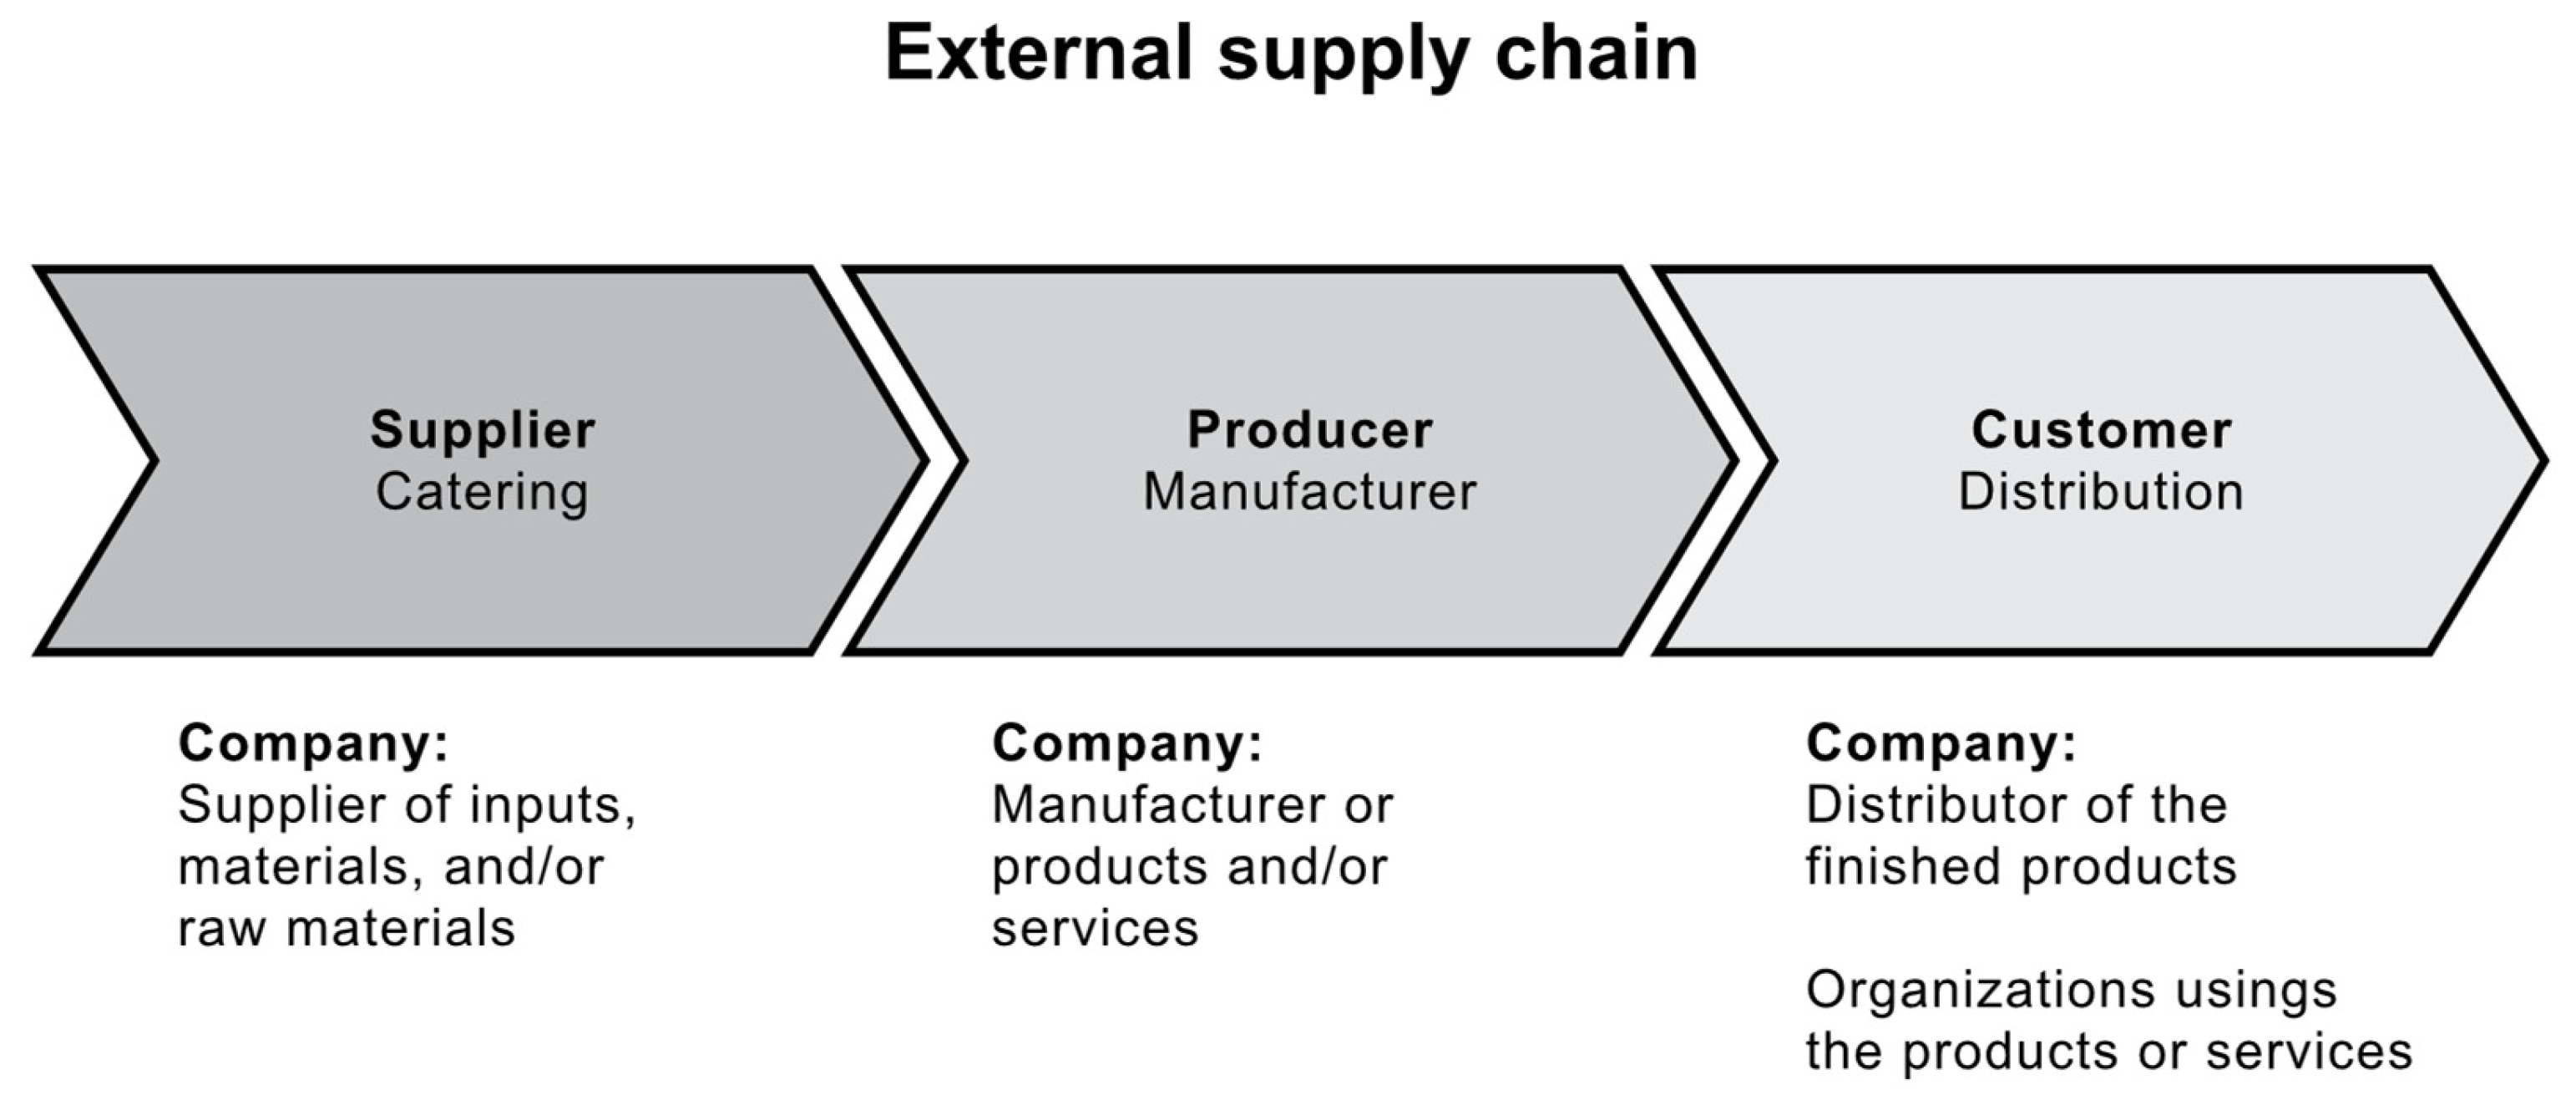
In this phase, the SC under study is identified to establish the actors involved in it, who will be the evaluators of the compliance of the EMPr&Rq. The evaluation can be implemented considering (1) a product, (2) a particular service, or (3) a company in general. The SC to be assessed can be internal or external. For the internal supply chain (ISC), the functions or processes performed by the different departments of the assessed organization are identified. For the external supply chain (ESC), the organizations participating in the chain are identified. To facilitate the identification, two diagrams are provided: (1) ISC (see Figure 10) and (2) ESC (see Figure 11).
Once the type of supply chain has been identified, a minimum of 2 participants per link are identified. The participants must hold middle and/or senior management positions, have knowledge of ergonomics, and know the functions and processes of the links under study.

3.6.2. Phase II: Evaluation Schemes—Design Range and System Range

The two evaluation schemes will determine the DR and SR in this phase. The first one, the DR, will be obtained by considering the answers of experts who determine the minimum desirable percentages of compliance for the EMPr&Rq for each FR established in the evaluation through the EMEI. The DR should be determined for each FR using the design range procedure described in Section 3.2. The second scheme system rank will be obtained by considering the answers of the chosen personnel of each department or organization to be assessed that participate in each element (Supplier, Producer, and/or Customer) of the SC; they will have to answer the EMSI establishing the percentage of compliance for each practice and requirement (items) of the EM. The SR must be established for each FR (item) using the system ranking procedure described in Section 3.3.

3.6.3. Phase III: Determination of the EMI per Element

In this phase, the common range between DRs and SRs for each FR (practice and MS requirement) is determined using the common range procedure described in Section 3.4. In addition, the EMI per practice and requirement (item), per construct, and link, as appropriate, is determined as specified in Section 3.5.

3.6.4. Phase IV: Obtaining the EMISC and Performance Level

In this phase, the EMISC is calculated according to the Section 3.5, and the result obtained is compared with the EM scale (see Figure 8) to determine the management level of the assessed SC.

3.6.5. Phase V: Feedback and Action Plan

The results obtained for each EMI should be analyzed to feed back into each EMPr&Rq, construct, and SC link. Priority EMIs have the highest values or scores. In addition, if necessary, an action plan should be established to improve the performance of the EMPr&Rq in the evaluated SC through improvement actions.

4. Results

The following sections show the results of implementing the methodology and the case study in the Mexican salt industry.

4.1. Development of EMEM of the SC with Axiomatic Design Approach

This stage shows the results of the design process of the SC’s EMEM under the AD methodology approach. Due to the length of this article, it was decided to show the design development of only the Plan construct of the EMEM as an example or sample for the rest of the components that make up the evaluation model.

4.1.1. Determination of Customer Attributes (CAs)

The client needs of the EMEM for SC:
  • Assess the SC comprehensively and by link.
  • Identify the EMPr&Rq of highest priority or attention in each link.
  • Have an efficient and effective evaluation model for the EM.
  • Have and apply a parameter or reference indicator of the current state of the EM for each element of the SC and globally.

4.1.2. Define FRs of the System

The functional domain is focused on identifying the FRs necessary to design an EMEM for SC and integrally evaluate the SC and its links through an indicator that facilitates identifying the EMPr&Rq improvement opportunities in each link of the SC. Under this consideration, the breakdown of the FRs at the different levels and for each link in the chain is established, as shown in Figure 12.
The following FRs were identified for each level:
  • FR of level 0 of the EMEM of the SC
  • FR0: Design the EMEM of the SC.
  • First-level FRs: links of the EMEM of the SC
  • FR1: Evaluate the EM of the Supplier link.
  • FR2: Evaluate the EM of the Producer link.
  • FR3: Evaluate the EM of the Customer link.
  • Second-level FRs: elements or components of the EMEM of the SC
  • FR1.1: Evaluate the EM Plan of the supplier link.
  • FR1.2: Evaluate the EM Do of the supplier link.
  • FR1.3: Evaluate the EM Check of the supplier link.
  • FR1.4: Evaluate the EM Act of the supplier link.
  • FR1.5: Evaluate the EM L&WP of the supplier link.
  • Third-level FRs of the EM Plan
  • FR1.1: Answer the statement to assess compliance on whether up-to-date and documented ergonomics objectives are in place (PL1).
  • FR1.2: Answer the statement to assess compliance on whether it is determined how the objectives of the EM will be met (PL2).
  • FR1.10: Answer the statement to assess compliance with whether internal factors such as objectives, policies, and strategies on resources and working conditions, organizational culture, existing rules, guidelines, and/or contracts are considered in the planning of the EM (PL10).
In the third level, only the results of the first element, Plan, are shown, where the good EMPr&Rq to be evaluated in the SC’s EMEM were considered. The input and system constraints necessary for the viability of the design of the SC’s EMEM were also established.
  • Input Constraints:
  • C1: Assessment participants should have a minimum of a bachelor’s degree or specialization and knowledge of ergonomics.
  • C2: The participants in the assessment should hold middle or senior positions within the organization.
  • C3: To implement the EMEM of the supply chain, a minimum of 2 participants from each link is necessary, as well as to evaluate the organization generally.
  • System Constraints:
  • C4: To obtain the EMISC, you must get the EMI for each link of the SC.
  • C5: Only the requirements and practices related to the EM constructs will be evaluated to obtain the EMI based on the continuous improvement model and the ISO 45001 standard.

4.1.3. Mapping Between the Domains and Decomposition of {FRs}, {DPs}, and {PVs}: A Step in the Creating System

Figure 13 shows the mapping process for the first FR1 related to the supplier, with the Plan construct (FR1.1) and the EMPr&Rq for this construct (FR1.1.1–FR1.1.10) It should be noted that this process should be carried out for all first-level FRs (FR2 and FR3), second-level FRs (FR1.2, FR1.3, FR1.4, and FR1.5), and third-level FRs for the rest of the links, constructs, and EMPr&Rq derived from them. For the definition of the DPs, it was ensured that they did not conflict with the input and system constraints and were considered as elements or components that make up the EMEM of the SC with their respective levels of breakdown. Table 2 shows the FRs, and DPs defined for the design of this evaluation model at the different levels of the hierarchy associated with the Plan construct.
When the process variables (PVs) were identified, a new zigzagging process was initiated between the DPs and PVs. The PVs were defined for each DP at each level of the hierarchy. The PVs were determined by considering them as subtasks to be performed to fulfill the EM assessment. Table 2 below shows the PVs for the different hierarchy levels related to the Plan construct.

4.1.4. The Independence of System Functions

The SC’s EMEM design satisfies the Independence axiom, as each FR was intended to be satisfied by a DP (related to the EMEM of the SC implementation) regardless of its level in the hierarchy. Equations (27)–(29) show the uncoupled design matrix for the three levels, as it represents a design of independent FRs and guarantees an ideal design. In addition, an uncoupled design matrix of the first-level DPs and PVs is shown in Equation (30).
F R 1 F R 2 F R 3 = X 0 0 0 X 0 0 0 X D P 1 D P 2 D P 3
F R 1.1 F R 1.2 F R 1.3 F R 1.4 F R 1.5 = X 0 0 0 0 0 X 0 0 0 0 0 X 0 0 0 0 0 X 0 0 0 0 0 X D P 1.1 D P 1.2 D P 1.3 D P 1.4 D P 1.5
F R 1.1.1 F R 1.1.2 F R 1.1.3 F R 1.1.4 F R 1.1.5 F R 1.1.6 F R 1.1.7 F R 1.1.8 F R 1.1.9 F R 1.1.10 = X 0 0 0 0 0 0 0 0 0 0 X 0 0 0 0 0 0 0 0 0 0 X 0 0 0 0 0 0 0 0 0 0 X 0 0 0 0 0 0 0 0 0 0 X 0 0 0 0 0 0 0 0 0 0 X 0 0 0 0 0 0 0 0 0 0 X 0 0 0 0 0 0 0 0 0 0 X 0 0 0 0 0 0 0 0 0 0 X 0 0 0 0 0 0 0 0 0 0 X D P 1.1.1 D P 1.1.2 D P 1.1.3 D P 1.1.4 D P 1.1.5 D P 1.1.6 D P 1.1.7 D P 1.1.8 D P 1.1.9 D P 1.1.10
D P 1 D P 2 D P 3 = X 0 0 0 X 0 0 0 X P V 1 P V 2 P V 3

4.1.5. Ergonomics Management Index from Information Content Axiom

The EMI determines the probability of compliance or satisfaction of the FRs for the EMEM of the SC. The FRs at the last level of the hierarchy are the items of the EMSI, which are associated with the EMPr&Rq and should be monitored in terms of the organizations’ compliance rate. For this reason, the derivation of the EMI for the EMPr&Rq is explained. The relevant equations for each level are shown below:
E M I F R i j = log 2 S R j C R j
where i represents the construct or domain assessed (Plan, Do, Check, Act, and Leadership and& Worker participation), while j is the item number of the EMSI (j = 1 … n).
In the case of the EMI per construct, the results of each FRij that make up the assessment of the construct of a link are used and integrated through addition, as shown in the following equation:
E M I i = E M I F R i j + + E M I F R i j
where i represents the construct or domain assessed.
In the case of the EMI per link, the results of each EMIi that make up the constructs of the link assessment are used and integrated through aggregation processing, as shown in the following equation:
E M I k = E M I i + + E M I i
where: k represents the link of the supplier, producer, or customer of the SC.
In the case of the EMI global of the SC (EMISC), the results of each EMIk that make up the assessment of each link are used and integrated through aggregation processing, as shown in the following equation:
E M I S C = E M I k + + E M I k
Figure 14 shows the complete internal or external supply chain assessment model, the result of developing the SC’s EMEM.

4.2. Ergonomics Management Model Application

The implementation of the EMEM of the SC was carried out through a case study of the salt industry in the mining sector in Mexico, where the ISC of salt in a bag product was evaluated. The ergonomics management evaluation procedure was used for this purpose.

4.2.1. Phase I: Supply Chain Identification

The functions and processes were analyzed to identify the links in the ISC of the salt in a bag product (25 kg) of the organization under study, establishing the departments that make up the ISC in this organization, as shown in Figure 15.

4.2.2. Phase II: Evaluation Schemes—Design Range and System Range

Below are the responses of the first evaluation scheme of experts who established the minimum desirable percentages of compliance with the different constructs of the EM for the ISC; the reactions can be consulted in Appendix A. Table 3 shows the DRs of the Plan construct for the 10 FRs that make up the evaluation of this construct. Appendix B shows the DRs of the EMPr&Rq for the rest of the constructs.
In the second evaluation scheme, the sample size of ISC positions, including supervisors and managers of the different departments that make up the ISC links of salt in a bag product, one of the most in-demand products for this organization, were identified, as shown in Table 4:
A sample of 14 employees responded to the EMSI as participants (PCPs). Table 5 shows an extract of the employees’ responses for the corresponding link that makes up the ISC of the planning construct (Plan). The reactions of the rest of the constructs of all participants are shown in Appendix C.
For each FR (item) of the EMSI, SRs were determined as part of the second evaluation scheme. Table 6 below shows the determination of the SR of the first item (FR) of the Plan construct for each SC link as an example of application:
Table 7 shows the SRs of the Plan construct for each ISC link. Appendix D shows the SRs of the EMPr&Rq for the rest of the ISC constructs and links.

4.2.3. Phase III: Obtaining the EMI per Element

In this phase, the CR of two FRs of the construct of Plan belonging to two ISC links was determined as an example. Figure 16 shows the relationship of DR1.1.1, FR1.1.1, and CR1.1.1 of the Plan construct of the supplier link to identify the overlap of DR1.1.1 and SR1.1.1. However, since there is no overlap, CR1.1.1 is considered infinite. Therefore, EMI1.1.1 is equal to 10, as it was penalized for failing to meet the minimum expectations of the experts for this EMPr&Rq.
The other example of determining the CR of FR3.1.1 is related to the customer link Plan construct. Figure 17 shows CR3.1.1 derived from the overlap between DR3.1.1 and SR3.1.1.
Case 2 was used to determine the CR of this EMPr&Rq. The calculation of the CR is obtained as follows:
CRFR3.1.1 = 84.14 − 69.21 = 14.93
Table 8 shows the FRs, the overlap, and the status of the implemented practice. The case used to determine the CR and the CR result for each EMPr&Rq of the Plan construct for the three links that compose the internal supply chain, salt in a bag product. Appendix E shows the CR results for the remaining constructs and links.
For the customer link, all the EMPr&Rq presented an overlap, highlighting FR3.1.4 and FR3.1.5 because these exceeded the expectations established by the experts. Case 1 is used to determine the CR and establish EMIFR3.1.4 = 0 and EMIFR3.1.5 = 0, which is considered good management of these EMPr&Rq. Once the CR of all the EMPr&Rq were obtained, the EMIs per EMPr&Rq and construct were determined.
The EMI was not calculated for the EMPr&Rq of the Supplier Plan construct, as there was no overlap between DR and SR. Therefore, the CR is infinite, or the practices were not initiated (participants reported a compliance rate = 0). Below is an example of the calculation of the EMIFR3.1.1 per EMPr&Rq for the customer link of the Plan construct.
E M I F R 3.1 . 1 = log 2 28.3 14.93
E M I F R 3.1 . 1 = log 2 1.89
E M I F R 3.1 . 1 = 0.92
Table 9 presents the EMI results for all the FRs of the Plan construct for each link and the EMI per construct. Appendix E shows the EMIs for the constructs Do, Check, Act, and Leadership and Worker participation (L&WP) for each ISC link of the salt in a bag product.
As a result of the EMIPlan of the customer link, it was determined by adding the EMIFR of each corresponding construct, as shown below:
E M I P l a n = 0.92 + 1.09 + 1.27 + 0 + 0 + 0.15 + 0 + 0 + 0.62 + 0 = 4.05
Table 10 shows the results of the EMIs by a construct for all the links of the evaluated ISC. The result reveals that the best scores for EMPr&Rq are associated with the customer Act, specifically within the logistics and distribution department, which achieved scores of 1.99. Conversely, the lowest evaluations for non-compliance in implementation pertain to the five Supplier constructs, as most of these received the highest scores. This is due to the lack of compliance with the minimum requirements set by the experts or even the non-adoption of EMPr&Rq in the purchasing and supply warehouse departments.
The EMI was also calculated for each link of the ISC (Table 11):
Identifying that the weakest link is the Supplier, which obtained the highest score of 540 points, while the best evaluated is the customer. However, the ideal parameter of compliance with the EMPr&Rq should be 0 for each element of the ISC.

4.2.4. Phase IV: Determination of the EMI Global of the SC and Performance Level

As an overall index of the EMI performance in the ISC of the salt in a bag product, a score of 726.07 was obtained, as shown in Table 12.
Considering the parameters of the MS of the SC measurement scale (see Figure 15) and based on the EMISC results, the level of performance for ISC of salt in bags product is medium, which is considered acceptable; however, improvements are recommended to obtain a high performance in fulfilling the EMPr&Rq.

4.2.5. Phase V: Feedback and Action Plan

Feedback on the practices and requirements that need to be implemented in the salt in a bag product supply chain (SC) focuses on the weakest link, which is the supplier; this link has the highest score in terms of vulnerability. Addressing this link is crucial for maintaining continuity in the supply chain. The next step involves establishing actions for the producer link and determining actions for the customer link. Once the link has been established, actions related to the Plan, Do, Check, Act, and Leadership and Worker participation construct should be initiated, respecting the order of the continuous improvement model. These actions should first focus on implementing practices that have not yet been adopted in the organization and then improve existing practices that have received an EMI score above zero. While the salt in a bag product supply chain currently demonstrates acceptable performance, there is still a need to implement and enhance the EMPr&Rq.
In this case study, the EMEM for ISC was implemented, and it helped identify opportunities for improvement at different levels and links. The internal supply chain evaluation obtained an overall medium rating of EMISC = 726.07. As was established before, there is a poor EMI for the supplier link in all domains because most of the EMPr&Rq have not been initiated in the Purchasing and Materials warehouse department. In contrast, the customer link obtained an EMI = 28.63 due to implementing good EMPr&Rq in the Logistics and distribution department processes.
These results were presented to three managers and three supervisors involved in each link of the SC and the safety manager validated it. The validation was carried out by analyzing the presence and/or level of implementation of the EMPr&Rq in the ISC of the salt in a bag product. To this end, a report of the evaluation results was prepared, showing the EMI of each EMPr&Rq by construct, link, and global SC, in addition to EMPr&Rq improvement opportunities, as well as an action plan for the continuous improvement of the EMPr&Rq. Therefore, the proposed EMEM effectively obtains an EMI for each element that makes up the ergonomic management assessment in the SC and way entirely.

5. Discussion

As a discussion, the current ergonomics management evaluation models present some characteristics that can be contrasted to the proposed model to highlight the main differences and advantages.
Neves et al. [55] propose an ergonomics management model based on good practices for large industrial companies. These practices are related to the processes of (1) Management Commitment, (2) Piloting, (3) Integration into Projects, (4) Development of Competence, (5) Communication and Documentation, (6) Auditable Standard, (7) Continuous Assessment, and (8) Network Creation. In contrast, the EMEM proposed for SC coincides with evaluating good practices and requirements and has a more robust basis than Neves et al. [55]. It is based on those proposed by ISO 45001 and focuses on continuous improvement and compliance both within and externally. This last aspect represents an advantage, as the EMEM proposes an evaluation with an internal and external scope of the SC.
Another model, such as the one proposed by Zeinalnezhad et al. [56], proposes indicators to assess the performance of the implementation of health, safety, environment, and ergonomics management systems (HSEEMS), considers aspects of Malcolm Baldrige’s award and the European Foundation for Quality Management (EFQM) for the determination of the eight criteria including leadership, strategy, risk analysis, people, resources, health, safety, environment, and ergonomics (HSEE) implementation, stakeholder effects, and key performance effects. The process of implementing or assessing the criteria is so far incomplete that the scope or strategy of the assessment is unknown. There is some concurrence between the criteria used and the proposed model. However, the EMEM presents a more comprehensive assessment procedure and a management index for feedback and monitoring of the management process.
Finally, Rezvanizadeh et al. [57] propose an ergonomics management model for workstations consisting of 8 steps: (1) Performance of task analysis (TTA), (2) Identification of ergonomic risks, (3) Estimation of the ergonomic index, (4) Determination of control measures, (5) Evaluation of cost-benefit parameter, (6) Implementation of control measures, (7) Continuous monitoring, and (8) Evaluation of the effectiveness of control measures. This model was designed to evaluate workstations and is considered an evaluation with a microergonomic approach. In contrast, the EMEM of SC was developed to adopt a macroergonomic approach due to its scope in evaluating the different links that make up the SC, which would allow its use in the various productive sectors. In addition, there are similarities between the eight steps of the model and the EMPr&Rq evaluated in the EMEM, as both emphasize the identification of risks and have an index, but this evaluates aspects of physical, mental, and environmental ergonomics through traditional ergonomic methods. In addition, they consider applying control measures and monitoring and assessing the effectiveness of the implemented measures. However, the EMEM lacks a cost-benefit assessment.
The main contribution of the EMEM of the SC is to provide a structured framework to identify, assess, and improve the EMPr&Rq that impacts the productivity, safety, and well-being of workers along the entire supply chain. This assessment approach proposes a macroergonomic analysis of the SC. It establishes an action plan considering the highest priority risks or issues to guide decision-makers in implementing ergonomic improvement actions. In addition, having an index such as the EMI provides evidence of the level of compliance with the EMPr&Rq through a quantitative indicator that can be recalculated according to the progress of compliance of the evaluated system, so it is considered an improvement parameter for decision-making.

6. Conclusions

Considering the development of the EMEM and its application in the case study, we can conclude that this research’s objective of proposing an EMEM for SC was achieved.
The proposed EMEM offers flexibility to unexpected results, as the model will adapt to the characteristics of the studied SCs. In addition, the EMEM effectively determines the SC’s EMI based on the information content axiom. The use of this axiom has been proven to be effective, and the proposed index presents advantages due to its additive nature [58]. This advantage allowed the EMI to be determined at the different hierarchical levels of the EM for each EMPr&Rq, per construct, per link, and globally. On the other hand, the EMEM identified improvement opportunities related to the EMPr&Rq and set priorities through the EMI level. In conclusion, the application of the case study to support the research hypothesis provides evidence of acceptable statistical validity of the EMEM.
The model identifies opportunities to improve ergonomics practices for companies participating in sustainable supply chains. The action plan constitutes the starting point of the first iterative cycle for continuous and sustained improvement. Then, the EMEM should be implemented again to obtain better results, and the EMIs should be obtained. As each cycle is repeated, cumulative enhancements will make the EMPr&Rq and EM-related processes more efficient and effective at different levels, links, and globally. As for future research, the model can be the base for software development entering the digital transformation era, facilitating the model implementation and demonstrating the benefits of ergonomics in SCs.
In different economic sectors, implementing EMEM in SCs may have positive implications regarding occupational health, productivity, operational efficiency, and regulatory compliance. Companies and supply chains implementing EMEM can foster a responsible organizational culture through an iterative process of continuous improvement that potentially reduces risks, improves working conditions, reduces costs, and provides the basis for informed decision-making and improving ergonomic processes within the industry. All these efforts contribute to achieving SS in SC and, thus, to sustainable supply chains, as efficient ergonomics management has a positive impact on the improvement of staff health and well-being at work, increased satisfaction, reduced absenteeism, increased productivity, and inclusion and diversity in the work environment by considering the needs and characteristics of the workforce. All these benefits impact the domains and internal aspects of social sustainability set out in the literature.

Author Contributions

Conceptualization, I.F.R.-G., A.A.M.-M. and A.N.-F.; Methodology, I.F.R.-G. and A.A.M.-M.; Validation, I.F.R.-G., E.A.L.-L. and A.N.-F.; Formal Analysis, I.F.R.-G. and J.L.H.-A.; Investigation, I.F.R.-G. and E.A.L.-L.; Resources, E.A.L.-L. and A.N.-F.; Writing—Original Draft Preparation, I.F.R.-G. and A.A.M.-M.; Writing—Review and Editing, I.F.R.-G., A.A.M.-M. and Y.R.; Visualization, I.F.R.-G. and Y.R.; Supervision, A.A.M.-M., J.L.H.-A. and Y.R.; Project Administration, A.A.M.-M. All authors have read and agreed to the published version of the manuscript.

Funding

This research received no external funding.

Institutional Review Board Statement

The ethics approval number is CEI-2022-1-591, granted by the Universidad Autónoma de Ciudad Juárez (Autonomous University of Ciudad Juarez, UACJ) Research Ethics Committee.

Informed Consent Statement

All participants agreed to participate unitarily and signed an informed consent statement.

Data Availability Statement

Data is contained within the article.

Acknowledgments

We thank the Secretaría de Ciencia, Humanidades, Tecnología e Innovación (The Secretariat of Science, Humanities, Technology, and Innovation, SECIHTI) for financially supporting this research and for the support of ITSON National Laboratory for Transportation Systems and Logistics. We also thank the Universidad Autónoma de Ciudad Juárez (Autonomous University of Ciudad Juarez, UACJ) for following up on this research. In addition, we are grateful to Instituto Tecnológico de Sonora (Sonora Institute of Technology, ITSON) for the support through the project PROFAPI 2025. Finally, we offer special thanks to all those who participated in developing the EMEM of the SC.

Conflicts of Interest

The authors declare no conflict of interest.

Abbreviations

The following abbreviations are used in this manuscript:
ADAxiomatic design
CAsCustomer attributes
CIEMSE Continuous improvement instrument for ergonomics management system evaluation
CRsCommon ranges
DPsDesign parameters
DRsDesign ranges
EFQM European Foundation for Quality Management
EMErgonomics management
EMEI Ergonomics management expert instrument
EMEMErgonomics management evaluation model
EMIErgonomics management index
EMIs Ergonomics management indexes
EMISCErgonomics management index of supply chain
EMPr&RqErgonomics management practices and requirements
EMSEnvironmental Management Systems
EMSI Ergonomics management self-assessment instrument
ErMSErgonomics management systems
ESC External supply chain
FRsFunctional requirements
HF/EHuman factors and ergonomics
HSEE Health, safety, environment, and ergonomics
HSEEMS Health, safety, environment, and ergonomics management systems
HSMSHealth and safety management systems
IiInformation content
ILO-OSHOccupational safety and health management Systems
ISC Internal supply chain
ISMSInformation security management systems
ISO International organization for standardization
L&WPLeadership and Worker participation
NS Not stared
OH&S Occupational health and safety
OHSAS Occupational health and safety assessment series
PCPs Participants
PDCAPlan, Do, Check, Act Model
Pract Stat Practice status
PVsProcess variables
QMSQuality management systems
S Stared
SCSupply chain
SCsSupply chains
SRsSystem ranges
SSSocial sustainability
SSCSustainable supply chain
SSCMSustainable supply chain management
TQMTotal Quality Management
TTAPerformance of task analysis

Appendix A

Table A1. Minimum desirable percentages of compliance of the EMPr&Rq for each SC link (Plan construct).
ExpertThe Minimum Desirable Percentage of Compliance with the FRs (Items) of the Plan Construct
PL1PL2PL3PL4PL5PL6PL7PL8PL9PL10
170701001005070701007090
21001008080808580808080
3100100100100100100100100100100
41001001001009085100100100100
575757085858070808080
670709070809070807080
780807070708070909090
8100100909090100901009090
9656565656565901009090
1070708570707085506050
1180808080708080100100100
121001009590858585909090
13808080808080801009585
1410010010010090100100100100100
1590909590100909010090100
16909080707080909085100
17709010080100808085100100
18808085705070100859090
1980709090708070708050
207070809080709010080100
2160606060606065507060
2290909585859090100100100
23808080859080801008080
2450801008090100801009070
251001009590959595909090
2685757575608060858070
27100809075908070908070
28808075801009580909085
29657065707070551006555
30100857070901080909085
3195909090959090909090
32757065706075651007570
3380808580808080908585
3410010010010010075100100100100
Table A2. Minimum desirable percentages of compliance of the EMPr&Rq for each SC link (Do construct).
ExpertThe Minimum Desirable Percentage of Compliance with the FRs (Items) of the Do Construct
DO1DO2DO3DO4DO5DO6DO7DO8DO9DO10DO11DO12
1709085708085708090907070
2758080808080808080808080
3100100100100100100100100100100100100
410010010010010010010010090100100100
5758575758575757575757085
6708070707570707070707075
780801009080807080901008080
810010010010090901009090909090
9659065906565906565659065
10809070606060606060509060
11708080808080808080808080
1210010010090959510010090908595
13808070707570758080707070
14100100100100100100100100100100100100
15100100100100100100100100100505080
16809090907090909090909090
17100100100909010010090100909090
18806075909090808090909085
19809070807070908070506080
20707065656590807065657075
21707065706070707070656060
2295951009010010090100100959095
23859590908090858080759095
24801005070100501003080708090
259510010095959595100959595100
266085608050808070706070100
27809010080100958570807580100
2875100758060958560751008090
29707060607070707070607070
3075708080606010010070607080
31909090909090909090808590
32708555854065606570557555
33808080858080858080758085
34100100751007510010010010075100100
Table A3. Minimum desirable percentages of compliance of the EMPr&Rq for each SC link (Check construct).
ExpertThe Minimum Desirable Percentage of Compliance with the FRs (Items) of the Check Construct
CK1CK2CK3CK4CK5CK6CK7CK8CK9CK10CK11CK12CK13CK14
190701009070701001008010070808070
28080808080808080808070807080
3100100100100100100100100100100100100100100
4901001001001001001001001008080859080
57575857585757575707080708570
67070707075707070708070708070
77570757070708080808080808080
890909095909590959010090909090
96565656565655065506550506550
106090606090806565506085909085
118080808080807080805070507050
129590100100959595959010010010095100
137075707070757580707095756575
1410010010010010010010010010010090100100100
1510010010010010010010010010010010010010080
168090809090908080808080808080
17859080100909010080851001001008090
1810010090901001009010070901009010090
195070807070508070708050707080
2010010010010090100100100100100100100100100
216060606060706060656070656065
229095901001009580808595959510090
238085758080809090809090808090
2410010010010010010010010010010060100100100
25100100100100100100100100100100100100100100
266070907065706065654045503050
27807075808070909010090909010090
28958590951001008095758565808070
295070605070705050605060705050
30601001001009010095100601001006010020
319085859090908090808590909090
326060455580605555755060856075
338085858585858085808080808080
3410010010010010010010010075100100100100100
Table A4. Minimum desirable percentages of compliance of the EMPr&Rq for each SC link (Act construct).
ExpertThe Minimum Desirable Percentage of Compliance with the FRs (Items) of the Act Construct
ACT1ACT2ACT3ACT4ACT5ACT6ACT7ACT8ACT9ACT10
18070859090100808580100
280808080808080808080
3100100100100100100100100100100
4901001001001009090909090
570707070857070708070
670707070707070707080
785858080808080808085
895959590909090909095
965656565656565656565
1080807590908080806070
1170808080808080808080
12100951009595100951009595
1370757070706570707070
14100100100100100100100100100100
15100100100100100100100100100100
1680808080808080808080
17858010080808590100100100
18100100100100100100100100100100
1980508570709070908070
20100100100100100100100100100100
2165656570607060707560
2280100100959090901009080
2390908090909080909080
24100100100100100100100100100100
2595951001001009510010095100
2650603055405560709045
278080100809090801009090
288575901006590100808585
2970707070707070707060
30805090908090901009070
3195959095959090909090
3270658080608075607060
3380808585858585858580
341007510075100100100100100100
Table A5. Minimum desirable percentages of compliance of the EMPr&Rq for each SC link (Leadership and Worker participation (L&WP) construct).
ExpertThe Minimum Desirable Percentage of Compliance with the FRs (Items) of the Leadership and Worker Participation (L&WP) Construct
L&WP1L&WP2L&WP3L&WP4L&WP5L&WP6L&WP7L&WP8L&WP9L&WP10L&WP11L&WP12L&WP13
19090901007090100100901009080100
280808080808080808070707080
3100100100100100100100100100100100100100
490851001001009010010010010010090100
570707070707070707070707070
670707070707070707070707070
780808080858085808080858580
810010095959595959010090959595
965906565656565656565656565
1090909090808070807075707070
1180707080807070808070707070
121001001001001001001001009595959595
1370707070707070607065706570
14100100100100100100100100100100100100100
15100100100100100505050100100100100100
1680808080808080808080808080
1785808585858080758080808590
1810010010085100801001008080808080
1980807070707050508070707085
2010010010070100100100100100100100100100
2175706570606060707030306060
221009590959590100909590959590
2390908090909080909590909090
2410010010010010075100100100657565100
2510010095100100100100951001009010095
2680757580606565305045706055
2790809090959090909590809090
289010010090858080958585758590
2970706560707060607070707070
3090509095708080706080757050
3190959595859085859085908585
3275806570607065608055657065
3385858585858080808580808080
341001001001001007510010010010075100100

Appendix B

Table A6. DRs of the Do, Check, Act and Leadership and Worker participation constructs for each FR.
ConstructFR x ¯ mdpStd Dev.XDRupperXDRlowDR
DoDO182.412.394.770.024.6
DO288.111.399.476.822.6
DO381.615.797.365.931.4
DO483.711.995.671.823.8
DO579.716.195.863.632.3
DO683.214.297.469.028.4
DO785.412.598.072.925.0
DO881.015.996.965.131.8
DO982.512.194.670.424.2
DO1077.516.093.561.532.0
DO1180.912.593.468.425.0
DO1284.113.097.171.126.0
CheckCK181.216.097.165.231.9
CK284.413.497.871.026.8
CK384.114.999.069.229.8
CK484.415.7100.168.831.3
CK585.612.798.272.925.3
CK684.614.599.170.029.1
CK782.915.898.867.131.6
CK884.615.199.769.530.2
CK979.914.694.565.229.3
CK1082.618.0100.664.735.9
CK1181.316.998.364.433.9
CK1282.515.598.067.031.0
CK1382.917.1100.165.834.3
CK1479.118.697.760.637.1
ActACT183.513.196.670.426.2
ACT281.615.196.766.630.1
ACT385.715.6101.470.131.2
ACT485.112.897.972.425.5
ACT583.815.098.968.830.1
ACT685.912.498.373.524.8
ACT784.412.797.171.725.4
ACT886.612.999.573.725.8
ACT985.911.597.474.423.0
ACT1083.215.298.468.130.3
Leadership and Worker
Participation
L&WP187.211.298.476.022.5
L&WP286.013.099.073.026.0
L&WP385.613.098.672.626.0
L&WP485.612.698.273.025.2
L&WP584.014.098.069.928.0
L&WP680.412.793.167.725.4
L&WP781.816.097.865.832.0
L&WP880.717.998.762.835.9
L&WP984.313.898.070.527.5
L&WP1080.117.097.163.234.0
L&WP1180.014.694.665.429.2
L&WP1281.213.394.467.926.5
L&WP1382.914.797.668.329.3

Appendix C

Table A7. Compliance Percentage of the EMPr&Rq for each SC link (DO construct).
LinkPCPsCompliance Percentage with the FRs (Items) of the DO Construct
DO1DO2DO3DO4DO5DO6DO7DO8DO9DO10DO11DO12
Supplier1000000000000
21055105051015050
Producer1203006006500700020
2607050504060252570502560
3556040504055404060355045
4757045306555704570307560
5305010350105153004020
6708070807080708075807070
7705055506055706050557035
8909090858080909090808580
Customer1808070808095758080758080
280100601000100100100100100100100
3808060608080808080806080
4857070707090107095709090
Table A8. Compliance Percentage of the EMPr&Rq for each SC link (Check construct).
LinkPCPsCompliance Percentage with the FRs (Items) of the Check Construct
CK1CK2CK3CK4CK5CK6CK7CK8CK9CK10CK11CK12CK13CK14
Supplier100000000000000
2051005515510501005
Producer155715006001501504730
26060605050506050507060607555
34540604030355540454540405055
47050504545506055606060555060
510571100025020000030
67070657065657070808080707070
74040505040404560407030507070
89090908585909090909090909090
Customer18580858580707580757527504075
21001001001001001001001001001005050100100
38080808080808080808080806060
48070907070080950700707070
Table A9. Compliance Percentage of the EMPr&Rq for each SC link (Act construct).
LinkPCPsCompliance Percentage with the FRs (Items) of the Act Construct
ACT1ACT2ACT3ACT4ACT5ACT6ACT7ACT8ACT9ACT10
Supplier10000000000
20000000000
Producer13009030505585717030
270657070707070707060
350456555606070656055
475708575807575707575
5001510104070453520
670707070708070707070
740606060605050605060
890909090858585909090
Customer1808580908585801008080
2100100100100100100100100100100
380808080808080808080
407010070701001007010070
Table A10. Compliance Percentage of the EMPr&Rq for each SC link (L&WP construct).
LinkPCPsCompliance Percentage with the FRs (Items) of the L&WP Construct
L&WP1L&WP2L&WP3L&WP4L&WP5L&WP6L&WP7L&WP8L&WP9L&WP10L&WP11L&WP12L&WP13
Supplier10000007008550857075
20000007508050808070
Producer1253055750009050070
260656580505050507050507070
360554550705050407050505570
490756085758580409580909090
5501510072104103510151515
670706065706570807080807080
770606060608070506055607075
890909085808585858585858090
Customer185858070907075609075707085
2100100100100100100100100100100100100100
3100100100100100100100100100100100100100
490808007000901000259570
Note: Participants (PCPs). Leadership and Worker participation (L&WP).

Appendix D

Table A11. SR for each FR (EMPr&Rq) of the Supplier link.
ConstructSupplier System Range
FR x ¯ cpStd Dev.XSRupperXSRlowSR
DoDO15.07.112.1−2.114.1
DO22.53.56.0−1.07.1
DO32.53.56.0−1.07.1
DO45.07.112.1−2.114.1
DO52.53.56.0−1.07.1
DO60.033.633.6−33.667.3
DO72.53.56.0−1.07.1
DO85.07.112.1−2.114.1
DO97.510.618.1−3.121.2
DO100.035.935.9−35.971.7
DO112.53.56.0−1.07.1
DO120.033.233.2−33.266.4
CheckCK10.035.835.8−35.871.7
CK22.53.56.0−1.07.1
CK35.07.112.1−2.114.1
CK40.034.434.4−34.468.8
CK52.53.56.0−1.07.1
CK62.53.56.0−1.07.1
CK77.510.618.1−3.121.2
CK82.53.56.0−1.07.1
CK95.07.112.1−2.114.1
CK102.53.56.0−1.07.1
CK110.032.632.6−32.665.3
CK125.07.112.1−2.114.1
CK130.032.332.3−32.364.7
CK142.53.56.0−1.07.1
ActACT10.037.037.0−37.074.0
ACT20.036.936.9−36.973.8
ACT30.034.634.6−34.669.2
ACT40.033.833.8−33.867.6
ACT50.032.532.5−32.565.0
ACT60.031.831.8−31.863.7
ACT70.031.031.0−31.062.1
ACT80.030.730.7−30.761.5
ACT90.031.931.9−31.963.8
ACT100.032.032.0−32.063.9
Leadership and Worker participationL&WP10.034.034.0−34.068.1
L&WP20.034.734.7−34.769.3
L&WP30.036.536.5−36.573.1
L&WP40.040.340.3−40.380.6
L&WP50.030.830.8−30.861.6
L&WP60.039.839.8−39.879.6
L&WP772.53.576.069.07.1
L&WP80.038.338.3−38.376.5
L&WP982.53.586.079.07.1
L&WP1050.00.150.049.90.1
L&WP1182.53.586.079.07.1
L&WP1275.07.182.167.914.1
L&WP1372.53.576.069.07.1
Table A12. SR for each FR (EMPr&Rq) of the Producer link.
ConstructProducer System Range
FR x ¯ cpStd Dev.XSRupperXSRlowSR
DoDO158.823.482.235.346.8
DO262.519.181.643.438.2
DO345.029.474.415.658.8
DO455.019.574.535.538.9
DO544.430.675.013.761.3
DO657.521.979.435.643.8
DO746.333.779.912.667.3
DO844.431.275.613.262.4
DO964.418.082.446.436.0
DO1041.331.372.510.062.5
DO1151.928.980.823.057.8
DO1248.822.571.226.345.0
CheckCK148.829.978.618.959.7
CK24529.674.615.459.3
CK364.713.177.851.626.2
CK444.427.071.417.354.1
CK539.429.568.89.958.9
CK641.330.671.810.761.1
CK758.118.776.839.437.4
CK845.631.877.413.863.6
CK950.026.376.323.752.6
CK1051.934.686.517.269.3
CK1146.931.378.115.662.5
CK1245.631.877.413.863.6
CK1356.527.283.729.354.5
CK1457.520.477.937.140.7
ActACT153.129.182.324.058.3
ACT250.033.383.316.766.5
ACT368.124.392.543.848.7
ACT457.525.983.431.651.8
ACT560.623.484.037.346.7
ACT664.415.780.148.731.4
ACT771.911.082.960.922.0
ACT867.612.680.255.125.1
ACT965.016.781.748.333.4
ACT1057.523.080.534.546.0
Leadership and Worker
participation
L&WP164.421.385.743.142.6
L&WP257.524.381.833.248.7
L&WP349.428.778.120.757.4
L&WP453.834.087.719.868.0
L&WP569.09.678.659.419.2
L&WP653.132.986.120.265.9
L&WP755.827.483.128.454.7
L&WP843.131.574.611.663.0
L&WP971.919.190.952.838.1
L&WP1051.930.882.721.161.6
L&WP1153.832.686.321.265.2
L&WP1256.331.988.224.363.9
L&WP1370.023.893.846.247.5
Table A13. SR for each FR (EMPr&Rq) of the Customer link.
ConstructCustomer System Range
FR x ¯ p c Std Dev.XSRupperXSRlowSR
DoDO181.32.583.878.85.0
DO282.512.695.169.925.2
DO365.05.870.859.211.5
DO477.517.194.660.434.2
DO557.538.696.118.977.2
DO691.38.599.882.717.1
DO766.339.0105.327.278.0
DO882.512.695.169.925.2
DO988.810.399.178.420.6
DO1081.313.194.468.126.3
DO1182.517.199.665.434.2
DO1287.59.697.177.919.1
CheckCK186.39.595.776.818.9
CK282.512.695.169.925.2
CK388.88.597.380.217.1
CK483.812.596.371.325.0
CK582.512.695.169.925.2
CK662.543.5106.019.087.0
CK783.811.194.872.722.2
CK888.810.399.178.420.6
CK963.843.9107.619.987.7
CK1081.313.194.468.126.3
CK1139.334.073.25.368.0
CK1262.515.077.547.530.0
CK1367.525.092.542.550.0
CK1476.317.093.359.234.0
ActACT165.044.3109.320.788.7
ACT283.812.596.371.325.0
ACT390.011.5101.578.523.1
ACT485.012.997.972.125.8
ACT583.812.596.371.325.0
ACT691.310.3101.680.920.6
ACT790.011.5101.578.523.1
ACT887.515.0102.572.530.0
ACT990.011.5101.578.523.1
ACT1082.512.695.169.925.2
Leadership and Worker
participation
L&WP193.87.5101.386.315.0
L&WP291.310.3101.680.920.6
L&WP390.011.5101.578.523.1
L&WP467.547.2114.720.394.3
L&WP590.014.1104.175.928.3
L&WP667.547.2114.720.394.3
L&WP768.847.3116.121.494.6
L&WP887.518.9106.468.637.9
L&WP997.55.0102.592.510.0
L&WP1068.847.3116.121.494.6
L&WP1173.835.4109.238.370.9
L&WP1291.314.4105.676.928.7
L&WP1388.814.4103.174.428.7

Appendix E

Table A14. CRFR and EMIFR of the Supplier EMPr&Rq.
ConstructFR Practice StatusCREMIFR
DoDO1StartedInfinite10
DO2StartedInfinite10
DO3StartedInfinite10
DO4StartedInfinite10
DO5StartedInfinite10
DO6Not StartedInfinite10
DO7StartedInfinite10
DO8StartedInfinite10
DO9StartedInfinite10
DO10Not StartedInfinite10
DO11StartedInfinite10
DO12Not StartedInfinite10
EMIDo =120
CheckCH1Not StartedInfinite10
CH2StartedInfinite10
CH3StartedInfinite10
CH4Not StartedInfinite10
CH5StartedInfinite10
CH6StartedInfinite10
CH7StartedInfinite10
CH8StartedInfinite10
CH9StartedInfinite10
CH10StartedInfinite10
CH11Not StartedInfinite10
CH12StartedInfinite10
CH13Not StartedInfinite10
CH14StartedInfinite10
EMICheck =140
ActACT1Not StartedInfinite10
ACT2Not StartedInfinite10
ACT3Not StartedInfinite10
ACT4Not StartedInfinite10
ACT5Not StartedInfinite10
ACT6Not StartedInfinite10
ACT7Not StartedInfinite10
ACT8Not StartedInfinite10
ACT9Not StartedInfinite10
ACT10Not StartedInfinite10
EMIAct =100
Leadership and Worker
participation
L&WP1Not StartedInfinite10
L&WP2Not StartedInfinite10
L&WP3Not StartedInfinite10
L&WP4Not StartedInfinite10
L&WP5Not StartedInfinite10
L&WP6Not StartedInfinite10
L&WP7Started00
L&WP8Not StartedInfinite10
L&WP9Started00
L&WP10StartedInfinite10
L&WP11Started00
L&WP12Started00
L&WP13Started00
EMIL&WP =80
Table A15. CRFR and EMIFR of the Producer EMPr&Rq.
ConstructFRPractice StatusCREMIFR
DoDO1Started12.131.95
DO2Started4.783.00
DO3Started8.482.79
DO4Started2.673.87
DO5Started11.452.42
DO6Started10.332.08
DO7Started7.003.27
DO8Started10.462.58
DO9Started11.971.59
DO10Started11.022.50
DO11Started12.412.22
DO12Started0.118.70
EMIDo =39.96
CheckCH1Started13.382.16
CH2Started3.644.02
CH3Started8.571.61
CH4Started2.664.34
CH5StartedInfinite10.00
CH6Started1.785.10
CH7Started9.691.95
CH8Started7.943.00
CH9Started11.112.24
CH10Started21.831.67
CH11Started13.762.18
CH12Started10.392.61
CH13Started17.951.60
CH14Started17.301.23
EMICheck =43.72
ActACT1Started11.862.30
ACT2Started16.721.99
ACT3Started22.351.12
ACT4Started11.032.23
ACT5Started15.201.62
ACT6Started6.582.25
ACT7Started11.180.98
ACT8Started6.471.96
ACT9Started7.322.19
ACT10Started12.431.89
EMIAct =18.53
Leadership and Worker participationL&WP1Started9.682.14
L&WP2Started8.832.46
L&WP3Started5.513.38
L&WP4Started14.752.20
L&WP5Started8.661.15
L&WP6Started18.321.85
L&WP7Started17.351.66
L&WP8Started11.822.41
L&WP9Started20.450.90
L&WP10Started19.531.66
L&WP11Started20.961.64
L&WP12Started20.271.66
L&WP13Started25.490.90
EMIL&WP =24
Table A16. CRFR and EMIFR of the Customer EMPr&Rq.
ConstructFR Practice StatusCREMIFR
DoDO1Started5.000.00
DO2Started18.280.46
DO3Started4.861.25
DO4Started22.790.58
DO5Started32.281.26
DO6Started14.710.21
DO7Started25.031.64
DO8Started25.170.00
DO9Started16.130.35
DO10Started25.410.05
DO11Started25.040.45
DO12Started19.150.00
EMIDo =6.26
CheckCH1Started18.930.00
CH2Started24.090.06
CH3Started17.080.00
CH4Started25.000.00
CH5Started22.150.18
CH6Started29.060.00
CH7Started22.170.00
CH8Started20.620.00
CH9Started29.280.00
CH10Started26.300.00
CH11Started8.862.94
CH12Started10.481.52
CH13Started26.710.90
CH14Started32.710.06
EMICheck =5.67
ActACT1Started26.231.76
ACT2Started25.000.00
ACT3Started22.910.01
ACT4Started25.520.02
ACT5Started25.000.00
ACT6Started17.340.25
ACT7Started18.680.31
ACT8Started25.790.22
ACT9Started18.940.29
ACT10Started25.170.00
EMIAct =2.85
Leadership and Worker participationL&WP1Started12.180.30
L&WP2Started18.100.19
L&WP3Started20.150.20
L&WP4Started25.201.90
L&WP5Started22.140.35
L&WP6Started25.391.89
L&WP7Started31.991.56
L&WP8Started30.090.33
L&WP9Started5.530.85
L&WP10Started33.981.48
L&WP11Started29.231.28
L&WP12Started17.550.71
L&WP13Started23.230.31
EMIL&WP =11.36

References

  1. Blome, C.; Paulraj, A.; Schuetz, K. Supply Chain Collaboration and Sustainability: A Profile Deviation Analysis. Int. J. Oper. Prod. Manag. 2013, 34, 639–663. [Google Scholar] [CrossRef]
  2. Rodríguez, J.A.; Giménez Thomsen, C.; Arenas, D.; Pagell, M. NGOs’ Initiatives to Enhance Social Sustainability in the Supply Chain: Poverty Alleviation Through Supplier Development Programs. J. Supply Chain Manag. 2016, 52, 83–108. [Google Scholar] [CrossRef]
  3. Rocha, R.; Guarnieri, P.; Araújo dos Reis, S.; Carvalho, J.M.; Peña, C.R. The Social Dimension and Indicators of Sustainability in Agrifood Supply Chains. In Proceedings of the Operations Management for Social Good: 2018 POMS International Conference in Rio, Rio de Janeiro, Brazil, 10–12 October 2019; Volume 10, pp. 1476–1498. [Google Scholar] [CrossRef]
  4. Coyle, J.J.; Langley, C.J.; Gibson, B.J.; Novack, R.A.; Bardi, E.J. Supply Chain Management: A Logistics Perspective, 11th ed.; Cengage Learning: Boston, MA, USA, 2020; ISBN 978-0357442135. [Google Scholar]
  5. Jasiulewicz-Kaczmarek, M. The Role of Ergonomics in Implementation of the Social Aspect of Sustainability, Illustrated with the Example of Maintenance. In Occupational Safety and Hygiene—Proceedings of the International Symposium on Occupational Safety and Hygiene, SHO 2013; CRC Press: Boca Raton, FL, USA, 2013; pp. 47–52. [Google Scholar] [CrossRef]
  6. Hasanain, B. The Role of Ergonomic and Human Factors in Sustainable Manufacturing: A Review. Machines 2024, 12, 159. [Google Scholar] [CrossRef]
  7. Rodríguez-Gámez, I.F.; Maldonado-Macías, A.; Mrugalska, B.; Lagarda-Leyva, E.; Hernández-Arellano, J.L.; Rodríguez, Y. A New Ergonomics Management Model for Supply Chains. In Human Factors in Engineering: Manufacturing Systems, Automation, and Interactions; Mrugalska, B., Ahram, T., Karwowski, W., Eds.; Taylor & Francis: Boca Raton, FL, USA, 2023; pp. 1–28. ISBN 9781003383444. [Google Scholar]
  8. Carter, C.R.; Easton, P.L. Sustainable Supply Chain Management: Evolution and Future Directions. Int. J. Phys. Distrib. Logist. Manag. 2011, 41, 46–62. [Google Scholar] [CrossRef]
  9. Lu, R.X.A.; Lee, P.K.C.; Cheng, T.C.E. Socially Responsible Supplier Development: Construct Development and Measurement Validation. Int. J. Prod. Econ. 2012, 140, 160–167. [Google Scholar] [CrossRef]
  10. Haslam, R.; Waterson, P. Ergonomics and Sustainability. Ergonomics 2013, 56, 343–347. [Google Scholar] [CrossRef]
  11. Seuring, S. A Review of Modeling Approaches for Sustainable Supply Chain Management. Decis. Support. Syst. 2012, 54, 1513–1520. [Google Scholar] [CrossRef]
  12. Hasle, P.; Jensen, P.L. Ergonomics and Sustainability—Challenges from Global Supply Chains. Work 2012, 41, 3906–3913. [Google Scholar] [CrossRef]
  13. Korkulu, S.; Bóna, K. Ergonomics as a Social Component of Sustainable Lot-Sizing: A Review. Period. Polytech. Soc. Manag. Sci. 2019, 27, 1–8. [Google Scholar] [CrossRef]
  14. Barbosa-Póvoa, A.P.; da Silva, C.; Carvalho, A. Opportunities and Challenges in Sustainable Supply Chain: An Operations Research Perspective. Eur. J. Oper. Res. 2017, 268, 399–431. [Google Scholar] [CrossRef]
  15. Brandenburg, M.; Govindan, K.; Sarkis, J.; Seuring, S. Quantitative Models for Sustainable Supply Chain Management: Developments and Directions. Eur. J. Oper. Res. 2014, 233, 299–312. [Google Scholar] [CrossRef]
  16. Simões, M.; Carvalho, A.; de Freitas, C.L.; Barbósa-Póvoa, A. How to Assess Social Aspects in Supply Chains? In Computer Aided Chemical Engineering; Elsevier: Amsterdam, The Netherlands, 2014; Volume 34, pp. 801–806. [Google Scholar]
  17. Hong, J.; Zhang, Y.; Ding, M. Sustainable Supply Chain Management Practices, Supply Chain Dynamic Capabilities, and Enterprise Performance. J. Clean. Prod. 2018, 172, 3508–3519. [Google Scholar] [CrossRef]
  18. Cantor, D.E. Workplace Safety in the Supply Chain: A Review of the Literature and Call for Research. Int. J. Logist. Manag. 2008, 19, 65–83. [Google Scholar] [CrossRef]
  19. Perttula, P. Improving Occupational Safety in Logistics—Accident Risks of Heavy Vehicle Drivers and Material Transfers at Construction Sites; Finnish Institute of Occupational Health: Helsinki, Finland, 2011. [Google Scholar]
  20. Dekker, S.W.A.; Hancock, P.A.; Wilkin, P. Ergonomics and Sustainability: Towards an Embrace of Complexity and Emergence. Ergonomics 2013, 56, 357–364. [Google Scholar] [CrossRef]
  21. ISO 45001:2018; Occupational Health and Safety Management Systems—Requirements with Guidance for Use. International Organization for Standardization: Geneva, Switzerland, 2018. Available online: https://www.iso.org/obp/ui/#iso:std:iso:45001:ed-1:v1:en (accessed on 31 July 2022).
  22. Sinoimeri, D.; Teta, J. Systematic Literature Review of Supply Chain Management. Proc. Int. Conf. Bus. Manag. Econ. 2024, 1, 16–21. [Google Scholar] [CrossRef]
  23. Islam, M.D. A Survey on the Use of Blockchains to Achieve Supply Chain Security. Inf. Syst. 2023, 117, 102232. [Google Scholar] [CrossRef]
  24. Ahi, P.; Searcy, C. A Comparative Literature Analysis of Definitions for Green and Sustainable Supply Chain Management. J. Clean. Prod. 2013, 52, 329–341. [Google Scholar] [CrossRef]
  25. Ramos, T.B.; Caeiro, S.; Disterheft, A.; Mascarenhas, A.; Deutz, P.; Spangenberg, J.H.; Montaño, M.; Olayide, O.; Sohal, A. Rethinking Sustainability: Questioning Old Perspectives and Developing New Ones. J. Clean. Prod. 2020, 258, 120769. [Google Scholar] [CrossRef]
  26. World Commission on Environment and Development. Our Common Future; Oxford University Press: Oxford, UK, 1987. [Google Scholar]
  27. Purvis, B.; Mao, Y.; Robinson, D. Three Pillars of Sustainability: In Search of Conceptual Origins. Sustain. Sci. 2018, 5, 681–695. [Google Scholar] [CrossRef]
  28. Kosmopoulos, P. The Way Forward for Sustainable Development. In Planning and Management of Solar Power from Space; Academic Press: Cambridge, MA, USA, 2024; pp. 173–189. ISBN 978-0-12-823390-0. [Google Scholar]
  29. Muthu, S.S. Introduction to Sustainability and the Textile Supply Chain and Its Environmental Impact. In Assessing the Environmental Impact of Textiles and the Clothing Supply Chain; Woodhead Publishing: Cambridge, UK, 2020; pp. 1–32. ISBN 978-0-12-819783-7. [Google Scholar]
  30. Vos, R.O. Defining Sustainability: A Conceptual Orientation. J. Chem. Technol. Biotechnol. 2007, 82, 334–339. [Google Scholar] [CrossRef]
  31. Iyer, B. Cooperatives and the Sustainable Development Goals. In Waking the Asian Pacific Co-Operative Potential; Academic Press: Cambridge, MA, USA, 2020; pp. 59–70. [Google Scholar] [CrossRef]
  32. Lalla-Ruiz, E.; Heilig, L.; Voß, S. Environmental Sustainability in Ports. In Sustainable Transportation and Smart Logistics; Elsevier: Amsterdam, The Netherlands, 2019; pp. 65–89. [Google Scholar] [CrossRef]
  33. Pope, J.; Annandale, D.; Morrison-Saunders, A. Conceptualising Sustainability Assessment. Environ. Impact Assess. Rev. 2004, 24, 595–616. [Google Scholar] [CrossRef]
  34. Turker, D.; Ozdemir, G. Modeling Social Sustainability: Analysis of Hospitality e-Distributors. Sustain. Account. Manag. Policy J. 2020, 11, 799–824. [Google Scholar] [CrossRef]
  35. Weingaertner, C.; Moberg, Å. Exploring Social Sustainability: Learning from Perspectives on Urban Development and Companies and Products. Sustain. Dev. 2014, 22, 122–133. [Google Scholar] [CrossRef]
  36. Balaman, Ş.Y. Sustainability Issues in Biomass-Based Production Chains. In Decision-Making for Biomass-Based Production Chains; Elsevier: Amsterdam, The Netherlands, 2019; pp. 77–112. [Google Scholar]
  37. Meyer, F.; Eweje, G.; Tappin, D. Ergonomics as a Tool to Improve the Sustainability of the Workforce. Work 2017, 57, 339–350. [Google Scholar] [CrossRef]
  38. Hoque, I.; Shahinuzzaman, M. Task Performance and Occupational Health and Safety Management Systems in the Garment Industry of Bangladesh. Int. J. Workplace Health Manag. 2021, 14, 369–385. [Google Scholar] [CrossRef]
  39. Yanar, B.; Robson, L.S.; Tonima, S.K.; Amick, B.C. Understanding the Organizational Performance Metric, an Occupational Health and Safety Management Tool, through Workplace Case Studies. Int. J. Workplace Health Manag. 2020, 13, 117–138. [Google Scholar] [CrossRef]
  40. Mohammadfam, I.; Kamalinia, M.; Momeni, M.; Golmohammadi, R.; Hamidi, Y.; Soltanian, A. Evaluation of the Quality of Occupational Health and Safety Management Systems Based on Key Performance Indicators in Certified Organizations. Saf. Health Work 2017, 8, 156–161. [Google Scholar] [CrossRef]
  41. Campailla, C.; Martini, A.; Minini, F.; Sartor, M. Quality Management: Tools, Methods and Standards; Emerald Group Publishing: Leeds, UK, 2019; pp. 217–243. ISBN 9781787698017. [Google Scholar]
  42. Fahmi, K.; Mustofa, A.; Rochmad, I.; Sulastri, E.; Wahyuni, I.S.; Irwansyah, I. Effect of ISO 9001: 2015, ISO 14001: 2015 and ISO 45001: 2018 on operational performance of automotive industries. J. Ind. Eng. Manag. Res. 2021, 2, 13–25. [Google Scholar]
  43. Darabont, D.C.; Bejinariu, C.; Baciu, C.; Bernevig-Sava, M.A. Modern Approaches in Integrated Management Systems of Quality, Environmental and Occupational Health and Safety. Calitatea 2019, 20, 105. [Google Scholar]
  44. Haas, E.J.; Yorio, P.L. Exploring the Differences in Safety Climate Among Mining Sectors. Min. Metall. Explor. 2021, 38, 655–668. [Google Scholar] [CrossRef]
  45. Rostykus, W.; Ip, W.; Dustin, J.A. Managing Ergonomics: Applying ISO 45001 as a Model. Prof. Saf. 2016, 61, 34–42. [Google Scholar]
  46. Fernandes, P.R.; Hurtado, A.L.B.; Batiz, E.C. Ergonomics Management with a Proactive Focus. Procedia Manuf. 2015, 3, 4509–4516. [Google Scholar] [CrossRef]
  47. Rodríguez-Gámez, I.F.; Maldonado-macías, A.A.; Lagarda-Leyva, E.A.; Hernández-Arellano, J.L.; Rodríguez, Y. A Continuous Improvement Instrument for the Evaluation of the Ergonomics Management System in the Supply Chain. Heliyon 2024, 10, e40956. [Google Scholar] [CrossRef] [PubMed]
  48. Suh, N.P. Application of Axiomatic Design to Engineernig Collaboration and Negotiation. In Proceedings of the 4th International Conference on Axiomatic Design, Florence, Italy, 13–16 June 2006; pp. 1–11. [Google Scholar]
  49. Maldonado-Macías, A.A.; Balderrama Armendáriz, C.O.; Predrozo Escobedo, J.; García Alcaraz, J.L. Diseño Axiomático: Libro de Fundamentos y Aplicaciones; Diseño, U., Ed.; Universidad de La Rioja, Servicio de Publicaciones: Logroño, Spain, 2019; ISBN 978-84-09-10076-7. [Google Scholar]
  50. Suh, N.P. Axiomatic Design. Advances and Applications, 1st ed.; Oxford University Press: New York, NY, USA, 2001. [Google Scholar]
  51. Suh, N.P. The Principles of Design; Oxford University Press: Oxford, UK, 1990; ISBN 9780195043457. [Google Scholar]
  52. Kulak, O.; Kahraman, C. Multi-Attribute Comparison of Advanced Manufacturing Systems Using Fuzzy vs. Crisp Axiomatic Design Approach. Int. J. Prod. Econ. 2005, 95, 415–424. [Google Scholar] [CrossRef]
  53. Kulak, O.; Kahraman, C.; Öztayşi, B.; Tanyaş, M. Multi-Attribute Information Technology Project Selection Using Fuzzy Axiomatic Design. J. Enterp. Inf. Manag. 2005, 18, 275–288. [Google Scholar] [CrossRef]
  54. Suh, N.P. Axiomatic Design Theory for Systems. Res. Eng. Des. Theory Appl. Concurr. Eng. 1998, 10, 189–209. [Google Scholar] [CrossRef]
  55. Neves, J.C.B.; Vidal, M.C.R.; de Carvalho, P.V.R. Ergonomics Management Model Based on Good Practices of Large Industrial Companies: Structured Elements Through the Fuzzy Set Theory. Work 2023, 76, 803–820. [Google Scholar] [CrossRef]
  56. Zeinalnezhad, M.; Sepehri, F.; Haji Molana, M.; Pourrostam, T.; Gholamzadeh Chofreh, A.; Jaromír Klemeš Feybi Ariani Goni, J. Identification of Performance Evaluation Indicators for Health, Safety, Environment, and Ergonomics Management Systems. Chem. Eng. Trans. 2018, 67, 451–456. [Google Scholar]
  57. Rezvanizadeh, M.; Mohammad-Ghasemi, M.; Soltanzadeh, A.; Sadeghi-Yarandi, M. Development of an Ergonomics Management Model in the Workplace: Introduction of the TUGA Ergonomics Management and Analysis Model (TEMA). Work 2023, 76, 205–224. [Google Scholar] [CrossRef]
  58. Abdel-Basset, M.; Mohamed, M.; Mostafa, N.N.; El-Henawy, I.M.; Abouhawwash, M. New Multi-Criteria Decision-Making Technique Based on Neutrosophic Axiomatic Design. Sci. Rep. 2022, 12, 10657. [Google Scholar] [CrossRef]
Figure 1. ISO standard in the PDCA cycle for HSMS. Note: the numbers given in brackets refer to the clause numbers in ISO 45001:2018 occupational health and safety management systems. Available at https://www.iso.org/obp/ui/#iso:std:iso:45001:ed-1:v1:en (accessed on 31 July 2022) [21].
Sustainability 17 05458 g001
Figure 2. Domains of the design world.
Sustainability 17 05458 g002
Figure 3. DR, SR, CR, and probability density of FR.
Sustainability 17 05458 g003
Figure 4. Methodology for the development of the EMEM of the SC.
Sustainability 17 05458 g004
Figure 5. Zigzagging process to decompose FRs and DPs.
Sustainability 17 05458 g005
Figure 7. Ergonomics management index hierarchy.
Sustainability 17 05458 g007
Figure 8. Supply chain ergonomics management level scale.
Sustainability 17 05458 g008
Figure 9. Ergonomics management evaluation model procedure.
Sustainability 17 05458 g009
Figure 10. Internal supply chain.
Sustainability 17 05458 g010
Figure 11. External supply chain.
Sustainability 17 05458 g011
Figure 12. Decomposition of the hierarchies of the FRs of the EMEM for SC.
Sustainability 17 05458 g012
Figure 13. Zigzagging process between the FRs and PDs of the EMEM.
Sustainability 17 05458 g013
Figure 14. Ergonomics management evaluation model of the supply chain.
Sustainability 17 05458 g014
Figure 15. ISC for salt in a bag product.
Sustainability 17 05458 g015
Figure 16. Common range of FR1.1.1.
Sustainability 17 05458 g016
Figure 17. Common range of FR3.1.1.
Sustainability 17 05458 g017
Table 1. Ergonomics management system constructs and domains PDCA.
PDCA
Cycle
ISO 45001:2018 Occupational Health And Safety Management Systems—Requirements With Guidance For Use
ConstructsDomains
5 Leadership
and Worker
participation
5.1 Leadership and Commitment
5.2 Policy
5.3 Organization roles, responsibilities, and authorities
5.4 Consultation and participation of workers
Plan6 Planning6.1 Actions to address risks and opportunities
6.2 Objectives and planning to achieve them
Do7 Support7.1 Resources
7.2 Competence
7.3 Awareness
7.4 Communication
7.5 Documented information
8 Operation8.1 Operational planning and control
8.2 Emergency preparedness and response
Check9 Performance evaluation9.1 Monitoring, measurement, analysis, and evaluation
9.2 Internal Audit
9.3 Management review
Act10 Improvement10.1 General
10.2 Incident, nonconformity, and corrective action
10.3 Continual improvement
Table 2. FRs, DPs, and PVs of the EMEM of the SC.
Functionals RequirementsDesign ParametersProcess Variables
Initial level
FR0Design the EMEM of the SCDP0Implementation of the EMEM of the SCPV0Evaluation procedure of the EMEM of the SC
First level
FR1Evaluate the EM of the supplier linkDP1Implementation of the self-assessment for the supplier linkPV1Supplier link assessment procedure of the SC
FR2Evaluate the EM of the producer linkDP2Implementation of the self-assessment for the producer linkPV2Producer link assessment procedure of the SC
FR3Evaluate the EM of the customer linkDP3Implementation of the self-assessment for the customer linkPV3Customer link assessment procedure of the SC
Second level
FR1.1Evaluate the EM Plan of the supplier link.DP1.1Implementation of the evaluation model to Plan the EM of each link.PV1.1Evaluation procedure of (Plan, Do, Check, Act and Leadership and Worker participation) constructs of the EM of each link.
FR1.2Evaluate the EM Do of the supplier link.DP1.2Implementation of the evaluation model to Do the EM of each link.PV1.2
FR1.3Evaluate the EM Check of the supplier link.DP1.3Implementation of the evaluation model to Check the EM of each link.PV1.3
FR1.4Evaluate the EM Act of the supplier link.DP1.4Implementation of the evaluation model to Act the EM of each link.PV1.4
FR1.5Evaluate the EM L&WP of the supplier link.DP1.5Implementation of the evaluation model to L&WP the EM of each link.PV1.5
Third level of EM Plan
FR1.1.1Answer the statement to assess compliance on whether up-to-date and documented ergonomics objectives are in place (PL1).DP1.1.1Implementation of the EM Plan self-assessment on compliance, if updated and documented ergonomics objectives, are in place. PV1.1.1The evaluation procedure involves obtaining the DS, SR, CR, and EMI of compliance with FR1.1.1 of each link’s EM.
FR1.1.2Answer the statement to assess compliance on whether it is determined how the objectives of the EM will be met (PL2).DP1.1.2Implementation of the EM Plan self-assessment on compliance if it is determined how the EM objectives will be met.PV1.1.2The evaluation procedure involves obtaining the DS, SR, CR, and EMI of compliance with FR1.1.2 of each link’s EM.
FR1.1.10Answer the statement to assess compliance with whether internal factors such as objectives, policies, and strategies on resources and working conditions, organizational culture, existing rules, guidelines, and/or contracts are considered in the planning of the EM (PL10).DP1.1.10Implementation of the EM Plan self-assessment on compliance if internal factors such as objectives, policies, and strategies on resources and working conditions, organizational culture, existing rules, guidelines, and/or contracts are considered in the MS planning.PV1.1.10The evaluation procedure involves obtaining the DS, SR, CR, and EMI of compliance with FR1.1.10 of each link’s EM.
Table 3. Design ranges of the Plan construct for each FR.
FRAverage ( x ¯ m d p )Std Dev.XDRupperXDRlowDR
PL183.214.097.369.228.1
PL282.912.195.070.924.1
PL384.712.296.972.524.5
PL481.811.293.070.622.4
PL580.614.695.266.029.2
PL680.016.196.163.932.3
PL781.812.294.069.524.5
PL890.413.0103.477.526.0
PL986.010.996.975.221.7
PL1084.615.099.669.630.0
Table 4. Sample size of ISC positions.
Participants (PCPs)Sample
SupplierProducerCustomer
1. Purchasing Manager1. Manager of Salina1. Production Manager1. Logistic Manager
1. Purchasing supervisor1. Salina Supervisor3. Production Supervisor1. Coordinator
1. Head of Safety 2. Supervisors
1. Safety Supervisor
226414
Table 5. Compliance Percentage of the EMPr&Rq of the Plan construct.
LinkPCPs+Compliance Percentage with the FRs (Items) of the
Plan Construct
PL1PL2PL3PL4PL5PL6PL7PL8PL9PL10
Supplier10000000000
210101005105000
Producer1005000090858070
220202070704075306050
325304045403065706560
440707075403880658070
500100500905030
630302050504060705060
770707070807070707070
875959090759090959090
Customer180808085858090808085
2505050100100100100100100100
380808080806060806080
470707070707090908095
Note: PCPs Participants.
Table 6. SR of the FRs of the Plan construct for the three social links of the SC.
VariablesSupplier
FR1.1.1
Producer
FR2.1.1
Customer
FR3.1.1
x ¯ c p = 0 + 10 2
5
0 + 20 + 25 + 40 + 0 + 30 + 70 + 75 8
32.50
80 + 50 + 80 + 70 4
70
s = 7.0728.2814.14
X S R u p p e r = 12.0760.7887.14
X S R l o w = −2.074.2255.86
S R = 14.156.628.3
Table 7. SR for each FR of the three-linked Plan construct.
Supplier System RangeProducer System RangeCustomer System Range
FR x ¯ c p Std Dev.XSRupperXSRlowSR x ¯ p c Std Dev.XSRupperXSlowSR x ¯ p c Std Dev.XSRupperXSlowSR
PL15.07.112.1−2.114.132.528.360.84.256.670.014.184.155.928.3
PL25.07.112.1−2.114.139.435.174.54.370.270.014.184.155.928.3
PL35.07.112.1−2.114.146.328.875.017.557.570.014.184.155.928.3
PL40.037.237.2−37.274.450.033.983.916.167.883.812.596.371.325.0
PL52.53.56.0−1.07.145.030.475.414.660.783.812.596.371.325.0
PL65.07.112.1−2.114.138.530.969.47.661.877.517.194.660.434.2
PL72.53.56.0−1.07.166.328.995.137.457.885.017.3102.367.734.6
PL80.032.832.8−32.865.571.920.292.051.740.387.59.697.177.919.1
PL90.029.829.8−29.859.768.114.682.753.529.280.016.396.363.732.7
PL100.031.931.9−31.963.862.517.580.045.035.190.09.199.180.918.3
Table 8. CR of Supplier practices and requirements for the Plan construct.
SupplierProducerCustomer
FROverlapPract StatCaseCRFROverlapPract StatCaseCRFROverlapPract StatCaseCR
FR1.1.1NoS4InfiniteFR2.1.1NoS4InfiniteFR3.1.1Yes S214.93
FR1.1.2NoS4InfiniteFR2.1.2YesS23.60FR3.1.2YesS213.27
FR1.1.3NoS4InfiniteFR2.1.3YesS22.54FR3.1.3YesS211.68
FR1.1.4NoNS4InfiniteFR2.1.4YesS213.35FR3.1.4YesS121.72
FR1.1.5NoS4InfiniteFR2.1.5YesS29.37FR3.1.5YesS123.94
FR1.1.6NoS4InfiniteFR2.1.6YesS25.55FR3.1.6YesS230.72
FR1.1.7NoS4InfiniteFR2.1.7YesS624.48FR3.1.7YesS624.48
FR1.1.8NoNS4InfiniteFR2.1.8YesS214.59FR3.1.8YesS719.15
FR1.1.9NoNS4InfiniteFR2.1.9YesS27.57FR3.1.9YesS221.16
FR1.1.10NoNS4InfiniteFR2.1.10YesS210.46FR3.1.10YesS718.26
Note: Stared (S), Not Stared (NS), Practice Status (Pract Stat).
Table 9. EMIFR of the EMPr&Rq for each link in the Plan construct.
SupplierProducerCustomer
FR CRSREMIFRFRCRSREMIFRFRCRSREMIFR
FR1.1.1Infinite14.110FR2.1.1Infinite56.610FR3.1.114.9328.30.92
FR1.1.2Infinite14.110FR2.1.23.6070.24.28FR3.1.213.2728.31.09
FR1.1.3Infinite14.110FR2.1.32.5457.54.49FR3.1.311.6828.31.27
FR1.1.4Infinite74.410FR2.1.413.3567.82.34FR3.1.421.7225.00.00
FR1.1.5Infinite7.110FR2.1.59.3760.72.69FR3.1.523.9425.00.00
FR1.1.6Infinite14.110FR2.1.65.5561.83.47FR3.1.630.7234.20.15
FR1.1.7Infinite7.110FR2.1.724.4857.81.23FR3.1.724.4834.60.00
FR1.1.8Infinite65.510FR2.1.814.5940.31.46FR3.1.819.1519.10.00
FR1.1.9Infinite59.710FR2.1.97.5729.21.94FR3.1.921.1632.70.62
FR1.1.10Infinite63.810FR2.1.1010.4635.11.74FR3.1.1018.2618.30.00
EMIPlan =100 EMIPlan =33.64 EMIPlan =4.05
Table 10. EMIs per construct of the salt in a bag product ISC links.
EMI for
Constructs
SupplierProducer CustomerHighest Score
EMIPlan10033.644.05100
EMIDo12036.965.64120
EMICheck14043.728.83140
EMIAct10018.531.99100
EMIL&WP80248.12130
Note: L&WP (Leadership and Worker participation).
Table 11. EMIs per link of the ISC of salt in a bag product.
EMISupplierEMIProducerEMICustomer
E M I S u p p l i e r = 100 + 120 + 140 + 100 + 80 E M I P r o d u c e r = 33.64 + 39.93 + 43.72 + 18.53 + 24 E M I C u s t o m e r = 4.05 + 5.64 + 8.83 + 1.99 + 8.12
E M I S u p p l i e r = 540 E M I P r o d u c e r = 156.85 E M I C u s t o m e r = 28.63
Table 12. EMISC salt in a bag product.
EMISupplierEMIProducerEMICustomerTotal
EMISC =540+156.85+28.63=726.07
Disclaimer/Publisher’s Note: The statements, opinions and data contained in all publications are solely those of the individual author(s) and contributor(s) and not of MDPI and/or the editor(s). MDPI and/or the editor(s) disclaim responsibility for any injury to people or property resulting from any ideas, methods, instructions or products referred to in the content.

