
Predicting Prices of Staple Crops Using Machine Learning: A Systematic Review of Studies on Wheat, Corn, and Rice

 ,
,  ,
,  ,
,  and
and
Abstract
1. Introduction
- i.
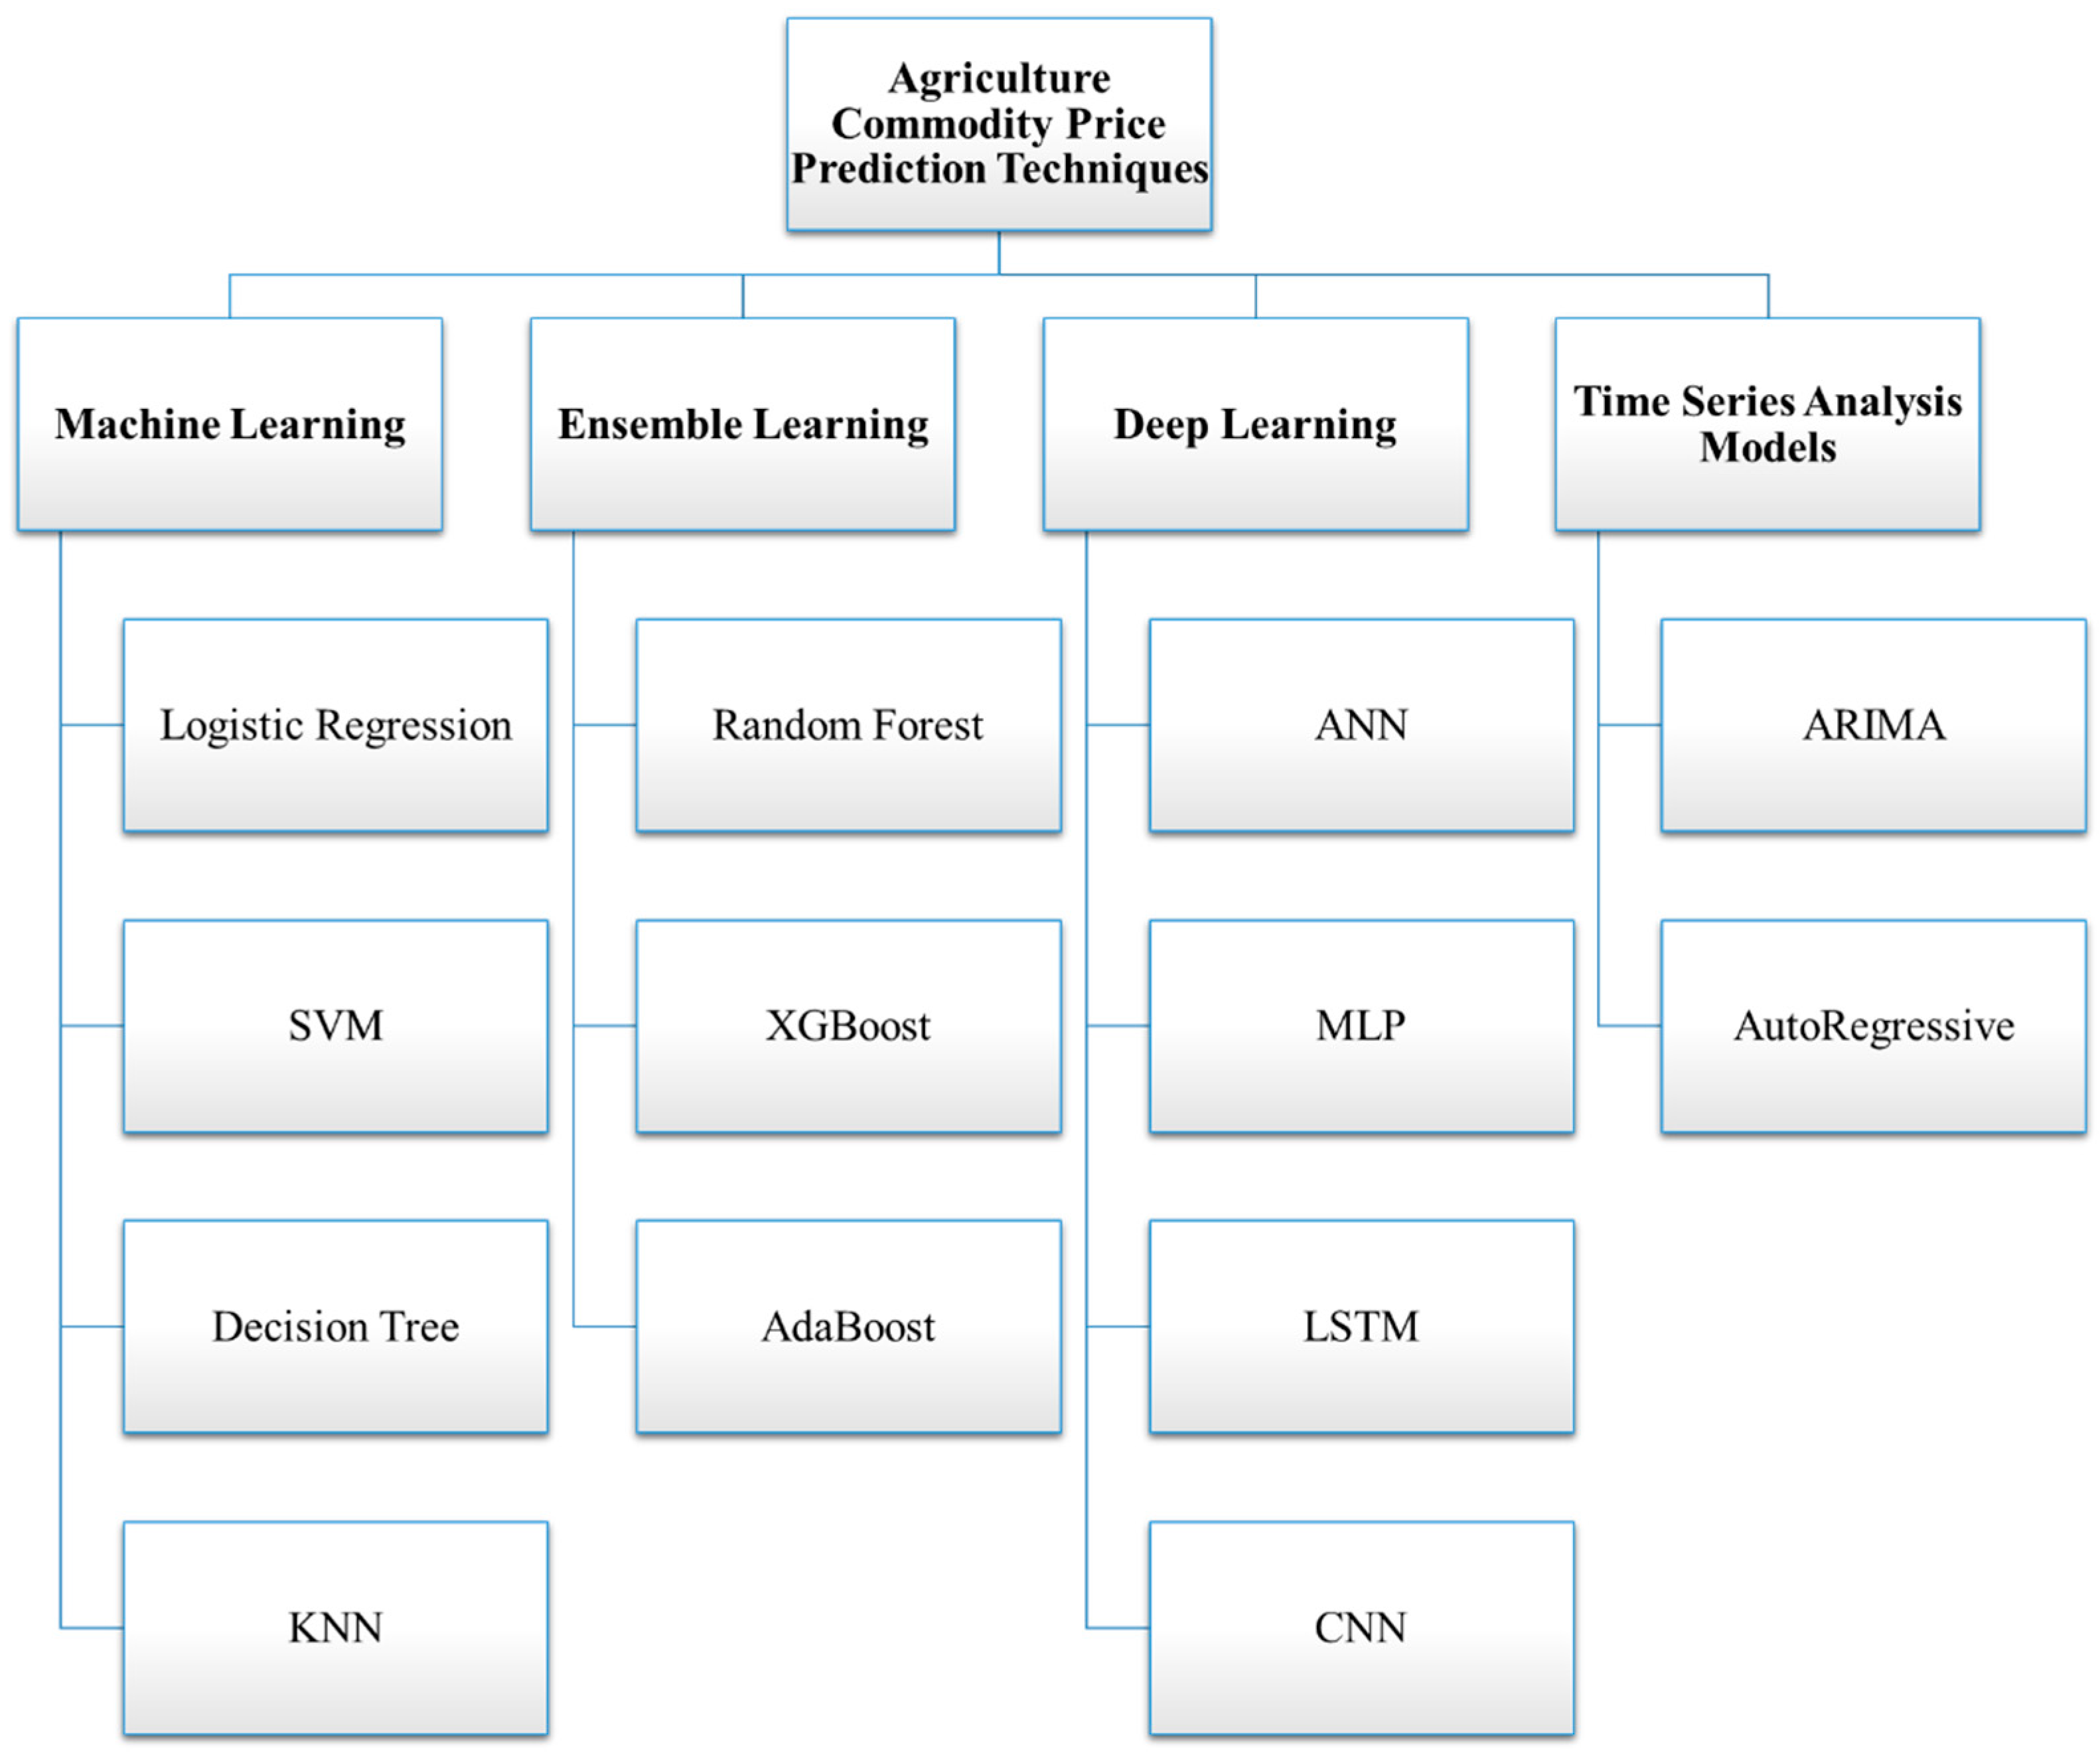
- This study provides a comprehensive analysis of common machine learning, ensemble learning, deep learning, and time series techniques used in agricultural commodity price prediction.
- ii.
- It offers insights into the unique prediction requirements of agricultural commodities forecasting.
- iii.
- This study investigates key challenges and limitations in agricultural price forecasting, including data availability, model interpretability, and computational complexity.
2. Research Methodology
2.1. Research Questions and Research Objectives
2.2. Search Strategy
- Language: English
- Document type: Journal articles only
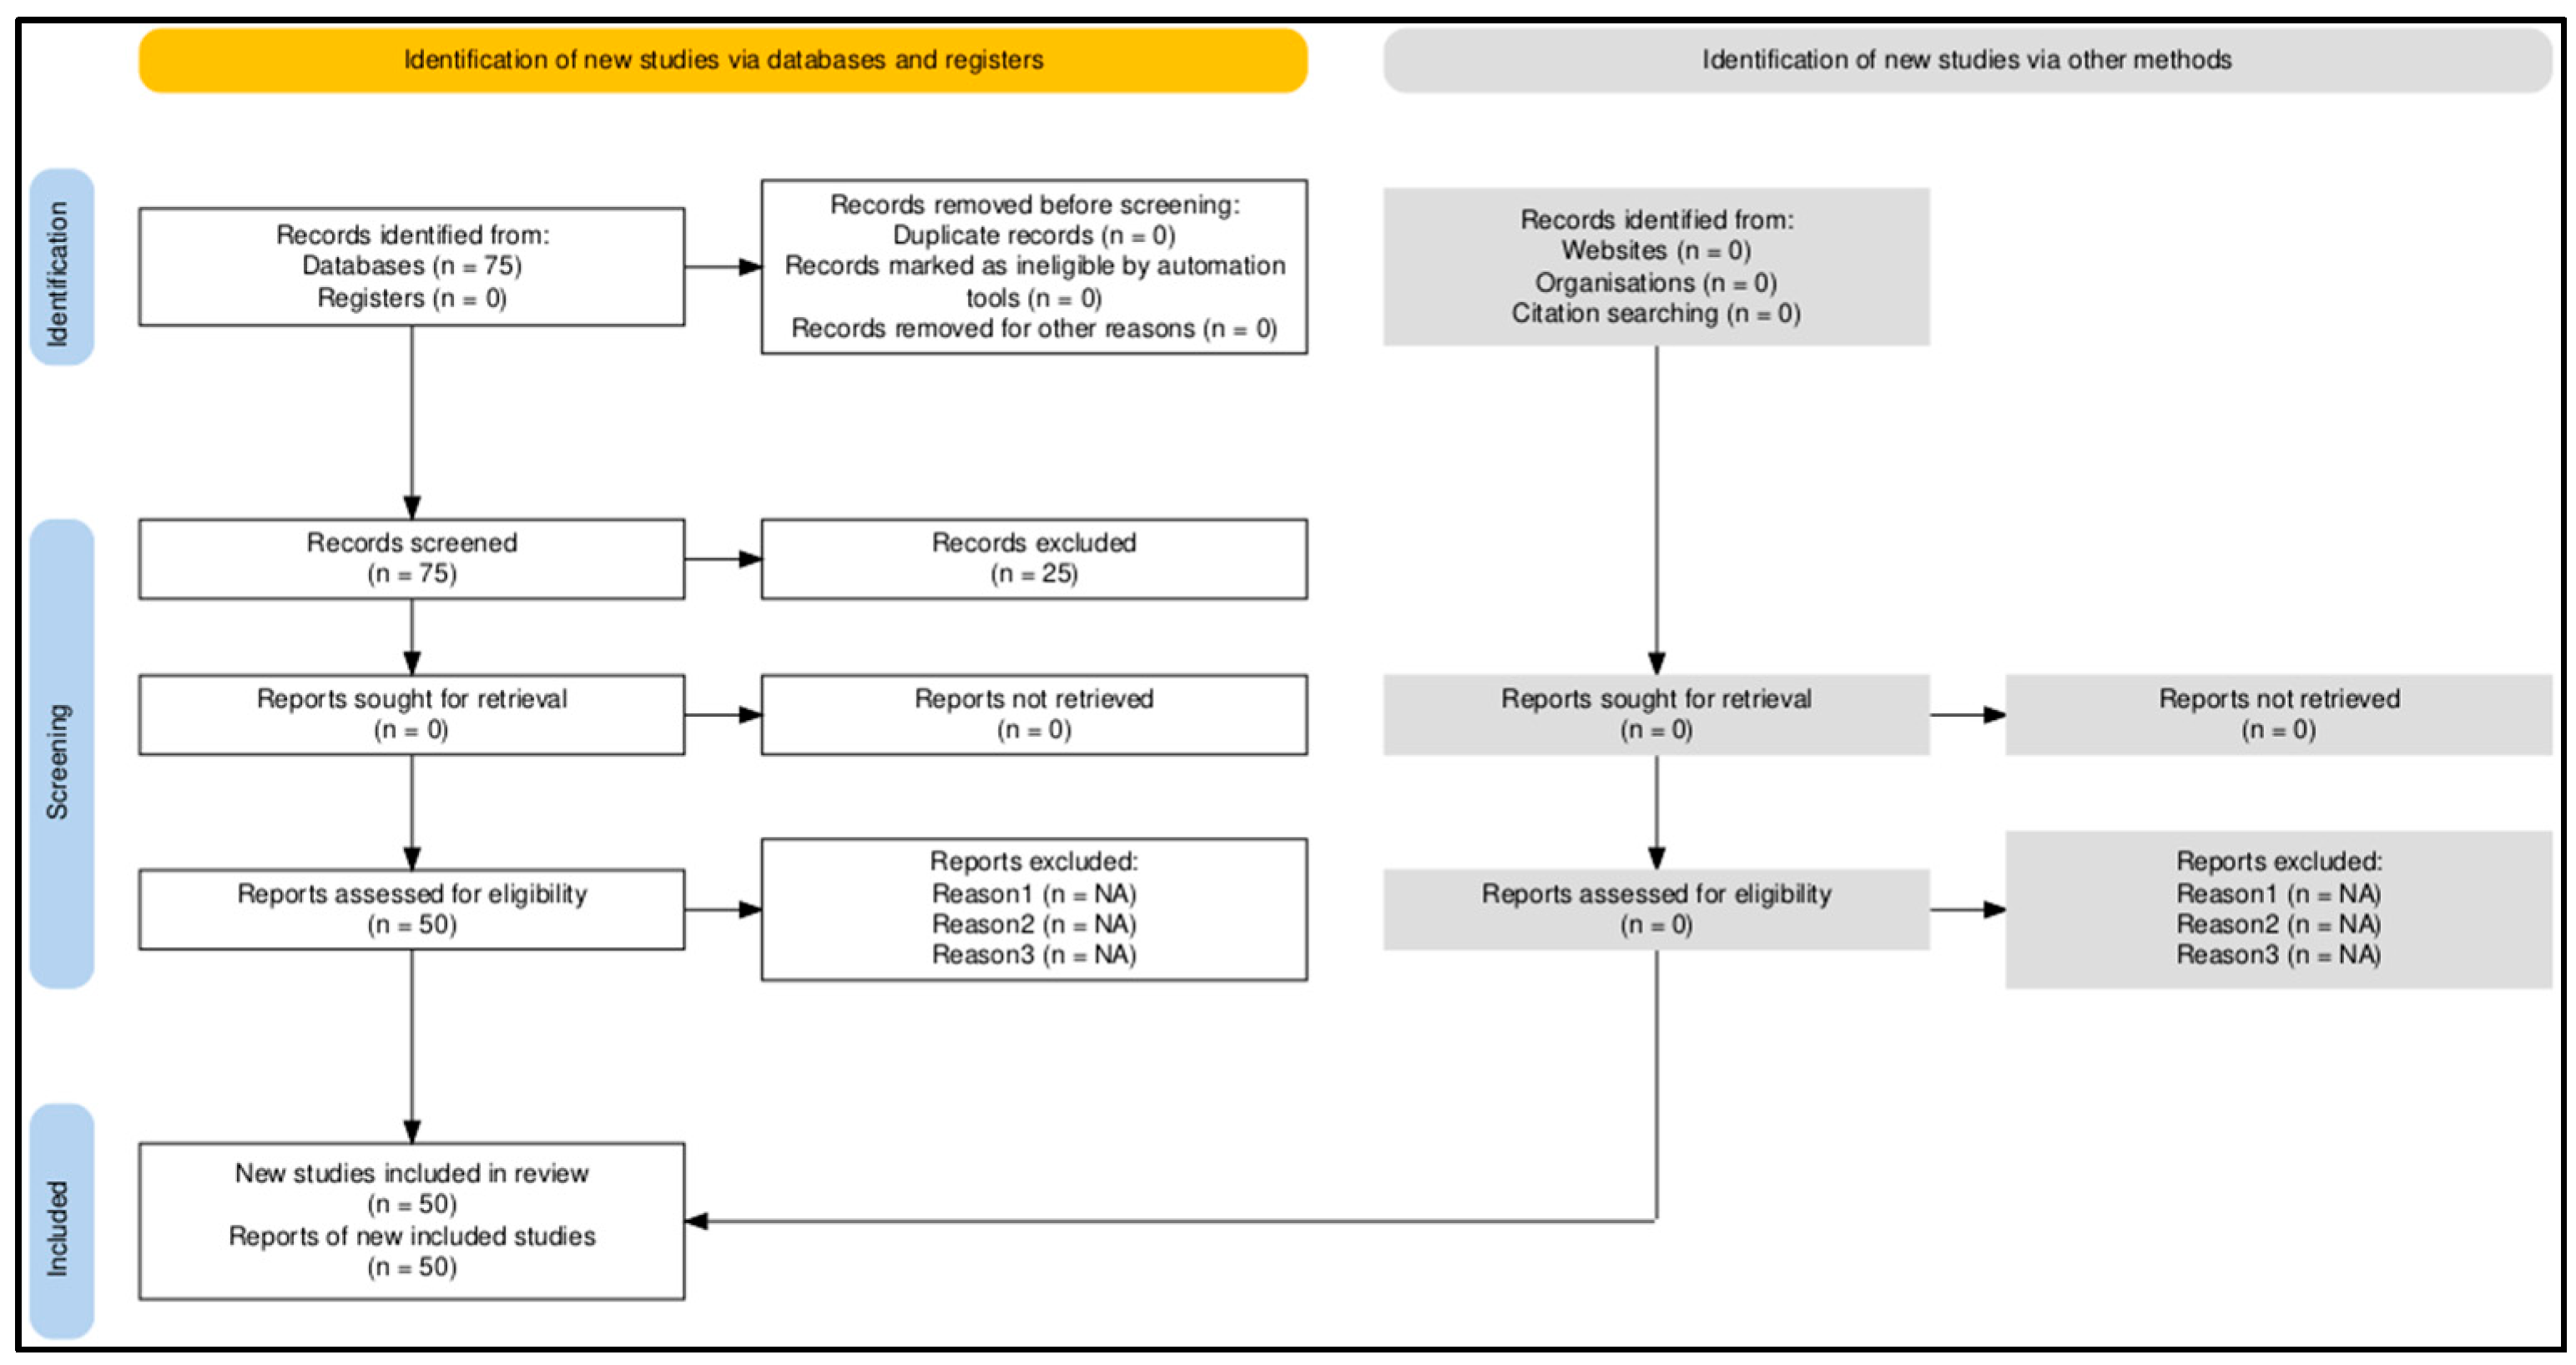
2.3. Study Selection
- Title Screening. Articles with titles clearly unrelated to price prediction or machine learning were excluded.
- Abstract Screening. The remaining articles were reviewed at the abstract level to assess their relevance to agricultural price forecasting using machine learning methods. Papers that did not meet the core focus were excluded at this stage.
- Full-Text Review. Full texts of the remaining articles were reviewed in detail to ensure alignment with the inclusion criteria and overall objectives of the review. Only studies with a direct focus on forecasting the prices of wheat, corn, or rice using machine learning or time series techniques were retained.

| Criteria | Inclusion | Exclusion |
|---|---|---|
| Study Type | Peer-reviewed journal articles indexed in Scopus | Non-peer-reviewed articles, editorials, opinion pieces, gray literature, conference papers |
| Commodity Focus | Studies focusing on agricultural commodities: wheat, corn (maize), or rice (paddy) | Studies on non-agricultural commodities (e.g., metals, energy) or financial markets |
| Techniques | Studies using machine learning, deep learning, time series models, or hybrid forecasting methods | Studies using only traditional statistical methods (e.g., simple regression) or no forecasting |
| Focus on Price Prediction | Studies explicitly focused on price forecasting or prediction | Studies focused on unrelated topics (e.g., yield, soil, climate) without price prediction |
| Language | Published in English | Published in other languages |
| Indexing | Indexed in Scopus | Not indexed in Scopus |
3. Analysis of Original Research Articles
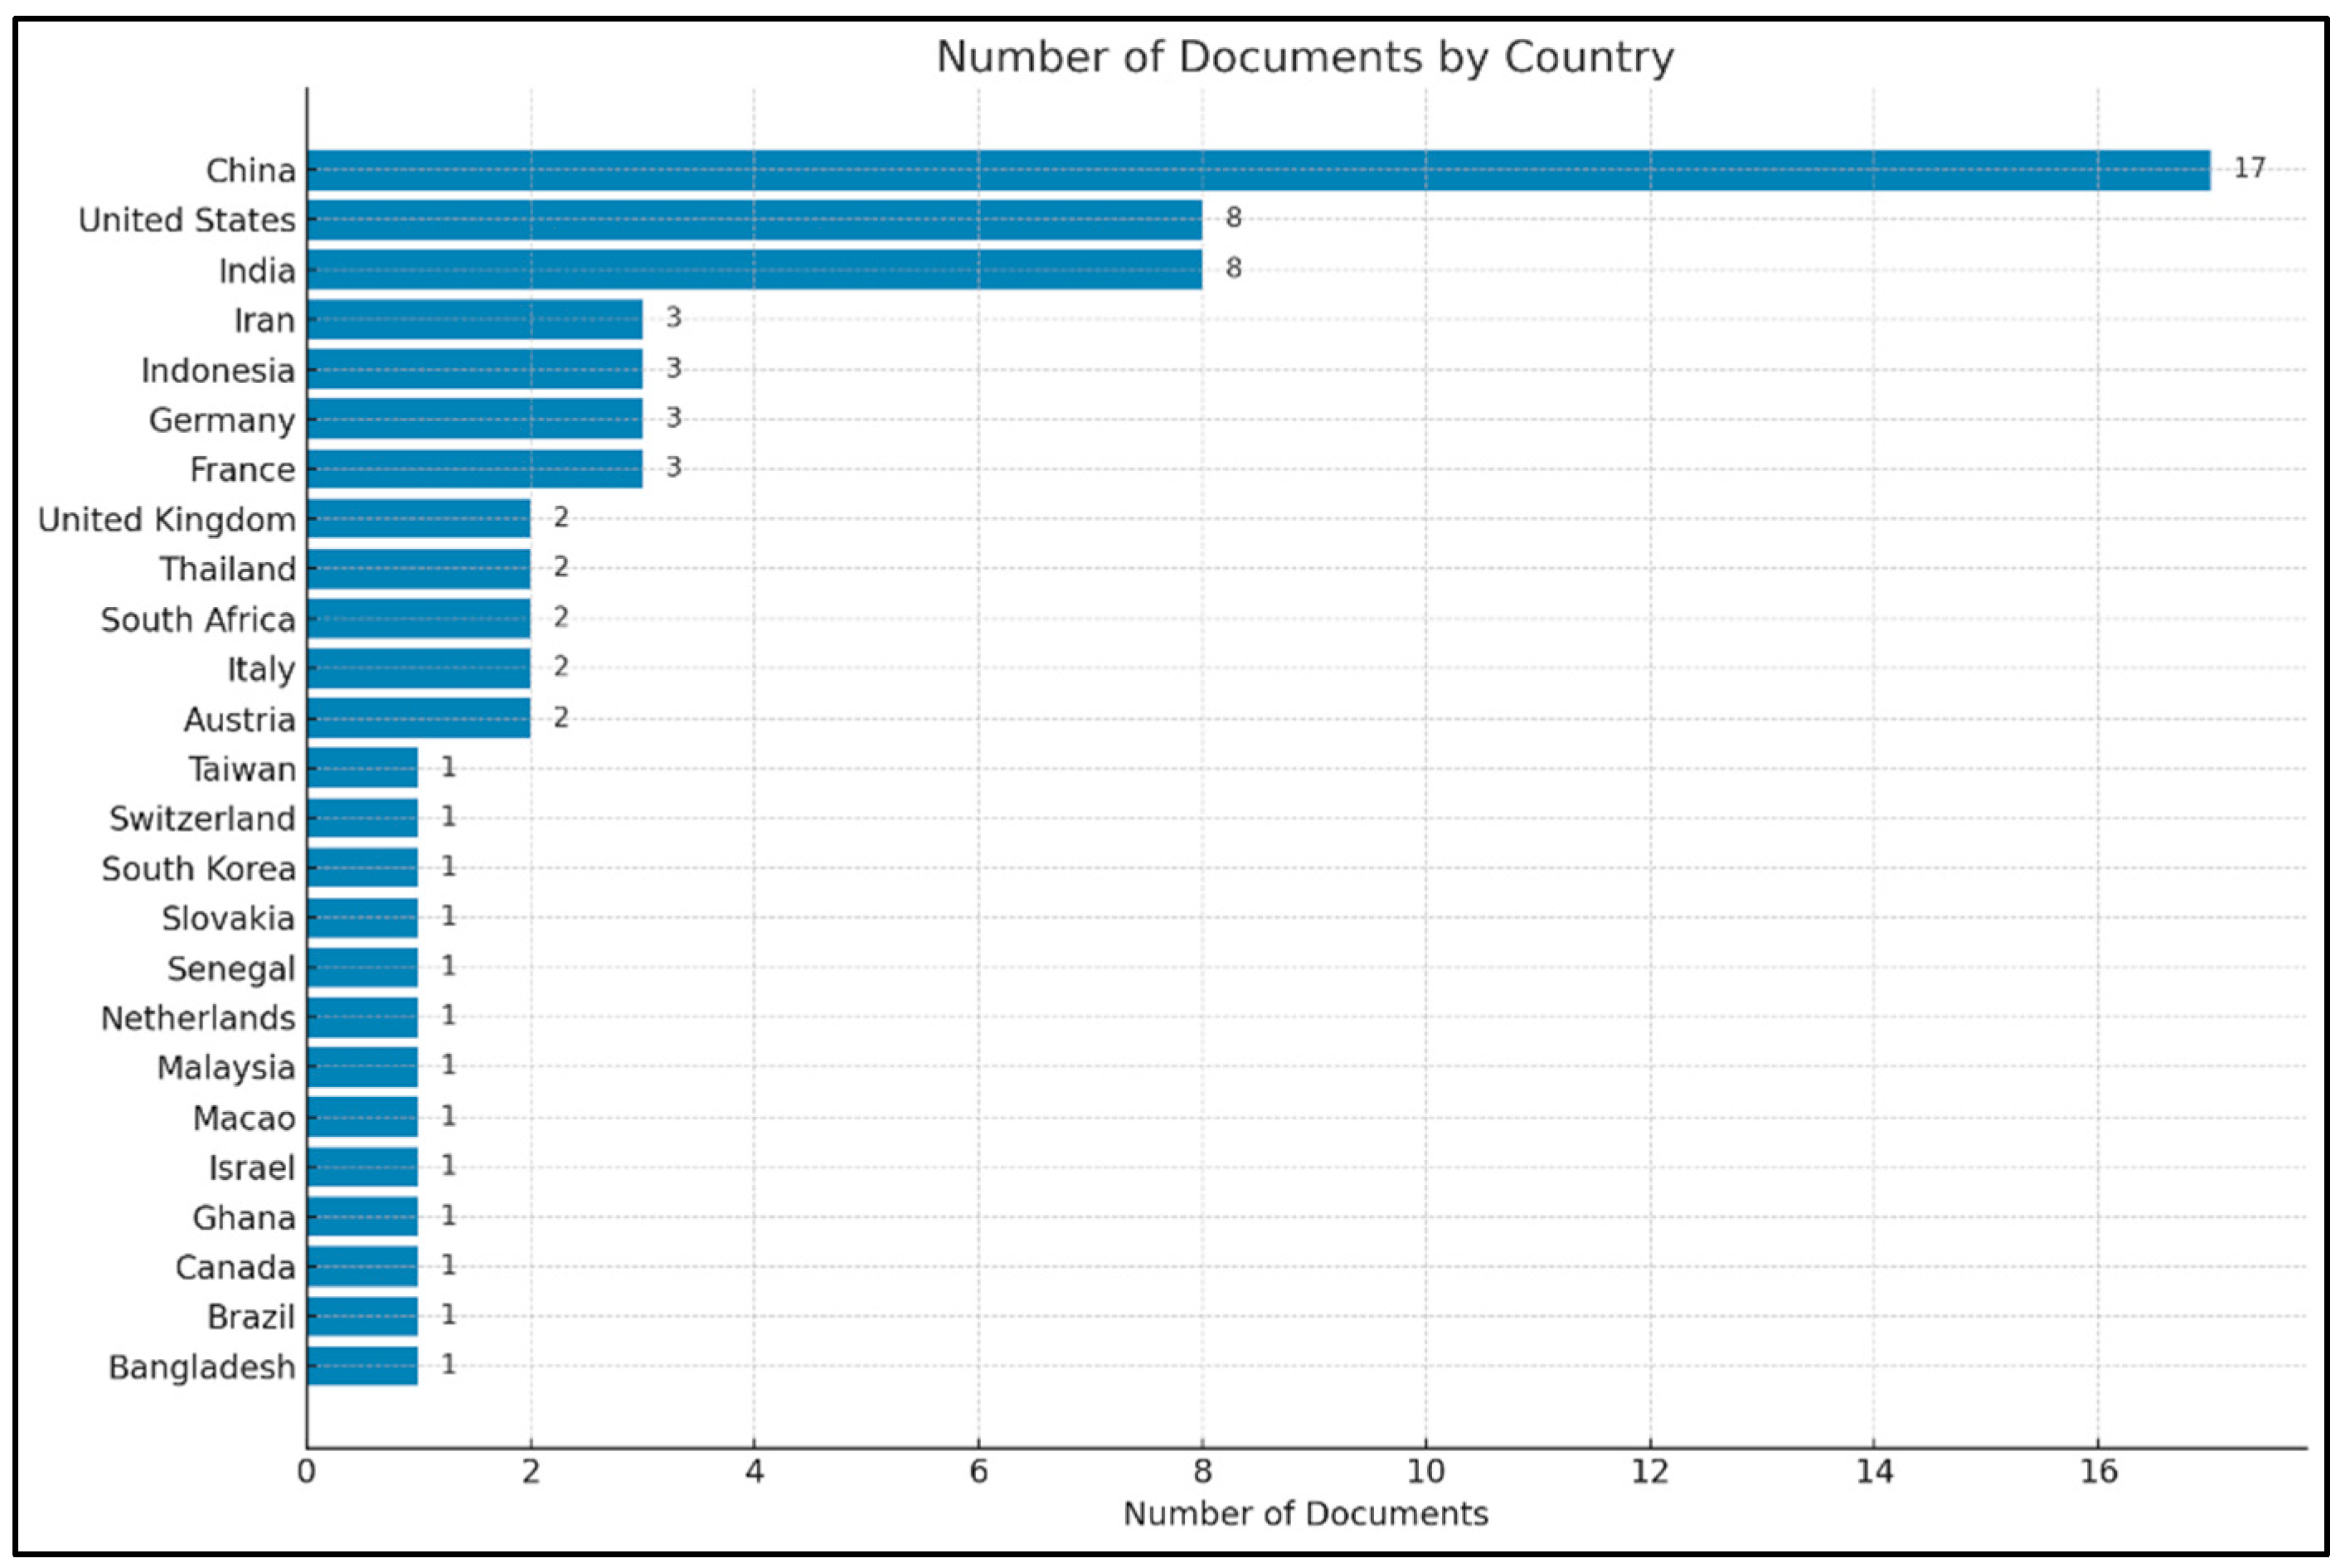
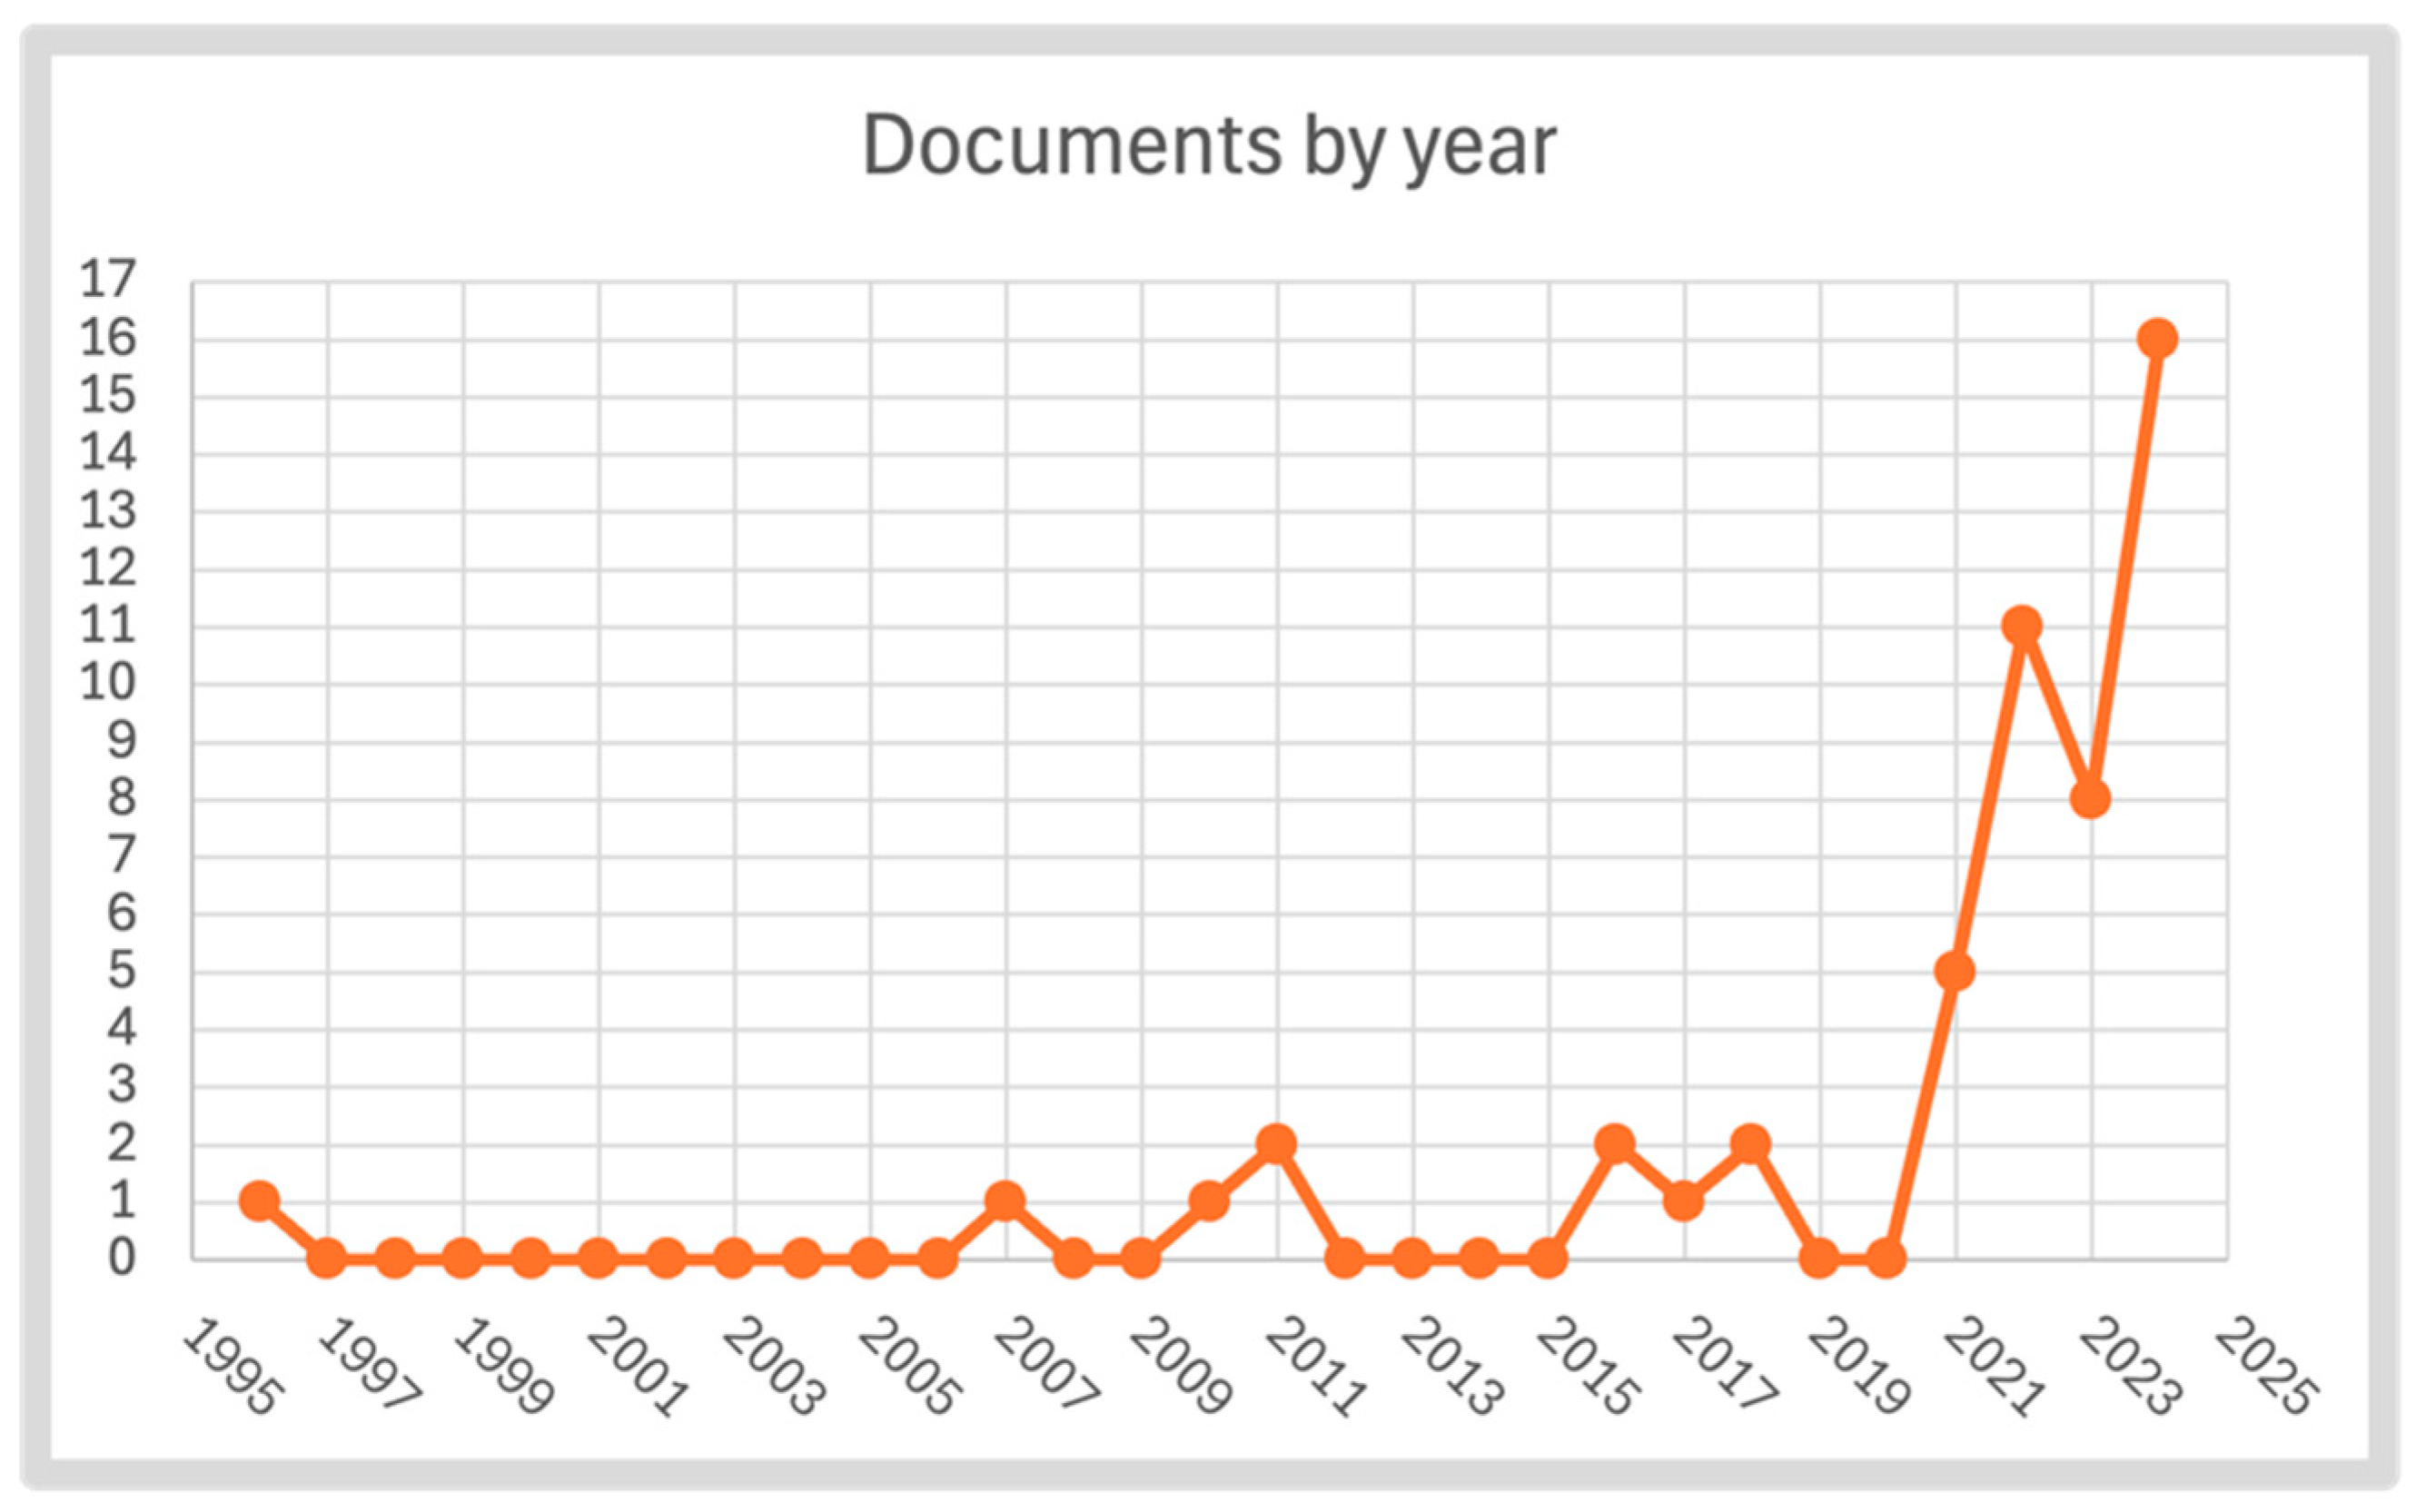
3.1. Descriptive Analysis of the Selected Studies
3.2. Machine Learning Techniques
3.3. Ensemble Learning Techniques
3.4. Deep Learning
3.5. Time Series Models
4. Discussion
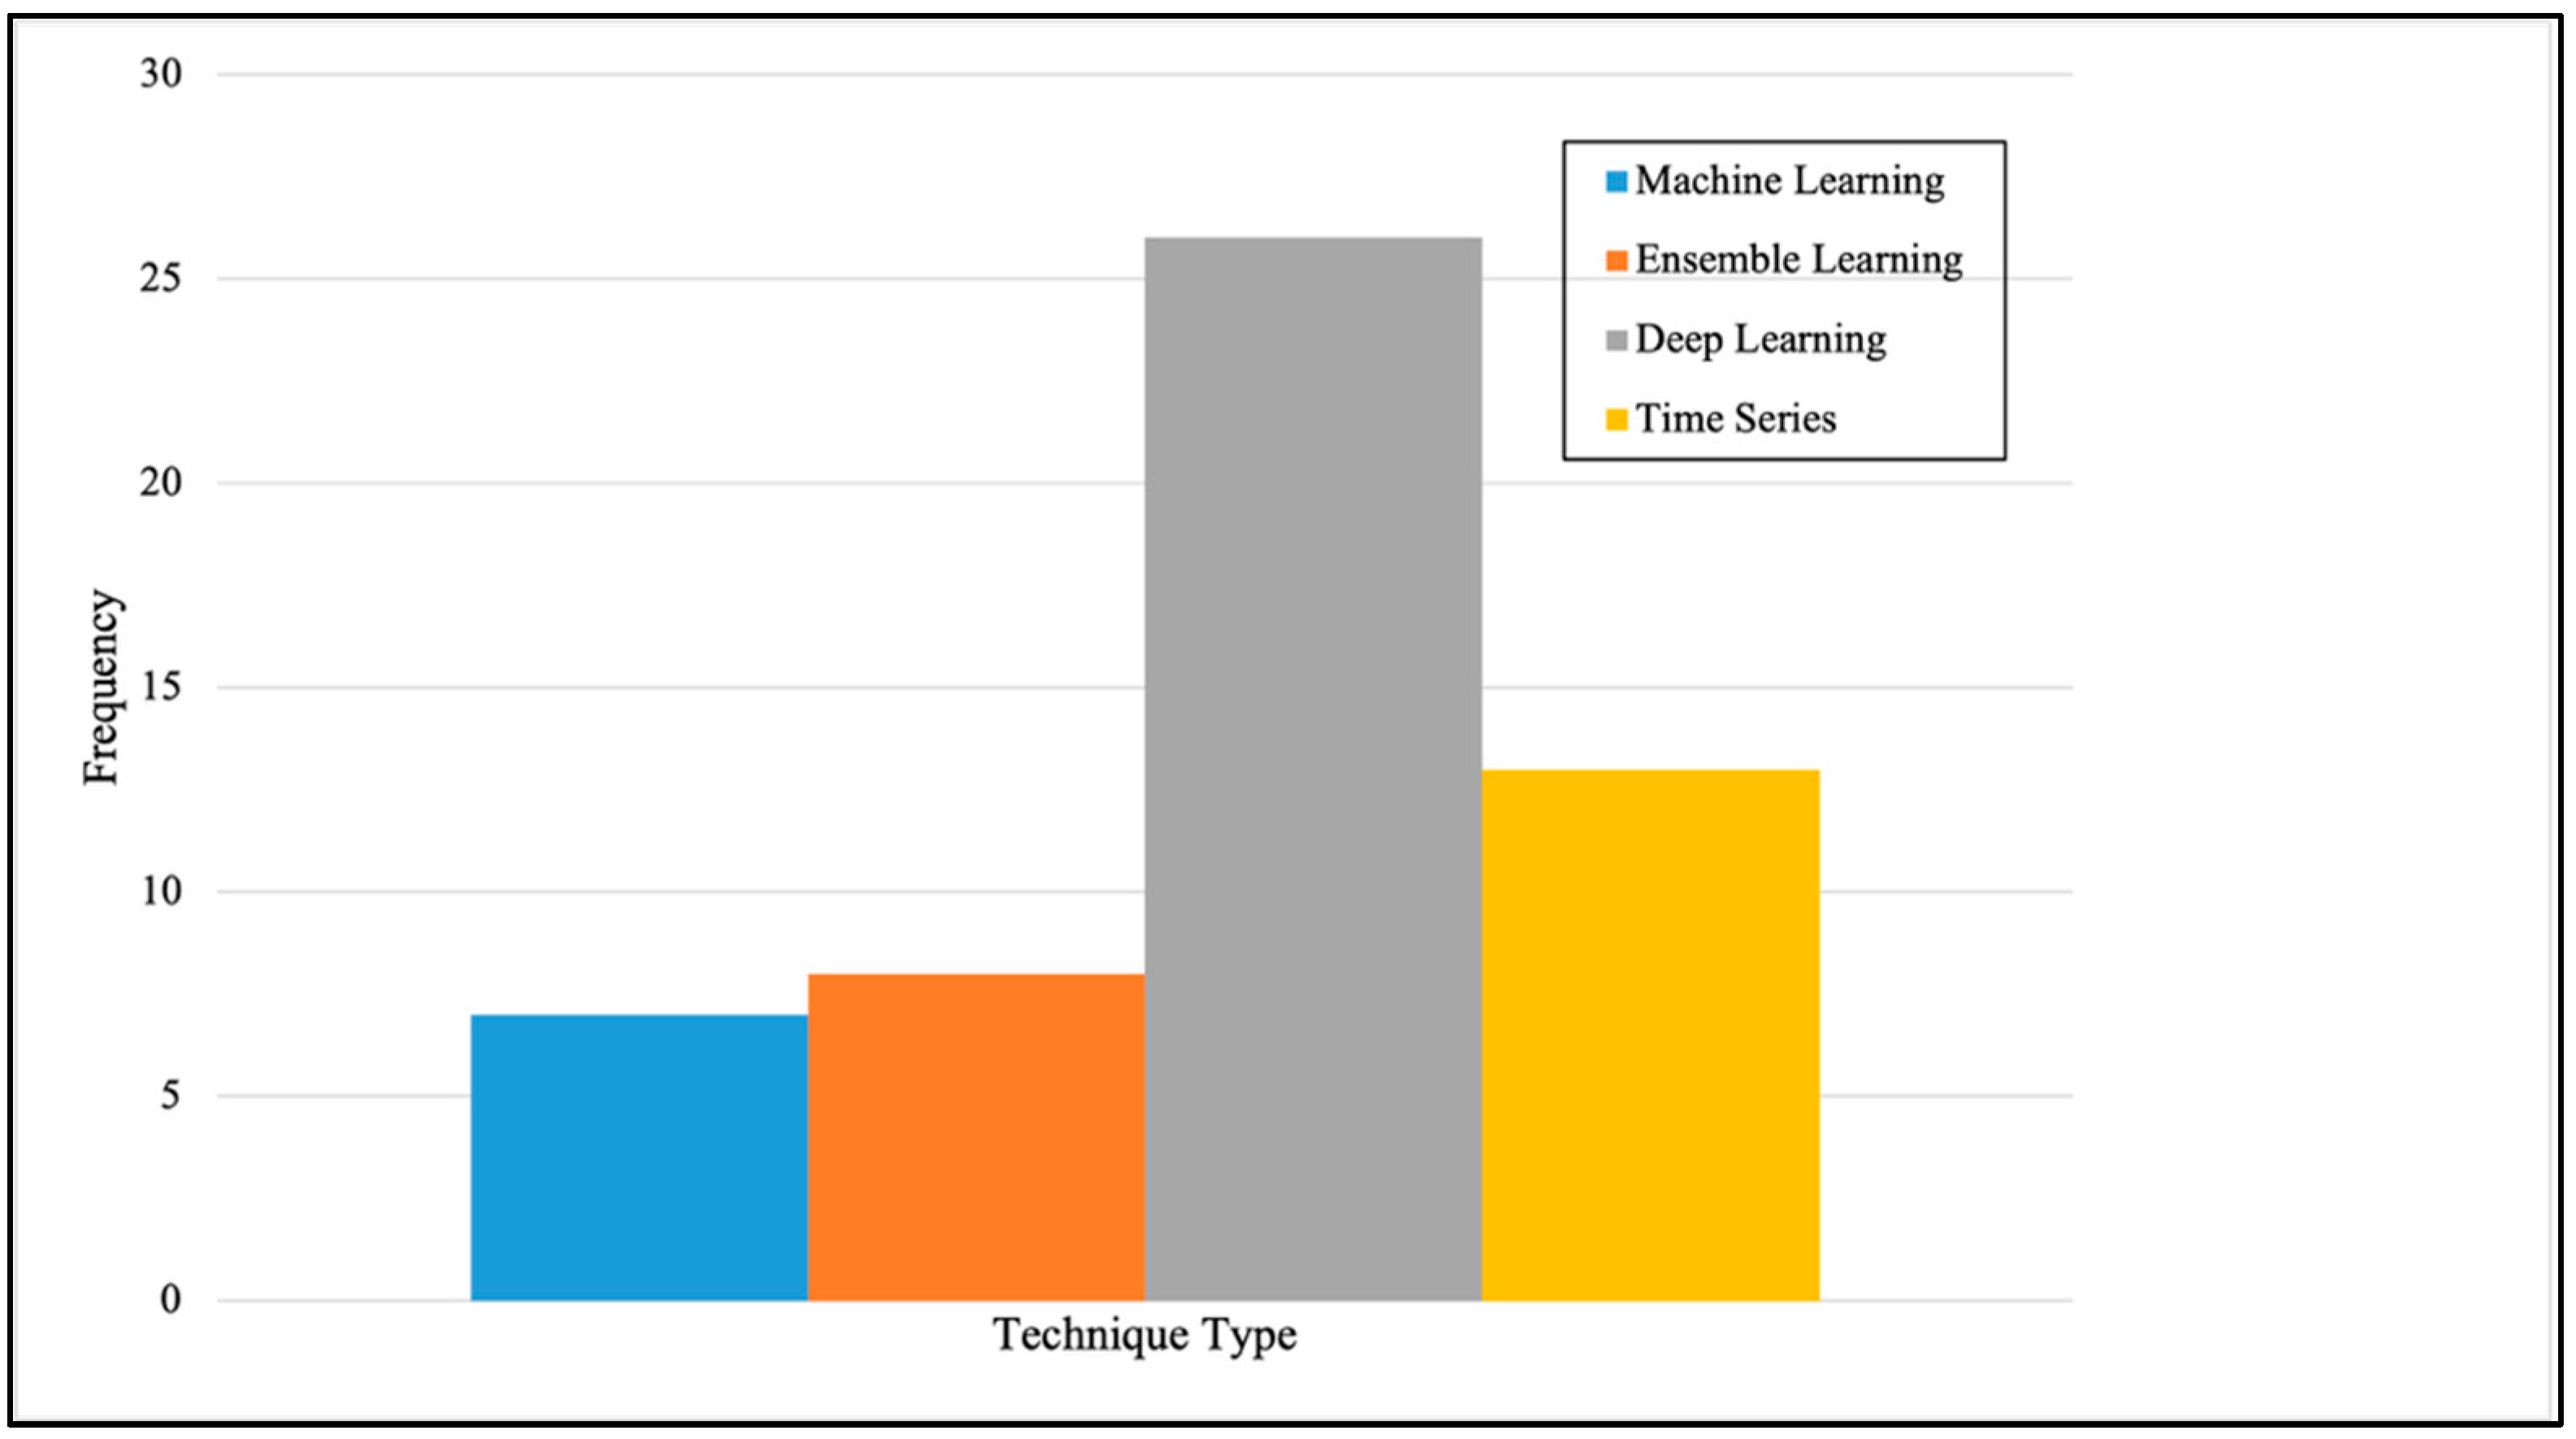
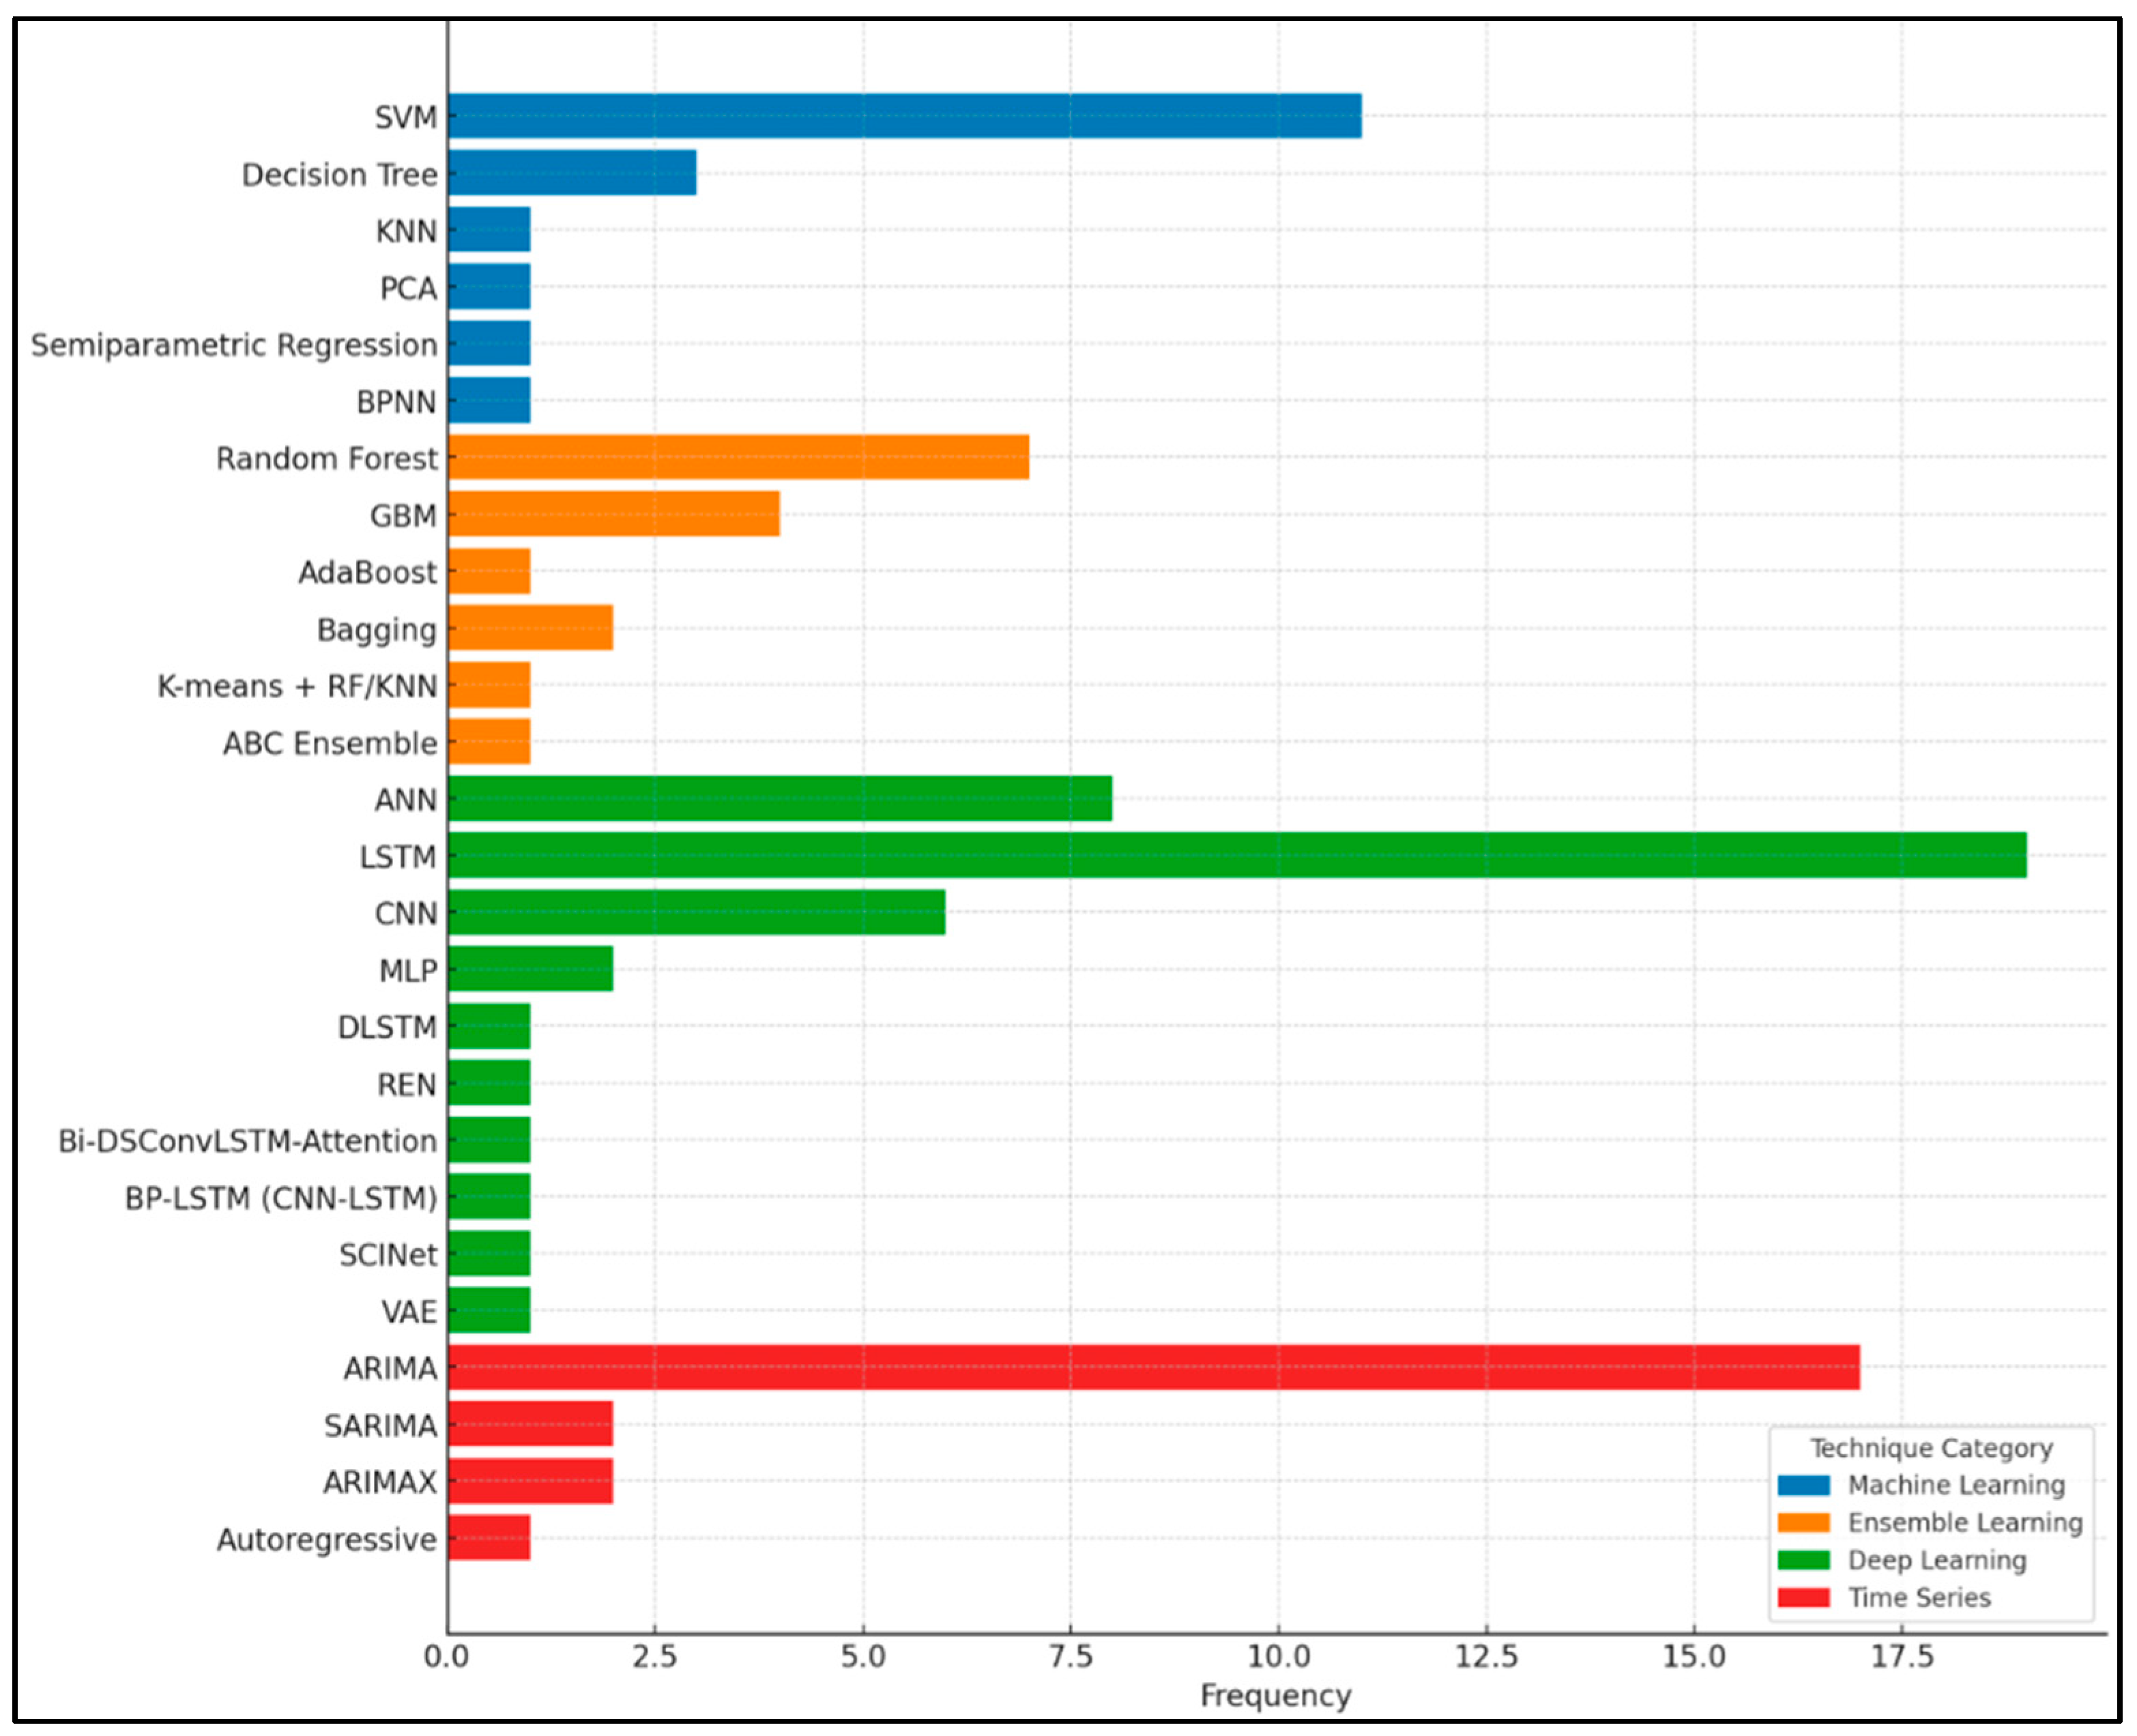
4.1. Common Techniques
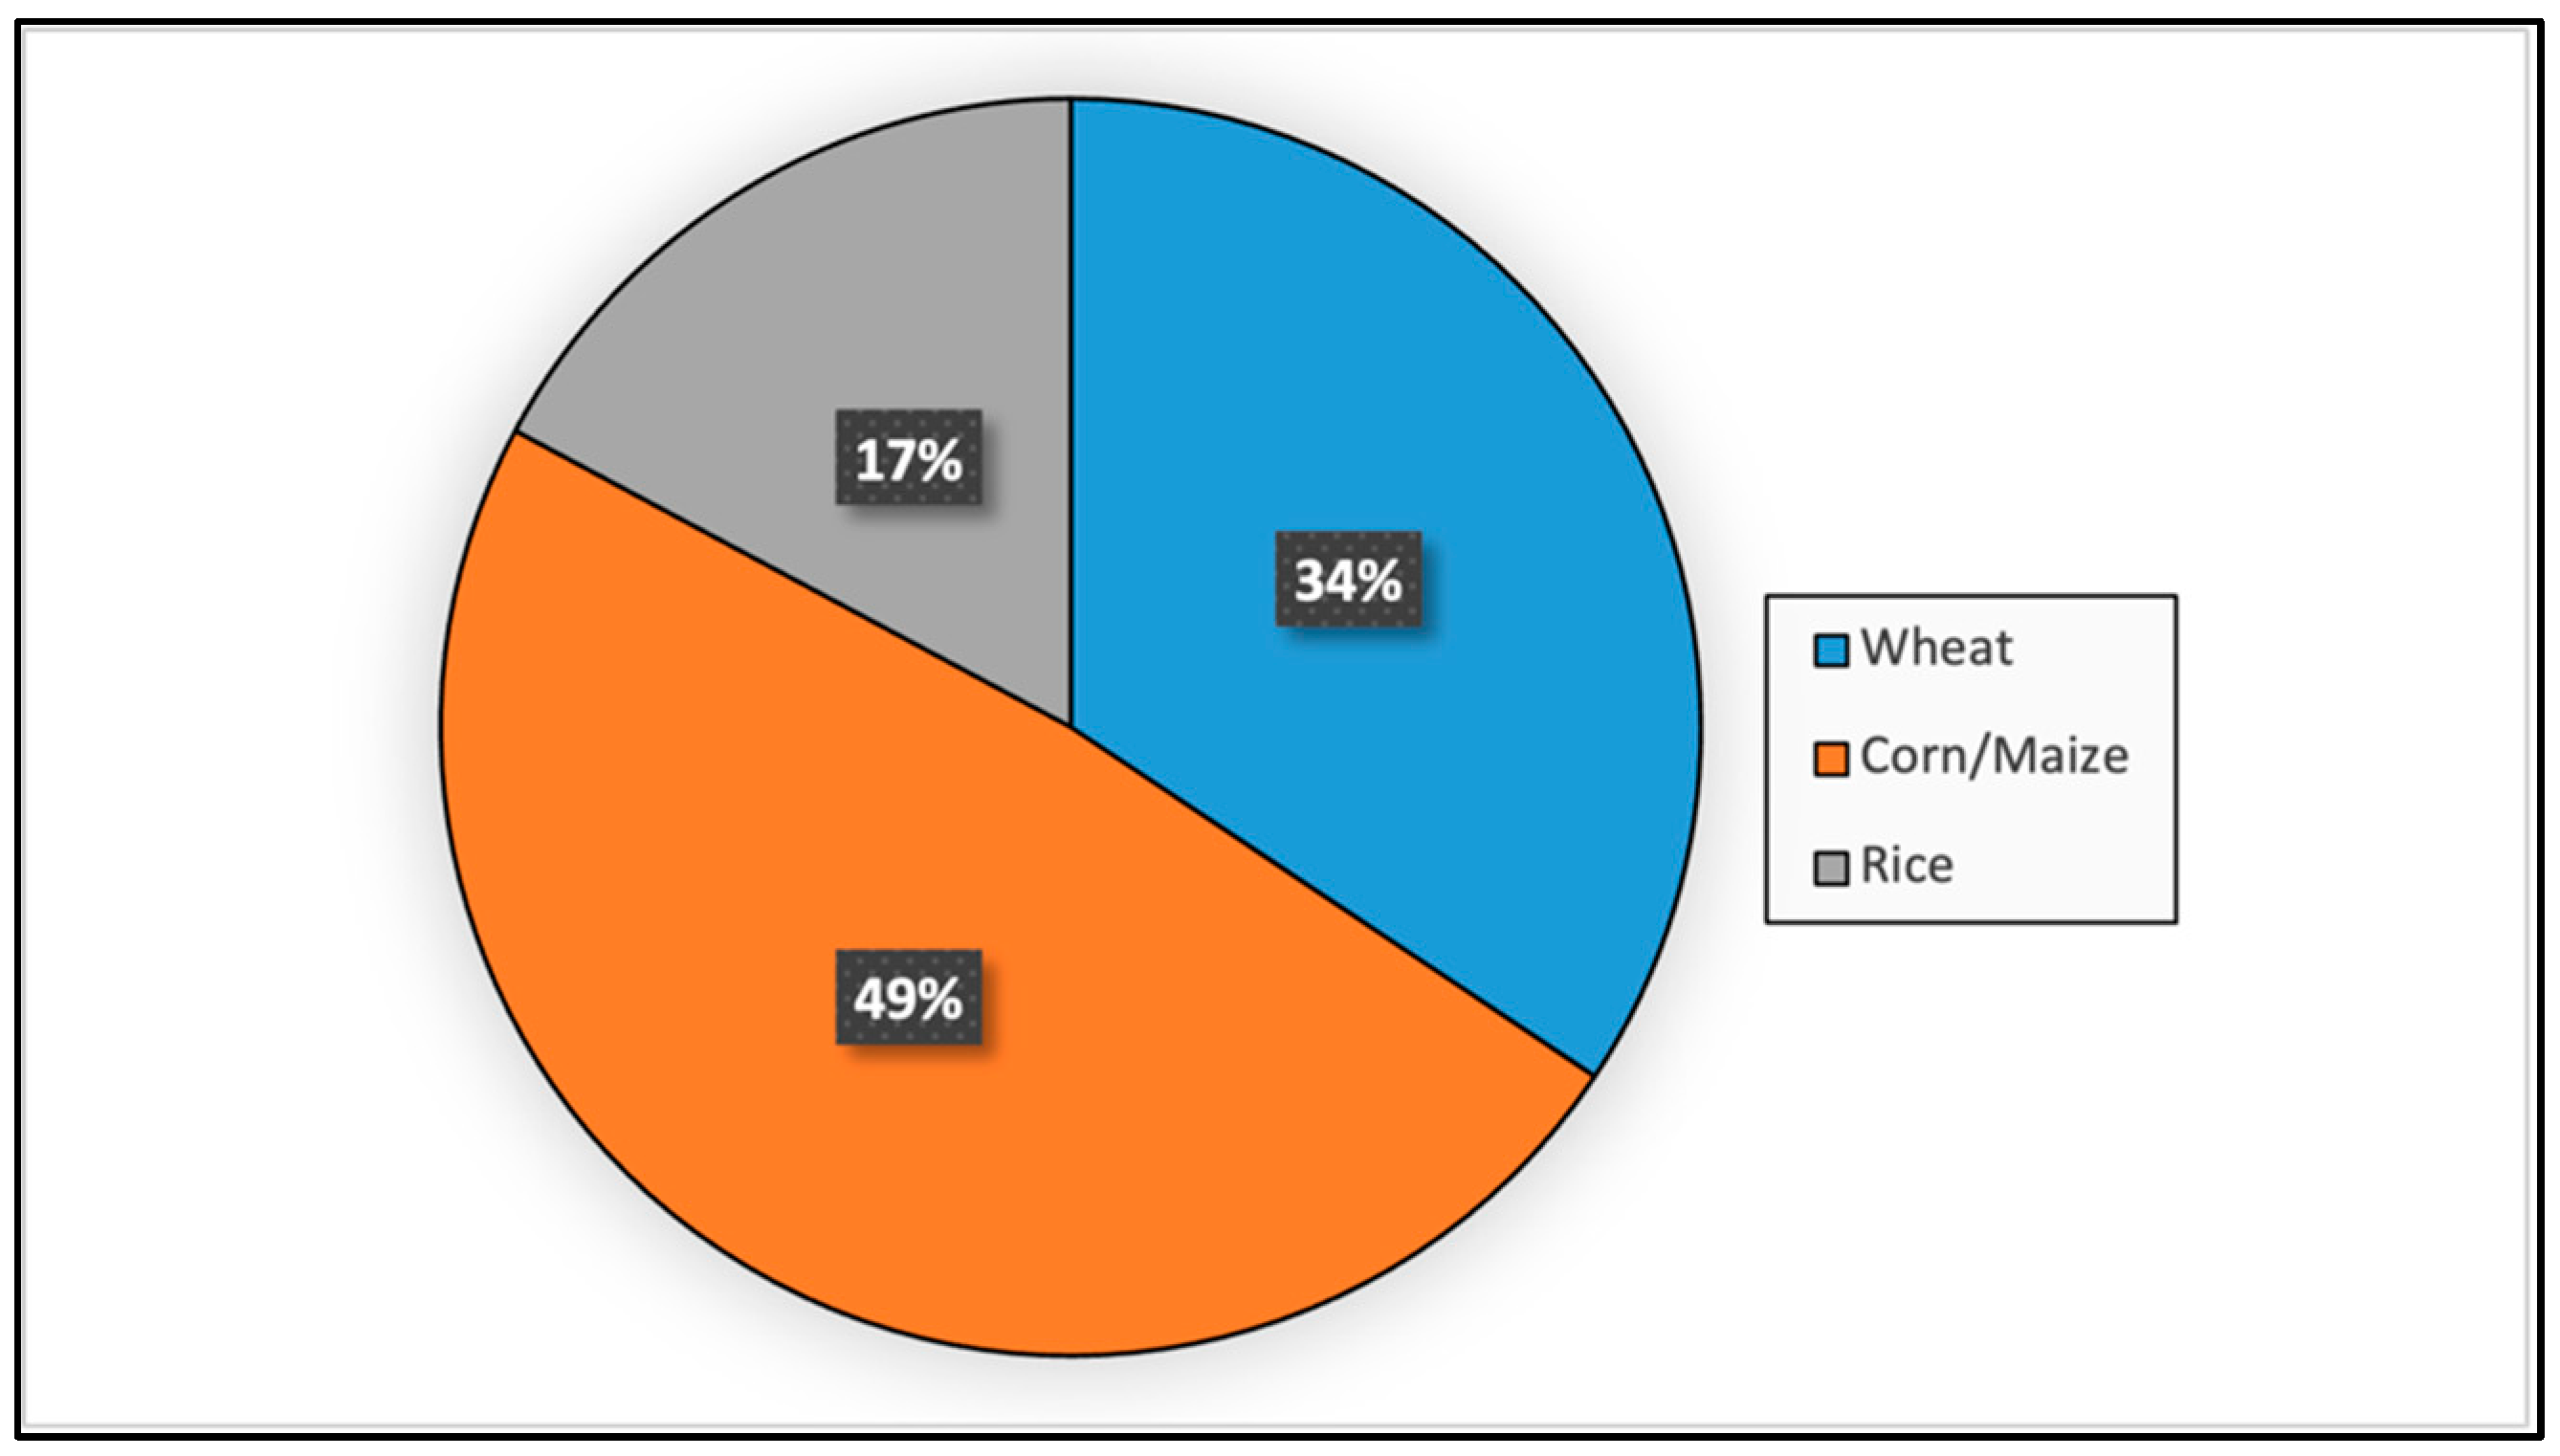
4.2. The Studied Commodities
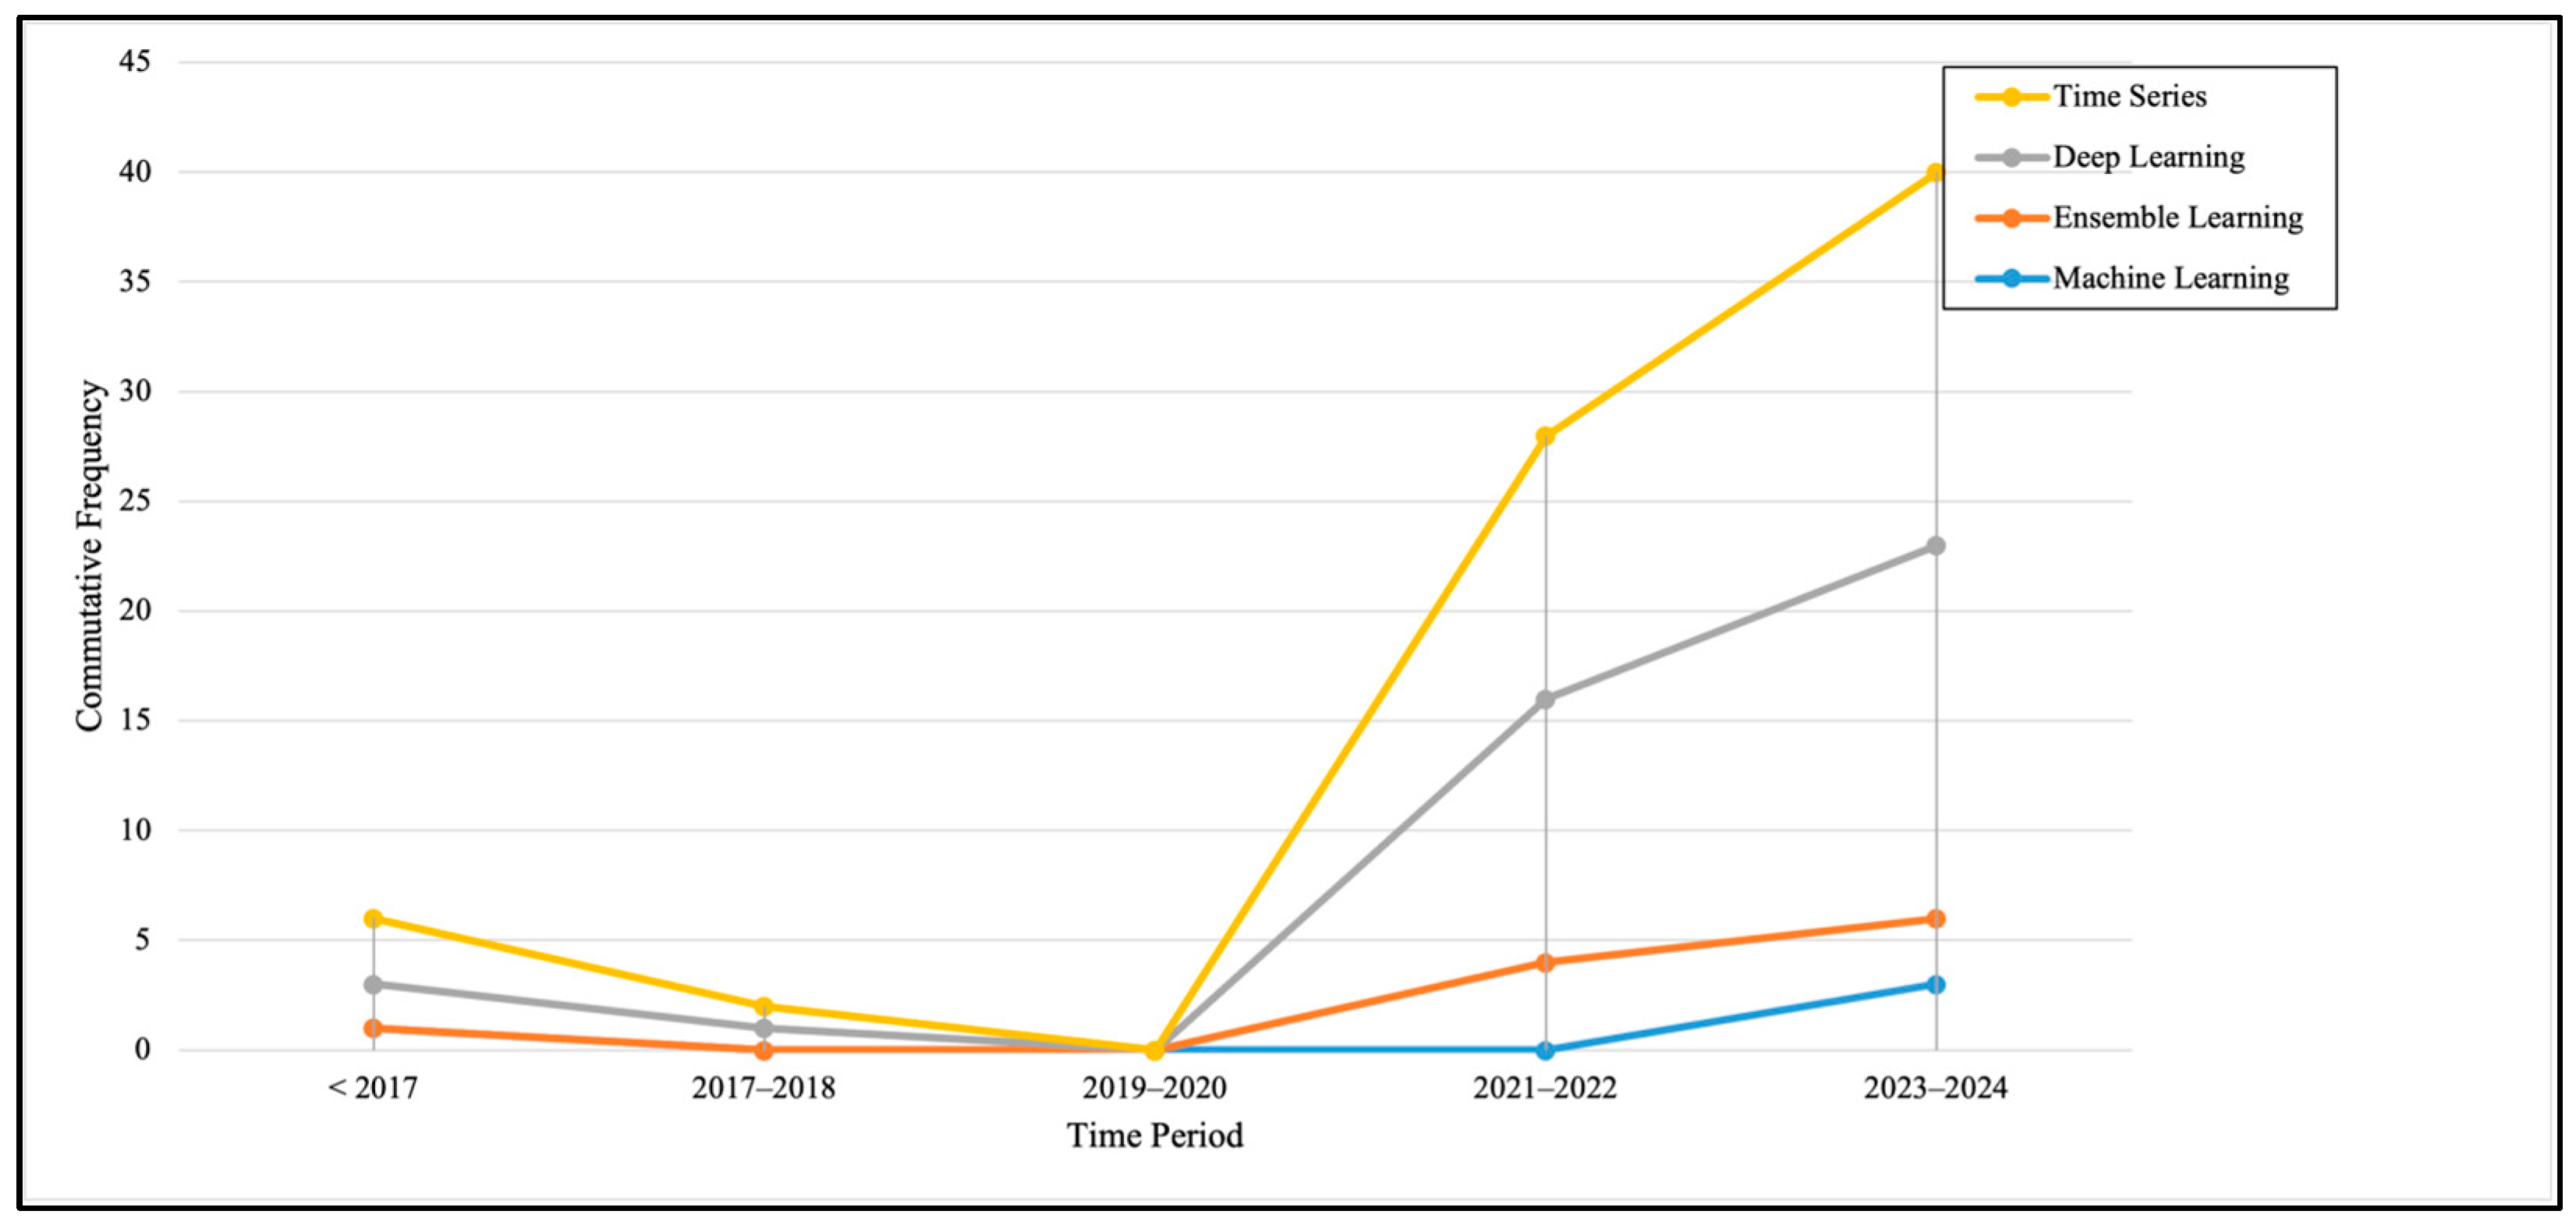
4.3. Evolution of Techniques
4.4. Challenges and Limitations
4.4.1. Data Availability
4.4.2. Model Complexity and Computational Challenges
4.4.3. Model Interpretability
4.4.4. Interaction of Limitations
5. Conclusions
Author Contributions
Funding
Institutional Review Board Statement
Informed Consent Statement
Data Availability Statement
Acknowledgments
Conflicts of Interest
Abbreviations
| AI | Artificial Intelligence |
| ANN | Artificial Neural Network |
| ARIMA | AutoRegressive Integrated Moving Average |
| ARIMAX | ARIMA with Exogenous Variables |
| BP | Backpropagation |
| BPNN | Backpropagation Neural Network |
| CBOT | Chicago Board of Trade |
| CNN | Convolutional Neural Network |
| CS | Cuckoo Search |
| DL | Deep Learning |
| EL | Ensemble Learning |
| EMD | Empirical Mode Decomposition |
| EV | Explained Variance |
| FFNN | Feedforward Neural Network |
| GDP | Gross Domestic Product |
| GRU | Gated Recurrent Unit |
| GWO | Grey Wolf Optimizer |
| ITD | Intrinsic Time-scale Decomposition |
| KNN | k-Nearest Neighbors |
| LSTM | Long Short-Term Memory |
| MAPE | Mean Absolute Percentage Error |
| MAE | Mean Absolute Error |
| ML | Machine Learning |
| MLP | Multi-Layer Perceptron |
| MSE | Mean Squared Error |
| MSLE | Mean Squared Logarithmic Error |
| NN | Neural Network |
| PLS | Partial Least Squares |
| PCA | Principal Component Analysis |
| PSO | Particle Swarm Optimization |
| R2 | Coefficient of Determination |
| RF | Random Forest |
| RFR | Random Forest Regressor |
| RMSE | Root Mean Squared Error |
| RNN | Recurrent Neural Network |
| SARIMA | Seasonal ARIMA |
| SARIMAX | Seasonal ARIMA with Exogenous Variables |
| SCINet | Series-wise Convolutional Interaction Network |
| SLR | Systematic Literature Review |
| SSA | Singular Spectrum Analysis |
| SVR | Support Vector Regression |
| SVM | Support Vector Machine |
| TDNN | Time-Delay Neural Network |
| VMD | Variational Mode Decomposition |
| XGBoost | Extreme Gradient Boosting |
References
- Food and Agriculture Organization of the United Nations. Gross Domestic Product and Agriculture Value Added 2013–2022: Global and Regional Trends; FAO: Rome, Italy, 2023; Available online: https://www.fao.org/statistics/highlights-archive/highlights-detail/gross-domestic-product-and-agriculture-value-added-2013-2022.-global-and-regional-trends/en (accessed on 31 March 2025).
- Yuan, X.; Li, S.; Chen, J.; Yu, H.; Yang, T.; Wang, C.; Huang, S.; Chen, H.; Ao, X. Impacts of Global Climate Change on Agricultural Production: A Comprehensive Review. Agronomy 2024, 14, 1360. [Google Scholar] [CrossRef]
- World Bank. Agriculture Results; IDA—International Development Association: Washington, DC, USA, 2025; Available online: https://ida.worldbank.org/en/topics/results/agriculture (accessed on 31 March 2025).
- World Bank. Agriculture and Food Overview; World Bank: Washington, DC, USA, 2018; Available online: https://www.worldbank.org/en/topic/agriculture/overview (accessed on 31 March 2025).
- Evenson, R.E.; Gollin, D. Assessing the impact of the Green Revolution, 1960 to 2000. Science 2003, 300, 758–762. [Google Scholar] [CrossRef]
- United Nations Conference on Trade and Development (UNCTAD). Price Formation in Financialized Commodity Markets: The Role of Information; UNCTAD: Geneva, Switzerland, 2011; Available online: https://unctad.org/en/PublicationsLibrary/gds20111_en.pdf (accessed on 31 March 2025).
- von Braun, J.; Tadesse, G. Global Food Price Volatility and Spikes: An Overview of Costs, Causes, and Solutions; ZEF Working Paper Series, No. 123; Center for Development Research (ZEF), University of Bonn: Bonn, Germany, 2012; Available online: https://www.zef.de/uploads/tx_zefportal/Publications/wp123.pdf (accessed on 31 March 2025).
- FAO. Price Volatility in Food and Agricultural Markets: Policy Responses; Food and Agriculture Organization of the United Nations: Rome, Italy, 2011; Available online: https://www.fao.org/3/i2107e/i2107e00.htm (accessed on 31 March 2025).
- Shobharani, H.M.; Gupta, A.K.; Kumar, S.; Tripathi, G. Machine Learning and Hybrid Model Building Mechanism for Forecasting Agricultural Market Behaviour: A Case Study of Vegetable Crops. Indian J. Econ. Dev. 2024, 20, 303–316. [Google Scholar] [CrossRef]
- Belhadi, A.; Kamble, S.S.; Mani, V.; Benkhati, I.; Touriki, F.E. An Ensemble Machine Learning Approach for Forecasting Credit Risk of Agricultural SMEs’ Investments in Agriculture 4.0 Through Supply Chain Finance. Ann. Oper. Res. 2021, 345, 779–807. [Google Scholar] [CrossRef] [PubMed]
- Elberzhager, F.; Münch, J.; Nha, V.T.N. A systematic mapping study on the combination of static and dynamic quality assurance techniques. Inf. Softw. Technol. 2012, 54, 1–15. [Google Scholar] [CrossRef]
- Ishaq, M.; Abid, A.; Farooq, M.S.; Manzoor, M.F.; Farooq, U.; Abid, K.; Abu Helou, M. Advances in database systems education: Methods, tools, curricula, and way forward. Educ. Inf. Technol. 2023, 28, 2681–2725. [Google Scholar] [CrossRef]
- Lee, K. A Systematic Review on Social Sustainability of Artificial Intelligence in Product Design. Sustainability 2021, 13, 899. [Google Scholar] [CrossRef]
- Ramandanis, D.; Xinogalos, S. Investigating the Support Provided by Chatbots to Educational Institutions and Their Students: A Systematic Literature Review. Multimodal Technol. Interact. 2023, 7, 103. [Google Scholar] [CrossRef]
- Karger, E.; Kureljusić, M. Using Artificial Intelligence for Drug Discovery: A Bibliometric Study and Future Research Agenda. Pharmaceuticals 2022, 15, 1492. [Google Scholar] [CrossRef]
- Lundberg, L.; Boldt, M.; Borg, A.; Grahn, H. Bibliometric Mining of Research Trends in Machine Learning. AI 2024, 5, 208–236. [Google Scholar] [CrossRef]
- Haddaway, N.R.; Page, M.J.; Pritchard, C.C.; McGuinness, L.A. PRISMA2020: An R package and Shiny app for producing PRISMA 2020-compliant flow diagrams, with interactivity for optimised digital transparency and Open Synthesis. Campbell Syst. Rev. 2022, 18, e1230. [Google Scholar] [CrossRef] [PubMed]
- Esmaeili, A.; Shokoohi, Z. Assessing the effect of oil price on world food prices: Application of principal component analysis. Energy Policy 2011, 39, 1022–1025. [Google Scholar] [CrossRef]
- Traoré, F.; Jimbira, S.S.; Sall, L.M. Nonlinear price transmission in the rice market in Senegal: A model-based recursive partitioning approach. Appl. Econ. 2022, 54, 2343–2355. [Google Scholar] [CrossRef]
- Kantanantha, N.; Serban, N.; Griffin, P. Yield and Price Forecasting for Stochastic Crop Decision Planning. J. Agric. Biol. Environ. Stat. 2010, 15, 362–380. [Google Scholar] [CrossRef]
- Ayankoya, K.; Calitz, A.P.; Greyling, J.H. Real-Time Grain Commodities Price Predictions in South Africa: A Big Data and Neural Networks Approach. Agrekon 2016, 55, 483–508. [Google Scholar] [CrossRef]
- Sentosa, Y.D.; Cahyadi, L.; Ferdinand, F.V. Analysis of Rainfall Effects and Comparison of ARIMAX-GARCH and Support Vector Regression Methods Based on Rice Price Forecasting in Seven Cities on Java Island. ICIC Express Lett. Part B Appl. 2024, 15, 1285–1293. [Google Scholar] [CrossRef]
- Yadav, A. A Comparative Study of Time Series, Machine Learning, and Deep Learning Models for Forecasting Global Price of Wheat. Oper. Res. Forum 2024, 5, 113. [Google Scholar] [CrossRef]
- Kumar, R. Predicting Wheat Futures Prices in India. Asia-Pac. Financ. Mark. 2021, 28, 121–140. [Google Scholar] [CrossRef]
- Zelingher, R.; Makowski, D. Investigating and forecasting the impact of crop production shocks on global commodity prices. Environ. Res. Lett. 2024, 19, 014026. [Google Scholar] [CrossRef]
- Zelingher, R.; Makowski, D. Forecasting Global Maize Prices From Regional Productions. Front. Sustain. Food Syst. 2022, 6, 836437. [Google Scholar] [CrossRef]
- Dewi, C.; Prasatya, G.S.K.; Christanto, H.J.; Widiarto, S.O.B.; Dai, G. Modified Random Forest Regression Model for Predicting Wholesale Rice Prices. J. Theor. Appl. Inf. Technol. 2023, 101, 7749–7759. [Google Scholar]
- Silva, R.F.; Barreira, B.L.; Cugnasca, C.E. Prediction of Corn and Sugar Prices Using Machine Learning, Econometrics, and Ensemble Models. Eng. Proc. 2021, 9, 31. [Google Scholar] [CrossRef]
- Mao, S.; Soonthornphisaj, N. Thailand’s Maize Prices Forecasting Using Ensemble Technique. ASEAN J. Sci. Technol. Rep. 2024, 27, e252279. [Google Scholar] [CrossRef]
- Imran, A.A.; Wahid, Z.; Prova, A.A.; Hannan, M. Harnessing the meteorological effect for predicting the retail price of rice in Bangladesh. Int. J. Bus. Intell. Data Min. 2022, 20, 440–455. [Google Scholar] [CrossRef]
- Oktoviany, P.; Knobloch, R.; Korn, R. A machine learning-based price state prediction model for agricultural commodities using external factors. Decis. Econ. Financ. 2021, 44, 1063–1085. [Google Scholar] [CrossRef]
- Wang, J.; Wang, Z.; Li, X.; Zhou, H. Artificial bee colony-based combination approach to forecasting agricultural commodity prices. Int. J. Forecast. 2022, 38, 21–34. [Google Scholar] [CrossRef]
- Wang, J.; Li, X. A combined neural network model for commodity price forecasting with SSA. Soft Comput. 2018, 22, 5323–5333. [Google Scholar] [CrossRef]
- Choudhary, K.; Jha, G.K.; Jaiswal, R.; Venkatesh, P.; Parsad, R. Agricultural Price Forecasting Based on Variational Mode Decomposition and Time-Delay Neural Network. Stat. Appl. 2023, 21, 235–257. [Google Scholar]
- Zhang, T.; Tang, Z. Agricultural commodity futures prices prediction based on a new hybrid forecasting model combining quadratic decomposition technology and LSTM model. Front. Sustain. Food Syst. 2024, 8, 1334098. [Google Scholar] [CrossRef]
- Halim, M.P.; Yudistira, N.; Dewi, C. Multicommodity Prices Prediction Using Multivariate Data-Driven Modeling: Indonesia Case. IEEE Trans. Comput. Soc. Syst. 2022, 11, 8106–8117. [Google Scholar] [CrossRef]
- Liang, J.; Jia, G. China futures price forecasting based on online search and information transfer. Data Sci. Manag. 2022, 5, 187–198. [Google Scholar] [CrossRef]
- Wang, X.; Xu, Y.; Wang, H.; Kang, M.; Hua, J.; Wang, F.-Y. Region-Farm Crop Planning Through Double Deep Q-Learning Toward Sustainable Agriculture. IEEE Trans. Comput. Soc. Syst. 2024, 11, 7608–7617. [Google Scholar] [CrossRef]
- Zeng, L.; Ling, L.; Zhang, D.; Jiang, W. Optimal forecast combination based on PSO-CS approach for daily agricultural future prices forecasting. Appl. Soft Comput. 2023, 132, 109833. [Google Scholar] [CrossRef]
- Yun, B.; Lai, J.; Ma, Y.; Zheng, Y. Research on Grain Futures Price Prediction Based on a Bi-DSConvLSTM-Attention Model. Systems 2024, 12, 204. [Google Scholar] [CrossRef]
- Guo, Y.; Tang, D.; Tang, W.; Yang, S.; Tang, Q.; Feng, Y.; Zhang, F. Agricultural price prediction based on combined forecasting model under spatial-temporal influencing factors. Sustainability 2022, 14, 10483. [Google Scholar] [CrossRef]
- Menhaj, M.H.; Kavoosi-Kalashami, M. Developing a hybrid forecasting system for agricultural commodity prices (case study: Thailand rice free on board price). Cienc. Rural 2022, 52, e20201128. [Google Scholar] [CrossRef]
- Wu, B.; Wang, Z.; Wang, L. Interpretable corn future price forecasting with multivariate time series. J. Forecast. 2024, 43, 1575–1594. [Google Scholar] [CrossRef]
- Wang, Y.; Liu, Q.; Hu, Y.; Liu, H. A Study of Futures Price Forecasting with a Focus on the Role of Different Economic Markets. Information 2024, 15, 817. [Google Scholar] [CrossRef]
- Chakraborty, S.; Jagabathula, S.; Subramanian, L.; Venkataraman, A. Frontiers in Operations: News Event-Driven Forecasting of Commodity Prices. Manuf. Serv. Oper. Manag. 2024, 26, 1286–1305. [Google Scholar] [CrossRef]
- Xu, X.; Zhang, Y. Corn cash price forecasting with neural networks. Comput. Electron. Agric. 2021, 184, 106120. [Google Scholar] [CrossRef]
- Xu, X.; Zhang, Y. Commodity price forecasting via neural networks for coffee, corn, cotton, oats, soybeans, soybean oil, sugar, and wheat. Intell. Syst. Account. Financ. Manag. 2022, 29, 169–181. [Google Scholar] [CrossRef]
- Thaker, A.; Chan, L.H.; Sonner, D. Forecasting Agriculture Commodity Futures Prices with Convolutional Neural Networks with Application to Wheat Futures. J. Risk Financ. Manag. 2024, 17, 143. [Google Scholar] [CrossRef]
- Wang, Z.; French, N.; James, T.; Schillaci, C.; Chan, F.; Feng, M.; Lipani, A. Climate and environmental data contribute to the prediction of grain commodity prices using deep learning. J. Sustain. Agric. Environ. 2023, 2, 251–265. [Google Scholar] [CrossRef]
- Teste, F.; Gangloff, H.; Chen, M.; Ciais, P.; Makowski, D. Leveraging satellite data with machine and deep learning techniques for corn yield and price forecasting. IEEE Trans. Geosci. Remote Sens. 2024, 62, 4413716. [Google Scholar] [CrossRef]
- Zhao, Q.; Chen, J.; Feng, X.; Wang, Y. A Novel Bézier LSTM Model: A Case Study in Corn Analysis. Mathematics 2024, 12, 2308. [Google Scholar] [CrossRef]
- Jaiswal, R.; Jha, G.K.; Kumar, R.R.; Choudhary, K. Deep long short-term memory based model for agricultural price forecasting. Neural Comput. Appl. 2022, 34, 4661–4676. [Google Scholar] [CrossRef]
- Brignoli, P.L.; Varacca, A.; Gardebroek, C.; Sckokai, P. Machine learning to predict grains futures prices. Agric. Econ. 2024, 55, 479–497. [Google Scholar] [CrossRef]
- Daniel, J.; Shyamala, R.; Pugalenthi, R.; Mohan Kumar, P. RANC-CROP Recommendation Attributed to Soil Nutrients and Stock Analysis Using Machine Learning. IETE J. Res. 2023, 69, 8077–8089. [Google Scholar] [CrossRef]
- Patil, A.; Shah, D.; Shah, A.; Kotecha, R. Forecasting Prices of Agricultural Commodities using Machine Learning for Global Food Security: Towards Sustainable Development Goal 2. Int. J. Eng. Trends Technol. 2023, 71, 277–291. [Google Scholar] [CrossRef]
- Wang, D.; Yue, C.; Wei, S.; Lv, J. Performance analysis of four decomposition- ensemble models for one-day-ahead agricultural commodity futures price forecasting. Algorithms 2017, 10, 108. [Google Scholar] [CrossRef]
- Jiang, F.; Ma, X.Y.; Li, Y.Y.; Li, J.X.; Cao, W.L.; Tong, J.; Chen, Q.Y.; Chen, H.-F.; Fu, Z.X. How Deep Learning Affect Price Forecasting of Agricultural Supply Chain? J. Inf. Sci. Eng. 2023, 39, 809–823. [Google Scholar] [CrossRef]
- Wang, L.; An, W.; Li, F.T. Text-based corn futures price forecasting using improved neural basis expansion network. J. Forecast. 2024, 43, 2042–2063. [Google Scholar] [CrossRef]
- Kohzadi, N.; Boyd, M.S.; Kermanshahi, B.; Kaastra, I. A comparison of artificial neural network and time series models for forecasting commodity prices. Neurocomputing 1996, 10, 169–181. [Google Scholar] [CrossRef]
- Sharma, H.; Burark, S.S. Accuracy of different price forecasting models for maize in nimbahera market of Rajasthan. Int. J. Agric. Stat. Sci. 2016, 12, 95–101. [Google Scholar]
- Shao, Y.E.; Dai, J.T. Integrated feature selection of ARIMA with computational intelligence approaches for food crop price prediction. Complexity 2018, 2018, 1910520. [Google Scholar] [CrossRef]
- Zou, H.F.; Xia, G.P.; Yang, F.T.; Wang, H.Y. An investigation and comparison of artificial neural network and time series models for Chinese food grain price forecasting. Neurocomputing 2007, 70, 2913–2923. [Google Scholar] [CrossRef]
- Antwi, E.; Gyamfi, E.N.; Kyei, K.A.; Gill, R.; Adam, A.M. Modeling and Forecasting Commodity Futures Prices: Decomposition Approach. IEEE Access 2022, 10, 27484–27503. [Google Scholar] [CrossRef]
- Preetha, K.G.; Remesh Babu, K.R.; Sangeetha, U.; Thomas, R.S.; Saigopika; Walter, S.; Swapna Thomas, S. Price Forecasting on a Large Scale Data Set using Time Series and Neural Network Models. KSII Trans. Internet Inf. Syst. 2022, 16, 3923–3942. [Google Scholar] [CrossRef]
- Xu, X.; Zhang, Y. Yellow corn wholesale price forecasts via the neural network. EconomiA 2023, 24, 44–67. [Google Scholar] [CrossRef]
- Du, X.; Yu, C.L.; Hayes, D. Speculation and Volatility Spillover in the Crude Oil and Agricultural Commodity Markets: A Bayesian Analysis. Energy Econ. 2011, 33, 497–503. [Google Scholar] [CrossRef]
- Crespo Cuaresma, J.; Hlouskova, J.; Obersteiner, M. Agricultural commodity price dynamics and their determinants: A comprehensive econometric approach. J. Forecast. 2021, 40, 1245–1273. [Google Scholar] [CrossRef]
- Ju, S.; Lim, H.; Ma, J.W.; Kim, S.; Lee, K.; Zhao, S.; Heo, J. Optimal county-level crop yield prediction using MODIS-based variables and weather data: A comparative study on machine learning models. Agric. For. Meteorol. 2021, 307, 108530. [Google Scholar] [CrossRef]
- Sari, M.; Duran, S.; Kutlu, H.; Guloglu, B.; Atik, Z. Various optimized machine learning techniques to predict agricultural commodity prices. Neural Comput. Appl. 2024, 36, 11439–11459. [Google Scholar] [CrossRef]
- Sun, C.; Pei, M.; Cao, B.; Chang, S.; Si, H. A Study on Agricultural Commodity Price Prediction Model Based on Secondary Decomposition and Long Short-Term Memory Network. Agriculture 2024, 14, 60. [Google Scholar] [CrossRef]
- Zhao, L.; Zhao, X.; Zhou, H.; Wang, X.; Xing, X. Prediction model for daily reference crop evapotranspiration based on hybrid algorithm and principal components analysis in Southwest China. Comput. Electron. Agric. 2021, 190, 106424. [Google Scholar] [CrossRef]
- Johann, A.L.; de Araújo, A.G.; Delalibera, H.C.; Hirakawa, A.R. Soil moisture modeling based on stochastic behavior of forces on a no-till chisel opener. Comput. Electron. Agric. 2016, 121, 420–428. [Google Scholar] [CrossRef]
- Van Le, N.B.; Seo, Y.S.; Huh, J.H. AgTech: Volatility Prediction for Agricultural Commodity Exchange Trading Applied Deep Learning. IEEE Access 2024, 12, 153898–153910. [Google Scholar] [CrossRef]
- Kiekintveld, C.; Miller, J.; Jordan, P.R.; Callender, L.F.; Wellman, M.P. Forecasting market prices in a supply chain game. Electron. Commer. Res. Appl. 2009, 8, 63–77. [Google Scholar] [CrossRef]


| Research Objective (RO) | Research Question (RQ) | Motivation |
|---|---|---|
| RO1: To identify and categorize the machine learning, ensemble learning, deep learning, and time series techniques used in agricultural commodity price prediction and to provide a descriptive overview of the publication trends, geographical distribution, and subject focus of the research field. | RQ1: What forecasting techniques have been applied in predicting the prices of agricultural commodities such as wheat, corn, and rice? | To understand the landscape of computational methods used in agricultural price forecasting and examine how the literature has evolved over time and space. |
| RO2: To investigate the challenges and limitations encountered in the implementation of these forecasting models. | RQ2: What are the key challenges and limitations reported in the literature regarding data quality, model complexity, interpretability, and computational demands? | To highlight the obstacles and limitations faced by researchers and practitioners in developing accurate and reliable forecasting models. |
| RO3: To focus the review on staple crops that are central to global food security. | RQ3: Why are wheat, corn, and rice chosen as the target commodities for this review? | To justify the scope of the study based on the essential role of these crops in global diets and markets. |
| Refs. | Year | Commodity Name | Dataset | Technique | Findings | Limitation |
|---|---|---|---|---|---|---|
| [18] | 2011 | Eggs, Meat, Milk, Oilseeds, Rice, Sugar, Wheat | Global macroeconomic and food price data | PCA | Oil prices indirectly affect food prices via the food production index (corr.: 0.87 with GDP, 0.36 with CPI). | Historical macroeconomic relationships may not account for future structural changes |
| [19] | 2022 | Rice | Monthly average prices from 1995 to 2014, Commission for Food Security (Dakar retail level) | Model-based recursive partitioning trees | Local prices are affected by world prices, more so by increases than by declines; 11.80% of positive deviations and 39.50% of negative deviations are eliminated after one month | Focused only on the ordinary broken rice segment |
| [20] | 2024 | Corn, Soybean | Futures and cash daily price data for corn and soybean (1991–2006) | Semiparametric Regression | Confidence bands for yield and price forecasts | The accuracy of the forecasted cash price depends largely on the current futures price |
| [21] | 2016 | Corn | Spot Price (South Africa), Grain Storage Spot Price, US Corn Trade, Demand and Supply (South Africa), Production and Consumption (USA), Interest Rate and Currency Exchange, Crude Oil Prices | BPNN | MAPE of 1.31% (in-sample) and 2.26% (out-sample) for 1-month prediction. Outperformed expert traders in real-time prediction | Decreased prediction accuracy over longer periods |
| [22] | 2024 | Rice | Weekly rice prices and weather data (2017–2022) from seven cities in Java | ARIMAX-GARCH, SVR | SVR outperformed in most cities and for premium quality; ARIMAX-GARCH stable for mid/low rice | Weather-only exogenous variable; city-specific results; moderate generalizability |
| [23] | 2024 | Wheat | Global wheat prices, macroeconomic indicators | ARIMA, SARIMA, ARIMAX, SARIMAX, LSTM, CNN, Regression | ARIMAX and SARIMA performed best; LSTM and CNN overfit training data | Limited generalizability of DL models; high error in testing phase |
| [24] | 2021 | Wheat | Daily wheat futures from NCDEX (May 2009–August 2014) | ARMA (1,1), ARMA (1,2), Economic Variable Model, ANN | Random walk model outperforms all | Compared neural network not fine-tuned |
| Refs. | Year | Commodity Name | Dataset | Technique | Findings | Limitation |
|---|---|---|---|---|---|---|
| [25] | 2024 | Corn, Soybean, Cocoa | The World Bank’s commodity market database, global monthly price data (1960–2020) | TBATS, GBM, CART, LM, RF | Corn (Short-term, TBATS): RA: 80%, Corn (Long-term, GBM): RA: 60% | Asymmetrical price responses to production changes reduce predictability consistency |
| [26] | 2022 | Corn | FAOSTAT corn yield/production (1961–2019), World Bank corn price | CART, RF, GBM, MLR, VAR, TBATS | RF and GBM outperform linear models for long-term forecasts, TBATS for short-term (2–5 months) | Difficulty in capturing complex inter-regional production dependencies |
| [27] | 2023 | Rice | Average Rice Price dataset at the Indonesian Wholesale Trade Level (2010–2022) | RF | MAPE reduced from 0.0093573 to 0.0089389 | The model’s performance was only compared with datasets from UCI |
| [28] | 2021 | Corn, Sugar | Daily prices (2003–2019) CEPEA database | ARIMA, SARIMA, SVR, AdaBoost, LSTM, Ensemble models | Best performing models: SVR, followed by SVR/LSTM Ensemble models | Models did not capture significant volatility and non-stationary data trends in the datasets |
| [29] | 2024 | Corn | Planting land area, crop price, crop yield, rainfall, import and export volumes, import and export values, and price in a total of 53 variables (2002–2023) | RT, SVR, Ensemble Bagging, RF | Bag-SVR: R2 = 0.961, MAE = 0.234, RMSE = 0.315; SVR: R2 = 0.959 | Focus on a specific commodity and region limits broader application |
| [30] | 2022 | Rice | 2004–2013 weather (BARC) and food prices (OCHA), Bangladesh | MLR, AdaBoost, Gradient Boosting, Bagging, Random Forest | RFR had R2 = 0.864; windspeeds found to be most correlated to price; ensemble methods outperformed MLR | Dataset limited to 2004–2013; only one country analyzed |
| [31] | 2021 | Corn | Futures corn prices (2015–2019), CBOT; daily temperature and precipitation, Refinitiv; supply and demand data, USDA | ML-KNN outperforms ML-RF | MAE 0.0372, RMSE 0.0512, MAPE 0.6908 | More complex algorithms might improve the model |
| [32] | 2022 | Soybean, Corn | CBOT daily corn and soybean prices (1974–2017) | ABC, SSA, EMD, LSTM, ARIMA, SVR | Error reduction (MAPE): 53.3%, Improvement (Dstat): 32.4%. ABC-based semi-heterogeneous forecast combination outperformed all other methods in both precision accuracy and direction accuracy | High complexity due to combining multiple models and techniques |
| Refs. | Year | Commodity Name | Dataset | Technique | Findings | Limitation |
|---|---|---|---|---|---|---|
| [33] | 2018 | Corn, Gold, Crude Oil | Corn, Gold, Crude oil futures prices (1983–2016) CBOT, COMEX, EIA | SSA, BPNN, RBFNN, WNN | SSA–NN models outperform baseline NN models | High computational complexity |
| [34] | 2023 | Corn, Palm Oil, Soybean Oil | Monthly international price for Corn, Palm Oil, Soybean Oil (1960–2021); World Bank Commodity Market | VMD–TDNN, EMD–TDNN, EEMD–TDNN, CEEMDAN–TDNN | Directional prediction accuracy: 90% (Corn), MAPE 0.0345, RMSE 9.49, DSTAT 90.90 | Lack of formal methodology to determine the number (n) of extracted modes by VMD |
| [35] | 2024 | Strong Wheat, Corn, Sugar | Weekly futures prices (2005–2023) from China’s agricultural futures market | VMD–SGMD–LSTM | Outperformed benchmark models in 1-step-, 2-step-, and 4-step-ahead forecasting scenarios Lowest for 1-step with MAE 11.13, MAPE 0.43 | Other price influencing factors could be considered |
| [36] | 2022 | Rice, Chicken Meat, Eggs, Onions, Garlic, Large Red Chilies, Curly Red Chilies, Red Chilies, Green Chilies, Cooking Oil, Sugar | Prices of 11 commodities (2017–2021) (Indonesian Ministry of Finance and Bank Indonesia) | LSTM | Standard LSTM outperformed Bi-LSTM, Conv LSTM, and Conv Bi-LSTM; Multivariate LSTM outperformed univariate Lowest MAE: 255.998 | Focused only on a specific set of food commodities |
| [37] | 2022 | Corn, Soybean, PVC, Egg, Rebar | Daily trading data from the CSI 300 index; futures prices of corn, soybean, polyvinyl chloride (PVC), egg, and rebar; Baidu and Google dual-platform search data (2016–2021) | GWO–CNN–LSTM | Significant improvement in price prediction accuracy. MAE 15.2499, RMSE 18.8905, MAPE 0.0079 | Focus on a limited set of commodities may not represent the entire futures market |
| [38] | 2024 | Soybean, Corn, Wheat | Monthly prices from China, regional market level (2014–2022) | LSTM | LSTM outperformed SVR and BP-NN; Corn: MAE 84.82, RMSE 102.32, MAPE 3.08% Wheat: MAE 222.66, MESE 269.26, MAPE 7.09% | Evaluation limited to a single region and fixed sliding window configuration |
| [39] | 2023 | Soybean Meal, Wheat | Soybean meal and wheat future prices CBOT (1980–2021) | PSO, CS | Improved forecast performance through combination methods; MAPE wheat (0.7144%) | Focused on specific commodities without broader market consideration |
| [40] | 2024 | Wheat, Corn, Soybean | Related agricultural products (10 features), Energy and metals (25 features), Economy (3 features), Wheat futures (4 features) | Bi-DSConvLSTM-Attention | RMSE = 5.61, MAE = 3.63, MAPE = 0.55, R2 = 0.9984 | Generalization was not addressed |
| [41] | 2022 | Corn | Corn daily average futures prices and spot prices (2011–2021), national average price data of corn, early rice, and middle-late rice; soybean futures price; Dalian Commodity Exchange and Zhengzhou Commodity Exchange | AttLSTM–ARIMA–BP | MAPE: 0.0043, MAE: 1.51, RMSE: 1.642 | Sensitivity to extreme price fluctuations caused by unforeseen economic factors |
| [42] | 2022 | Rice | Monthly Thai Rice FOB Price (1987–2017) | Hybrid with K-means Clustering, HANTS, and MLPNN | Hybrid model outperformed ARIMA, EMD–ARIMA, ANFIS, and persistence models; RMSE = 14.37, MAPE = 4.09% (yearly). | Limited focus on the impact of external factors on forecasting accuracy |
| [43] | 2024 | Corn | Weekly corn future prices (2019–2023). Corn-related opinions, news, policy analysis, and other textual information are collected from the “China Grain” website (2019–2023) | CEEMDAN–CNN–JADE–TFT | The model outperformed JADE-BPNN, JADE–GRU, JADE–RNN, and JADE–LSTM’ MAPE 0.67%, MAE 17.89, RMSE 26.37 | Single, narrow-focused media source |
| [44] | 2024 | Corn | Chinese corn futures data + causal variables (COFCO Technology stock prices, US and Chinese soybeans futures prices, US and Chinese corn futures prices, China-US exchange rate) (2005–2023) | SCINet, LSTM, GRU, TCN | SCINet outperformed baseline DL models (TCN, GRU, LSTM) for both single- and multi-step price forecasting. For one-step prediction combining Chinese soybean futures: MAE 15.791, MAPE 0.570, RMSE 21.181. Adding key influencing factors further improved performance. | Not delving deeply into nonmarket factors and other potential influencing market factors |
| [45] | 2024 | Onion, Potato, Rice, Wheat | 1.6 million news articles and daily prices (2006–2020) | REN | RMSE: 135.62 (rice), 55.96 (wheat); RMSE reduction: 13% (rice), 5% (wheat) | Relies on accurate event extraction for prediction reliability |
| [46] | 2021 | Corn | Daily corn cash prices and corn futures prices (2006–2011); GeoGrain | ANN (NAR) | RMSE reduced from 0.00057 to 0.00047 | Dependence on cubic spline interpolation for missing data approximation |
| [47] | 2022 | Coffee, Corn, Cotton, Oats, Soybean, Soybean Oil, Sugar, Wheat | Daily price for coffee, corn, cotton, oats, soybeans, soybean oil, sugar, and wheat, covering periods of 49, 63, 50, 52, 54, 62, 60, and 63 years, all up to 2021; Macrotrends | ANN (NAR) | The overall RRMSEs based on chosen settings for coffee, corn, cotton, oats, soybeans, soybean oil, sugar, and wheat are 2.47%, 1.84%, 1.71%, 2.08%, 1.70%, 1.81%, 3.19%, and 2.12%, respectively; they all outperformed the ARIMA benchmark model | The advantage of the neural network model over no-change models was small |
| [48] | 2024 | Hard Red Winter Wheat | Wheat futures price data and aerial imagery that shows cloud cover, sun elevation, and azimuth over the planted areas for wheat (1984–2023) | CNN, SVM, MLP | Average trained PNL: 2.1%, Average test PNL: 1.01%; the proposed model outperformed the SVM and MLP comparison models | The model’s performance may degrade as data become more accessible or the strategy becomes crowded |
| [49] | 2023 | Oat, Corn, Soybean, Wheat | 17 variables out of three categories: weather, macroeconomics and the prices of the four crops; USDA (SWE), NOAA (Weather), USDA (Snow Data) (1990–2021) | ARIMA, CNN, LSTM, LSTM–CNN | LSTM–CNN had the lowest MSE for Wheat for 5 weeks (0.0090), 10 weeks (0.0086), and 15 weeks (0.0088), but not for 20 weeks, outperforming ARIMA, CNN, and LSTM | Model performance deteriorated for 20-week predictions |
| [50] | 2024 | Corn | Corn price for US, South Africa (1931 onward), Malawi (1996 onward); corn yield for US, South Africa, and Malawi (1961–2022); corn mask data; remote sensing data (1982–2018); satellite-derived gross primary production | EOFs, AEs, VAEs, GLM, NN | Non-masked β-VAEs excelled in the US, non-masked AEs in South Africa and Malawi (BSS 0.68, MCC 0.9, AUC 0.93). | Regional variability in dimension-reduction strategy effectiveness limits universal applicability |
| [51] | 2024 | Corn | Corn-related: 12 different indicators, namely the previous closing price, previous settlement price, opening price, highest price, lowest price, closing price, settlement price, price change ratio 1, price change ratio 2, trading volume, trading value, and open interest (2013–2022); Dalian Commodity Exchange | Bezier Curve, LSTM, ARIMA, VMD–LSTM, SVR | Bezier curve-based LSTM model outperformed traditional LSTM, ARIMA, VMD-LSTM, and SVR models in predictive accuracy; MAPE 0.80%, RMSE 30.42, Dstat 0.606 | High computational complexity due to multiple indicators |
| [52] | 2021 | Corn, Palm Oil | Monthly price of Corn and Palm oil (1980–2020); World Bank Commodity Price Data | DLSTM, TDNN, ARIMA | DLSTM reduced RMSE, MAPE, and MAD by 72% compared to ARIMA and 47% compared to TDNN; for corn: RMSE 0.031, MAPE 7.337%, MAD 0.026 | Limited focus on model adaptability to other commodities or time frames. |
| [53] | 2024 | Corn | Daily corn futures prices (2000–2020), Barchart | LSTM, VAR, ARIMA | LSTMs outperform traditional models for longer horizon forecasts (7-day forecast horizon MAE 2.75) | LSTMs failed to capture seasonality and trends |
| [54] | 2023 | Wheat, Rice | Soil test reports, crop yield data, stock information | RANC algorithm, SVM, ANN, RNN, RBM | Crop recommendation accuracy exceeded 90%; price prediction component integrated into decision system | Specific accuracy for price forecasting not reported; challenges with real-time data integration |
| [55] | 2023 | Wheat, Millet, Sorghum, Corn, Rice | Historical price data (2005–2022) | Hybrid SARIMA–LSTM, SVR, XGBoost, ARIMA, LSTM, SARIMA | MAPE: Wheat 5.37, Corn 7.80, Rice 6.87 | High model complexity may hinder scalability |
| [56] | 2017 | Wheat, Corn, Soybean | Daily Wheat, Corn, Soybean futures prices. (2010–2016); Chicago Board of Trade | PSO–BPNN with Decomposition Methods | VMD–PSO–BPNN had the best accuracy; for wheat: MAPE = 0.55%, MAE = 2.68, RMSE = 3.41, for corn: MAPE = 0.57%, MAE = 2.12, RMSE = 2.82 | Focus only on one-step-ahead forecasting |
| [57] | 2023 | Wheat | Wheat price, freight volume, turnover, express delivery, consumer price index, money supply, and other related factors (2012–2021); Bureau of Statistics of China | BP–LSTM, LSTM, BP | BP–LSTM model outperformed others (MSE = 0.00026); captured complex price dynamics using external factors like freight volume, CPI, etc. | Limited dataset (10 years); the theoretical depth of DL approach is still under development |
| [23] | 2024 | Wheat | Global wheat prices, macroeconomic indicators | ARIMA, SARIMA, ARIMAX, SARIMAX, LSTM, CNN, Regression | ARIMAX and SARIMA performed best; LSTM and CNN overfit training data | Limited generalizability of DL models; high error in testing phase |
| [58] | 2024 | Corn | Corn prices and statistical variables, Weibo text data. (2007–2021) | ChineseBERT, Text CNN, Ensemble Empirical Mode Decomposition, SHapley Additive exPlanations, INBEATSx, XGBoost, LSTM | Strong predictive ability for 30-day horizon (MAPE 2.72, MAE 63.66) and 60-day horizon (MAPE of 3.42 and MAE of 78.80), outperforming comparative models | No comparison experiments with other model decomposition methods have been conducted |
| Refs. | Year | Commodity Name | Dataset | Technique | Findings | Limitation |
|---|---|---|---|---|---|---|
| [59] | 1996 | Live Cattle, Wheat | Monthly prices (1950–1990) | ARIMA, FFNN | Neural networks achieved 27% and 56% lower MSE compared to ARIMA; MSE 0.087, AME 0.154, MAPE 4.235 | Requires careful hyperparameter tuning |
| [60] | 2016 | Corn | Monthly prices of corn in Rajasthan markets (2002–2013) | ARIMA, ANN, ESM | ARIMA (1,1,1) achieved lowest AIC (1677.17), SBC (1685.86), MAD (71.04), MSE (11,477.78), and MAPE (5.64), outperforming other models | Limited adaptability to sudden market fluctuations |
| [61] | 2018 | Rice, Wheat, Corn | Monthly prices from January 1990 to September 2015 | ARIMA, ANN, SVR, MARS, ARIMA–ANN, ARIMA–SVR, ARIMA–MARS | MAE, RMSE, MAPE: Rice: 10.365%/12.037%/2.650% Wheat: 9.779%/11.371%/4.347% Corn: 6.495%/9.102%/3.785% | Relies on the accuracy of autoregressive variable selection for effective predictions |
| [62] | 2007 | Wheat | Wheat monthly spot price (1996–2005) | ARIMA, ANN, Combined model | In error metrics, the combined model had the lowest MAE 7.662, MSE 143.045, and MAPE 0.545%. In MMRR (mean monthly return rate) and Dstat, ANN has the highest: 0.9627/91.667. | Conflicting results under different evaluation criteria |
| [22] | 2024 | Rice | Weekly rice prices and precipitation weather data (2017–2022) from seven cities in Java | ARIMAX–GARCH, SVR | SVR outperformed in most cities and for premium quality; ARIMAX–GARCH stable for mid/low rice. Average MAPE 3.04%, average RMSE 335.01, average MAE 291.19 | Weather-only exogenous variable; city-specific results; moderate generalizability |
| [23] | 2024 | Wheat | Global prices of wheat, barley, olive oil, palm oil, sunflower oil, rice, and sugar; 134 monthly macroeconomic time- series data, including those that are related to output and income, labor market, consumption and orders, orders and inventories, money and credit, interest rates and exchange rates, prices, and stock market (1990–2024) | ARIMA, SARIMA, ARIMAX, SARIMAX, LSTM, CNN, LR | The linear regression model outperformed all others in testing; MAE 32.23 and RMSE 38.97 | Did not take environmental variables into account |
| [63] | 2022 | Corn, Crude Oil, Gold | Daily spot market prices of Corn, Crude Oil, and Gold (2016–2021); Bloomberg commodities index | EMD–BPNN, EMD–ARIMA, VMD–BPNN, VMD–ARIMA, BPNN, ARIMA | VMD–ARIMA model for corn achieved MAE = 0.3566, RMSE = 0.5886, MAPE = 0.0954 | EMD did not improve the predictive ability of the BPNN model |
| [64] | 2022 | Wheat | Wheat daily US prices (2009–2018), weather details | ARIMA, SARIMA, BPN, LSTM | ARIMA and SARIMA performed well for short-term predictions (Daily MSE 0.0003), BPN outperformed them in weekly and monthly MSE (0.0005, 0.0004) | ARIMA and SARIMA models were less effective for long-term price forecasting |
| [65] | 2023 | Yellow Corn | Weekly wholesale price index of yellow corn in China (2010–2020) | Nonlinear Auto-Regressive Neural Network, RW, AR–GARCH, SVR, RT, LSTM | RMSE: 1.05% (training), 1.08% (validation), 1.03% (testing) | Lack of combination (hybrid/ensemble) models for comparison |
| [24] | 2021 | Wheat | Daily wheat futures prices, Gram futures prices, real rate of interest, futures prices of wheat in the US, other related economic variables. NCDEX (2009–2014) | ARMA (1,1), ARMA (1,2), Economic Variable Model, ANN, RW | Random walk model outperformed all (RMSE 0.6948, MAE 0.4627) | Compared neural network not fine-tuned |
| [66] | 2011 | Crude Oil, Corn, Wheat | Crude oil futures, Corn and Wheat futures (1998–2009); CBOT | Stochastic volatility models, Bayesian Markov chain Monte Carlo | Evidence of volatility spillover post-2006 from oil to corn and wheat; speculation and scalping increase volatility | Focused on volatility transmission rather than direct price prediction (which is only a limitation regarding the scope of this SLR) |
| [67] | 2021 | Wheat, Soybean, Corn | Monthly data from January 1980 to December 2016 | AR, VAR, VEC, ARCH, GARCH | Predictive models revealed systematic information from market fundamentals, macroeconomic developments, and financial factors. VEC and s-VAR models performed best; REER was most predictive; macroeconomic variables improved long-term commodity price forecasts. | Complexity in model specification and implementation |
| Refs. | Year | Commodity | Model Type | Technique | Evaluation Metric | Performance |
|---|---|---|---|---|---|---|
| [68] | 2021 | Rice, Corn, Soybean | ML | SVM | RRMSE | 7.45 (avg) |
| [21] | 2016 | Corn | ML | BPNN | MAPE | 1.31% (in), 2.26% (out) |
| [27] | 2023 | Rice | EL | Random Forest | MAPE | 0.0093573 |
| [29] | 2024 | Corn | EL | Bagging SVR | R2/MAE/RMSE | 0.961/0.234/0.315 |
| [30] | 2022 | Rice | EL | Random Forest | R2 | 0.864 |
| [31] | 2021 | CORN | EL | ML–KNN | MAE/RMSE/MAPE | 0.0372/0.0512/0.6908 |
| [34] | 2023 | Corn, Palm Oil, Soybean Oil | DL Hybrid | VMD–TDNN | MAPE/RMSE/DSTAT | 0.0345/9.49/90.90 |
| [37] | 2022 | Corn, Soybean, PVC, Egg, Rebar | DL Hybrid | GWO–CNN–LSTM | MAE/RMSE/MAPE | 15.2499/18.8905/0.0079 |
| [38] | 2024 | Soybean, Corn, Wheat | DL | LSTM | MAE/RMSE/MAPE | Corn: 84.82/102.32/3.08% Weat: 222.66/269.26/7.09% |
| [39] | 2023 | Soybean Meal, Wheat | DL Hybrid | Full-PSO–CS | MAPE | 0.7144% |
| [40] | 2024 | Wheat, Corn, Soybean | DL | Bi-DSConvLSTM–Attention | RMSE/MAE/MAPE/R2 | 5.61/3.63/0.55/0.9984 |
| [41] | 2022 | Corn | DL + TS | AttLSTM–ARIMA–BP | MAPE/MAE/RMSE | 0.0043/1.51/1.642 |
| [42] | 2022 | Rice | DL Hybrid | K-means + MLPNN | RMSE/MAPE | 14.37/4.09% |
| [43] | 2024 | Corn | DL Hybrid | CEEMDAN–CNN–JADE–TFT | MAPE/MAE/RMSE | 0.67%/17.89/26.37 |
| [44] | 2024 | Corn | DL Hybrid | SCINet | MAE/MAPE/RMSE | 15.791/0.570/21.181 |
| [45] | 2024 | Onion, Potato, Rice, Wheat | DL Hybrid | REN | RMSE | Onion: 155.56, Potato: 86.08, Rice: 135.62, Wheat: 55.96 |
| [46] | 2021 | Corn | DL | ANN (NAR) | RMSE | 0.00047 |
| [47] | 2022 | Coffee, Corn, Cotton, Oats, Soybean, Soybean Oil, Sugar, Wheat | DL | ANN (NAR) | RMSE | Coffee: 2.47%, Corn: 1.84%, Cotton: 1.71%, Oats: 2.08%, Soybean: 1.70%, Soybean Oil: 1.81%, Sugar: 3.19%, Wheat: 2.12% |
| [48] | 2024 | Hard Red Winter Wheat | DL Hybrid | CNN | PNL | 1.01% |
| [49] | 2023 | Oat, Corn, Soybean, Wheat | DL Hybrid | LSTM–CNN | MSE | Wheat for 5 weeks: 0.0090, 10 weeks: 0.0086, 15 weeks: 0.0088 |
| [50] | 2024 | Corn | DL Hybrid | AEs, VAEs | BSS/MCC/AUC | Malawi 0.68/0.9/0.93 |
| [51] | 2024 | Corn | DL Hybrid | Bezier LSTM | RMSE/MAPE | 30.42/0.80% |
| [52] | 2021 | Corn, Palm Oil | DL | DLSTM | RMSE/MAPE/MAD | For Corn: 0.031/7.337%/0.026 |
| [53] | 2024 | Corn | DL Hybrid | LSTM–RNN | MAE | (Seven-day forecast horizon) 2.75 |
| [55] | 2023 | Wheat, Millet, Sorghum, Corn, Rice | DL + TS | SARIMA–LSTM | MAPE | Wheat 5.37, Corn 7.80, Rice 6.87 |
| [56] | 2017 | Wheat, Corn, Soybean | DL Hybrid | VMD–PSO–BPNN | MAPE/MAE/RMSE | Wheat 0.55%/2.68/3.41 Corn 0.57%/2.12/2.82 |
| [57] | 2023 | Wheat | DL | BP–LSTM | MSE | 0.00026 |
| [59] | 1996 | Live Cattle, Wheat | ML, TS | ARIMA, FFNN | MSE/AME/MAPE | Wheat: 0.087/0.154/4.235 |
| [60] | 2016 | Corn | TS, ML | ARIMA (1,1,1) | AIC/SBC/MAD/MSE/MAPE | 1677.17/1685.86/71.04/11,477.78/5.64 |
| [61] | 2018 | Rice, Wheat, Corn | TS, ML | ARIMA–ANN ARIMA–SVR ARIMA–MARS | MAE/RMSE/MAPE | Rice: 10.365%/12.037%/2.650% Wheat: 9.779%/11.371%/4.347% Corn: 6.495%/9.102%/3.785% |
| [62] | 2007 | Wheat | TS, ML | ARIMA, ANN, Combined mod-el | MAE/MSE/MAPE/MMRR/Dstat | Combined model had the lowest MAE (7.662), MSE (143.045), MAPE (0.545%); in MMRR and Dstat, ANN had the highest: 0.9627/91.667 |
| [22] | 2024 | Rice | TS, ML | ARIMAX–GARCH, SVR | Average MAPE/average RMSE/average MAE | 3.04%/335.01/291.19 |
| [23] | 2024 | Wheat | TS/DL | ARIMAX, SARIMA, LSTM, CNN, LR | MAE/RMSE | 32.23/38.97 |
| [63] | 2022 | Corn, Crude Oil, Gold | DL + TS | VMD-ARIMA | MAE/RMSE/MAPE | 0.3566/0.5886/0.0954 |
| [64] | 2022 | Wheat | DL + TS | ARIMA, SARIMA, BPN, LSTM | MSE | ARIMA, SARIMA daily MSE: 0.0003; BPN weekly and monthly MSE: 0.0005, 0.0004 |
| [58] | 2024 | Corn | DL Hybrid | INBEATSx, XGBoost, LSTM | MAPE/MAE | 30-day horizon (MAPE of 2.72, MAE of 63.66) and 60-day horizon (MAPE of 3.42 and MAE of 78.80), |
| [65] | 2023 | Corn | DL, TS | Nonlinear Auto-Regressive Neural Network, RW, AR–GARCH, SVR, RT, LSTM | RMSE | 1.05% (training), 1.08% (validation), 1.03% (testing) |
| [24] | 2021 | Wheat | TS, ML | ARMA, ANN, RW | RMSE/MAE | 0.6948/0.4627 |
| [67] | 2021 | Wheat, Soybean, Corn | TS | VEC, s-VAR | MAE/MSE | 7.331/128.674 |
Disclaimer/Publisher’s Note: The statements, opinions and data contained in all publications are solely those of the individual author(s) and contributor(s) and not of MDPI and/or the editor(s). MDPI and/or the editor(s) disclaim responsibility for any injury to people or property resulting from any ideas, methods, instructions or products referred to in the content. |
© 2025 by the authors. Licensee MDPI, Basel, Switzerland. This article is an open access article distributed under the terms and conditions of the Creative Commons Attribution (CC BY) license (https://creativecommons.org/licenses/by/4.0/).
Share and Cite
Theofilou, A.; Nastis, S.A.; Michailidis, A.; Bournaris, T.; Mattas, K. Predicting Prices of Staple Crops Using Machine Learning: A Systematic Review of Studies on Wheat, Corn, and Rice. Sustainability 2025, 17, 5456. https://doi.org/10.3390/su17125456
Theofilou A, Nastis SA, Michailidis A, Bournaris T, Mattas K. Predicting Prices of Staple Crops Using Machine Learning: A Systematic Review of Studies on Wheat, Corn, and Rice. Sustainability. 2025; 17(12):5456. https://doi.org/10.3390/su17125456
Chicago/Turabian StyleTheofilou, Asterios, Stefanos A. Nastis, Anastasios Michailidis, Thomas Bournaris, and Konstadinos Mattas. 2025. "Predicting Prices of Staple Crops Using Machine Learning: A Systematic Review of Studies on Wheat, Corn, and Rice" Sustainability 17, no. 12: 5456. https://doi.org/10.3390/su17125456
APA StyleTheofilou, A., Nastis, S. A., Michailidis, A., Bournaris, T., & Mattas, K. (2025). Predicting Prices of Staple Crops Using Machine Learning: A Systematic Review of Studies on Wheat, Corn, and Rice. Sustainability, 17(12), 5456. https://doi.org/10.3390/su17125456